


To mitigate global climate change and achieve the targets of the Nationally Determined Contributions (NDCs), the Chinese government implemented a carbon emission trading scheme (ETS) pilot policy in batches. However, there has been no unified consensus at present on whether the ETS pilot policy has stimulated green technological innovation. By applying a multi-period propensity score matching and difference-in-differences method, as well as using panel data from 2007–2019 of A-share listed Chinese firms, this study constructed a quasi-natural experiment to examine the causal effects of China's ETS pilot policy on the green technological innovation of the firms. The results were validated after a series of robustness checks and showed that the ETS has significantly encouraged green technological innovation in industrial enterprises. This positive effect is greater for firms with large capital scales, with better corporate governance, especially for those in the mining and manufacturing industry. Further analysis indicated that corporate social responsibility and operating income were the driving factors of the effects on innovation, whereas R&D expenditures have inhibited the effects.
With the increasingly severe effects of global climate change caused by greenhouse gas emissions from human activities, the participating countries of the COP26 Summit in Glasgow updated their plans of the nationally determined contributions proposed in the Paris Agreement and agreed to keep the temperature rise to 1.5 °C (United Nations, 2021). As the largest greenhouse gas emitter worldwide (Tang et al., 2017), China promulgated a carbon emission trading scheme (ETS), i.e., a vital market-based tool for achieving the goals of carbon peaking and neutrality in China, to reduce overall carbon emissions by restricting discharges of pollutants by regulated enterprises. Crucially, advanced green technologies are the driving force to reduce corporate carbon emissions, improve enterprise competition and sustain low-carbon development (Li et al., 2021; Saunila et al., 2018). Green technological innovation matters considerably in improving the intermediate production process and transforming the pattern of economic development (Cai et al., 2020). Meanwhile, the key to incorporating green technologies into realistic production and emission policies lies with enterprises. Industrial enterprises choosing meet the environmental compliance requirements by carrying out innovative activities, paying fines, or even terminating operations can have direct and crucial effects on the sustainability of a low-carbon economy (Chien, 2022).
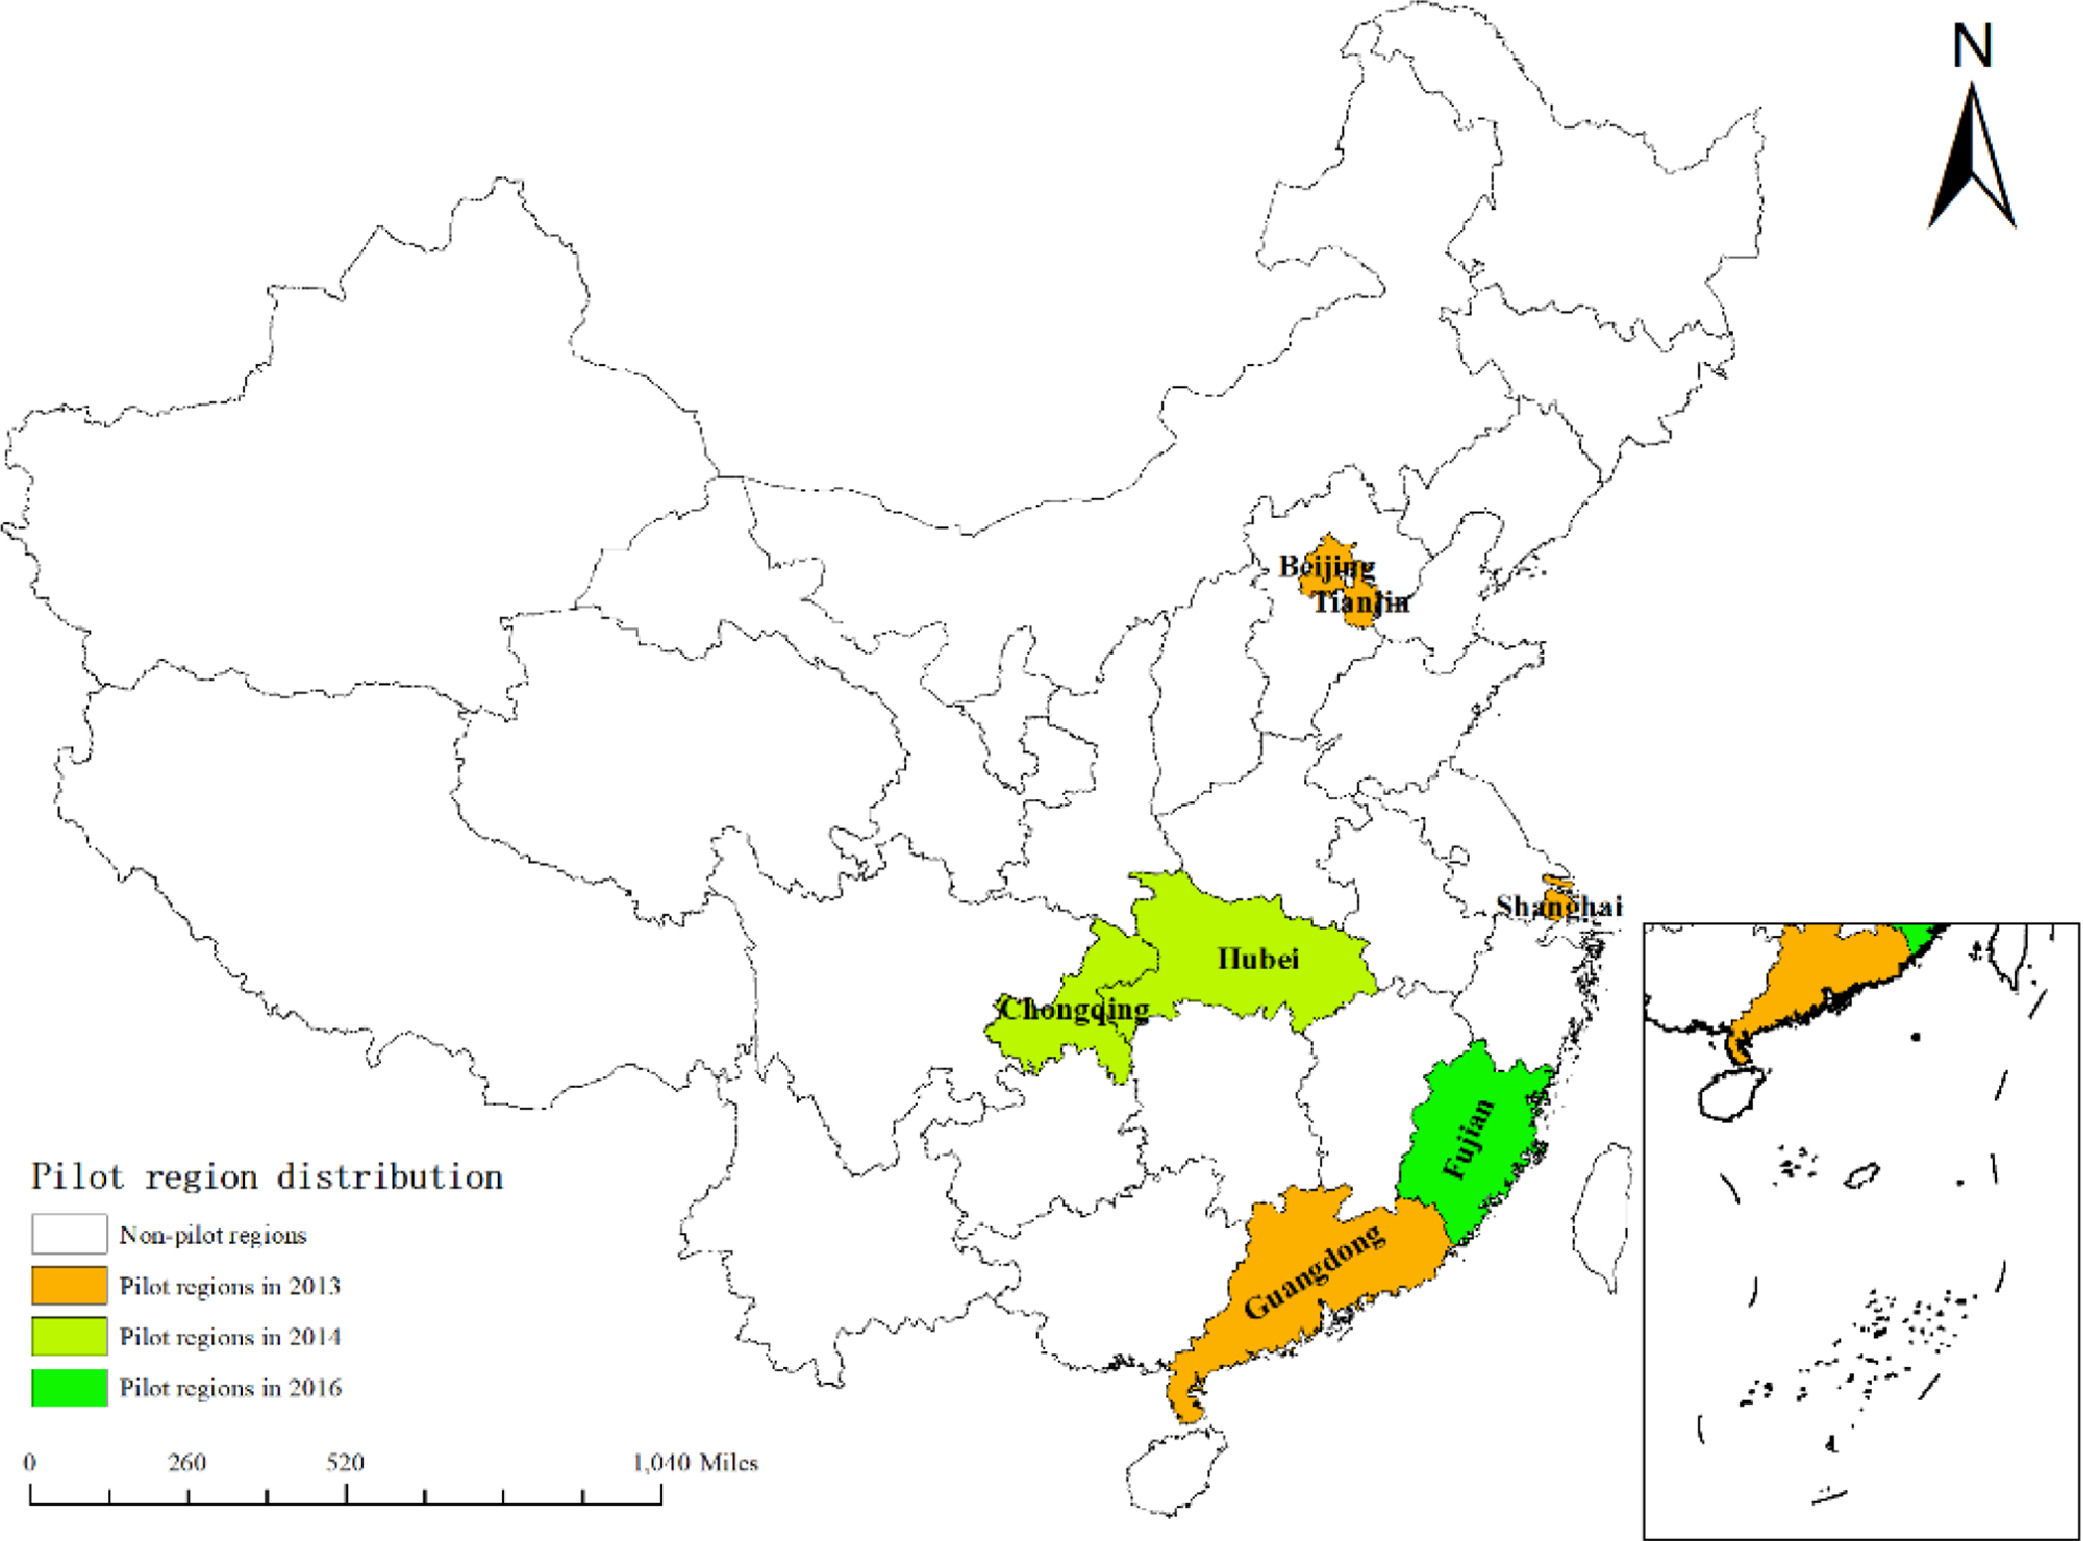
Cap-and-trade systems have proved to be economical and efficient means of reducing emissions (Peng et al., 2021). More than 20 ETS programs are in operation around the world, covering almost 15% of current global carbon emissions (Zhu et al., 2019). Following the footsteps of some developed countries, pilot programs were launched by the National Development and Reform Commission of China (NDRC) in October 2011 for carbon emission trading in five municipalities and two provinces.1 Shenzhen took the first lead, followed by Beijing, Shanghai, Tianjin, and Guangdong at the end of 2013. In western China, Hubei and Chongqing implemented their pilot policies in mid-2014. Then, in 2016, Fujian took part in the ETS pilot as well. These eight pilot regions largely enjoyed either a high economic output or a high level of industrialization (Zhou et al., 2019). In 2017, the national carbon market was established by the promulgation of the National Carbon Emission Trading Market Construction Plan (Power Generation Industry) by the NDRC.2 After considerable preparatory work, the ETS market in China overtook the ETS scale of the European Union as the largest carbon market in the world (ICAP, 2018). Fig. 1 shows the geographic distributions of the eight pilot regions.

After the implementation of China's ETS policy, many scholars have been exploring the effects of the policy from various dimensions. For the environmental effects, Hu et al. (2020a), Wang et al. (2021a) and Xuan et al. (2020) all highlighted the efficiency of China's ETS policy in reducing carbon emissions. For the economic and social effects, Wang et al. (2016), An et al. (2021), Yu and Li (2021) and Qi et al. (2021) estimated the potential gains and loss of ETS as well as the spatial spillover effects of environmental policies on the labor demand of enterprises, also the low-carbon international competitiveness of domestic industries. However, the effects of China's ETS policy on innovation have been rarely reported. According to the induced innovation theory, environmental regulations changed the relative price of pollution and carbon emissions as production factors, thus inducing pollution-abatement and low-carbon innovations (Lian et al., 2022). Admittedly, some academic attempts have been made to reflect the driving effect of ETS policy on emission reduction by using the level of technological innovation as a mediating variable (Xuan et al., 2020). However, not much attention has been paid to the active behavior of enterprises on green innovation in response to the ETS policy. In fact, promoting green technological innovation is one of the primary goals of an ETS pilot policy (Gao & Wang, 2021). Based on the panel data of A-share listed firms from 2007 to 2019, the total effects of ETS policy on corporate green innovations were hereby explored, and efforts were made to find out the potential mechanisms that enterprises might react to the policy.
The carbon trading market with the mission of guiding low-carbon economic and sustainable development is an important part for the achievement of carbon neutrality. Therefore, the ETS policy is required to realize not only the environmental effects of low-carbon development, but also, more importantly, the innovative effects of increasing the level of green technology and enhancing the competitiveness of enterprises. The ETS policy does not aim to create difficulties for companies by compelling them to reduce production or to pay carbon taxes for exceeding their allotted emission quotas, but to encourage enterprises to innovate in green technology and achieve low-carbon development (Chen & Lin, 2021). As a result, green technological innovation can be such an indispensable factor reflecting the ETS policy effect that it should be necessarily discussed. The green innovation behavior of an enterprise reflects its independent innovation ability and the ability to actively undertake social responsibility. Herein, based on retrospective panel data of industrial enterprises covered by eight pilot policies, investigations were made to answer questions including the effects of an ETS pilot policy on green technological innovation, the differences in its effects on different enterprises as well as the way that enterprises respond to market-based regulations to engage in green technological innovation.
The main contributions of this paper are as follows. First, based on economic principles and a series of assumptions, formulas were used to deduce the potential effects of ETS policies on green innovation. Moreover, the enlightenment brought by the formula derivation process was added to the interpretation of basic empirical results. Overall, a theoretical contribution was made to the literatures on the relationship between environmental regulation and green innovation. Second, from the perspective of micro-level firm, the green innovation effects of different enterprises under the ETS policy were discussed by selecting industrial enterprises in five sectors, attempting to find the commonality and individuality of their changes in green technology innovation level due to the ETS policy. As a result, this paper provided practical policy suggestions for government authorities to make the top-down policy, carry out the bottom-up emission quota declaration and initiate emission reduction path design for enterprises. Third, the heterogeneous effects and potential influencing mechanism of ETS policy on green technology innovation were further explored. Capital scale, ownership and industry category were selected as the criteria to distinguish heterogeneous enterprises, so as to analyze the response strategies of different types of industrial enterprises to ETS policies in terms of green technology innovation, and appropriate suggestions were put forward. In addition, enterprise R&D expenditure, CSR and operating income were taken as intermediary variables to explore the potential influencing path.
The remainder of this paper is organized as follows. The literature review section briefly reviews the related literature; The theoretical analysis and research hypotheses section explains the theoretical analysis framework, and puts forward the corresponding research hypotheses; The methodology and data section introduces the empirical models, variable settings, the data sources and processing, and descriptive statistics; The empirical results and discussion section discusses baseline regressions and related robustness checks, as well as the heterogeneity analysis and influencing mechanism analysis; The conclusions and policy discussion section presents the conclusions and policy implications; Finally, limitations and future directions are given in the last section.
2Literature reviewThe relationship between environmental regulation and technological innovation has long been debated in academic research since the 1990s. Traditional neoclassical economic theory proposes the compliance cost hypothesis, which proffers that environmental regulations imposed economic penalties on enterprises for violating regulations, thus disrupting their decision-making and productive capabilities (Jaffe & Stavins, 1995). This crowding-out effect on capital is not conducive to enterprises that seek to enhance their competitiveness, R&D investments, or technological innovation. To demonstrate this point of view, a few researchers have supposed that ETS policies had inhibitory effects on enterprise innovation (Chen et al., 2021; Shi et al., 2018). They propose that going bankrupt or relocating was an option that outweighed the gains for energy-intensive enterprises under the constraints of carbon quotas, leading to a migration effect (Chen et al., 2021). Another explanation states that the treated plants reduce their coal consumption while government regulations, rather than optimizing their behaviors (Cao et al., 2021). Moreover, Zhao et al. (2022) also found that the ETS pilot generated green innovation reduction effects on entire industries or all manufacturing.
On the contrary, evolved from Hicks' theory of inducing innovation, Michael Porter has argued that reasonable and strict environmental regulations could stimulate innovation, improve production technology, and create output advantages. The Porter Hypothesis states that these positive effects could offset the costs imposed by environmental regulations and improve the profitability of enterprises (Porter & Linde, 1995). This “innovation compensation effect” helps to eliminate backward production capacity and stimulate corporate technological innovation, thus enhancing the competitiveness of surviving firms. Some studies have found evidence for the innovation compensation effects of market-based environmental regulations (Noelia et al., 2022; Wei et al., 2022). According to provincial panel data, China's ETS policy has significantly motivated low-carbon technological innovation mediated by industrial structure upgrading (Chen & Lin, 2021; Liu & Sun, 2021). From a city-level perspective, Li et al. (2022a) have found that China's ETS pilots have a positive impact on urban green innovation, and that impact is more significant for municipalities than for prefecture-level cities. Specifically, the ETS can promote 6.1% of the ratio of clean energy consumption and 4.6% of the rate of green technologies (Dong et al., 2020). Using firm-level panel data, the ETS policy has encouraged green technological innovation by 5%–10% without crowding out other technological innovations (Zhu et al., 2019). Moreover, strict environmental regulations exert a strong and significant incentive effect on green technology innovations in heavily polluting industries (Cai et al., 2020). For the power industry, the ETS pilot policy has improved the power generation technology structure at the national level (Xie et al., 2022). For the steel industry, the carbon ETS policy significantly improves the total factor pollution control efficiency, generating the green development effect (He et al., 2023).
These two mixed views both have their validity and rationality as the effect of ETS policies varies in different regions, with different regulatory intensities, and at different stages of the carbon market. However, scholars have yet to reach a definitive conclusion regarding the impact of China's ETS policy on green technological innovation. This paper examines the basic effects of ETS policy on corporate green innovations and answers whether the weak Porter hypothesis has been realized. In recent years, some studies have gradually begun to focus on the heterogeneity of green innovation level stimulated by the ETS policy from the regional level (Hu et al., 2020b; Zhao et al. 2023) and the heterogeneous designs of policy mechanisms (Yao et al., 2021; Qi et al., 2021). However, the characteristics of enterprises will also determine the strategic choice of enterprises when facing environmental regulations. But there are few studies on the heterogeneous response of green technology innovation to ETS policies from the perspective of different enterprises. In addition, there is still a lack of exploration on influencing mechanisms of the effects of ETS policies on green technological innovation from the level of industrial enterprises, which is conducive to guiding the adjustment of the ETS policy.
In the literature on policy evaluation, the mainstream methods include the computable general equilibrium (CGE) model (Li & Jia, 2016), the synthetic control method (SCM) (Wang et al., 2020), and the difference-in-differences (DID) model (Li et al., 2022b; Zhou et al., 2019). Compared with the CGE model, the SCM and DID models are more suitable for ex-post evaluations and alleviate endogenous problems of economic activities. Although SCM can avoid sample selection bias, it lacks the flexibility to further explore influencing mechanisms. Following Song et al. (2021), we used multi-period PSM-DID to evaluate the ETS pilot policy as a quasi-natural experiment. On the one hand, this model controlled unobservable, time-varying factors other than policy intervention by the double differences between the treatment group and control group before and after the policy (Wang et al., 2021b). On the other hand, the pilots are not random but related to the characteristics of the firm itself (Zhu et al., 2019), so DID method itself cannot satisfy the framework of a counterfactual inference model (Wang et al., 2019). The PSM-DID method can effectively solve the endogenous problem of omitted variables and the sample selection bias of the ETS policy.
3Theoretical analysis and research hypotheses3.1Emission trading schemes and green technological innovationFollowing the analytical framework of Levinson and Taylor (2008), we assumed that industrial carbon emissions were produced mainly from energy combustion. To analyze the effects of environmental regulation on technological innovation, we presumed that the technological inputs to enterprises could improve the conversion rate of energy to production.
Suppose there is a high-pollution industry sector X in the region (Shen et al., 2017), which uses the amount of energy E to make a unit of product x and emits undesirable output e. The price of the product is assumed as p, which is given exogenously. We use pollution tax per unit τ to measure the severity of environmental regulation. The pollution tax is also given exogenously. Sector X uses the quantities of capital K and labor L for production and the price of consuming one unit production factor (K,L) is c1. Moreover, the energy consumption cost is considered separately, as energy consumption is excluded in K or L. The energy cost per unit is c2. Assuming that the production process meets constant returns to scale, the production technology of sector X is:

Assuming that all enterprises in sector X use non-clean energy for production before the implementation of the environmental regulation, E is completely proportional to the desirable output x and one unit of energy consumption produces k units of undesirable output e. Then, we have:


As local governments strengthen their environmental regulations, some enterprises in sector X choose to invest factors (excluding energy) with the ratio of θ, which represents the level of green technological innovation due to research and development (R&D). This investment improves the energy efficiency and reduces the carbon emissions resulting from producing one unit of x, which can be expressed thus:

Technological R&D usually leads to two types of effects. Effect 1: The energy consumption per unit product decreases. The amount of energy consumed by one unit product x is expressed in Eq. (5).
where ϕ(θ) is the effect of improved energy efficiency due to technological innovation and ∂ϕ/∂θ<0, ϕ(1)=0, ϕ(0)=1. We express the functional form of the technological effects on innovation ϕ(θ) as:

A greater θ indicates higher energy efficiency of the industry. Moreover, σrepresents the carbon intensity of the industry. When θ is constant, industries with higher energy intensity consume more energy. Thus, Eq. (5) can be expressed as:

Effect 2: The carbon emissions released by one unit of energy combustion are reduced. The conversion rate of carbon is k when there is no technological innovation. However, after investments in green technological innovation, k(θ)=(1−θ)k, which is the monotonic subtractive function of θ. Then, the amount of carbon emissions is:

After the government has implemented environmental regulations, enterprises may choose to minimize their costs by adjusting their investments in technological innovation and maximize their benefits by adjusting the size of θ. Thus, the revenue function is as follows:

According to the first-order condition of profit maximization:

Then, we can express the influence of environmental regulation intensity τ on the R&D proportion θ:

Summarizing the above formulas, we can state: When faced with environmental regulations, enterprises will invest more essential productive factors in technological innovation to maximize their profits. Thus, we propose our Hypothesis 1.
- •
H1: China's ETS pilot policy has a significantly positive effect on the green technological innovation of industrial enterprises.
In the knowledge production function, R&D investment is regarded as the capital resource input while innovation is regarded as the output (Zhang & Jin, 2021). The stream of R&D expenditures accumulates current and prior additions to knowledge stock according to the Griliches framework, which provides the necessary financial support for innovation (Verba, 2022). Thus, R&D expenditure plays a vital role in innovation, which can develop new services or products or improve existing ones through innovative activities (Ding, 2022). Meanwhile, the ETS pilot policy is regarded as rewarding energy-efficient enterprises but penalizing inefficient ones. Countries at different stages of development have different driving forces or formation paths for innovation systems (Watkins et al., 2015). Literature shows that new techniques can be stimulated if carbon prices are high enough at the beginning, before being gradually increased (Strefler et al., 2021). Moreover, the ETS policies will spur significant technological innovation until the carbon price rises to 50–60 yuan/ton (Wei et al., 2022). In contrast, when the carbon price signals are not strong enough, cash flows and expected profits would decline for enterprises that comply, thereby resulting in fewer funds for R&D expenditures (Pavel & Dinorah, 2022). Hence, we propose Hypothesis 2.
- •
H2: Other conditions being equal, R&D expenditures play an intermediary role in the effects of the ETS policy on green technological innovation.
Through the cap-and-trade scheme of the quota allocation, the ETS policies set enterprises with clean production as benchmarks and make other enterprises consciously undertake the social responsibility of carbon neutrality. In the long run, investors will be keen to be involved in the carbon trading system and require enterprises to reduce their emissions as much as possible in return for selling excess carbon allowances (Sun et al., 2022). In this way, the loss of purchasing additional carbon quotas can be avoided, and the income from selling excess carbon quotas can be invested into the enterprise's green technological innovation to achieve sustainable development. Meanwhile, many scholars believe that CSR is highly correlated with corporate innovation. On the one hand, CSR plays a crucial role in identifying unmet needs and developing solutions that create new markets, which drives innovative activities to turn these new ideas into products or services that meet market expectations (Inmaculada & Inmaculada, 2013). On the other hand, through the penetration of corporate culture, CSR strengthens employees' sense of empathy and belonging to the enterprise and encourages them to carry out green innovation (Abagail & Donald, 2000). Firms with more ESG activities tend to generate more green patents, whereas the lack of CSR may hinder the improvement of environmental efficiency (Amore & Bennedsen, 2016). This finding further sheds light on the debate about “doing well by doing good” and is consistent with the finding that firms’ engagement in ESG improves their levels of innovation capacity (Broadstock et al., 2020). Thus, we propose Hypothesis 3.
- •
H3: Other conditions being equal, corporate social responsibility plays an intermediary role in the effects of the ETS policy on green technological innovation.
Conventional opinions hold that environmental regulations divert funds that would have been used for production (Wang et al., 2022). On the one hand, high-emission production lines will be used less or shut down to avoid additional compliance costs, resulting in reduced production and shrunken profits. On the other hand, energy-intensive enterprises would purchase carbon quotas from the carbon market to make up for the gap (Xie et al., 2022). Therefore, companies have to scale down their production and compensate for their compliance costs, which would lead enterprises to squeeze operating incomes and ignore technological innovation (Cao et al., 2022). However, the EU ETS policy has proved that the trading profits of participating firms are positively correlated with their emission abatements in both Phase I and II of the EU ETS policy implementation (Guo et al., 2020). Therefore, the stronger the emission mitigation capability of a firm, the higher would be its trading profits. Hence, we propose Hypothesis 4.
- •
H4: Other conditions being equal, corporate operating incomes play an intermediary role in the effects of the ETS policy on green technological innovation.
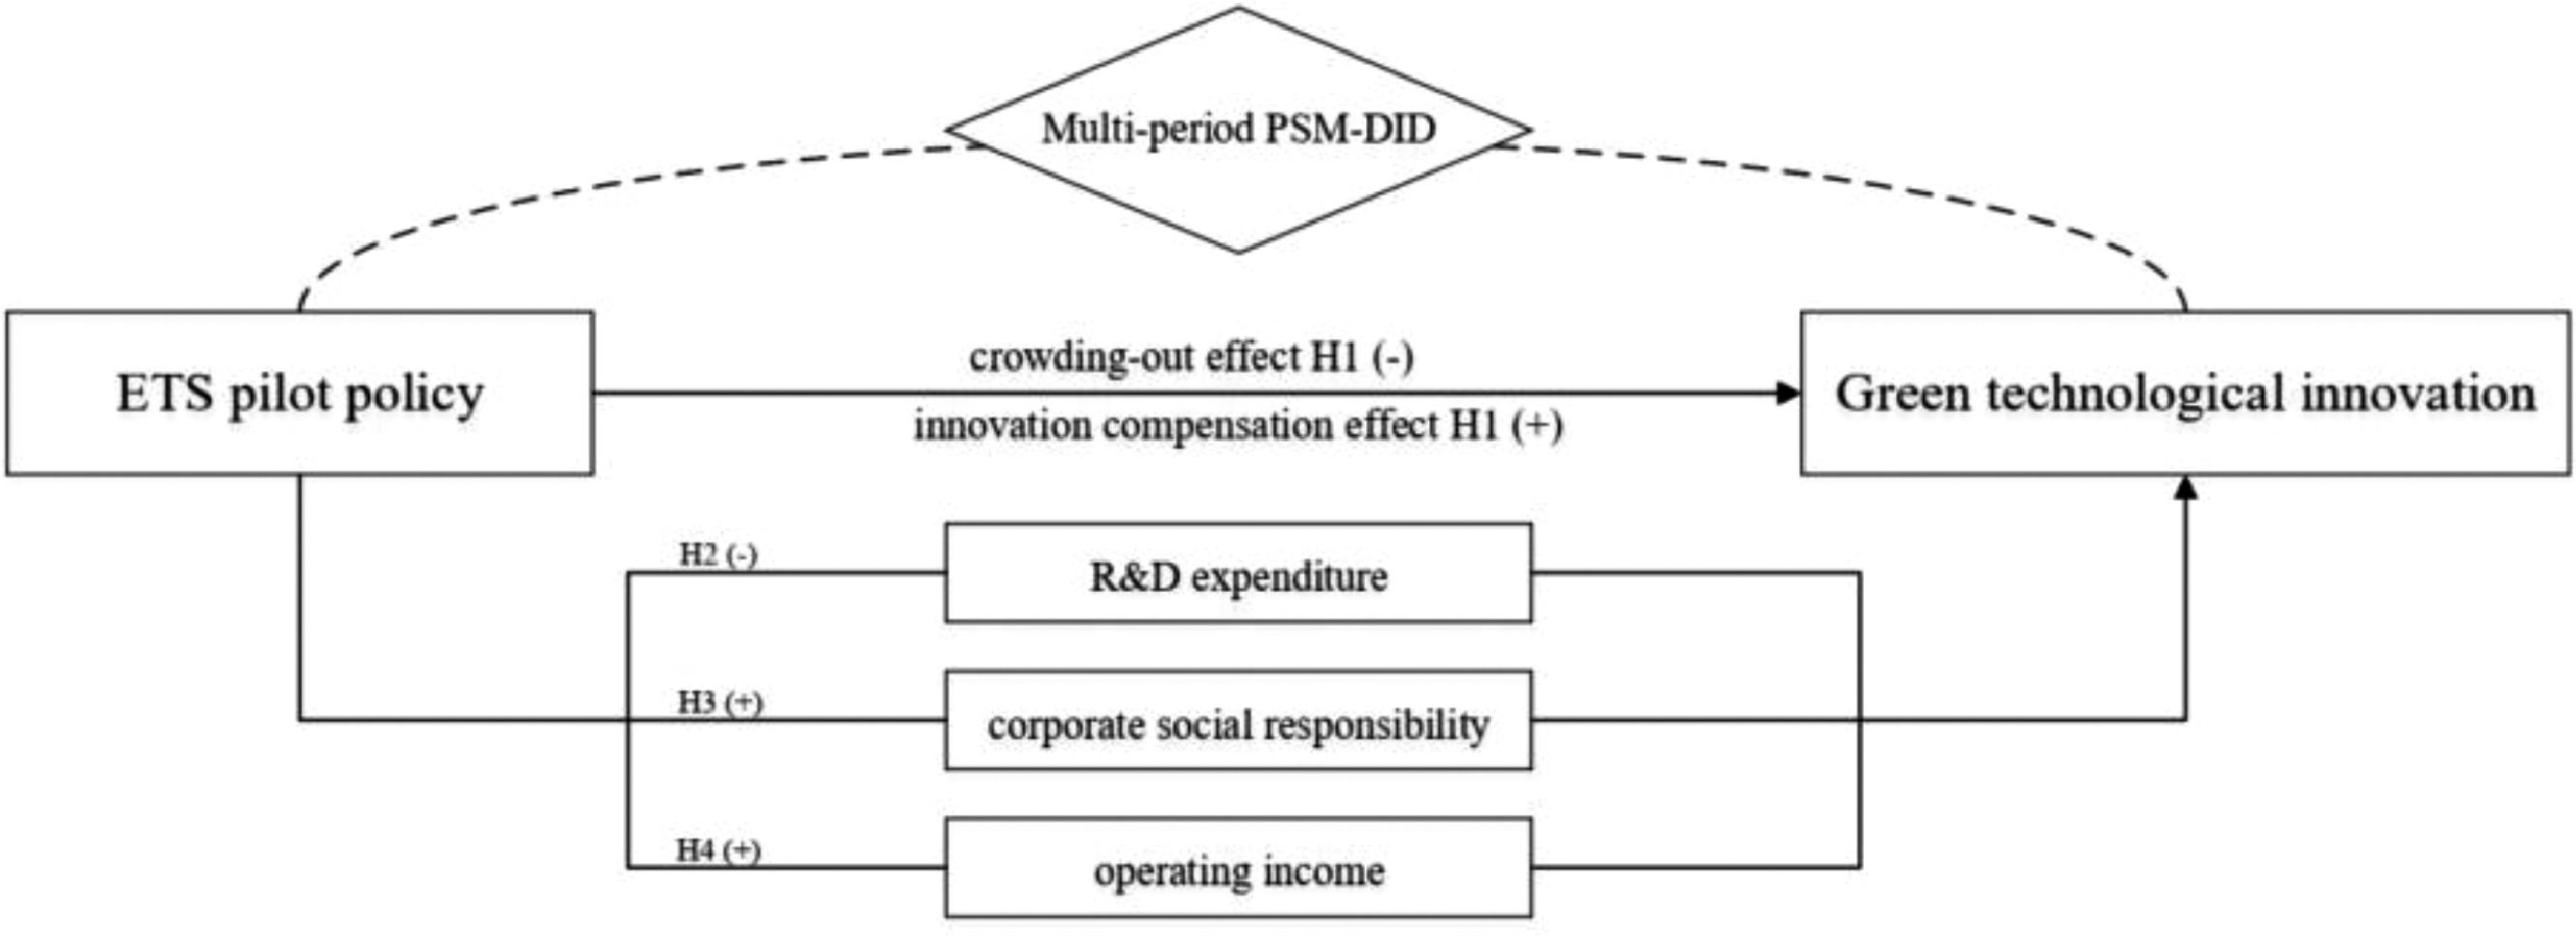
Fig. 2 shows this study's overall framework, which combines all of the above hypotheses.
4Methodology and data4.1Multi-period difference-in-differences (DID) model
As previous studies tended to apply DID to conducting policy evaluation, we employed the DID model to examine the causality of China's ETS policy on firms’ green technological innovation and alleviate potential endogeneity problems (Wooldridge, 2010; Zhou et al., 2019; Huang & Yang, 2021). Since the ETS pilot policies are carried out in batches among regulated enterprises, traditional DID with a single-time differential model cannot simulate the policy implementation (Goodman-Bacon, 2021). Therefore, we employed a multi-period difference-in-differences (DID) model in this study. We regarded China's ETS pilot policy as a quasi-natural experiment and assumed that the ETS policy is exogenous. As the pilot policy has been implemented in eight regions, we sought a list of emission-control enterprises published on the official website of each relevant provincial government and matched them with firms publicly listed in two stock exchange markets, which are the Shanghai and Shenzhen Stock Exchanges. We designated the matched and unmatched firms as 1 and 0, respectively. Thus, the sample of firms was divided into two groups: the treatment group (firms in the pilot regions affected by the ETS) and the control group (firms never affected by the ETS). Applying the parallel trend hypothesis, this study examined the net policy effect of the carbon ETS policies on green technological innovation by using measurable double differences. Specifically, the following baseline regression model was used:
where i and t refer to the firm and year, respectively, ln(Patent)it is the explained variable of interest, ETSi is a dummy variable that equals 1 or 0 if the listed firm i, respectively belongs or does not belong to the list of emission-control enterprises, Periodt is also a dummy variable that equals 1 or 0 if the carbon ETS pilot policy is or is not implemented in the firm's location, respectively, in year t, Zit denotes a matrix with a set of correlated control variables, μm, νn, and υt represent region-level, industry-level, and year-level fixed effects, respectively, εit is the random disturbance term varying with individuals and time, and α, β, and γ denote coefficients to be estimated. β is the key indicator of the effects of the ETS. Specifically, a significantly positive β indicates that the ETS pilot policy has been able to encourage green technological innovation.4.2Multi-period propensity score matching (PSM) method
The multi-period PSM method is selected for the following two reasons. On the one hand, the carbon ETS pilot policies were gradually built in 2013, 2014, and 2016 and the emission-control enterprises of each pilot were involved in batches. With the development of China's carbon emission trading market, the capacity of the market in each province and city is constantly expanding, and the list of controlled enterprises is adjusted dynamically. Some enterprises withdraw from the carbon emission trading market due to closure or other reasons while new enterprises enter it. On the other hand, PSM usually applies to cross-sectional data (Rosenbaum & Rubin, 1983), whereas DID is appropriate for panel data. Given the different scopes of application of the two methods, most scholars choose to directly transform panel data into cross-sectional data for further processing (Wang et al, 2019; Zhang et al., 2021). This transformation may create a “self-matching” and “time-mismatching” problem. Therefore, a traditional PSM-DID with a single treatment point would barely explain China's ETS pilot scheme. So, a multi-period PSM method can effectively solve both problems.
Probit models were adopted to estimate the probability of enterprise participation in the ETS for each year from 2013 to 2016 (Heyman et al., 2007; Bockerman & Ilmakunnas, 2009). The conditional probability is denoted as the propensity score. As mentioned above, the treatment group (T) refers to enterprises included in the list of emission-control enterprises during a certain year and the control group (C) refers to the enterprises never included in the list. Assuming that A={T,C}, the probability can be estimated by:

The probability (P) is the propensity score, which is the basis of various matching methods, and Xi,t denotes a series of observed covariates. Usually, they are the main factors selected as the emission-control enterprises. Based on the ignorability assumption, firms with similar measurable variables have similar probabilities of entering the treatment group. As a result, following Li et al. (2023) and Liu et al. (2021), we chose the eight control variables in our DID model as the observed covariates. For each of the four years, we used the 1:3 nearest-neighbor matching method with replacement and set the caliper radius to 0.05 to match the treatment group with the most similar control group according to their propensity scores. Thus, the control group was obtained.
4.3Variable selection and data sources4.3.1Variable selectionFollowing Qi et al. (2018) and Chen et al. (2021), we adopted the number of green patents as the explained variable to measure the firms’ levels of green technological innovation. Compared with R&D and total factor productivity (TFP), green patents are easier to use for identifying low-carbon technical areas accurately. Defined by the World Intellectual Property Organization (WIPO), green patents are classified into seven categories issued by the IPC Green Inventory in 2010: alternative energy; transportation; energy conservation; waste management; agriculture and forestry management; administrative supervision; nuclear power generation. For this study, the logarithm of the patent authorization data of listed companies was selected as the object of analysis because patent authorization is more reliable than patent filing and reflects the actual levels of the green technological innovation of enterprises.
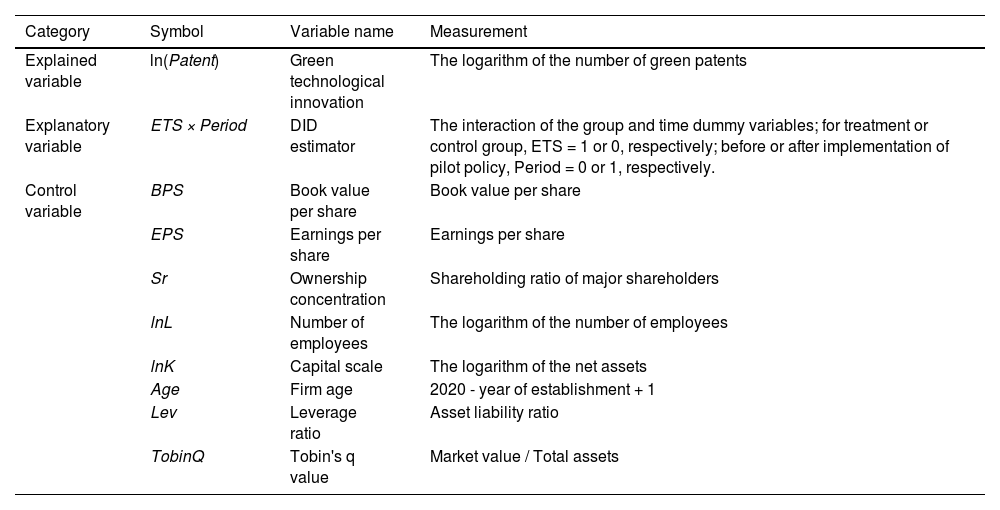
Referring to Qi et al. (2018), Hu et al. (2020b), and Zhao et al. (2023), micro-level economic characteristics are selected as control variables of the model from four dimensions as follows. (1) The scale of the industrial enterprises. The larger the enterprise size, the higher the success rate of innovation is (Zhao et al., 2023). Capital scale (lnK) and number of employees (lnL) are the two indicators that describe the firm scale. (2) The performance of profit. Corporate profitability is closely related to innovation performance (Amore & Bennedsen, 2016), so we select book value per share (BPS) and earnings per share (EPS) to describe the corporate performance of profit. (3) The performance of management. Ownership concentration (Sr) and leverage ratio (Lev) are selected to describe the corporate performance of management as the capital structure will partially determine whether enterprises carry out innovation activities. (4) The maturity and growth. Firm age (Age) and Tobin's q value (TobinQ) are selected as control variables because research shows that enterprises with a long history have a stronger sense of innovation (Qi et al., 2018). The connotations and the measurements of the variables are listed in detail in Table 1.
Definitions of variables.
Note: the data were collected manually by the authors.
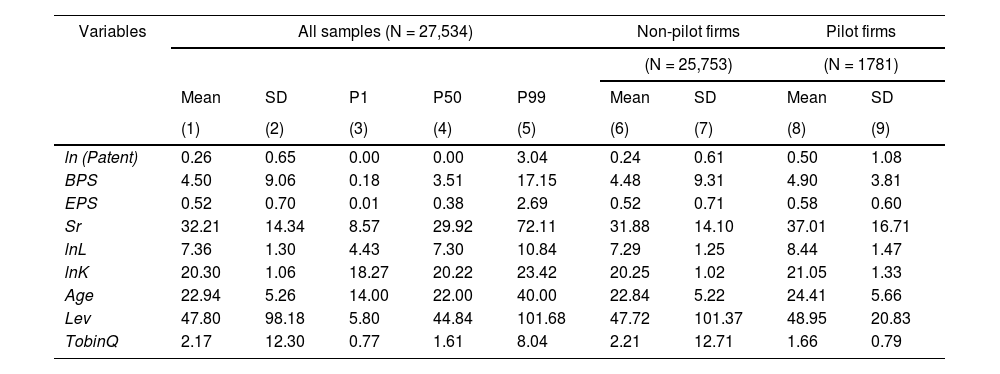
We used a panel data set from 2007 to 2019 of A-share listed companies on the Shanghai and Shenzhen stock exchanges to evaluate the effects of the ETS policy on the green technological innovation of industrial enterprises. Since the implementation time point of the pilot policy was focused on 2013–2016, this paper chose the 13-year period from 2007 to 2019 as the sample interval. This study interval is the most appropriate period for this study. First, the ETS policy began in 2013, so we used data from at least six periods before the policy, which is long enough for testing whether parallel trends were satisfied in the treatment and control groups (Zhao et al., 2023; Yao et al., 2021; Qi et al., 2021). The more periods that satisfy the parallel trend before the policy, the more reliable the results obtained using DID analysis will be (Abadie et al., 2010). Second, the data after 2019 do not apply to this study due to the sudden outbreak of the global COVID-19 pandemic in 2020. The pandemic brings unpredictable exogenous effects to global firms, which will directly affect their outputs and inputs. The research data were mainly collected from the Wind and CSMAR databases, whereas the patent data were downloaded from the Inco-Pat Patent Database3 and categorized. After combining data from multiple data sources, we screened the initial samples according to the following conditions (Cai et al., 2020): (i) Excluding listed companies with financial abnormalities, such as ST, PT, and *ST; (ii) Excluding listed companies with a serious lack of variables; (iii) Excluding listed companies that withdrew from the Stock Exchange during the sample period; (iv) Excluding companies that be listed after 2006. Then, five industry categories with more than twenty sub-industries were selected to be the research sample because the pilot enterprises were mainly concentrated in these industries. The five industry categories are: (1) the mining industry; (2) the manufacturing industry; (3) the production and supply of electricity, heat, gas, and water industry (referred to as the utilities industry); (4) the construction industry; (5) the transportation, warehousing, and postal industry. Financial and service companies and agricultural companies are not part of our study due to the different ways of production and emission mitigation modes (Zhang & Jin, 2021). The final dataset was balanced panel data including 27,534 samples from 2118 listed companies, of which 1781 samples from 137 listed companies were the treatment group. Table 2 shows the descriptive statistics of the samples.
Descriptive statistics of samples.
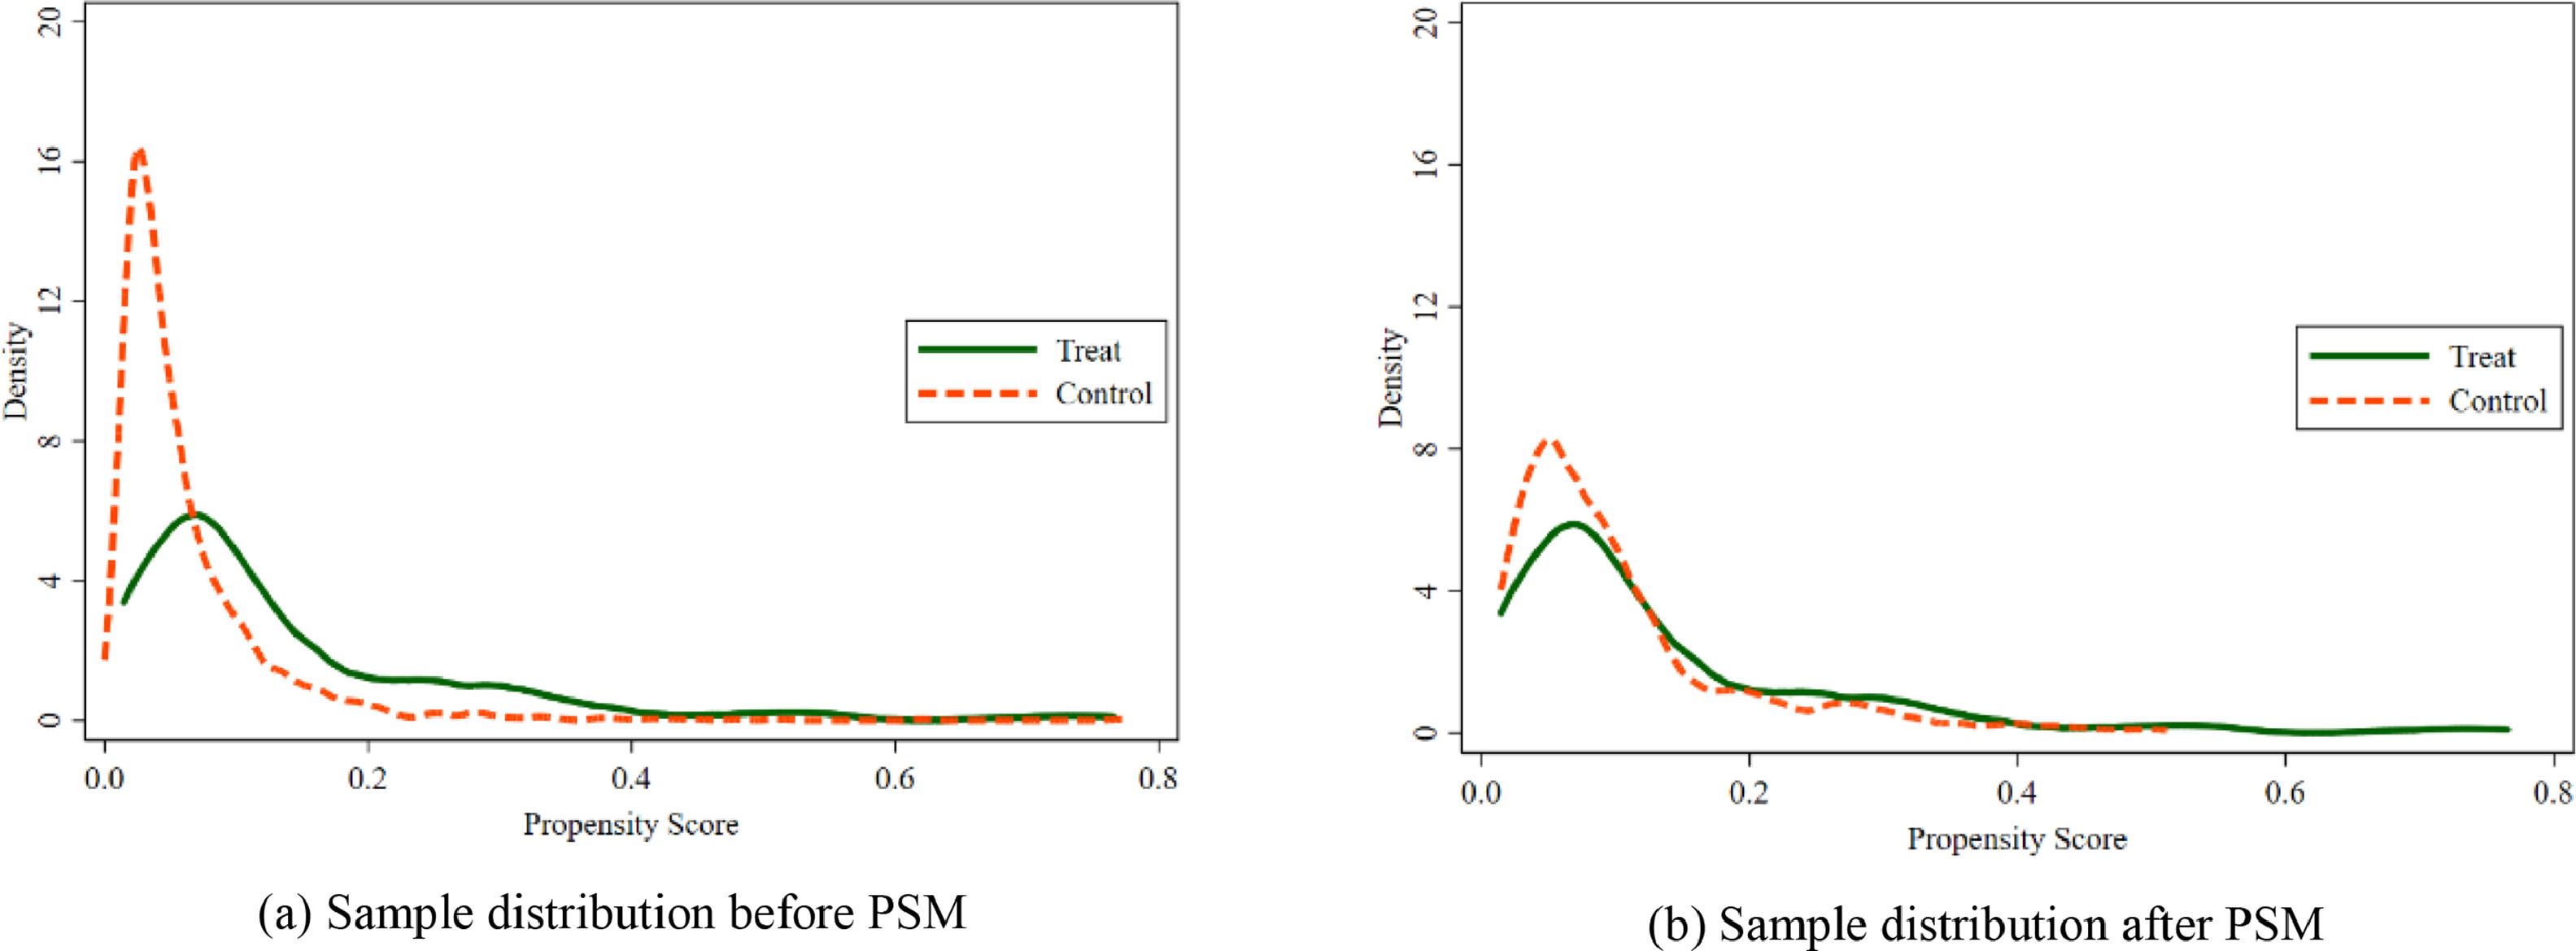
For the year-by-year PSM for 2013–2016, logit regressions were first performed on the control variables we mentioned above as the independent variable and the ETS dummy variable as the dependent variable to obtain the propensity score value. Then, the 1:3 nearest neighbors matching method was adopted with a caliper radius of 0.05 to pair the treatment group with the control group of the closest propensity score. In this way, the systematic differences between the treatment group and the control group could be minimized to satisfy the parallel trend hypothesis. As shown in Fig. 3, before matching, the propensity scores of the control group in 2016 concentrate between 0 and 0.1, whereas that of the treatment group in 2016 are relatively dispersed. After matching, the distributions of the scores of both groups are almost consistent, which is the premise of the DID estimation.

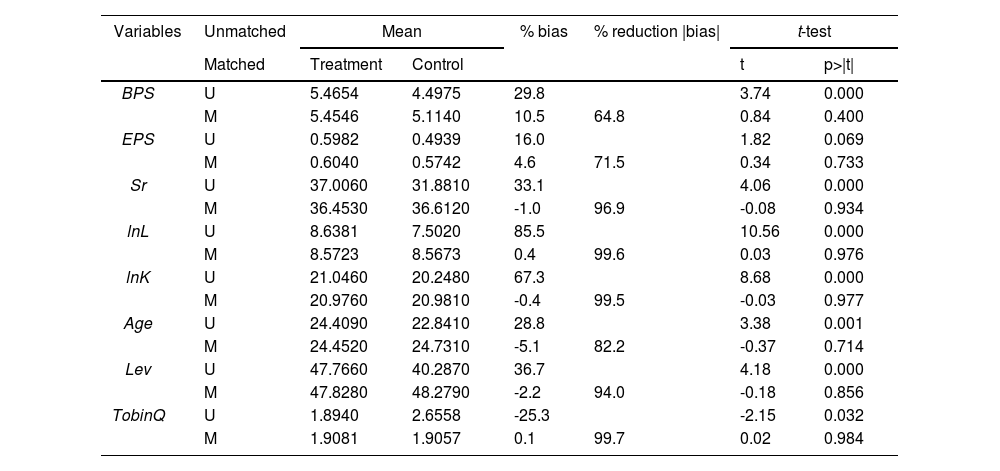
Taking 2016 as an example, Table 3 shows the balance test of the distribution of the covariates. Before PSM matching, the absolute values of all the standardized biases are more than 10% and the P-values of the t-test are significant between the treatment group and the control group, thus indicating significant differences in the covariates in the original data. After PSM matching, the standardized biases reduce to less than 10% with a reduced amplitude of more than 60% and the P-values are insignificant, thus indicating that the mean values of covariates between the treatment group and the control group are similar after matching. After the balance hypothesis was validated, further estimation of the econometric model was conducted.
The balance test of the covariates.
Note: *, **, and *** indicate statistical significance at the 10%, 5%, and 1% levels, respectively.
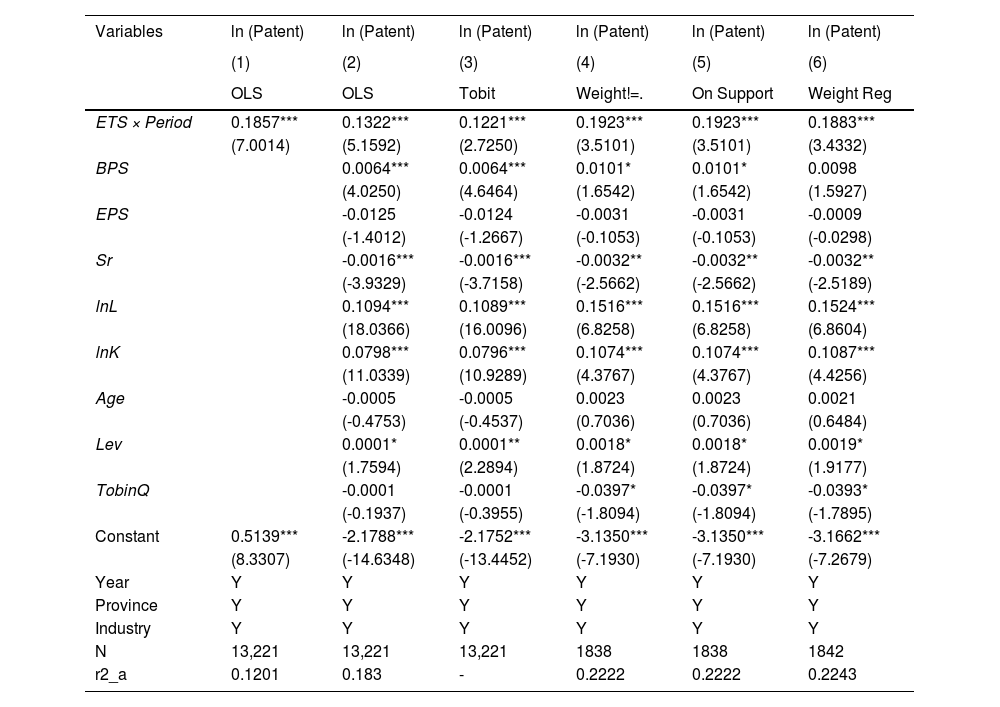
Table 4 shows the regression results of the DID model. The fixed effect model excluded the influence of individual heterogeneity on the regression results by differentiating between the groups. Therefore, we controlled the time, regional, and industrial fixed effects in all six regressions to eliminate the time-variant and time-invariant regional and industrial factors. Columns (1)–(6) report a significantly positive effect of the ETS policy on the number of green patents of industrial firms entirely at the 1% level, suggesting that the carbon pilot ETS had effectively encouraged green technological innovation. This result is consistent with H1, indicating that the weak Porter Hypothesis is validated. Besides, the empirical results confirm the rationality of the theoretical derivation from reality. Two reasons explain this. For one thing, the traditional way to reduce emissions no longer meets the new environmental requirements. End-of-pipe treatment measures with high cost and low efficiency are replaced by clean production. Driven by the goal of maximizing profit, enterprises choose to increase the input of technological factors to deal with the burden of emission reduction brought by environmental regulations. For another, due to the positive externalities of technological innovation, firms will seek intellectual property protection by applying for patents. So the investment in technological factors is reflected in the increase of the green patents of industrial enterprises.
Effects of ETS pilot policy on green technological innovation according to multi-period PSM-DID.
Note: the values in parentheses are t-values; *, **, and *** indicate statistical significance at the 10%, 5%, and 1% levels, respectively.
Column (1) only contains three levels of fixed effects in the OLS regression model. In Column (2), we added the eight control variables mentioned above based on Column (1). Column (3) uses the Tobit model as an alternative. In Column (4), we retained the samples whose matching weights were not equal to zero. We kept the samples on support in Column (5) and expanded the samples whose matching weights were greater than 1 in Column (6). After changing control variables, estimation methods, and sample screening, the empirical results still show that the ETS pilot policy had a significantly positive effect on the green technological innovation of the industrial enterprises. This proves the robustness of the empirical results.
In terms of the control variables, BPS, lnL, and lnK are positively correlated with the firms’ green technological innovation. This result is consistent with Hu et al. (2020b), who supposed that the size of a firm amplified the influence on its innovation output. However, Sr inhibits the output of green patents. One valid reason is that firms with higher ownership concentration tend to put decision-making power in the hands of a few senior leaders. So purchasing fixed assets with high added value was a wiser choice for making a considerable profit in the short term.
5.2Robustness test5.2.1Parallel trend test for the whole sampleTo verify the consistency of the above-estimated results, we used an event study approach to test the dynamic marginal effects of the ETS policy on the green technological innovation of the industrial enterprises for the whole sample because the matched data mitigated selection bias but lost a variety of samples. We established a pre-existing parallel trend between the treatment group and the control group for the whole sample. Multi-period PSM-DID method was used to estimate the regression results because of the model's unbiased evaluation. The dynamic effect model was constructed by substituting a series of dummy variables by the DID estimator with other variables unchanged. The dynamic effect model is expressed as:
where DIDitk is a series of dummy variables representing the implementation of the policy. If enterprise i is in the list of emission-control enterprises and year t is the time k years after the point-in-times (before if k<0), then the enterprise is added to the list and we let DIDitk=1; otherwise, we let DIDitk=0. The significance of coefficient βk is of great interest to us.
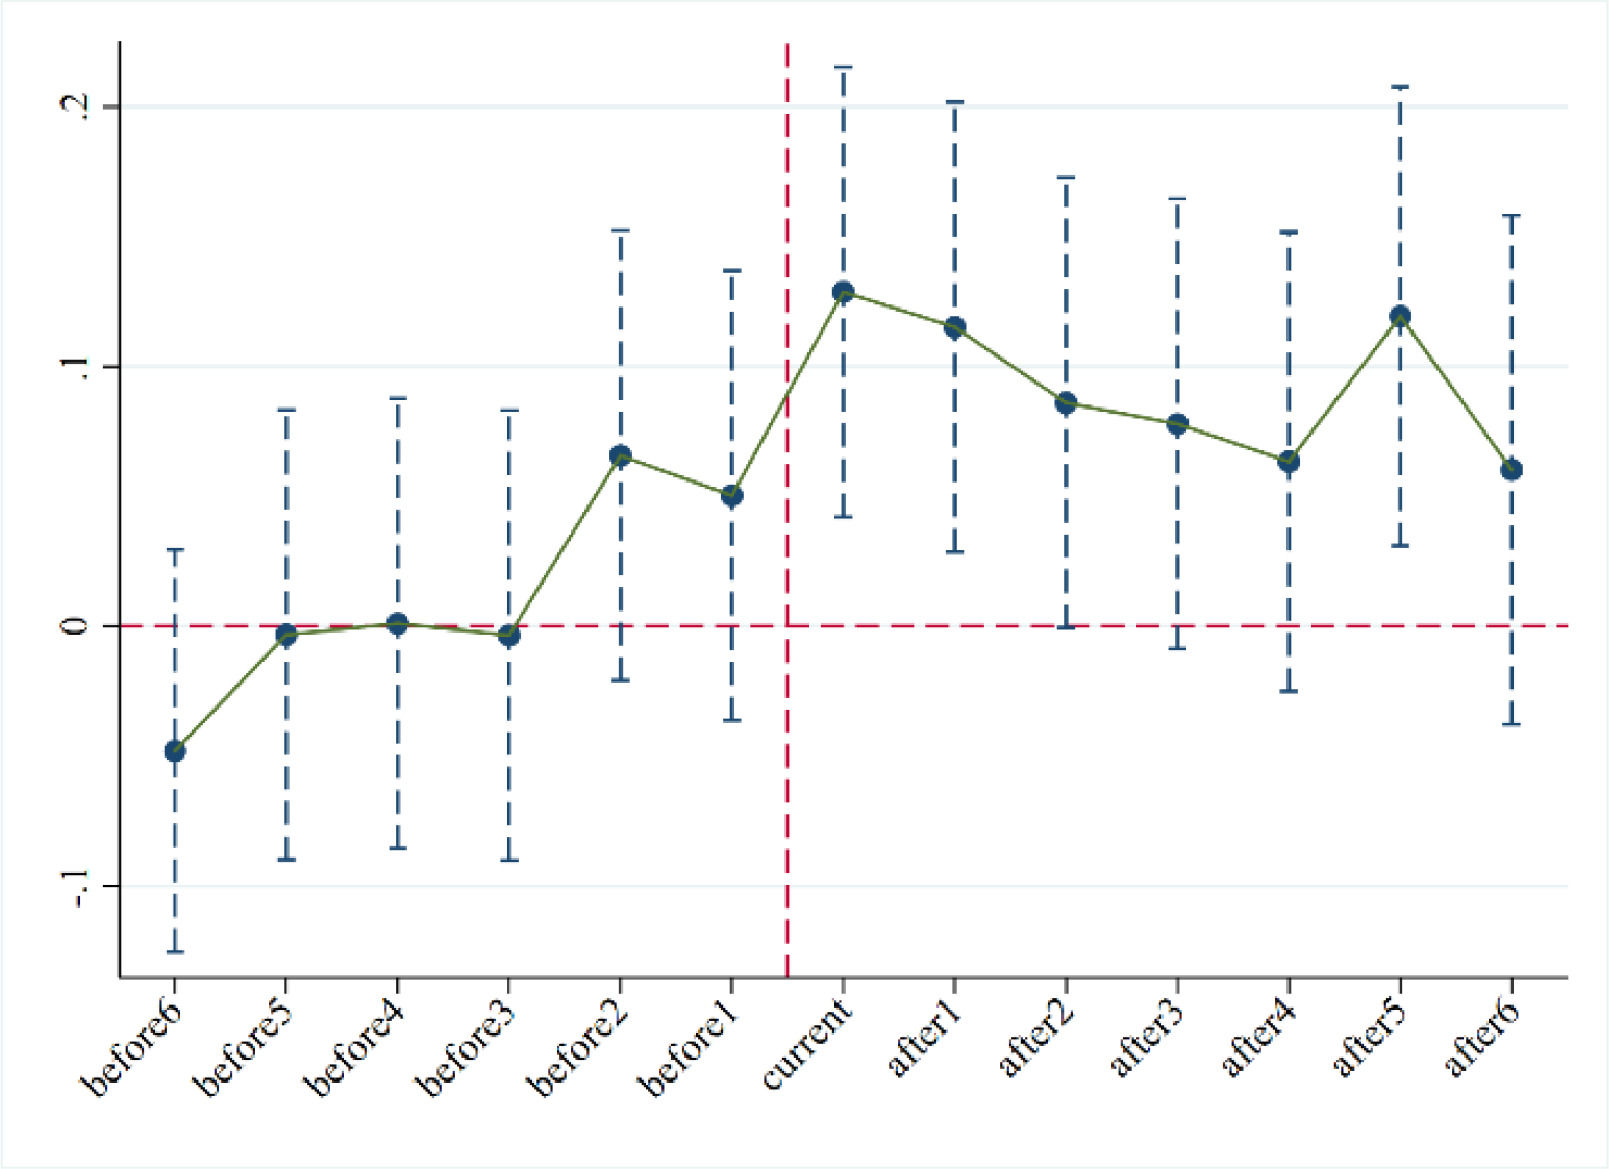
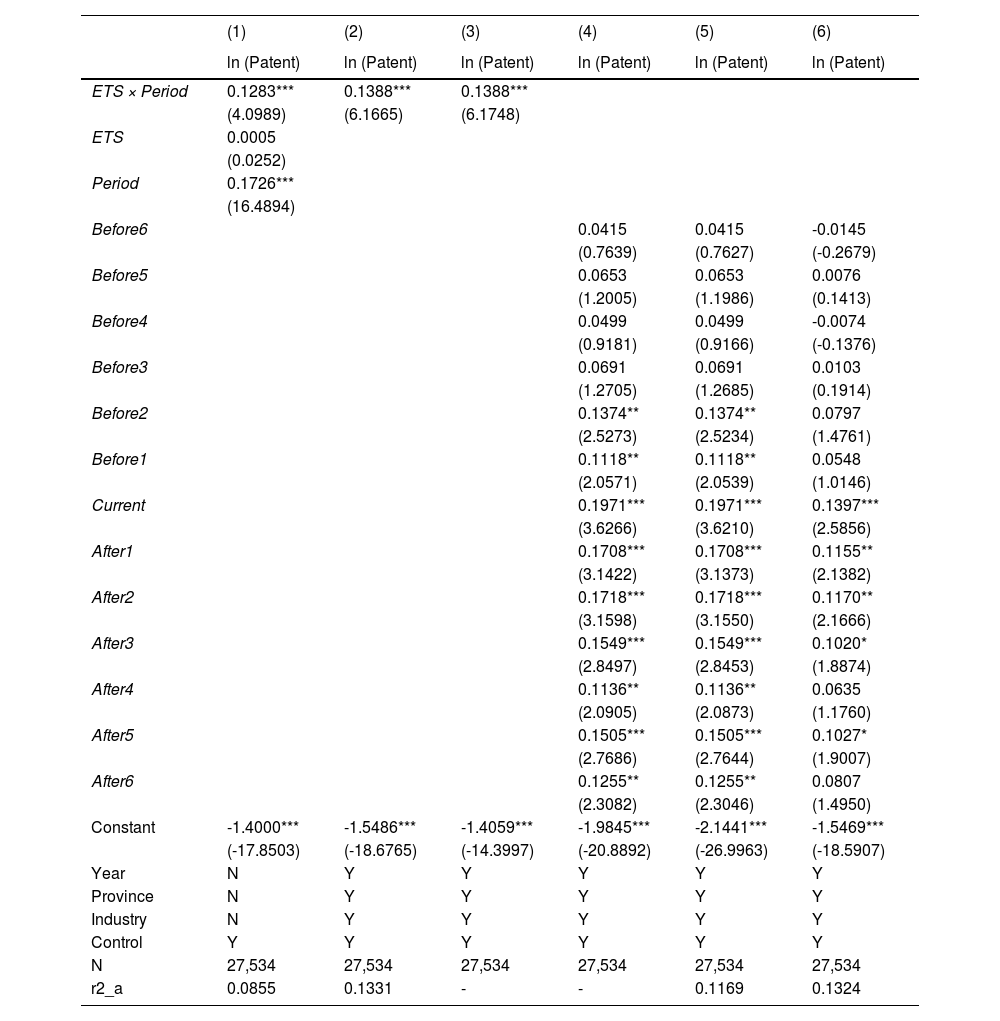
Columns (4)-(6) in Table 5 display the regression results of the dynamic effects of the ETS pilot. Generally speaking, the results of the three columns are consistent with the baseline model, so the ETS pilot policy on the green technological innovation of industrial enterprises has passed the parallel trend test. For Columns (4)-(5) we used a Tobit model and a fixed effect model of OLS, respectively. The two regressions reach a similar conclusion that there are no significant differences in the levels of green technological innovation between both groups before the implementation of the ETS pilot policy. As a notice about the ETS pilot program was issued two years before its formal implementation, it shows an early promotion of green technological innovation. In Column (6), all the control variables have been added to the regression model and the coefficient is significant until the period Current, when the batches of provinces and cities had begun to implement the pilot policy. However, the coefficients of After4 and After6 are not statistically significant probably because innovation had gradually hit a bottleneck in this period and the logarithm of the green patents had narrowed the diminishing gap. Fig. 4 illustrates the regression results in Column (6) of Table 5, with the 90% confidence interval marked for each year. Before the base period, the estimated coefficients of the interaction terms are insignificant while the marginal effect line tilts to the upper right and becomes significantly positive after Before1. Simultaneously, we performed a DID regression by OLS and a Tobit model on the whole sample in Columns (1)-(3) in Table 5. All columns are significantly positive at the 1% level, which further proves the robustness of our results.
Parallel trend test for the whole sample.
Note: the values in parentheses are t-values; *, **, and *** indicate statistical significance at the 10%, 5%, and 1% levels, respectively. Because of space limitations, the regression results of the control variables and dummy variables have been omitted.

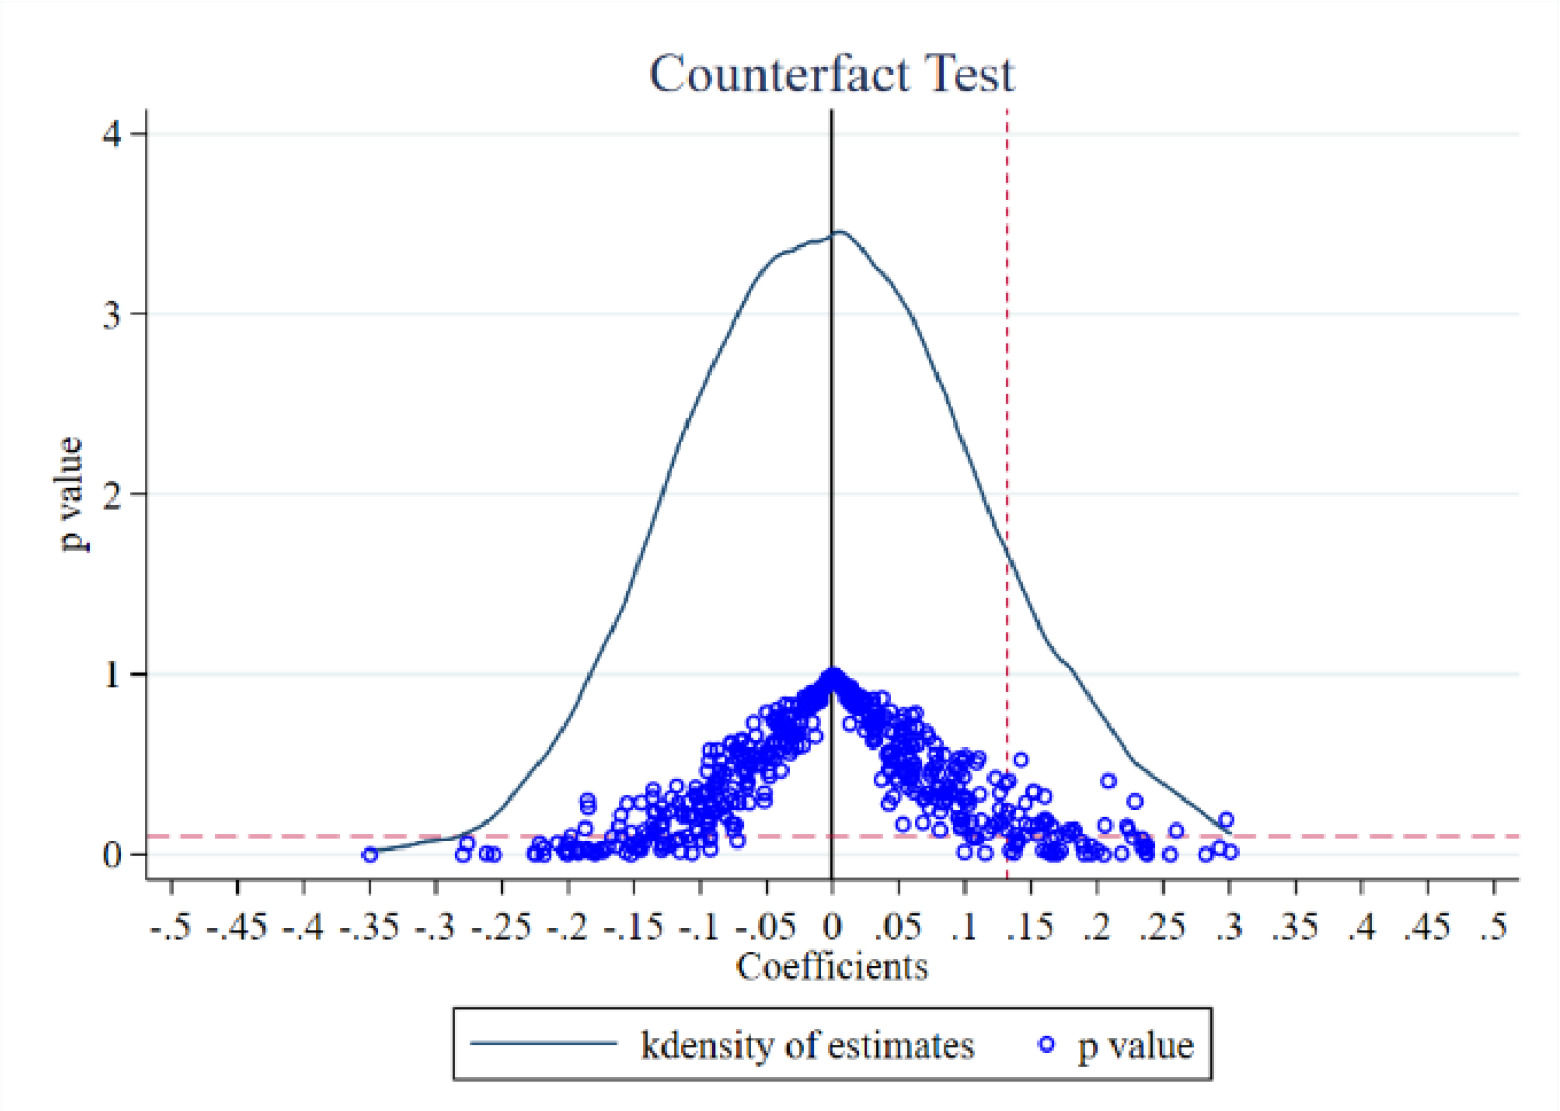
We conducted a placebo test as a further robustness test to exclude disturbances from other unobserved variables. Following Zhang and Zhang (2020), we designed the placebo test to randomly select 136 out of the 1017 enterprises after the multi-period PSM as the false treatment group and left the other enterprises as the false control group. We made a counterfactual assumption that the ETS pilot policy had been implemented for the selected enterprises, then performed the DID regression with a new dummy variable Treati for the aforementioned false treatment group. The other control variables and the explained variable involved in the regression were kept unchanged. This simulation was repeated enough times to prevent the contingency of random sampling and enhance the reliability of the results of the placebo test. We reiterated the program 500 times to satisfy the reiterations required by the Central Limit Theorem. If the mean value of the regression coefficient of the core explanatory variable β is not zero and is statistically significant, then the original regression results are biased; otherwise, the placebo test has been satisfied.
To better display the regression results of the placebo test, we plotted the kernel density and P-value distribution of the estimated coefficients, which are shown in Fig. 5. The x-axis is the distribution of the estimated coefficients, the curve that resembles a normal distribution represents the kernel density distribution of estimates, and the blue rings reveal the P-value distribution. The vertical red dashed line (x = 0.1322) shows the actual estimation coefficient in the baseline regression and the horizontal red dashed line (y = 0.1) indicates the boundary of the P-value. After 500 random samples of the false treatment group, the estimated coefficients of the core explanatory variable are centered around zero, with a mean value of 0.0060 and a standard deviation of 0.1179. The result of the placebo test is truly far from the actual estimation coefficient (0.1322), thus indicating that the unobserved factors had not disturbed our measurements. Most of the P-values represented by the blue rings are above the horizontal red dashed line (y = 0.1), which means that most of the regression coefficients in the 500 iterations are statistically insignificant. Consequently, no effect exists for the randomly established ETS pilot policy, which indirectly substantiates the effects of the ETS pilot policy on the green technological innovation of industrial enterprises. Hence, the effects of the ETS policy effect have not undergone interference by unobserved random factors.
5.2.3Alternative measures
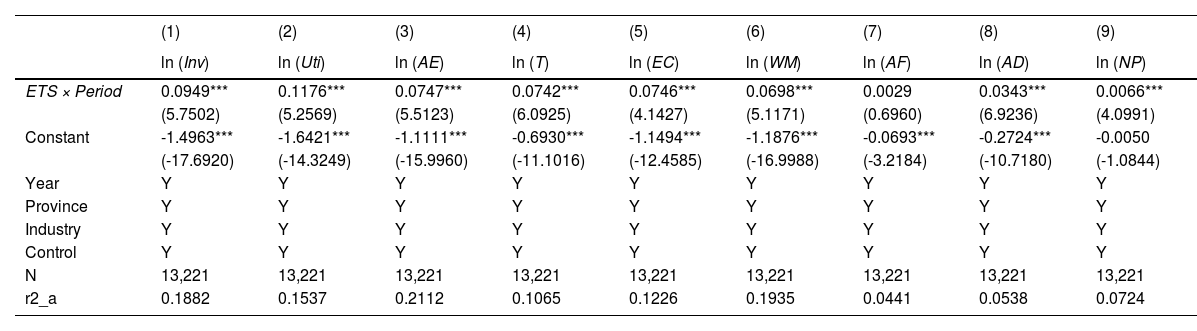
To confirm the reliability of our baseline regression results, we conducted another robustness test. We changed our measurement of the explained variable for the firms’ green technological innovation. Columns (1)–(2) in Table 6 show the effects of the ETS pilot policy on the invention patents and utility models, respectively. The results of the DID estimators of both regression models showed significantly positive interaction coefficients of 9.49% and 11.76%, respectively, which is consistent with the results in Section Baseline regression results. This indicates that both high-quality innovation and practical innovation enjoy synchronized advancement. According to the IPC Green Inventory promulgated by WIPO, all green patents of an enterprise can be classified into seven categories: alternative energy (AE), transportation (T), energy conservation (EC), waste management (WM), agriculture and forestry management (AF), administrative supervision (AD), and nuclear power generation (NP). Based on this classification, Columns (3)–(9) in Table 6 show that the estimated coefficients of the policy's effects essentially remain unchanged except for the green patents in AF, indicating that the ETS pilot policy had been more conducive to emission reduction technology but not innovation in carbon sequestration.
Alternative measurements.
Note: the values in parentheses are t-values; *, **, and *** indicate statistical significance at the 10%, 5%, and 1% levels, respectively. Because of space limitations, the regression results of the control variables and dummy variables have been omitted.
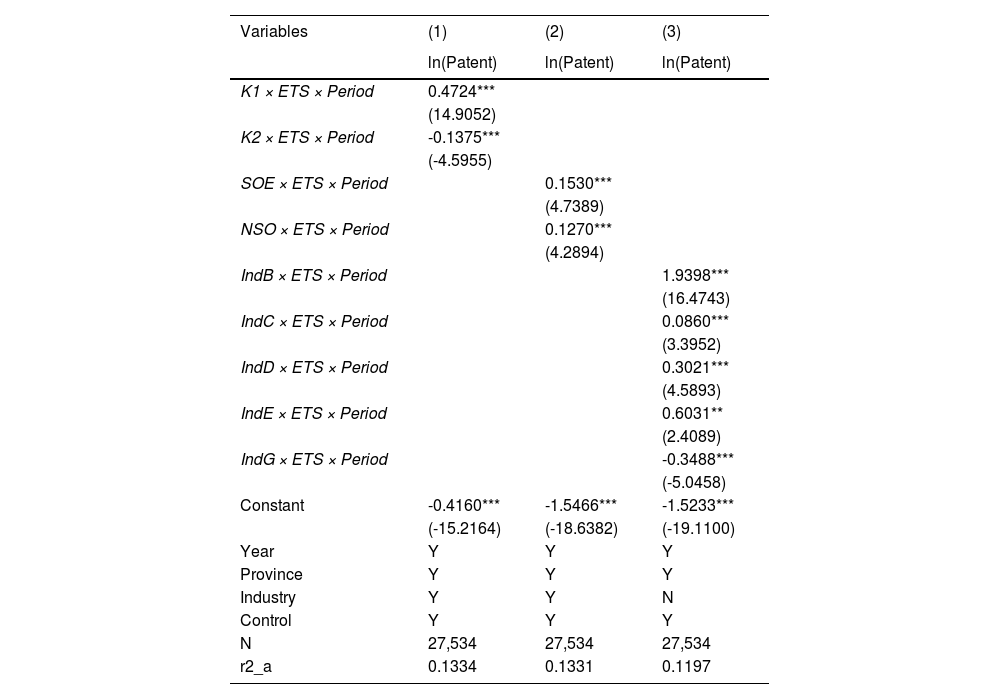
To examine the heterogeneity of the effect of ETS on green innovation by industrial enterprises with different characteristics, we focused on three factors that distinguished the innovation strategies among the listed firms affected by the ETS policy: capital scale, ownership, and industry category. Table 7 shows the estimated results.
Heterogeneous effects of ETS pilot policy on green innovation along three dimensions.
Note: the values in parentheses are t-values; *, **, and *** indicate statistical significance at the 10%, 5%, and 1% levels, respectively. Because of space limitations, the regression results of the control variables and dummy variables have been omitted.
Firstly, companies with heterogeneous capital scales often react differently in terms of innovation when faced with similar regulations. As shown in Column (1), K1, K2 are dummy variables that equal 1 if lnKis greater or less than its median and equal 0 otherwise. The estimated coefficient shows that enterprises with smaller capital scales tend to scale down their green patents to meet the emission reduction requirements, whereas enterprises with ample capital behave quite differently. When faced with the ETS pilot policy, large firms choose to increase green innovation on their own instead of transferring investments to other uses. A possible explanation is that large-scale enterprises have a stronger ability to resist innovation risks. On the one hand, large-scale enterprises have more abundant funds for purchasing or inventing high-quality patents (Hu et al., 2020b). Whereas, tight financial constraints restrict the ability of enterprises to innovate for environmentally friendly technology (Zhang & Jin, 2021). The larger an enterprise's capital scale, the better its mortgage guarantee capabilities will be and the more likely it is to get access to green patents. On the other hand, large-scale enterprises usually occupy a large part of the market. Economies of scale enlarge the benefits of low-carbon technology and bring more driving forces for green innovation (Chen et al., 2021).
Secondly, we examine the heterogeneity effect of enterprises with different ownerships. As shown in Column (2), SOE and NOE are dummy variables that equal 1 if it is a state-owned or non-state-owned enterprise otherwise 0. The result shows that although the ETS policies have promoted green innovation in both state-owned and non-state-owned enterprises, the ETS has a more significant incentive effect on green innovation in state-owned enterprises than in non-state-owned enterprises. The main reasons are as follows. On the one hand, considering the bias of government policy implementation, the operating environment of state-owned enterprises is better than that of non-state-owned enterprises. State-owned enterprises are more accessible to resource allocation and financial support. On the other hand, most of the state-owned enterprises are large-scale enterprises, and their innovation behaviors have a strong demonstration effect. Therefore, state-owned enterprises often take the lead in implementing ETS policies and become good examples for enterprises to learn from (Chen et al., 2021).
Thirdly, companies in different industries also vary considerably in their innovative responses to the ETS pilot policy. As seen in Column (3), IndB, IndC, IndD, IndE, and IndG are five dummy variables that represent the mining industry, the manufacturing industry, the utilities industry the construction industry, the transportation, warehousing, and postal industry, respectively. The estimated results show that the ETS pilot policy has had a significantly positive effect on green technological innovation in the mining industry, the manufacturing industry, and the utilities industry, whose P values were positively significant at the 1% level. The innovation incentive effect exists in the construction industry while there is an innovation inhibition effect in the transportation, warehousing, and postal industry. This may be because different industries have their unique production processes and innovation methods. The mining industry, the manufacturing industry, and the utilities industry are three traditional industries that highly depend on technology and capital resources. On the one hand, the total core innovation expenditures of these three industries are much higher than those of the other industries accounting for more than 60% in the aspect of the acquisition of machinery and equipment according to the China Statistical Book 2021. Enterprises' emphasis on innovation output and management of intellectual property have greatly improved their technological level, which contributes to the increase of green patents. On the other hand, as the three industries are high-emission industries with CO2 emissions accounting for more than 70%, end-of-pipe treatment technologies can no longer meet the emission limit requirements. As a result, improving the efficiency of green technology conversion in the production processes has become a priority for the three industries in response to ETS policies. In contrast, the construction industry and the transportation, warehousing, and postal industry are mainly dependent on the features of labor and resource endowment making their development not only easy prey to the low-end technology locking status, but also to falling into the state of structural locking and factor input locking (Cai et al., 2020).
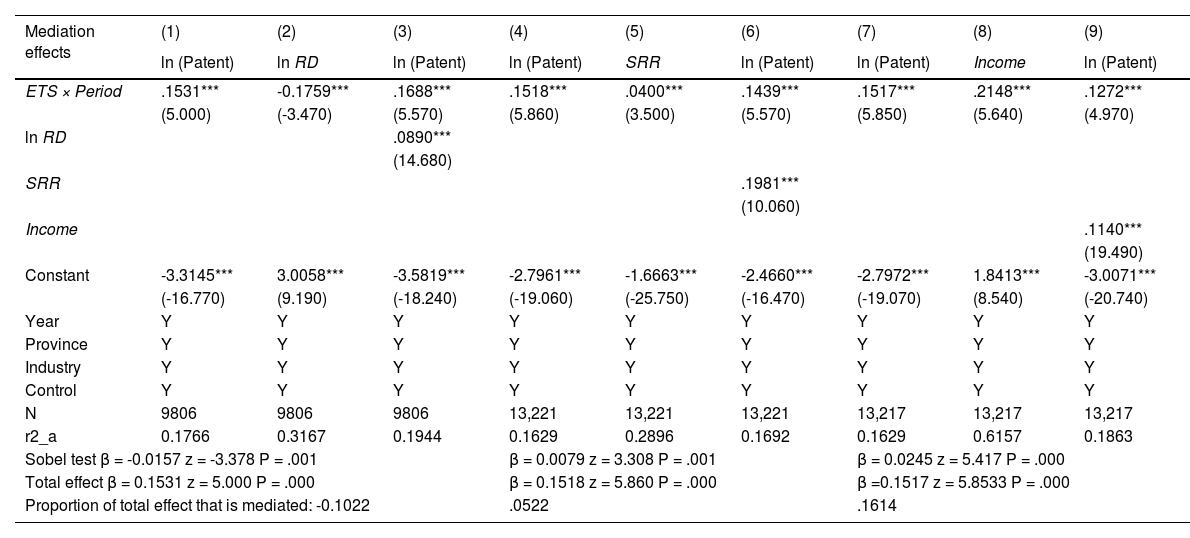
5.4Analysis of influencing mechanismWe further explored the potential paths and mechanisms. According to Baron and Kenny (1986), as well as Preacher and Leonardelli, (2001), the Sobel test is an appropriate method for investigating mediating effects because it is based on a three-step regression and improves on analyzing direct effects, indirect effects, and the significances of mediating effects. The three-step regression models are expressed as follows:
where Mit denotes the three mediating variables of R&D expenditures (lnRD), social responsibility report (SRR), and operating income (Income) for firm i in year t, β1 represents the total effect of the ETS pilot policy on green innovation, which is consistent with the core estimated coefficient in the baseline regression. ϕ1 and η1·ϕ2 represent the direct effect and the mediation effect, respectively, in a specific mechanism. The detailed estimated results and Sobel test results are reported in Table 8.


Mechanism analysis.
Note: the values in parentheses are t-values; *, **, and *** indicate statistical significance at the 10%, 5%, and 1% levels, respectively. Because of space limitations, the regression results of the control variables and dummy variables have been omitted. For all P-values less than 0.01, the null hypothesis is rejected and there exist mediating effects.
According to the Sobel test, the z-values have passed the significance level of 1%, which means that mediation effects exist. As shown in Columns (1)–(3) of Table 8, R&D expenditures played a significantly negative role in the effects of the ETS on firms’ green patents by severely reducing the firms’ R&D expenditures by 17.59%, thus partially offsetting the effects of the ETS on the firms’ green innovation. The result reveals that Hypothesis 2 verifies. This may be because the carbon market in China is not mature enough at the present stage, and the price signals are not strong enough. Therefore, China's current stage of development and the price signals from the carbon market are not enough to stimulate sufficient R&D investment. Some companies gamble on luck and spend their potential R&D expenditures on penalties or acquiring quotas instead of advanced low-carbon technologies. At the same time, R&D expenditures have provided financial support for technological innovation and have promoted the increase of green innovation. As a result, R&D expenditures inhibit ETS's role in promoting green innovation.
Columns (4)–(6) of Table 8 reveal that CSR as a channel has effectively mediated the ETS policy effect by 5.22%. The result implies that the implementation of the ETS has significantly improved the awareness of CSR, thus licensing and accessing more green patent authorization. Thus, Hypothesis 3 verifies. The possible reasons are as follows: with the implementation of ETS, enterprises pay more and more attention to clean production and consciously undertake the social responsibility of carbon neutrality. By taking the initiative to assume social responsibilities, industrial enterprises create a positive corporate image for consumers and build a high-quality working atmosphere for employees, forming a virtuous circle. Hence, engagement in ESG activities improves the level of green innovation capacity.
Columns (7)-(9) of Table 8 show the three-step regression result of the mediating effect of operating income on the effects of the ETS pilot policy on corporate green technological innovation. The estimated coefficient of ETS×Period in Column (8) is significantly positive at a 1% level, indicating that the ETS pilot policy facilitated the profitability of the industrial enterprises by 21.48%. This confirms the possibility of the strong Porter Hypothesis that environmental regulation can improve the competitiveness of enterprises. Besides, the indirect effect of operating income was 0.0245, which accounted for 16.14% of the total effect. This indicated that the ETS pilot firms transacted carbon assets through mitigation activities, such as cleaner production, as well as carbon capture and storage technology (CCS), to achieve a win-win situation for the economy and the environment (Xiao et al., 2021). The results reveal that Hypothesis 4 is supported.
6Conclusions and implications6.1ConclusionsThe choice of emission reduction mode under the ETS policy is related to the process of high-quality development in China. The effects of China's ETS pilot policy on the green technological innovation of industrial enterprises were hereby explored by using the panel data from 2007 to 2019 of A-share listed Chinese companies in the regulated industries. Treatment counterfactuals were constructed with a multi-period PSM, and a DID model was employed to reveal the effects of the ETS policy on innovation. Empirically, examination was carried out on whether the ETS pilot policy played a positive role in promoting green technological innovation, and different influencing mechanisms were examined. The conclusions can be summarized as follows.
First, the ETS pilot policy has significantly promoted green technological innovation in industrial enterprises. In general, the innovation compensation effect of ETS policy is larger than the crowding-out effect based on the current data of Chinese industrial enterprises. It supports the view that reasonable environmental regulation policies can promote the development of green technology innovation based on the Porter Hypothesis. The effect remains significantly positive after the parallel trend test, the placebo test and the test for the substitution of explained variables.
Second, different firms have experienced heterogeneous effects caused by the ETS policy. Given that large-scale firms, state-owned enterprises and firms in three traditional industries perform better in resisting innovation risks, have more access to resource allocation and financial support or have their unique production processes and innovation methods, they are more willing to respond to the ETS policy through green innovation.
Third, further analysis has indicated that the current ETS policy in China is not enough to motivate industrial enterprises to spend more on R&D, thus weakening the effects of the ETS on green technological innovation and confirming the existence of crowding-out effect. However, the ETS policy has promoted the CSR and operating income of industrial enterprises, i.e., the two positive mediating factors of ETS policy on green technological innovation, thereby verifying the innovation compensation effect.
6.2Theoretical implicationsThe hereby-employed multi-period PSM-DID method provides a theoretical reference for countries worldwide to study environmental pilot policies implemented in batches. The traditional PSM-DID method only sets a single treatment point and causes a problem that the treatment point is not completely consistent with the actual point of the pilot policies and thus makes the evaluation results of policy effect inaccurate when applied to some pilot policies implemented in batches. In addition, a theoretical model of the relationship between environmental regulation and green technology innovation was hereby constructed by adding energy consumption as another key input factor into the traditional Cobb-Douglas production function model. With carbon emissions taken into account, this theoretical derivation is conducive to the interpretation of the increase in corporate green patents from the cost-effective perspective. Based on basic economic principles and assumptions, the theoretical derivation theoretically confirms the innovation compensation effect, thereby enriching the foundation of Porter's hypothesis theory in developing countries.
6.3Policy implicationsFirst, the mechanism and rules of ETS should be continuously improved, and the price discovery function of ETS should be enhanced. The national carbon market should be extended beyond the power generation industry to more sectors, such as the mining industry, the manufacturing industry and the construction industry, due to their favorable performance of low-carbon production through green innovation. Additionally, the government should accurately position the emission enterprises, strictly limit the quota ceiling and properly manage the quota allocation and the trading mechanism. Only environmental regulations stringent enough can stimulate enterprises to invest more in R&D, which makes R&D investment one of the effective positive influence mechanisms of the ETS on green innovations. Besides, it is advisable that developing countries should not only encourage enterprises to actively participate in the trading of carbon quotas, but also gradually increase the proportion of paid allocation in order to actively integrate into the global carbon emissions trading market.
Second, for different types of enterprises, carbon ETS policies should be designed according to their specific characteristics, so as to stimulate green technological innovation and maximize the incentives to invest in such innovation. For example, enterprises with small capital scales that engage in green technological innovation should be endowed with government subsidies, and a dynamically adjusted black and red list system should be established for the emission-control enterprises. Meanwhile, third-party certification institutions are needed to provide authoritative training, consulting and certification reports. The authorities are supposed to give timely commendations and honors to enterprises with good performance in carbon trading while punishing those failing to achieve the target, so as to set up a pioneering role for other enterprises. In addition, the spillovers of green technology should be encouraged between enterprises through investment and trade. Developing countries should divert their investment direction from traditional factors like land and labor towards green technologies, so as to help achieve high-quality development of the economy.
Third, other developing countries should take this study as a reference to find a feasible and sustainable path to low-carbon development through green innovation. At present, many developing countries and regions have set carbon neutral goals, but no carbon trading scheme has yet been correspondingly implemented. As it turns out, China's ETS has been proved effective in promoting green innovation in general, and the efficiency of several mechanisms in transmitting this effect has been confirmed. The realization of net-zero emissions requires long-term planning adjustment and strategic layout. The share of traditional fossil energy should gradually be tapered, and cost-effective decarbonization technology should be promoted. Moreover, enterprises in different countries should be encouraged to enhance their green technology spillover through international trade, cross-border mergers and acquisitions etc. In this case, the technical exchange and mutual learning between enterprises can form a virtuous circle worldwide and contribute to the acceleration of the pace of solving global climate problems.
7Limitations and future directionsThere are still some limitations of this study. First, due to the impact of the COVID-19 pandemic that erupted in 2020, we have to rule out the exogenous event in our study process of policy implementation. So this study dismisses this period and fails to obtain the latest research data. In the future, we can consider the effect of ETS policy in the context of COVID-19. Second, the research sample of this study only includes A-share listed firms because of the availability of panel data. However, the non-listed firms are excluded from the dataset, which may lead to sample selection bias. In the future, we can expand the sample size or use a sample of non-listed firms. Finally, as a mediating variable, the R&D expenditure covers the total inputs of both green and non-green innovation, thus making the mediating effect less precise. In the future, we will distinguish green-related investments from others and improve the research on the mediation mechanism effect.
FundingNational Natural Science Foundation of China (no. 71904059), the Major Programme of National Social Science Foundation of China (no. 21&ZD110), and the Qin Lan Project of the Jiangsu province.