


Environmental regulation forces many industrial sectors to explore alternative innovative compliance investments to internalize environmental externalities without hindering competitiveness. The impacts of air emissions associated with climate change and other global and local sources on health and ecosystems are a main concern. Under the Industrial Emissions Directive (IED), the European Union requires that industrial facilities obtain an operating permit linked to specific emissions levels that can be reached through application of the best available techniques (BAT). Some flexibility is allowed in the choice of these BATs, and in some cases, derogations can be obtained if a cost-benefit analysis (CBA) accounting for all private and social costs and benefits reveals that the BAT option results in disproportionate costs. CBAs depend on complex variables that are subject to a high degree of uncertainty, such as the social discount rate (SDR), the private weighted average cost of capital (WACC), and the value of the social or external costs derived from changes in air emissions. Through a case study comparing two alternative compliance options in a fictitious nonferrous metal plant (a BAT with disproportionate costs and a more cost-efficient and cost-effective derogation proposal), this study applied fuzzy-set qualitative comparative analysis (fsQCA) to improve the understanding of how the former uncertain variables affect the surplus net present value (SNPV) of the derogation option. The results can be considered by plant operators and policy-makers to design more transparent and balanced licensing processes, which can improve environmental protection without damaging economic competitiveness.
Environmental concerns are one of the main driving forces behind claims to achieve sustainable development (Méndez-Picazo, Galindo-Martín & Castaño-Martínez, 2021). Governments around the world have subscribed to the sustainable development goals (SDGs) under Agenda 2030 (Sanz-Ponce, Peris-Cancio & Escámez-Sánchez, 2018), and many sectors and industries are striving to develop new sustainable business models (David-West, Iheanachor & Umukoro, 2020). SDGs related to air quality and climate change stand out for their global and overarching nature and their dangerous effects on health, the man-made environment, society, and ecosystems (Bachmann, 2020; Bachmann & van der Kamp, 2014). Environmental regulation has been enforced in the form of command-and-control and market measures to reduce the emission levels associated with specific pollutants (Bachmann & van der Kamp, 2014), and their potential impact on innovation and competitiveness has attracted great research interest (Pettersson & Söderholm, 2014; Söderholm, Bergquist, Pettersson & Söderholm, 2021). This study is placed in the context of the Porter hypothesis on the positive relationship between environmental regulation and competitiveness and innovation (Porter, 1991; Porter & van der Linde, 1995), dealing with how to make environmental investment decisions that simultaneously contribute to high economic and environmental performance.
The european industrial emissions directive (IED), enforced in 2010, requires that industrial plants obtain an operational permit that defines their emission limits. It does not prescribe the use of a specific technique or technology but introduces the concept of best available techniques (BAT) (Vajda, 2016; Vázquez-Calvo, Giner-Santonja, Alonso-Fariñas & Morillo-Aguado, 2021), defined as “the most effective and advanced stage in the development of activities and their methods of operation which indicates the practical suitability of particular techniques providing the basis for emission limit values and other permit conditions designed to prevent and, where that is not practicable, to reduce emissions as a whole” (European Parliament, 2010). The BATs for each category of activity and the associated emission levels (BAT-AEL) are listed in a reference document known as the BREF document (Reference Document on BATs) (Giner-Santonja, Vázquez Calvo & Rodríguez Lepe, 2019). Less stringent emission limits can be set (derogation) if it becomes clear that achieving BAT-AELs would entail disproportionately high costs compared with the environmental benefit (Bachmann & van der Kamp, 2014; Pettersson & Söderholm, 2014). These derogations should, in any case, avoid causing significant pollution and contribute to achieving a high level of protection of the environment as a whole (Masnicki, 2018).
Both the licensing and derogation processes under the IED have been considered unpredictable, nontransparent, and uncoordinated across competent authorities (Pettersson & Söderholm, 2014; Söderholm et al., 2021), and a more balanced approach to the application of the BAT conclusions has been demanded (Masnicki, 2018). Previous literature on BATs has mainly focused on their technical and environmental issues, while the economic analysis of the decision to invest in emissions abatement has received little attention. This is mainly due to the difficult valuation of the external (environmental) costs and benefits that should be included, together with private costs, under a Cost-benefit analysis (CBA). These external costs and benefits require the estimation of damage costs and an uplift factor that are difficult to value in monetary terms and are subjected to big uncertainties. Among the private costs, financial costs have been somewhat disregarded in previous research, without considering the effects of deciding on different financing sources (mainly equity or debt) to fund environmental private investments. Moreover, estimation of a Net Present Value (NPV) in a CBA requires deciding on the proper social discount rate (SDR) to apply, which is a highly controversial issue with intergenerational equity implications. Thus, it can be seen how all these variables involved in a CBA are subjected to great uncertainty and some degree of arbitrariness, subjectivity and discretionary choices both by plant operators and policymakers. This creates a complex context to make decisions that hinder the predictability, transparency and uniformity of the granting of derogations.
This study is aimed at highlighting important issues to consider by both public authorities and plant operators in the economic evaluation of BAT investments and derogation alternatives, suggesting how an innovative combination of analytical methods can help in delimiting the value of important parameters and designing more cost-effective and cost-efficient emission abatement strategies. The main contribution of this study is to reveal how these parameters interact through complex relationships. These complex relationships create flexibility for plant operators to justify alternative environmental compliance alternatives, and demand clearer and more concrete guidelines from public authorities on how to carry out their economic evaluation, guaranteeing a balance between economic and environmental objectives.
The empirical approach starts with the development of a CBA on two alternative compliance options in a fictitious industrial plant (investing in a BAT that results in disproportionate costs or applying for a derogation to achieve relevant emission reductions through more cost-efficient and cost-effective investments). A Monte Carlo simulation is run to create alternative valuation scenarios. These scenarios are then treated as cases in a fuzzy-set qualitative comparative analysis (fsQCA) to identify the most relevant antecedents or conditions of the surplus NPV (SNPV) created by the alternative and most economically efficient derogation option (compared to the BAT option with disproportionate costs), and to verify how high and low levels of the conditions (CBA parameters) can be combined in alternative configurations leading to the same outcome (high or low SNPV). The results confirm the important role of financial private costs measured through the weighted average cost of capital (WACC) and revealed the complex relationship between the decision to invest in alternative compliance options (BATs or derogations) and the appropriate SDR to apply, the monetary valuation of externalities (damage costs) and their evolution over time (uplift factor). Policy-makers should account for this complexity and the uncertainty implicit in the CBA required to apply for a derogation, attempting to set clearer criteria and to guarantee competitiveness and keep industrial installations operative (Masnicki, 2018). Plant operators can explore the combination of CBA, Monte Carlo simulation and fsQCA to justify a derogation application, identify the factors that condition a higher NPV of a derogation option and use these results to design a better derogation proposal.
The rest of the paper is organized as follows: Section 2 reviews previous literature and formulates some propositions to be tested regarding the relationship between the main variables involved in a CBA to decide on the best compliance option and the final decision. Section 3 presents the case study and the main methodological aspects of the research. Section 4 builds on the presentation and analysis of results. Section 5 develops the discussion and Section 6 the conclusions, implications, limitations and future development of the research.
Literature review and propositionsThe impact of environmental regulation on competitiveness and innovation has been evaluated in past research under the Porter hypothesis, proposing that well-designed regulation increases innovation and improves both environmental and economic performance (Pettersson & Söderholm, 2014; Söderholm et al., 2021). In a recent study, Venmans, Ellis and Nachtigall (2020) confirmed no significant effect of carbon pricing on competitiveness, although they acknowledge that this can change with the increase in CO2 allowance prices and the end of free allocation to companies. Innovation is a fundamental element for economic development that should be viewed both as a process and as an outcome (Saunila, 2020). Economic and sustainability innovation can be reached simultaneously through open innovation (Rauter, Globocnik, Perl-Vorbach & Baumgartner, 2019) and the existence of a virtuous circle between the sustainable demand of products and sustainable manufacturing (Ilg, 2019). However, Bae (2017) verified that pollution control efforts relying on public pressure are reduced when economic conditions are hard (unemployment, plant closings). Therefore, no general agreement has been reached on the impact of environmental regulation on competitiveness and innovation, and abatement costs are acknowledged to be significant (Pinto, Szklo & Rathmann, 2018). Regulators have tried to increase flexibility to comply with environmental regulations through alternative developments. The identification of BATs and the possibility of applying for derogations are the most outstanding.
Previous literature on BATs has primarily focused on developing multicriteria decision models for the selection of BATs or the analysis of AELs at the sector or facility level (Ancora, Zhang, Wang, Schreifels & Hao, 2016; Dellise, Villot, Gaucher, Amardeil & Laforest, 2020; Giner-Santonja et al., 2019; Telenga-Kopyczyńska & Jonek-Kowalska, 2021). Economic criteria involve the monetization of both private and social or external costs and benefits, yet the latter have been frequently disregarded. Even those studies that have performed a CBA to analyze or compare BATs or other environmental improvement investments (Bartela, Gładysz, Andreades, Qvist & Zdeb, 2021; Wu & Lin, 2021; Zis, Angeloudis, Bell & Psaraftis, 2016) have quite often only considered private costs and savings. Few studies have included also social costs in the economic assessment of air pollution reduction measures (Ćetković, Lakić, Žarković, Đurović & Vujadinović, 2021). To the best of our knowledge, only one previous study has applied CBA to evaluate the application for a derogation (Bachmann & van der Kamp, 2014). But their study does not conduct any sensitivity analyzes and is primarily focused on explaining the process of monetizing environmental impacts as external costs. Moreover, none of these studies has paid specific attention to the high uncertainty affecting different CBA variables, such as the private financial costs to be assumed by operators (measured through the weighted average cost of capital or WACC), the social discount rate (SDR) to apply in the calculation of the NPV or the monetization of the external or social costs of air emissions.
Few previous studies have approached the issue of which is the better financial resource to fund environmental investments. The use of debt or equity has important implications in terms of financial costs and different levels of control and decision rights (Anyangah, 2010), with equity assumed to bear higher financial costs than debt and being associated with greater managerial freedom. BAT compliance options are usually capital intensive and imply high capital expenditures (CAPEX). Scarpellini, Marín-Vinuesa, Portillo-Tarragona and Moneva (2018) and Aranda-Usón, Portillo-Tarragona, Marín-Vinuesa and Scarpellini (2019) found that most companies finance eco-innovation, eco-design or similar investments with their own funds. A higher WACC derived from a greater proportion of equity in the capital structure of a BAT investment would contribute to its economic inefficiency and favour alternative compliance options with lower CAPEX. However, this is not straightforward since the surplus NPV will also depend on the SDR and other variables. Therefore, the first proposition to be tested through fsQCA is formulated as follows:
Proposition 1 A high WACC is present in configurations leading to a high surplus NPV justifying a derogation but is not sufficient to create this outcome.
Defining an SDR is a complex issue, and there is much debate around the appropriate SDR to apply in the evaluation of investments related to environmental goods (Bachmann & van der Kamp, 2014; Cordes, 2017). This finding is related to the consideration of intergenerational equity reasons (Sáez & Requena, 2007), since higher SDRs imply heavily discounting the future (Cordes, 2017) and making future generations' preferences count less than our present ones (Sáez & Requena, 2007). While some argue that future environmental values should not be discounted, others defend the need to discount proposing alternative solutions such as applying a decreasing or different rate to social benefits and private costs (Bachmann, 2020; Sáez & Requena, 2007). The choice of an SDR greatly conditions decision-making in selecting one project over another (Thomas & Chindarkar, 2019). In the context of this study and considering a positive and constant SDR and that higher SDRs negatively affect compliance options with higher private and social benefits (cost savings in the context of this study), a second proposition was defined:
Proposition 2 A low SDR is present in configurations leading to a high surplus NPV justifying a derogation but is not sufficient to create this outcome.
The final most controversial issue in conducting a CBA involving environmental assets (air quality in this case) is the valuation or monetization of the external or social costs and benefits associated with changes in those environmental goods. Externalities are defined as impacts that affect an economic and social group but are not accounted for or compensated by the producer (Bachmann & van der Kamp, 2014). External costs, or damage costs, are the monetary value of externalities (Ravina, Panepinto & Zanetti, 2018). Environmental regulation can use market mechanisms to force companies to internalize those external costs (e.g., through emission allowances or taxes), creating a market price for those externalities (Bachmann & van der Kamp, 2014). However, most of these externalities have non-observable market prices. Different methodologies have been formulated for the valuation of externalities, with marginal damage costs being the best fit for the CBA valuation framework (Bachmann, 2020; Bachmann & van der Kamp, 2014). One of the most recognized approaches to value externalities is the impact pathway approach, first developed within the European ExternE project, based on following the pathway from source emissions via quality changes of air, soil, and water to physical impacts (Ravina et al., 2018). There are high uncertainties related to these methods (Bachmann, 2020; Ravina et al., 2018). Uncertainty (volatility) also affects those externalities with a market price, such as emissions allowances under the European CO2 emissions trading scheme, affecting the profitability of alternative investment options (Hnydiuk-Stefan, 2019). Moreover, all the methodologies applied in the valuation of damage costs are based to a greater or lesser extent on the analysis of the individual preferences of the population and its willingness to pay for higher environmental quality, which should increase over time due to the improvement of living standards. Therefore, it is common practice to consider an uplift factor for damage costs corresponding to future years. In this way, the valuation of externalities in a CBA depends on two main factors: the estimated damage cost for each pollutant (e.g., CO2, SO2, NOX) and the uplift factor considered to increase the damage cost over time. Assuming that a derogation proposal should be focused on achieving similar or higher environmental protection than the BAT option, a higher valuation of their social costs and benefits associated with air emissions should result in a higher NVP of the derogation option. Two propositions are defined:
Proposition 3 Higher damage costs are present in configurations leading to a high surplus NPV justifying a derogation but are not sufficient to create this outcome.
Proposition 4 A high uplift factor is present in configurations leading to a high surplus NPV justifying a derogation but is not sufficient to create this outcome.
However, an interesting issue to consider when accounting for the environmental performance obtained through an environmental investment is that different compliance options can have different impacts on different pollutants. In fact, many emissions reductions are obtained as co-benefits from the application of compliance investments related to specific pollutants (e.g., reduction in mercury emissions associated with processes implemented to reduce CO2 emissions, see Ancora et al., 2016). In the specific case of the analysis of derogations, compliance options alternative to BATs may imply these co-benefits and even a trade-off of environmental benefits between the BAT and the derogation options. A relevant question arises around the convenience of focusing on abatement measures with a greater impact on the reduction in emissions with higher damage costs. Therefore, it is interesting to analyze the interactions between alternative pollutants and how they relate to the surplus NVP of derogation over a BAT. No specific proposition was defined to test this process. Instead, an exploratory approach was adopted to analyze how a different assessment of damage costs on different pollutants can determine the higher surplus NPV of a derogation compared with a BAT compliance option.
MethodCase studyThis research adopts a case study perspective considering alternative investments in emissions abatement technologies in a nonferrous metal factory, to evaluate their cost efficiency through the NPV obtained in a CBA. Since the assessment of environmental impacts needs to be placed in a specific geographical or local context and related to a specific manufacturing activity, this study is focused on the production of aluminium in a fictitious facility placed in Spain. The case study is built on the experience acquired by the authors in the development of different research projects in industrial plants to assess the feasibility of environmental investments. Technical and economic data were defined with the advice of experts and managers of similar facilities and considering the descriptions of industrial processes contained in the related BREF document (Cusano et al., 2017). The plant does not currently meet the BAT-AELs associated with BAT 60 concerning fluoride and dust (particulate matter or PM) emissions. To renew its IED permit conditions, installation of a dry scrubber is required as BAT to replace its current wet scrubber at a specific emission point. The high CAPEX associated with this investment motivates the consideration of alternative measures to achieve a similar or higher environmental performance, applying for derogation. These alternative measures involve retrofitting the plant to use natural gas instead of fuel oil and installing starbags in other plant sections. This process enables reductions in emissions of fluoride, PM, and other pollutants (SO2, NOX, CO2), similar or higher than those that would be obtained by installing the dry scrubber, allowing for compliance of the BAT-AEL in global computation in the whole plant and at lower investment and operation and maintenance costs. Therefore, this is a potential derogation to the IED that guarantees a high level of protection of the environment as a whole.
Appendix A reflects the technical and economic detailed data related to the expected effect (reduction) on air emissions and the private costs (capital and operating expenditures) of the two alternative compliance options considered. The next section and Appendix B provide more detailed information on how the potential values of the other parameters (WACC, SDR, damage costs and uplift factor) involved in the CBA of the two alternatives and the Monte Carlo simulations were defined. These parameters are, then, presented as conditions for the fsQCA in the last section, where the alternative models to test the effect of these conditions on the defined outcome (SNPV) will be specified.
Cost-benefit analysis (CBA)The analysis of investment decisions related to environmental assets has traditionally been approached through the CBA methodological framework. CBA is considered a relevant tool in environmental public and private decision-making (Alam, 2008; Feuillette et al., 2016; Pearce, Atkinson & Mourato, 2006) because it sets the decision to spend scarce public or private financial resources under a social accounting framework (Cordes, 2017). It has been applied to many different fields (Pascal et al., 2018; Paulrud & Laitila, 2013; Piñeiro-Chousa, López-Cabarcos, Romero-Castro & Vázquez-Rodríguez, 2021), but its presence in the scientific literature related to IED derogations is practically non-existing.
In a CBA on environmental investments, all the relevant private and social benefits and costs should be estimated and included in the analysis, requiring the valuation of environmental goods or services that have no market value (Pascal et al., 2018; Pearce et al., 2006). To conduct this study, various CBA frameworks were taken as a reference, some specifically related to the IED and the analysis of the proposals for derogations to the IED (EA (Environment Agency), 2017; EPA (Environment Protection Agency), 2016; European Commission, 2006, 2015; HM Treasury, 2018). The economic valuation of the different abatement alternatives includes:
- The private or internal costs or benefits: those that have a direct impact on the company, including the investment costs in the technologies or assets that make it possible to comply with the BAT-AELs (costs of acquisition of equipment, installation and start-up, opportunity costs, financing costs, etc.), and operation and maintenance costs (personnel, materials consumption, energy, etc.) in incremental terms compared to the business-as-usual (BAU) situation (higher or lower costs), in addition to any additional benefits (savings or higher income) that may derive from the options considered. Appendix A explains how the private costs and benefits of the two alternative compliance options considered were defined based on data from experts and Cusano et al. (2017).
- The social or external costs or benefits: specifically, those focused on assessing the impact on the environment and health of changes in emissions into the atmosphere derived from the options considered compared to the BAU situation. Estimates of the damage costs associated with the emissions of various types of pollutants (SO2, NOX, fluoride, particles and CO2) have been generated from various sources of proven quality and solvency (de Bruyn et al., 2010; EA (Environment Agency), 2017; EEA (European Environment Agency), 2014; Institute of Energy Economics and Rational Energy Use (University of Stuttgart), 2020). Appendix B provides further explanations on how these values were derived from these sources, distinguishing between central values, applied in the base case CBA, and minimum and maximum values that are considered to create uniform probability distributions for each pollutant damage cost to be introduced in the Monte Carlo simulation tool.
With all the estimations on benefits (B), costs (C), and investments (I), the NPV of the two considered compliance options (BAT and derogation) was calculated as the discounted value of the annual cash flows (CF) at the SDR (Eq. (1)). In addition to other private and social costs, ΔCt includes the private financial costs (which depend on the WACC), while both ΔCt and ΔBt include the social costs or benefits derived from changes in air emissions, which depend on the uplift factor and the value of the damage costs.

For the discounting of the CFs, a real SDR of 5% was considered following Campos, Serebrisky and Suárez-Alemán (2015), who reported a 4%−6% range for the SDR employed by the Spanish government in the evaluation of investment projects across different sectors. Accounting for the debate on the convenience of applying higher or lower SDRs, a range of 2.5%−7.5% was set to perform the simulation analysis.
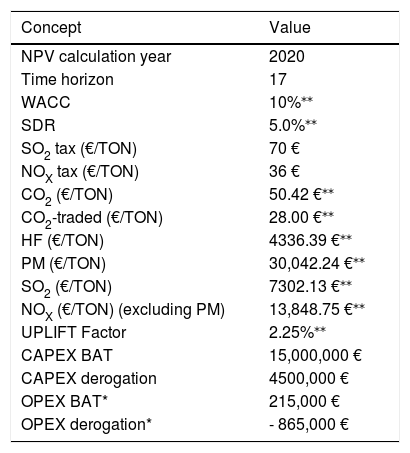
Table 1 summarizes all the estimates and parameters considered to perform the CBA of the BAT and derogation options.
Parameters and input data for the CBA.
| Concept | Value |
|---|---|
| NPV calculation year | 2020 |
| Time horizon | 17 |
| WACC | 10%⁎⁎ |
| SDR | 5.0%⁎⁎ |
| SO2 tax (€/TON) | 70 € |
| NOX tax (€/TON) | 36 € |
| CO2 (€/TON) | 50.42 €⁎⁎ |
| CO2-traded (€/TON) | 28.00 €⁎⁎ |
| HF (€/TON) | 4336.39 €⁎⁎ |
| PM (€/TON) | 30,042.24 €⁎⁎ |
| SO2 (€/TON) | 7302.13 €⁎⁎ |
| NOX (€/TON) (excluding PM) | 13,848.75 €⁎⁎ |
| UPLIFT Factor | 2.25%⁎⁎ |
| CAPEX BAT | 15,000,000 € |
| CAPEX derogation | 4500,000 € |
| OPEX BAT* | 215,000 € |
| OPEX derogation* | - 865,000 € |
All costs and benefits (investment, operation, and external) are presented in real terms (€2020) without considering the effect of inflation. Consequently, the appropriate interest rates to determine both the financial costs of investments and the present value of future costs or benefits are also rates in real terms.
After obtaining a first NPV calculation for each compliance option based on the central values considered for the damage costs, WACC, SDR and uplift factor, two Monte Carlo analyzes with 1000 iterations were run with Crystal Ball Excel add-in to create the cases to be analyzed through fsQCA. Monte Carlo simulations are usually applied to perform a risk assessment on the calculation of a project's NPV (Deng et al., 2013). Taking the surplus NPV (SNPV in Eq. (2)) as the target result, a first simulation (SNPV1) considered SDR, WACC, uplift factor and a multiplying factor as uncertain variables that move all the damage costs between their minimum and maximum values. A second simulation (SNPV2) considers as uncertain variables only the six damage costs involved in the analysis (HF, CO2, CO2-traded, PM, NOX-PM and SO2), defining uniform probability distributions around their respective minimum and maximum values. Each simulation provided 1000 scenarios that are treated as observations or cases in alternative fsQCA model specifications.
Fuzzy-set qualitative comparative analysis (fsQCA)
Charles Ragin (1987, 2000, 2008) proposed qualitative comparative analysis (QCA), based on Boolean algebra, to identify combinations of causal conditions (configurations or paths) that are necessary or sufficient to explain a specific level of an outcome (Fiss, 2007, 2011). Although QCA was originally proposed to conduct small-N studies, its application to larger N studies is widely acknowledged (Fiss, 2011; Ott, Williams, Saker & Staley, 2019; Slager, 2012) and has contributed to its increased use in management research (Roig-Tierno, Gonzalez-Cruz & Llopis-Martinez, 2017). fsQCA has been applied to the study of very different areas (Damian & Manea, 2019; Kusa, Duda, & Suder, 2021; Maggetti, 2014; Muñoz & Cohen, 2017; Ott et al., 2019), but to the best of our knowledge, it has not been applied in the analysis of environmental investment decisions yet.
As shown in Table 1, the parameters considered in the CBA as more subject to uncertainty and discretionary choices are taken as conditions to analyze their relationship with the SNPV through fsQCA. These conditions are WACC, SDR, damage costs’ uplift factor and the damage cost estimates related to six types of emissions: hydrogen fluoride (HF), nitrogen oxide free of particulate matter (NOX-PM), particulate matter (PM), sulphur dioxide (SO2) and carbon dioxide, distinguishing between its shadow price (CO2) according to The World Bank estimates, and the market price of CO2 emission allowances (CO2-t).
To assess the degree of membership of each observation or case in each set of conditions and outcomes, a calibration process is conducted based on continuous fuzzy sets with membership scores ranging from 0.0 to 1.0 (Ragin, 2008; Schmitt, Grawe & Woodside, 2017). Emmenegger, Schraff and Walter (2014) suggest that calibration with percentiles can be an adequate strategy for continuous variables, while for categorical data calibration should be based on theoretical and contextual knowledge. Given that all conditions and outcomes are continuous variables in this study, calibration is performed with the help of the calibration function provided by fsQCA 3.0 software (Ragin & Davey, 2017), using the 75th, 25th and 50th percentiles (Muñoz & Cohen, 2017; Tóth, Thiesbrummel, Henneberg & Naudé, 2015) to determine for full membership (score of 1), full nonmembership (score of 0) and the crossover or point of maximum ambiguity (score of 0.5), respectively. Pappas and Woodside (2021) consider that the choice of direct calibration leads to more rigorous studies which are easier to be replicated and validated.
To decide which paths to include in the final fsQCA solution (Skarmeas, Leonidou & Saridakis, 2014), this study sets the recommended cutoff consistency to 0.8 (Ragin, 2008) and a minimum frequency of 5 cases to identify sufficiency solutions using the truth table algorithm of the fsQCA 3.0 software. This frequency threshold ensures that after deleting all causal combinations where there are fewer than 5 cases, at least 80% of all cases were retained as recommended by Ragin (2008). A condition is considered necessary when its consistency value was above 0.9 (Fiss, 2007; Ragin, 2008; Schneider & Wagemann, 2012).
A solution consistency above 0.75 is usually the minimum acceptable value (Ragin, 2008). The exploratory nature of this study and the high uncertainty affecting the causal conditions considered advice against making simplifying assumptions to create parsimonious and intermediate solutions based on easy and difficult counterfactuals, so the complex solution was chosen to report the results (Fotiadis, Yeh & Huan, 2016; Skarmeas et al., 2014).
Following Slager (2012), necessity and sufficiency analyzes were developed both concerning the presence or absence of a high SNPV, respectively identified as SNPV and ∼SNPV, where “∼” represents the absence of a condition or outcome. The two simulations create two alternative sets of cases, so the necessity and sufficiency analyzes were performed four times on four outcomes through the fsQCA 3.0 estimation software Ragin & Davey, 2017). Regarding the sufficiency analysis, Eqs. (3) and ((4) correspond to Models I and II concerning the presence or absence of a high SNPV1, and Eqs. (5) and (6) correspond to models III and IV concerning the presence or absence of a high SNPV2. Letters “fs” indicate that the fuzzy-set calibrated values of both outcomes and conditions are considered.
Analysis and results


This section first presents the results of the CBA for the two alternative compliance options considered (BAT and derogation) and for the two Monte Carlo simulations run. Then, the fsQCA results on each set of cases are presented.
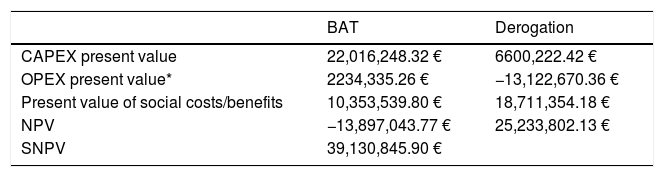
CBA and simulation resultsAccounting for the private and social costs and benefits of the BAT investment and the derogation alternative, the CBA revealed a negative NPV (−13,897,043.77 €) for the BAT option and a positive value (25,233,802.13 €) for the derogation option, resulting in an SNPV of 39,130,845.90 €. Table 2 summarizes the main components of these results. Therefore, the BAT compliance option shows disproportionate costs that could justify the concession of a derogation based on alternative investments that derive higher social benefits at lower private costs.
CBA results of the two compliance options.
| BAT | Derogation | |
|---|---|---|
| CAPEX present value | 22,016,248.32 € | 6600,222.42 € |
| OPEX present value* | 2234,335.26 € | −13,122,670.36 € |
| Present value of social costs/benefits | 10,353,539.80 € | 18,711,354.18 € |
| NPV | −13,897,043.77 € | 25,233,802.13 € |
| SNPV | 39,130,845.90 € | |
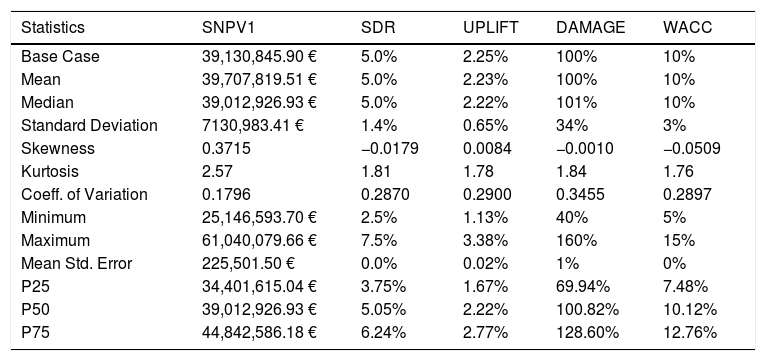
Building on this base scenario, a first Monte Carlo simulation with 1000 trials was performed considering four uncertain variables: WACC, SDR, uplift factor and a multiplying factor that ranged between 40% and 160% and was applied to the central values estimated for the damage costs associated with air emissions. The SNPV (SNPV1) was always positive, ranging between a minimum value of 25,146,593.70 € and a maximum of 61,040,079.66 €. The second Monte Carlo simulation considers the six damage cost estimates as uncertain variables. The SPNV (SNPV2) was also always positive, yet the range revealed by the 1000 iterations was narrower (29,416,299.47 €–48,847,975.91 €) since the values of the WACC, SDR and uplift factor remain constant in their base estimates in this case. Appendix C includes a detailed summary of results from the two simulations performed, also showing the 25th, 50th and 75th percentiles applied in the calibration of the variables through the fsQCA 3.0 calibration function and descriptive statistical data on the calibrated variables.
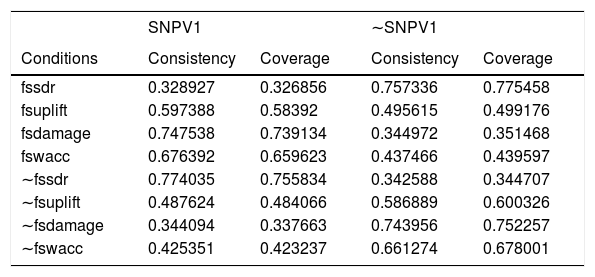
fsQCA resultsAfter calibrating the data, the analytical phase is entered, conducting a necessity and a sufficiency analysis (Maggetti, 2014). The necessity analysis on the four conditions considered in the first simulation (Table 3) revealed that none of them was necessary for either the presence or the absence of a high SNPV1, since none reaches a consistency of 0.9.
Analysis of necessary conditions for the presence or absence of a high SNPV1.
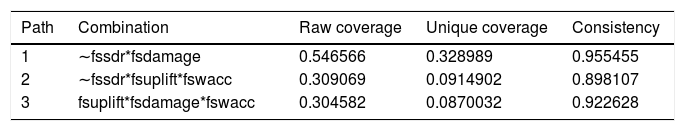
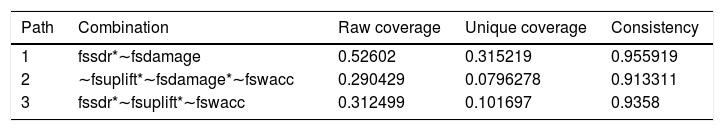
Tables 4 and 5 show the results of the complex solutions from the sufficiency analysis on the presence (Model I, Eq. (3)) and absence (Model II, Eq. (4)) of a high SNPV1. Solution consistency and coverage were high in both models: respectively, 0.900 and 0.725 in Model I, and 0.911 and 0.707 in Model II. Three paths were included in each model's solution, and they were mirror opposites. This concept was quite straightforward since the outcome was related to the conditions through a mathematical model. Thus, the results are jointly analyzed for the two models’ solutions. It is concluded that the more cost-efficient and environmentally sound derogation option can be the most valued option (Model I, high SNPV1, Table 4) under different combinations of conditions: in path 1 (exhibiting the higher consistency and raw coverage) higher damage costs that consider more pathways of impacts on health and ecosystems were combined with lower SDRs that imply a lower discounting of environmental benefits in the future; in path 2 (consistency 0.898, raw coverage 0.309) higher damage costs were not needed since the combination of a high uplift factor with a low SDR and a high WACC (that penalizes the more capital intensive BAT option) also favour the derogation alternative; and in path 3 (consistency 0.923, raw coverage 0.305) a low SDR was not necessary since the derogation option was favoured by the combined effect of applying in the CBA higher damage costs, uplift factor and WACC.
Complex solution for the presence of a high SNPV1 (Model I).
solution coverage: 0.725061.
solution consistency: 0.89927.
Complex solution for the absence of a high SNPV1 (Model II).
solution coverage: 0.707345.
solution consistency: 0.910883.
The mirror opposite conclusions can be derived from the analysis of the results for Model II (low SNPV1, Table 5).
Moving to the second set of cases derived from the Monte Carlo simulation, that considers the six damage cost estimates as uncertain variables to derive alternative SNPV2 calculations, the necessity analysis (Table 6) again shows that no condition was necessary to produce either the presence or absence of a high SNPV2, since none exceeds a consistency of 0.9. However, it is worth noting that the highest consistency value corresponds to the damage cost for SO2, with a higher value favouring the derogation option (consistency of 0.860 for the presence of a high SO2 related to the presence of a high SNPV2) and a lower value favouring the BAT option (consistency of 0.844 for the absence of a high SO2 related to the absence of a high SNPV2). This is due to the increase in SO2 emissions associated with the BAT options, which involves the substitution of a wet scrubber to install the dry scrubber.
Analysis of necessary conditions for the presence or absence of a high SNPV2.
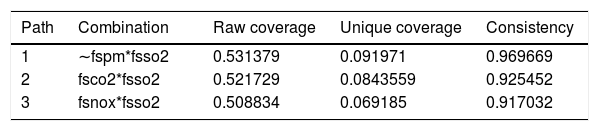
Tables 7 and 8 show the results of the complex solutions from the sufficiency analysis on the presence (Model III, Eq. (5)) and absence (Model IV, Eq. (6)) of a high SNPV2, with high consistency and coverage in both models: respectively, 0.904 and 0.804 in Model III, and 0.885 and 0.841 in Model IV. The alternative paths included in both solutions revealed the important role played by the damage cost of SO2, as derived from the necessity analysis, so it seems to be a ‘quasi’ necessary condition since it is present in all the combinations of conditions leading to a high SNPV2 and four of the six leading to a low SNPV2. To favour the derogation option (Model III, Table 7), a high SO2 damage cost can be combined with either a low PM in path 1 (since PM reductions were higher in the BAT option), a high shadow price of CO2 in path 2 or a high NOX damage cost in path 3 (since the BAT alternative does not affect CO2 and NOX emissions). The three paths show high raw coverages above 0.5 (0.531 for path 1, 0.522 for path 2 and 0.509 for path 3). It is interesting to note that the HF damage cost does not appear in any configuration favouring the derogation option since both compliance alternatives derive similar effects on HF emissions.
Complex solution for the presence of a high SNPV2 (Model III).
| Path | Combination | Raw coverage | Unique coverage | Consistency |
|---|---|---|---|---|
| 1 | ∼fspm*fsso2 | 0.531379 | 0.091971 | 0.969669 |
| 2 | fsco2*fsso2 | 0.521729 | 0.0843559 | 0.925452 |
| 3 | fsnox*fsso2 | 0.508834 | 0.069185 | 0.917032 |
solution coverage: 0.804453.
solution consistency: 0.903657.
Complex solution for the absence of a high SNPV2 (Model IV).
solution coverage: 0.841417.
solution consistency: 0.885107.
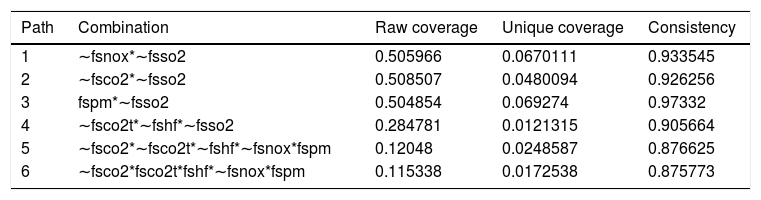
The analysis of the conditions leading to a low SNPV2 (Model IV, Table 8) revealed 6 different paths that involve low damage cost estimates for all the emissions considered except for PM (higher reductions in the BAT option benefited from a higher value of the associated damage cost). Both high and low damage costs of HF and CO2 emission allowances (CO2t) are present in different paths. Paths 1, 2 and 3 are the natural mirrors opposite of the three paths in Model III, showing similar raw coverages above 0.5. Paths 4, 5 and 6 include more sophisticated configurations (3 or 5 conditions involved) but show lower raw coverages. Path 4 (consistency 0.906, coverage 0.285) indicates that low damage cost estimates for SO2, HF and CO2 emission allowances favour the BAT option, since it generates an increase in SO2 emissions and a lower HF reduction compared with the derogation alternative, and it does not have any significant impact on the private costs of the plant (purchase of CO2 emission allowances). Path 5 (consistency 0.877, raw coverage 0.120) also involves a low price of CO2 emission allowances and a low HF damage cost estimate, but instead of combining them with a low SO2 damage cost, it shows high PM, low NOX and low CO2 damage costs. Path 6 (consistency 0.876, raw coverage 0.115) may be more interesting since it combines high values of the HF damage cost and CO2 emission allowance price, showing that although the BAT option generates lower HF reductions and no relevant impact on CO2 emissions that could lower the associated private costs (purchase of emission allowances), the higher reduction in PM compensates for the reductions of CO2 and NOX of the derogation option thanks to a low valuation of their associated damage costs.
As a robustness test, an alternative calibration method with percentiles 90th, 10th and 50th was tried, yielding the same configurations or paths and similar consistency and coverage values.
DiscussionAlthough a CBA analysis of the two alternative compliance options considered yields a clear indication of the disproportionate costs of the BAT investment and the more cost-efficient profile of the proposed derogation, it must be acknowledged that these results depend on the previous estimations made on the different parameters involved in the CBA, which are subject to great uncertainties and discretionary choices of the plant operators, and which can be interrelated in a complex way.
The fsQCA results verify the compliance with the four main tenets of complexity theory (Kusa, Duda, & Suder, 2021; Pineiro-Chousa, Romero-Castro & Vizcaíno-González, 2019; Ragin, 2008), highlighting how different combinations of conditions (estimates of the different variables involved in the CBA) can lead to the same outcome (equifinality) and how the same conditions can be both present and absent in a given outcome (asymmetry) and need the concurrence of other conditions (conjunctural causation). Moreover, in models III and IV the results also reveal that there is no straightforward combination of conditions that can be applied to favour either the BAT or the derogation option, since although some paths leading to a high SNPV are the mirror opposite of those leading to a low SNPV, others are not (causal asymmetry).
Regarding models I and II (that considers combinations of WACC, SDR damage costs and the uplift factor), it can be highlighted that a high (low) WACC is present in two of the three paths leading to a high (low) SNPV, but it is neither necessary nor sufficient to cause a specific outcome, confirming Proposition 1. A high WACC should be associated with a higher presence of equity in the capital structure to finance investments. Therefore, more equity financing favours the derogation option, and less equity financing favours the less cost-efficient and more capital-intensive BAT option. The role of the WACC is especially interesting, since it is, on the one hand, the result of the choices made by the company regarding its capital structure and, on the other, conditioned by the availability of capital in the financial system. Regulators should account for this realizing that BAT investment alternatives for environmental compliance need a supportive green finance environment. Although, as highlighted by Scarpellini et al. (2018) and Aranda-Usón et al. (2019), most companies rely on internal equity financing to fund environmental investments, and this favours the choice of more cost-efficient and cost-effective derogation options, a sustainable and green financial system could favour the implementation of BAT options that could imply better environmental performance.
A low (high) SDR is also present in two of the three paths leading to a high (low) SNPV, but it is again neither necessary nor sufficient to cause a specific outcome, confirming Proposition 2. A low SDR implies that future benefits and costs are valued higher than early benefits and costs and favour the derogation option, while high SDRs favour the BAT option, since the higher private costs of this more capital-intensive alternative weigh less in its NPV. This result confirms previous indications on the conditioning role of the SDR in the selection of alternative investments (Thomas & Chindarkar, 2019). It is necessary to note that the role of the SDR is dependent also on the total value of the external cost and benefits in the different alternatives, which depends in turn on the specific pollutants involved in each alternative. This makes interesting the analysis of Models III and IV to acquire a better understanding of how the different pollutants affected in the BAT and derogation options with a different intensity interrelate.
Following with the analysis of the results of Models I and II, higher (lower) dagame costs relate to higher (lower) SNPV and are neither necessary nor sufficient to create each outcome, so Proposition 3 is also confirmed. Damage costs are present in two of the three configurations under each model. High damage costs favour the derogation option combined with a low SDR or combined with a high uplift factor and WACC (paths 1 and 3 in Model I), while the mirror opposite configurations favour the BAT option (paths 1 and 2 in Model II). These results confirm the effect of the social costs of pollution on the profitability of alternative investment options. Although Hnydiuk-Stefan (2019) highlights this role concerning those externalities that have already been priced in the market, such as carbon, in a CBA it is also possible to include pollutants that do not yet have a market price.
Similar to damage costs, the uplift factor is also directly related to the valuation of the social costs or benefits derived from the investments and, logically, show the same effect: a higher (lower) uplift factor relates to higher (lower) SNPV1, yet is neither necessary nor sufficient for each outcome, confirming Proposition 4. A high (low) uplift factor is present in two of the three configurations, leading to a high (low) SNPV1.
Based on these results, a more cost-efficient and cost-effective derogation proposal can be favoured by choosing external (capital raising) or internal (retained results) equity finance that results in a higher WACC, or focusing on the reduction of those emissions with greater influence on the surplus NPV of the derogation option over the BAT option, either due to their higher reduction potential, higher damage cost, or higher uplift factor.
Regarding the results from Models III and IV, they illustrate how emission abatement strategies based on BATs or on alternative measures under a derogation proposal can rely on the co-benefits or trade-offs between different pollutants to favour one option or another. This analysis allows exploring alternative configurations of derogation options that may result in a high SNPV, justifying their approval by the authorities. In this case study, the plant conveniently counteracted in its derogation proposal the negative effect of the BAT on the SO2 emissions, considering a specific measure to reduce them and thus favouring the derogation option. This investment design can be combined with the same or other measures contributing to reductions in other pollutants (e.g., CO2 or NOX) also favouring the more cost-efficient derogation option.
These results confirm that the absence of clear and uniform (across EU member states) protocols to develop the CBA of a derogation option can allow plant operators to apply some degree of flexibility and discretionary judgment when making estimations about the four parameters involved, enabling them to favour the BAT or the derogation option with their CBA. They also show the difficult position of the competent authorities in the granting of derogations without a clear understanding of how the different parameters involved in the economic assessment of the investment alternatives interrelate. Plant operators can combine CBA, Monte Carlo and fsQCA to choose the most attractive environmental investments, either because they can be internally financed or because they focus on the reduction of those emissions with greater influence on the SNPV of the derogation option over the BAT option. fsQCA could in this way be a complementary tool for plant operators when designing their investment strategies and identifying the main target pollutants, considering their co-benefits and tradeoffs and their associated damage costs (since the same reduction in a different pollutant can create a higher external benefit due to a higher damage cost estimate). Competent authorities involved in the granting of IED operation permits and derogations can use these results to guarantee a better balance between improving air quality and making feasible the operation of the industrial plants concerned (Masnicki, 2018), setting clearer criteria on the SDR and the damage costs and uplift factor estimates to use in a CBA.
ConclusionWhereas one of the objectives of EU environmental regulation is not to damage competitiveness (Bachmann & van der Kamp, 2014), the analysis of the decisions to apply for a derogation and how this can be justified in economic terms seems particularly relevant. The main contribution of this study is related to the near absence of previous literature dealing with this specific topic and the scarce attention paid to the integral assessment of both private and social costs when conducting CBAs on environmental compliance investments. The lack of transparency and uniformity of derogation processes across the EU, the high uncertainties affecting how to value some of the parameters involved in the CBA, and the possibility of applying some kind of arbitrary or discretionary judgements when defining those values, create an interesting ground to acquire a better understanding of how a specific decision (invest in BAT or apply for a derogation) can be more or less economically efficient depending on how those parameters are valued and combined. This study has shown how fsQCA, combined with CBA and Monte Carlo simulations, allows exploring the interrelations between CBA parameters and the CBA results in a quite straightforward fashion, offering a complementary tool to make better-informed decisions to both plant operators and public authorities in charge of granting IED permits and derogations. fsQCA reveals how these parameters interact through complex relationships that create flexibility for plant operators to choose among alternative environmental compliance alternatives, and for public authorities that must decide on the IED permit and/or derogation concession searching for a balance between economic and environmental objectives.
The findings from the alternative fsQCA models explored allow to derive important implications for plant operators and public authorities. Plant operators facing the decision to invest in environmental compliance should consider the interactions between the different economic parameters involved in the economic appraisal of the compliance alternatives, mainly paying attention to how to finance investments, but also considering both the co-benefits and tradeoffs of the possible actions to improve their environmental performance. The possibility of allowing discretionary choices from plant operators that affect the CBA results should be limited fundamentally to the WACC and the specifically targeted pollutants under each investment alternative, considering the co-benefits and tradeoffs between their corresponding damage costs. The WACC depends on the specific financial structure configured to fund environmental compliance investments. Plant operators could opt for equity-based finance to favour less capital-intensive investments and resort to using debt if more capital-intensive investments are preferred. Regarding the consideration of co-benefits and trade-offs among pollutants, plant operators should explore through fsQCA their interactions to design cost-efficient and cost-effective investment strategies (based or not in BATs).
Similarly, the competent authorities involved in the concession of operating permits and/or derogations should acknowledge the sensitivity of the results of the CBA to the estimation of its economic parameters, and attempt to define better decision frameworks guaranteeing that preserving industrial competitiveness in a derogation does not imply environmental degradation, and inversely, that protecting the environment does not come at the expense of competitiveness (Masnicki, 2018). This should be mainly related to the establishment of clearer criteria on the SDR to be considered in the CBA of investments in environmental protection and the improvement of the reference frameworks for estimating damage costs and the uplift factor. There are many uncertainties and knowledge gaps regarding the impacts of pollution on health, ecosystem services, and their derived direct and indirect social and economic impacts, so more research is needed to reduce these uncertainties and knowledge gaps (Pascal et al., 2018). The considerable uncertainties that arise in the estimation of damage costs must also be accounted for (Bachmann, 2020). Moreover, the selection of an appropriate SDR must be based on a clear and transparent methodology (Campos et al., 2015). Policy-makers should also attempt to guarantee that the concession of derogations does not create regional inequalities, given that national implementation frameworks of the IED directive and flexibility mechanisms differ country by country (Bachmann & van der Kamp, 2014; Vázquez-Calvo et al., 2021). Licensing authorities should try to increase the predictability of licensing and derogation procedures (Söderholm et al., 2021). The European Commission is undertaking in 2021 an impact assessment of the IED that would result in a proposal for revision in early 2022. The combination of CBA, Monte Carlo analysis and fsQCA could facilitate the setting of more specific criteria to justify the disproportionate costs of BAT compliance options and the potentially more cost-effective profile of alternative abatement measures.
Regarding how to finance environmental investments, although this study suggests that this is a discretionary decision from plant operators, governments must also ensure that the financial system supports the specific demands of sustainability transitions (Naidoo, 2020). A robust green financial system channelling funds at competitive rates could support the economic viability of BAT compliance options and facilitate the balance between economic competitiveness and environmental protection. The role of public subsidies is also relevant. Policy-makers and plant operators could jointly work in the identification of the most cost-efficient compliance alternatives through models similar to the one proposed by Du, Wu and Jin (2019) in the context of public-private partnerships for sustainability.
One main limitation of this study is that the analysis is focused on two specific predefined compliance alternatives with a very clear economic and environmental profile: the BAT option is more capital intensive and involves high operating costs, while the derogation option shows lower CAPEX, relevant OPEX savings and a similar or higher improvement in the environmental performance of the plant that derives in higher environmental benefits (depending on the values chosen for the different dagame cost estimates). Future studies could work with a different set of alternatives involving similar CAPEX, OPEX, and similar environmental benefits/costs or apply a different approach to identify how an environmental solution could be designed to increase the cost-efficiency and cost-effectiveness of the possible pollution abatement measures to implement. As pointed out by Pascal et al. (2018), CBAs of environmental investments are complex exercises, and methods must still be consolidated. fsQCA was presented in this study as an interesting tool to inform this type of analysis and to acquire a better understanding of how the alternative parameters of a CBA interact to make one compliance option more interesting than others. CBAs could also be combined with real options theory to incorporate uncertainty into the assessment of the decision to invest in environmental compliance (Löfgren, Millock & Nauges, 2008; Piñeiro-Chousa et al., 2021).
The fictitious nature of the case study could also be considered a limitation. Nevertheless, it should be noted that all the economic data and technical parameters considered are based on real situations. Thus, the proposed fictitious case could be considered a quasi-real situation. Future research could try to show real case studies if possible due to confidentiality agreements. It would be interesting to analyze through fsQCA different cases of derogation grants, but acquiring and processing this data is complicated due to the absence of uniform criteria and updated databases. Another limitation could be related to the selection of the variables considered as subjected to uncertainty or discretionary estimation, since more variables could be included under this category. For instance, O'Mahony (2021) highlights the role of the time horizon for the analysis in CBAs. Future research could also consider this and other additional uncertain variables to explore through fsQCA how they affect and combine with other conditions to favour alternative environmental compliance options. Finally, an effort to define calibration points based on theoretical and contextual knowledge could be addressed by future research, based on the further development of this research topic that creates new empirical results on which to define alternative thresholds for full-set membership, full-set non-membership, and intermediate-set membership.
Table A.1 reflects the expected reduction in air emissions from the two compliance options considered (note that the dry scrubber generates an increase of SO2 emissions).
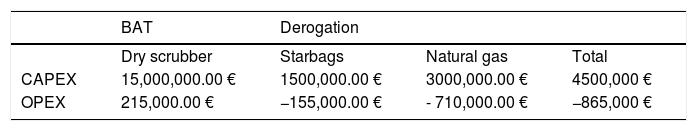
Table A.2 shows the private costs related to the two compliance options considered. In the case of the dry scrubber they include the investment cost corresponding to the turnkey contract, including both the necessary equipment (main and auxiliary) and the installation and start-up costs. Regarding operating costs, the maintenance cost was estimated as 3% of the investment (following the references found in the BREF document, pp. 1.143–1.146, with useful lives of assets of 15 years) and was reduced by the savings derived from the replacement of the old wet scrubber, partially compensated by an increase in electricity consumption, resulting in an annual OPEX of 215,000 €. Regarding the derogation alternative, the investment costs include new equipment, actions on existing equipment, and the costs of installation and start-up. In operating costs, maintenance costs were also estimated as 3% of the investment, yet the installation of the starbags generates savings derived from not having to change the filter bags so frequently, while the transformation to natural gas would mean savings in fuel oil consumption, resulting in a net annual savings (negative OPEX) of 865,000 €. Considering useful lives of 15 years for all the assets and a period of 2 years to implement all the abatement measures, the time horizon for the calculation of their NVP was set at 17 years. Investment costs were distributed across years 0 and 1, while the impacts on air emissions and the associated costs and benefits were accounted for once the investments have been completed (from year 2 to year 16).
Private costs of the investment alternatives (in €2020).
| BAT | Derogation | |||
|---|---|---|---|---|
| Dry scrubber | Starbags | Natural gas | Total | |
| CAPEX | 15,000,000.00 € | 1500,000.00 € | 3000,000.00 € | 4500,000 € |
| OPEX | 215,000.00 € | −155,000.00 € | - 710,000.00 € | −865,000 € |
Source: data from experts and Cusano et al. (2017).
Table A.2 does not reflect the values related to the financial cost of the investment or the private (internalized external) costs associated with CO2 emissions (purchase of emission rights) and SO2 and NOX emissions (some Spanish autonomous communities apply a tax on atmospheric pollution). The SO2 and NOX tax rates were set at 70 and 36 Euros per ton, respectively. The savings or higher costs that the changes in CO2 emissions would have on the purchase of CO2 emission rights were also computed based on their market price projection, as explained below.
Considering the financial cost of the investment, the Spackman approach was chosen (appropriate when a private company finances the investment, yet the benefits fall on the whole of society, which is the case in this study), in which the financial cost was integrated into the annualized investment cost throughout the project's time horizon. No residual value of any of the technologies was considered. Depending on the capital structure chosen (debt-to-equity ratio), the WACC in real terms could fluctuate in the 5%−15% range, setting the initial value considered in the CBA at the midpoint (10%).
External or damage costs were derived from the following sources:
- -
The Manual on Shadow Prices by de Bruyn et al. (2010), which provides estimates of reduction costs and damage costs for more than 400 types of pollutants valued at €2008 in the context of the Netherlands, as well as some estimates for the whole EU. To the best of our knowledge, this is the only source that estimates damage costs associated with fluoride emissions.
- -
Damage costs due to emissions from industrial facilities estimated by the Interdepartmental Group on Costs and Benefits (IGCB) of the UK Ministry of Environment, Food and Rural Affairs (DEFRA) (EA (Environment Agency), 2017), expressed in £2015. Central, maximum and minimum costs are provided. Table B.1 reflects central ones.
Table B.1.Damage costs from different information sources (per ton).
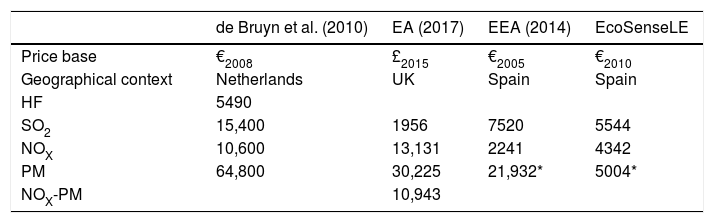
de Bruyn et al. (2010) EA (2017) EEA (2014) EcoSenseLE Price base €2008 £2015 €2005 €2010 Geographical context Netherlands UK Spain Spain HF 5490 SO2 15,400 1956 7520 5544 NOX 10,600 13,131 2241 4342 PM 64,800 30,225 21,932* 5004* NOX-PM 10,943 * As the arithmetic mean of PM 2.5 and PM 10.
- -
Damage costs estimated by the European Environmental Agency from the analysis of data obtained for all countries of the Union in the period 2008–2012, expressed in €2005 (EEA (European Environment Agency), 2014). Damage costs based on the application of the VOLY (value of one year of life) approach to assess impacts on health were considered, following the criteria of the IGBC-DEFRA.
- -
The damage costs of the EcoSenseLE tool (Institute of Energy Economics and Rational Energy Use (University of Stuttgart), 2020), associated with the European projects ExternE, NEEDS and CASES, which offers estimates for European countries in €2010.
Table B.1 details the values that have been extracted from the mentioned sources for the assessment of emissions of fluoride, PM, SO2 and NOX. The following remarks must be acknowledged:
- -
For the assessment of fluoride emissions, the cost of hydrogen fluoride (HF) damage, included in the study by de Bruyn et al. (2010), was taken as a reference.
- -
In the NOX assessment, the IGCB concludes that when NOX and PM emissions are assessed simultaneously in the same project, a lower damage cost attributable to NOX (NOX-PM) should be considered because there is an overlap in the health effects of both types of emissions.
- -
Concerning the damage costs due to PM emissions, while the study by de Bruyn et al. (2010) and EA (2017) refer globally to PM, the EEA (2014) or EcoSenseLE projects offer independent values for PM 10 and PM 2.5, so the arithmetic mean of both was taken.
Following the recommendations of these same studies, the values in Table B.1 were considered translatable to other contexts, both geographical and temporal, applying two main adjustments:
- For estimates referring to other countries, the differences in living standards and population density between different countries should be considered. Data from the World Bank statistics on the per capita gross domestic product (pcGDP), expressed in terms of purchasing power parity (PPP), were obtained for the Netherlands, UK and Spain for the 2005–2020 period. Since data was provided in USD2011, they were converted into Euros through the average 2011 exchange rate of 1.392 $/€ collected by the World Bank. Data on damage costs for the UK have been converted into Euros using the average exchange rate for 2015 (0.726 £/€). A correction factor of 0.85 was used to account for the income elasticity of the demand for higher environmental quality was applied (de Bruyn et al., 2010). Using this method, damage costs from de Bruyn et al. (2010) and EA (2017) were translated to Spain using Equation B.1.

- -
For the valuation of damages at different moments, the damage costs referred to different time bases were capitalized to 2020 through the Spanish implicit GDP deflators collected from the World Bank for the period 2005–2020.
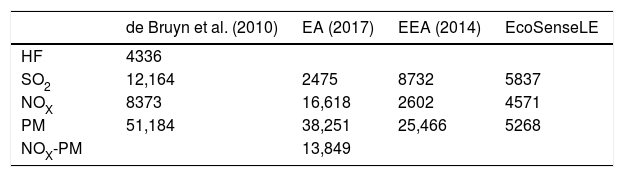
After these adjustments, the damage costs for Spain in €2020 were obtained and are reflected in Table B.2. Based on these estimates from different sources, average values were derived for each pollutant, which will be considered the base or central damage costs in the CBA of the BAT and derogation options analyzed in this study. Moreover, to perform simulation analyzes and create the cases to be analyzed through the fsQCA, maximum and minimum values were defined around the ranges considered in the consulted studies. Table B.2. summarizes these central, maximum and minimum damage costs.
Damage costs for Spain (€2020/T).
| de Bruyn et al. (2010) | EA (2017) | EEA (2014) | EcoSenseLE | |
|---|---|---|---|---|
| HF | 4336 | |||
| SO2 | 12,164 | 2475 | 8732 | 5837 |
| NOX | 8373 | 16,618 | 2602 | 4571 |
| PM | 51,184 | 38,251 | 25,466 | 5268 |
| NOX-PM | 13,849 |
CO2 emissions were valued through The World Bank's concept of social cost of carbon (The World Bank, 2017) in a range of values of 40–80 dollars per ton in 2020 that would increase to 50–100 dollars per ton in 2030 (based on an uplift factor of 2.25%). The World Bank proposes subtracting the market price of CO2 from its social cost in sectors subject to emission allowance trading. The same approach was applied to SO2 and NOX emissions subject to the payment of an air pollution tax. The price of the CO2 emission allowances negotiated in the European market was set at 28 €/T in 2020 and was expected to increase in the coming years (EEA (European Environment Agency), 2018). Both the IGBC-DEFRA and the World Bank consider that the market price of CO2 will tend to converge with its social cost by 2030. With these references, projections of the social and market prices of CO2 were created around the central, maximum, and minimum values reflected in Table B.3. For the conversion of the shadow prices estimated by the World Bank, an exchange rate of $1.19/€ was considered.
Regarding the consideration of an uplift factor, the same value of 2.25% set by the World Bank in its projection of CO2 shadow prices was considered for the rest of the pollutants throughout the time horizon of the analysis, in a range of 1.13%−3.38% for the simulation analysis.
Table C.1. shows the results (SNPV1) from the first Monte Carlo simulation (1000 trials) considering four uncertain variables: WACC, SDR, uplift factor and a multiplying factor that ranged between 40% and 160% and was applied to the central values estimated for the damage costs associated with air emissions. Table C.2. shows the results (SNPV2) from the second Monte Carlo simulation, considering the six damage cost estimates as uncertain variables.
Results from simulation 1.
Results from simulation 2.
Table C.3 shows the statistics on the calibrated values of all the outcomes and conditions involved in the two Monte Carlo simulations performed.
Descriptive statistics for calibrated outcomes and conditions.