


Based on the existing research on environmental regulation (ER) and enterprise innovation, this paper separates green innovation ability from general technological innovation and divides it, from the perspective of motivation, into substantive green innovation (SUBGI) and symbolic green innovation (SYMGI). This paper employs panel data of China's A-share listed enterprise from 2008 to 2018 in a difference-in-difference-in-difference model to construct a quasinatural experiment on the impacts of ER and the green innovation strategy of enterprises. Government subsidies and regulatory capture are used to explore the mechanism between ER and innovation behavior. The results show that ER has a significantly positive effect on green innovation, but its impact on SYMGI and SUBGI decreases. Under the constraints of the ER policy, government subsidies incentivize the green innovation of enterprises, but they are not the main reason for the difference between the two innovation behaviors. Regulatory capture plays a negative moderating role in ER promoting enterprises’ SUBGI and has no significant impact on SYMGI, which is the key factor leading to the difference between the two innovation behaviors. The heterogeneity test suggests a pronounced promotion effect of ER on state-owned enterprises, large enterprises, and growing enterprises. This study provides momentous policy implications for making rational use of environmental policies in promoting enterprises’ green innovation capability, especially high-quality green innovation behavior aimed at promoting enterprises’ green technology progress and gaining competitive advantages.
Combating climate change, reducing carbon emissions, and achieving sustainable development are strategic problems that have attracted global attention (Dabbous & Tarhini, 2021; Zhang et al., 2021a). The Sustainable Development Goals also underscore the need for countries to reduce carbon emissions, improve energy consumption, and use clean energy (Nations, 2015; Nathaniel & Adeleye, 2021; Yu et al., 2022a). The Paris Agreement encourages countries to adopt the carbon emissions trading system (CETS) to achieve a low-carbon economic development transition. CETS is a market-oriented climate policy regarded as a low-cost environmental regulation (ER) tool. However, ER can bring additional pollution control costs that can negatively impact an enterprise's performance (Song et al., 2021). Therefore, some enterprises try to avoid this adverse effect through green innovation (Achi et al., 2022; Wu et al., 2022). Green innovation is a concept that is internally driven and externally responsive, defined as the development of new products, processes, or technologies that protect the ecological environment through pollution control, waste recycling, energy conservation, and emission reduction (Carrion-Flores & Innes, 2010; Bai et al., 2019). Green innovation has been proven to effectively coordinate ecological protection and economic growth (Wang & Jiang, 2021).
There are three main research perspectives concerning ER's impact on enterprise innovation. The first is the “Porter Hypothesis,” where moderate ER could stimulate technological innovation, partly or wholly offset enterprises’ compliance through its compensation effect, and thus increase enterprise innovation output (Dechezleprêtre et al., 2015; Liao, 2018; Wang et al., 2019). The second holds the opposite view, in which ER proliferates the enterprises’ costs and brings a crowding-out effect on technological investment, which is not conducive to innovation (Bel & Joseph, 2018; Song et al., 2021). The third view is that the relationship between ER and technological innovation is uncertain, and there may be a nonlinear relationship or a “threshold effect” between them (Yang & Zeng, 2018; Cao et al., 2019). Furthermore, some scholars found that enterprises responding to ER are more inclined to carry out green technology innovation than non-green technology innovation (Nesta et al., 2014; Feng et al., 2017). However, extensive research failed to separate green innovation from general technological innovation, and it is still unknown whether the “Porter Hypothesis” of green innovation is valid. Additionally, enterprise innovation, as strategic behavior, may be motivated to promote technological progress, maintain a competitive advantage, and gain other benefits, such as catering to stakeholders and government regulation, significantly affecting the quality of innovation (Tong et al., 2014; Truong et al., 2021). The available literature primarily studied the ER's impact on innovation intensity, ignoring the impact of innovation quality under different motivations (Hu et al., 2020; Chen et al., 2021; Ma & Li, 2021). Finally, green innovation is an unusual and complex technological behavior, and research lacks in-depth discussions on the mechanism of ER's green innovation effect (Huang et al., 2022).
China is one of the world's largest carbon emitters, and the impact of its CETS pilot policy on green innovation has attracted widespread attention, since its launch, at home and abroad (Qi et al., 2021). Hence, this study focuses on China, matching the China Stock Market and Accounting Research (CSMAR) database with the China patent database from 2008 to 2018 to investigate the role and mechanism of ER policies on enterprises’ green innovation. Furthermore, this study provides empirical reference and policy basis for promoting green and low-carbon transformation. Compared with the existing literature, this paper's contribution lies in the following. First, we separate green innovation from general technological innovation and accurately evaluate the impact of ER on green innovation in enterprises. Second, we divide enterprises’ green innovation into substantive green innovation (SUBGI) and symbolic green innovation (SYMGI) from the perspective of motivation and explore the impact of ER on different innovation models. Finally, we examine the possible explanations for the difference between SUBGI and SYMGI caused by ER and explore the roles of regulatory capture and government subsidies in this process. This research enriches the “Porter Hypothesis” and helps enterprises deeply understand the mechanism of ER on green innovation and the transmission mechanism between macroeconomic policies and micro-enterprise behavior.
Literature review and research hypothesisPorter and Linde pioneered the “Porter Hypothesis” in 1995; that is, reasonable ER can induce enterprises to carry out technological innovation to make up for the “compliance cost” and promote the competitiveness of enterprise at the same time (Porter & Van der Linde, 1995). Subsequently, a large number of confirmatory studies on the “Porter Hypothesis” have emerged (Dechezleprêtre et al., 2015; Wang et al., 2019; Weiss & Anisimova, 2019), and green innovation gradually attracted the attention of scholars (Kunapatarawong & Martínez-Ros, 2016; Sun et al., 2017; Ilg, 2019; Xie et al., 2022). Green innovation effectively promotes a low-carbon economy while simultaneously moving toward carbon neutrality (Popp, 2019; Zhang et al., 2021b). Based on the “Porter Hypothesis,” we focus on the inducing effect of ER on green innovation in enterprises.
Some scholars believe that coercive and normative pressure from external constituencies prompts companies to take environmental protection policies to demonstrate their commitment to protecting the environment (Hyatt & Berente, 2017; Truong et al., 2021); however, conformity often comes at a price and conflicts with maintaining company efficiency and economics. Under regulatory pressure, companies may develop incentives to cater to regulation, creating the illusion of conformity through symbolic actions loosely coupled to regular activities (Zajac & Westphal, 2004; Berrone et al., 2017). Some scholars classify these similar behaviors into two major categories based on different motivations. One is symbolic environmental actions, which some scholars call symbolic strategies or cooperation. The other is substantive environmental actions, which some scholars call substantive strategies or cooperation (Delmas & Montes‐Sancho, 2010; Neumann, 2021; Truong et al., 2021). The symbolic aims to convey a subjective social meaning to project the appearance of conformity with social expectations, which may be more rhetoric than actual implementation. In contrast, the substantive aims to formulate effective response measures to reduce the negative impact and strive for real solutions. In terms of enterprise innovation, some studies found that measuring corporate innovation with patent applications is sometimes expressed as strategic behavior (Hall & Harhoff, 2012; Tong et al., 2014). This means that enterprise innovation may only be a strategy for top managers. Its purpose is not to substantively improve the technological competitiveness of the enterprise but to obtain some benefits, which often manifest as catering to government supervision or a means of strategic competition among enterprises. This is similar to the symbolic behaviors mentioned above.
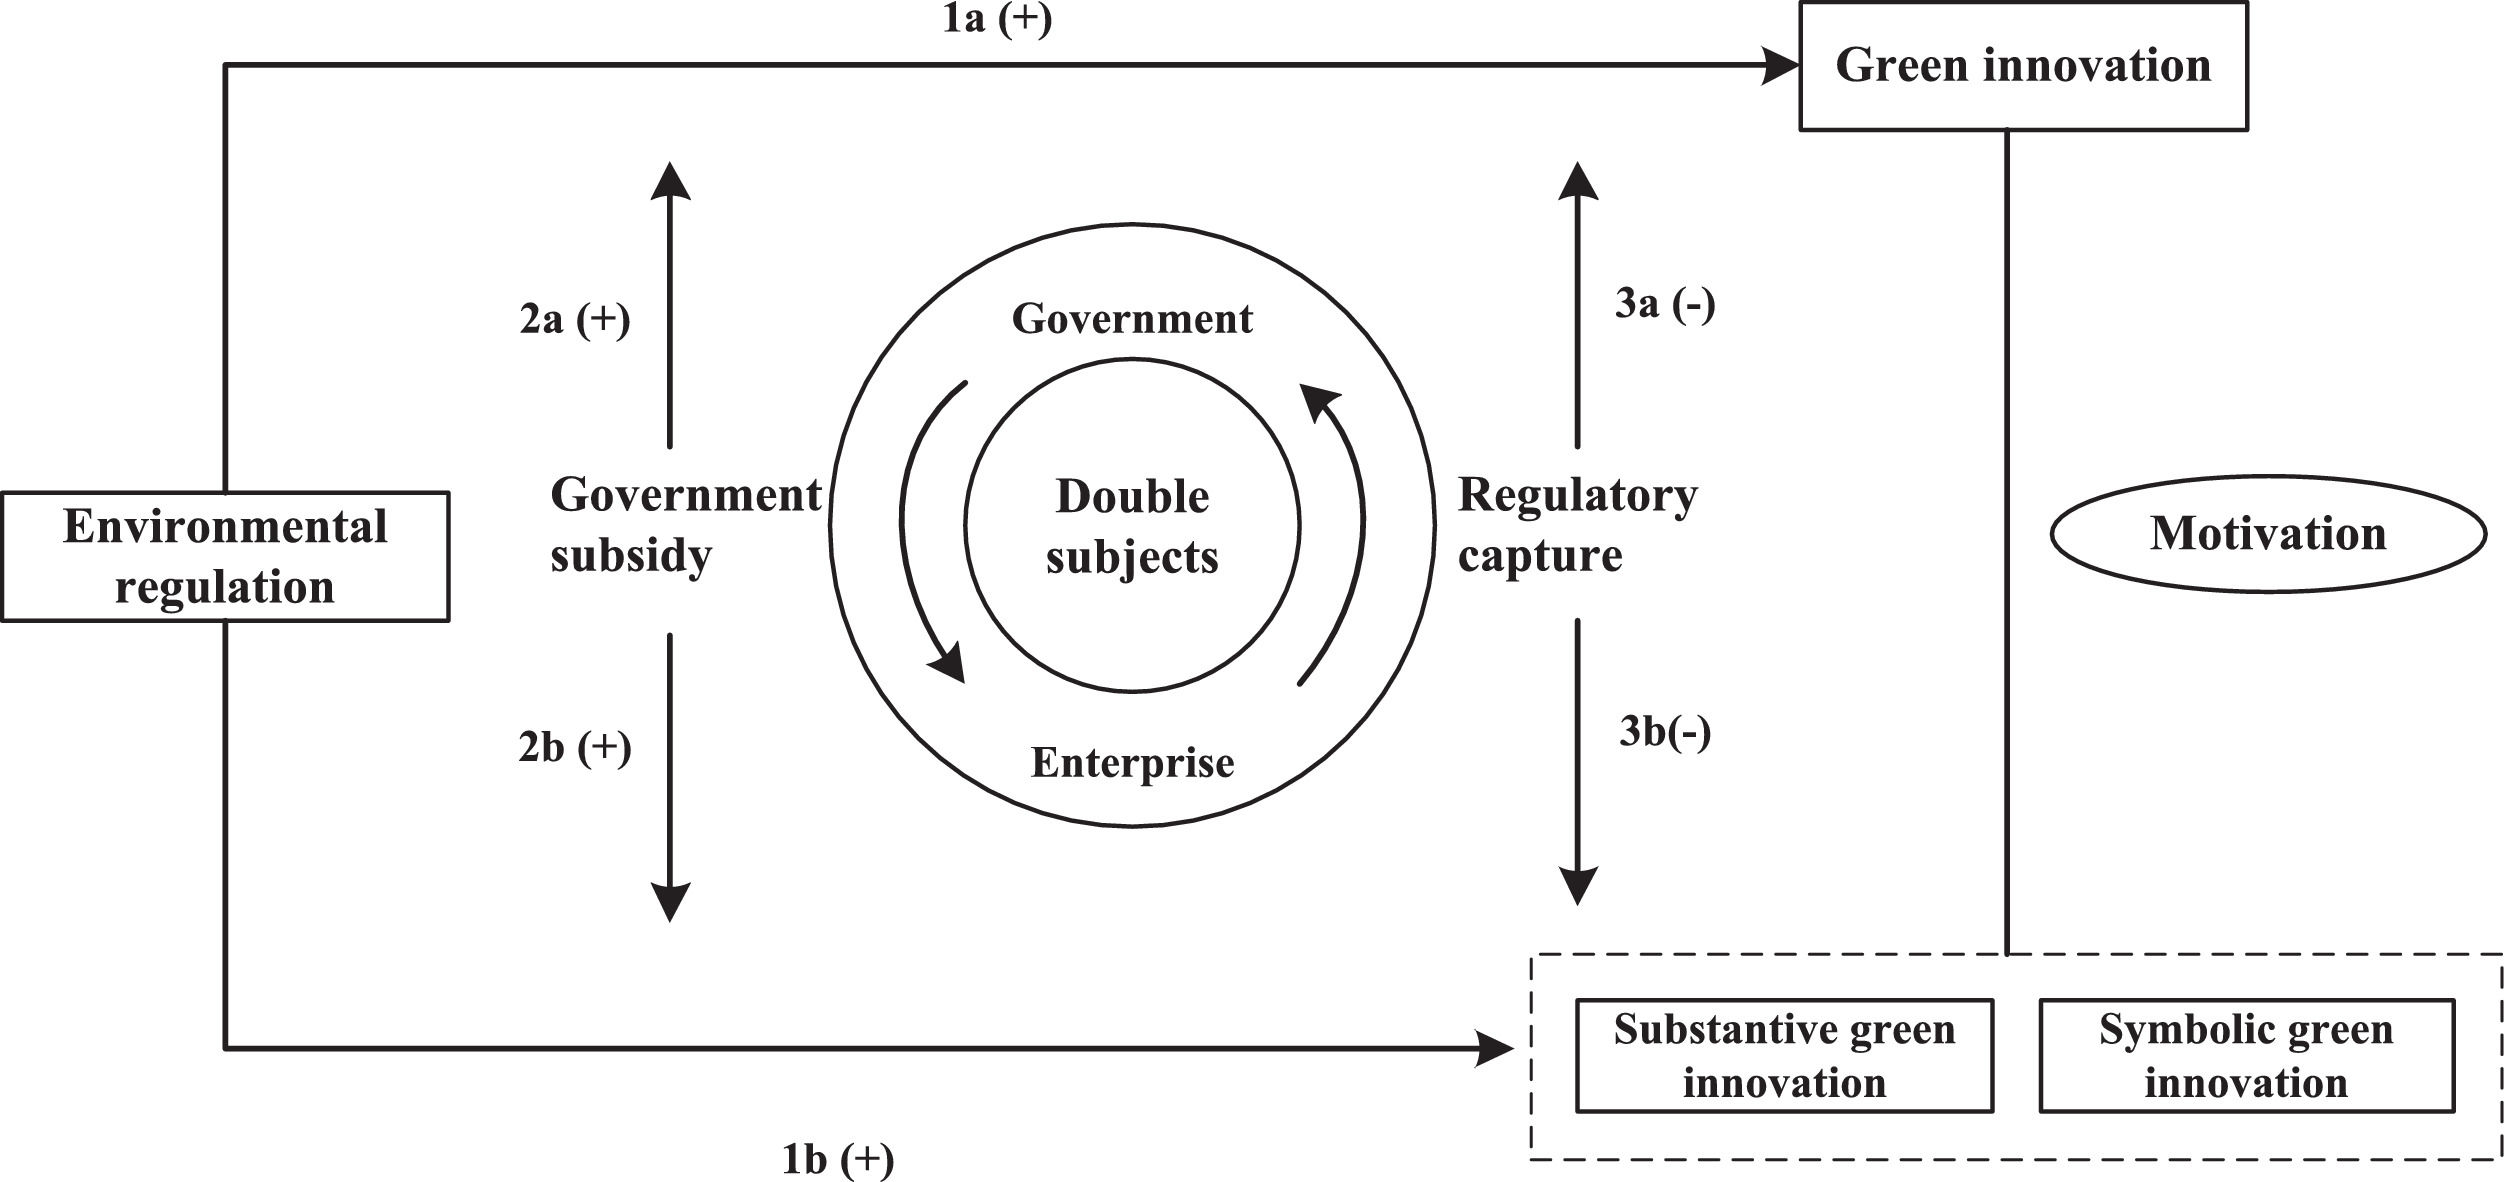
This paper tentatively divides green innovation into two types based on the perspective of motivation. The first is high-quality green innovation behavior aimed at promoting the advancement of corporate green technology, called SUBGI. The second is the innovation strategy catering to the government's ER or ensuring that a company meets social expectations by pursuing the “quantity” and “speed” of green innovation to seek other benefits, such as government subsidies; this strategy is called SYMGI. This paper discusses differences in ER's impact on the two kinds of innovation behavior. Furthermore, focusing on the characteristics of green innovation and the “government-enterprise” two-way behavior model, we explore the role of regulatory capture and government subsidies in this process to clarify and refine the mechanisms and possible transmission paths (Fig 1).
Environmental regulation and green innovation in enterprises
ER's impact on enterprise technological innovation mainly depends on the balance between the “compliance cost” effect and the “innovation compensation” (Ma & Li, 2021). When the ER system is not sound and regulation is weak, enterprises tend to emphasize the maximization of profits, pay environmental taxes, or engage in end-of-pipe treatments while expanding the production scale to balance the regulation cost. With more robust environment-related legislation, stricter enforcement, and rising regulatory costs, enterprises are more willing to gain long-term competitive advantage through independent or imported innovation (Xu et al., 2019; Jiang et al., 2020). In this case, the “innovation compensation” effect exceeds the “compliance cost” effect, indicating that ER endorses enterprise technological innovation. Existing studies have used green total factor productivity as a proxy for green technology innovation (Xie et al., 2017; Wang et al., 2019). These studies found that stronger government environmental regulations could stimulate firms’ willingness to engage in green innovation (Cainelli et al., 2020; Chen et al., 2021; Nie et al., 2021); however, these studies did not distinguish green innovation from non-green innovation and could not verify the “Porter Hypothesis” directly.
In the context of increasingly strict ER in China, based on the above deficiencies, this paper tries to separate the data on green innovation and proposes the following research hypothesis 1a: ER has a positive impact on the green innovation of enterprises.
Furthermore, from the motivation perspective, the two dimensions of green innovation, SYMGI and SUBGI, have different goals. The difference in goals can lead to differences in the degree of green investment preference and energy constraints, impacting the improvement of enterprises’ green innovation and affecting environmental and social responsibility performance. First, based on the perspective of enterprise economic interests. Under pressure from the ER system, enterprises seek favorable social judgment by responding to external pressure through SYMGI or SUBGI. SUBGI requires more resources and more significant organizational changes to improve corporate environmental performance, potentially at the cost of disrupting internal flexibility (Hawn, 2012). In contrast, SYMGI requires little investment of human, material, and financial resources to decouple this obligation to conform to their regular business routines (Meyer & Rowan, 1977; Truong et al., 2021). By simply pursuing the speed and quantity of green innovation, enterprises send signals of environmental compliance to appease stakeholder pressures without compromising their economic interests. Second, based on objective economic facts, most Chinese companies historically imitated and innovated, lacking independent innovation capabilities. High-quality innovation requires long-term technology accumulation and significant capital investment. Therefore, under the constraints of CETS, limited by lacking resources for high-quality innovation and independent innovation ability, enterprises could only respond to environmental laws and regulations quickly through imitation or low-quality innovation, obtaining short-term government support. Thus, this paper proposes hypothesis 1b: The impact of the regulation on SYMGI and SUBGI is decreasing in turn.
Incentive effect initiated by regulator object: government subsidyCompared with traditional innovation, double externalities characterize green innovation (Bi et al., 2016; Bai et al., 2019). On the one hand, the result of green innovation in enterprises is a kind of quasipublic good with a positive externality. Although green innovation enterprises have invested innovation resources, they cannot enjoy their innovation benefits exclusively, which quickly leads to the phenomenon of “free-riding” in competition (Malen & Marcus, 2019; Xiang et al., 2022). Without the government's support, the positive externality of green innovation can lead to market invalidation, resulting in poor green innovation motivation for enterprises. On the other hand, pollutant emissions have a negative externality. Sewage charges are often underestimated because of the unsound market-based pricing system, leading to excessive emissions (Dröes & Koster, 2016; Tian et al., 2017). Neither positive nor negative externalities can achieve Pareto efficiency, which inevitably leads to low efficiency of resource allocation. At this point, blindly imposing policy pressure on enterprises may not produce sufficient incentives to reduce pollution (Peng & Liu, 2018). Under the influence of ER, enterprises tend to invest research and development (R&D) funds in non-green technologies for economic output. Therefore, once environmental supervision is strengthened, the government, as the initiator or subject of ER, must take timely and effective measures to control the external effects of green innovation and reduce the risks and uncertainties inherent in such innovation (Wu, 2017). Government R&D subsidies are an effective means of solving innovation externalities (Bi et al., 2016; Li et al., 2018; Liu et al., 2020).
Therefore, in the context of increasingly strict ER in China, to achieve the goal of green sustainable development and effectively reduce carbon emissions, the Chinese government has allocated many R&D subsidies to encourage enterprises to introduce advanced green technologies, purchase environmentally-friendly equipment, and encourage green innovation. Government subsidies’ impact on enterprises’ green innovation is manifested in various aspects. First, government R&D subsidies can make up for the lack of R&D funds for companies (Dai & Cheng, 2015; Ren et al., 2021). Second, government subsidies can compensate for the extra cost of upgrading clean technology (King & Lenox, 2002; Květoň & Horák, 2018). Third, companies can be guided to choose the appropriate green R&D direction. Finally, according to the signal theory, environmental subsidies can signal to external investors that the government has legitimized the company (Wei & Zuo, 2018; Ren et al., 2021). Supplementary Materials (SM) page S1 provides a more detailed discussion. Given the above, this paper proposes hypothesis 2a: Under the constraints of ER, government subsidies can promote the green innovation of enterprises.
However, policymakers can support green innovation with different intensity levels depending on different interpretations of the motivations for green innovation, which can have different impacts on green innovation in enterprises (Klette et al., 2000; Hud & Hussinger, 2015). Government subsidies to enterprises usually come with conditions for utilizing funds (Peng & Liu, 2018). Under normal circumstances, the government prefers high-quality green innovations: green technologies that can genuinely reduce adverse effects and maximize eco-environmental dividends. The government is more willing to increase financial support for these types of technology (Lin et al., 2021). From the perspective of result orientation and driving effect, the government is more willing to extend a “supporting hand” and provide subsidies to the enterprises it believes are engaged in green innovation activities with positive results. As such, this paper proposes hypothesis 2b: Compared with SYMGI, government subsidies have a slightly higher incentive effect on SUBGI.
Inhibition effect caused by regulated objects: regulatory captureAccording to regulatory capture theory, under the influence of government regulation, regulated objects, such as enterprises, may exert influence over regulatory authorities and staff through bribery or benefit exchange; thus, the formulation and implementation of regulatory policies are conducive to regulated objects and, ultimately, the regulation becomes invalid to a large extent (Stigler, 1971; Lei et al., 2017). In short, regulatory capture theory emphasizes that organized interest groups successfully capture regulators to optimize their well-being (Li et al., 2019). Many scholars have studied the regulatory capture theory, and SM (page S2) presents the discussion of existing research.
Some scholars have found that regulators under regulatory capture may balance profit and intentionally lapse from regulatory stringency, which is considered the leading cause of many environmental accidents (Graham et al., 2011; Steinzor, 2012). However, few studies have linked this regulatory capture phenomenon with ER's green innovation effect, and there is a lack of in-depth research on the mechanism. It is undeniable that regulatory capture has a particular impact on the effect of green innovation in the implementation of ER. First, a plentiful supply of financial resources must be invested in regulatory capture (Murphy et al., 1993; Xue et al., 2021), which can squeeze the support of green innovation resources. Second, regulatory capture behavior could stifle the entrepreneurial spirit of innovation and strengthen the propensity to speculate in business operations. Under the constraints of ER, such behavior tends to drive companies to provide benefits to regulatory officials to soften constraints instead of conducting green innovations to meet regulatory requirements, destroying the potential incentives of ER and adversely affecting enterprises’ green innovation activities. Thus, this paper proposes hypothesis 3a: Regulatory capture plays a negative regulatory role in ER's process in promoting the green innovation of enterprises.
Additionally, due to the differences in the motivation and purpose of enterprises’ green innovation behavior, regulatory capture may impact the moderating effects of SUBGI and SYMGI. For SUBGI, enterprises are requested to explore new knowledge and technology outside of existing technology paradigms, meaning that SUBGI is much more expensive and time-consuming than SYMGI. Therefore, firms undertaking SUBGI experience a longer period without innovative results. Enterprises that take a profit maximization approach have more potential benefits from regulatory capture behavior under this circumstance and thus have intense motivation for regulatory capture behavior (Li et al., 2021; Zhang et al., 2021b). In contrast, SYMGI is generally a minor and low-level innovation, with low innovation cost, less time, and a greater likelihood of obtaining government subsidies. In this case, the choice of regulatory capture is likely to outweigh the loss. Given this, this paper proposes hypothesis 3b: The regulatory capture negatively moderates the promotion of ER on SUBGI activities but has no significant impact on SYMGI. Regulatory capture may be the main reason for the difference between the two green innovation behaviors.
Research designThe influence effect modelDue to the lack of empirical studies on China's market-oriented ER mode, this paper takes China's representative CETS pilot policy as a quasinatural experiment to investigate ER's impact on green innovation. According to the CETS pilot, the industries constrained by carbon emissions in seven provinces and cities are mainly eight high-carbon industries: steel, electricity, petrochemical, chemical, building materials, paper, non-ferrous metals, and aviation (Hu et al., 2020). Second, the CETS pilot is mainly conducted in provinces and cities with representative regional economic development. It is generally believed that the higher the degree of economic development, the more attention paid to energy conservation and greenhouse gas emission reduction (Zhang et al., 2017). In other words, implementing CETS is non-random, and there are confounding factors that do not change with time and region; however, the traditional difference-in-difference model only considers the differences in the two dimensions of “whether in the time of policy implementation” and “whether in the region of policy implementation” in the research data. Therefore, it may be difficult to effectively observe confounding factors that do not vary with time or region (SM, page S3). Based on this, we choose the difference-in-difference-in-difference (DDD) model, which introduces a third difference (i.e., the industry's pollution characteristics) used in the cutting-edge research of environmental economics to build a model of the impact of ER policy on enterprise green innovation (Cai et al., 2016):

The subscripts i, j, d, and t represent the firm, province, industry, and year, respectively. EGIi,j,d,t represents the SYMGI and SUBGI, ERi,j,d,tis the ER, and Controli,j,d,t represents other control variables. Provincej, Industryd and Yeart are fixed effects of provinces, industry, and year respectively, while εi,j,d,t is the stochastic error affected by time.
Influence mechanism test modelBased on the literature review, under the constraints of ER, government subsidies and regulatory capture have different moderating effects on the green innovation of enterprises with different motivations. The following models test the moderating effect of government subsidies and regulatory capture on the relationship between ER and enterprises’ green innovation:
where GSi,j,d,t is the moderator of government subsidies, and RCi,j,d,t is the moderator of regulatory capture. The variable GSi,j,d,t*ERi,j,d,t and RCi,j,d,t*ERi,j,d,t are interactive items. The coefficients β2 and β4 denote the influence of government subsidies and regulatory capture on the effect of ER on enterprises’ green innovation. Firm fixed effects, industry fixed effects, and time fixed effects are controlled in the equation.Variable and definition

Enterprise green innovation. Since the current measurement methods of green innovation have not yet formed a unified and standardized international standard, scholars in different fields scientifically quantify green innovation from different perspectives. Based on scientific considerations (SM, pages S3 and S4), we draw on the research methods of Wurlod and Noailly (2018) to identify the number of green invention patent applications that enterprises applied for according to the International Patent Classification (IPC) code in the Green List of International Patent Classification. This is used as a measure of green innovation ability (Patent).
Substantive green innovation and symbolic green innovation. According to the above discussion, green innovation varies with different motivations; however, it is challenging to find appropriate indicators for directly measuring SUBGI and SYMGI. Therefore, based on the definition of China's patent law and existing research literature, we describe the two types of innovation behavior from the perspective of innovation effects (Bronzini & Piselli, 2016; Li & Zheng, 2016; Hu et al., 2020). The application of “high-quality” green invention patents by enterprises is identified as SUBGI (SubP), and the application of green utility model patents is identified as SYMGI (SymP). The number of green design patent applications is not considered because the design patent is the most fundamental innovation with relatively low technical content; the submission of reports and substantive reviews are not required in the application process, which is more independent behavior (Huang, 2016).
Environmental regulation. We take the CETS pilot policy as the policy variable of ER to investigate the impact of ER on green innovation. We then determine whether the company is the carbon trading pilot policy's primary target based on the list of carbon trading pilots involved in the “Notice on Launching Pilot Work on CETS Rights” and the actual situation of the carbon emission-constrained industries. Therefore, the DDD model can be further refined as follows:
where Pilot represents the dummy variable of the CETS pilot area. If the province or city is a policy pilot area, the value is 1; otherwise, it is 0. Post is a dummy variable for the year. The value is 1 during the CETS pilot period (2013 and later) and 0 during the non-pilot period (before 2013). Ind is the industry pollution characteristics index. If the company's industry is one of the eight high-carbon industries subject to carbon emissions, the value is 1; otherwise, the value is 0. The ERi,j,d,tvariable is the interaction term of interest in this article and the essential variable of interest in the model, i.e., ERi,j,d,t=Pilot*Ind*Post, its coefficient μ reflects the net impact of changes in the green innovation level of enterprises and industries covered by CETS in the pilot areas before and after the CETS policy's launch.
Government subsidies. According to the chronological order of government subsidies and enterprise R&D, government subsidies can be divided into two parts: government subsidies beforehand (GSB) and government subsidies afterward (Hud & Hussinger, 2015). After careful comparison and analysis (SM, pages S4 and S5), we focus primarily on the perspective of GSB, and we use the government subsidies obtained by enterprises in that year (GS) (Peng & Liu, 2018).
Regulatory capture. Regulatory capture usually refers to illegal acts to obtain help in gray ways, such as bribery and corruption; therefore, collecting first-hand evidence for direct measurement may be challenging. Cai et al. (2011) found that Chinese listed companies often use their entertainment and travel costs (ETC) under the management expense account to bribe and seek government support. On the one hand, enterprises often use the ETC to hide gray expenses, such as enterprise commissions. On the other hand, the expenses related to eating, drinking, entertainment, and other activities are closely related to corruption, such as enterprise bribery. As bribery is illegal, the value of bribes is not directly observable. Therefore, until now, this research result has been adopted and applied by many scholars to measure regulatory capture or bribery (Chen et al., 2013; Lin et al., 2016; Xue et al., 2021). We use the amount of ETC scaled by sales as a proxy of corporate regulatory capture (RC).
Control variables. Based on extensive literature (Hu et al., 2020; Qi et al., 2021), this study controls for some firm characteristics to eliminate the potential influence of these variables on enterprises’ green innovation. These variables include enterprise size (Size), ownership structure (SOE), total factor productivity (Lntfp), age (Age), enterprise market value (TobinQ), and enterprise asset scale (EAS).
Data and descriptive statisticsTo study the impact of ER on enterprise green innovation, we use samples of Chinese companies listed on the Shanghai Stock Exchange and Shenzhen Stock Exchange from 2008 through 2018. Among them, the enterprise data are mainly from the CSMAR database. Patent data were determined by the CSMAR database, China patent database, and IPC code. The ER data is determined by the list of carbon trading pilots involved in the “Notice on Launching Pilot Work on CETS Rights” and the actual situation of the industries subject to carbon emission constraints. Therefore, our paper focuses on the CETS-covered enterprises of eight carbon-intensive industries (steel, electricity, petrochemical, chemical, building materials, paper, non-ferrous metals, and aviation) in the seven CETS pilot regions (Beijing, Tianjin, Shanghai, Chongqing, Hubei, Guangdong, and Shenzhen) in China. Meanwhile, to eliminate the influence of extreme values, we winsorize the variables’ 1% and 99% percentiles. After dropping those with missing information, we obtain a sample of 11,407 firm-year observations for 1,037 firms.
Table 1 shows the variables’ descriptive statistics, including the number of observations, mean, standard deviation, and minimum and maximum values. The mean of green utility model patents (SymP) and green invention patents (SubP) successively decreased by 0.550 and 0.539, respectively, indicating that enterprises are more inclined to apply for patents with SYMGI.
Descriptive statistics.
Table 2 presents this study's basic regression results (detailed information is shown in SM, page S6 Table A1). Among them, (1)–(3) control the individual effects of province, industry, and time, but exclude control variables, while (4)–(6) include other control variables. The results in (1)–(6) show that accounting for the various fixed effects and control variables at different levels, the DDD's coefficients are significantly positive in all six columns. Considering the robustness of the empirical results, (4)–(6) were mainly used in the subsequent analysis.
Regression results based on DDD model.
The parentheses are the robust standard error values. *** p < 0.01, ** p < 0.05, * p < 0.1.
Specification (4) of Table 2 suggests that the implementation of CETS, an ER policy, significantly improves the green innovation capability of enterprises since the coefficients of ER are (μ=0.261, ρ<0.01). Therefore, hypothesis 1a is verified. This result is consistent with the extant research (Liu et al., 2021; Cui et al., 2022).
The impact of the regulation on SYMGI and SUBGI is decreasing in turn. Therefore, hypothesis 1b is verified, which can be derived from the coefficients of SymP (μ=0.221, ρ<0.01) and SubP (μ=0.159, ρ<0.01). This shows that in the context of ER policies, enterprises are restricted by internal factors, such as technology and capital, as well as external factors, such as the inclusiveness of the industry, participants, and possible bureaucratic factors (Hu et al., 2020; Chen et al., 2021), so they have not truly eradicated symbolic innovation focusing on the number and speed of patents.
Influencing mechanism analysisTo further explore the mechanism of ER policies affecting corporate green innovation and explore the differences in the two green innovation behaviors, we add government subsidies and regulatory capture and their intersection with ER. Table 3 presents the results (detailed information is shown in SM, page S7 Table A2).
Moderating effect regression results: government subsidies and regulatory capture.
The parentheses are the robust standard error values. *** p < 0.01, ** p < 0.05, * p < 0.1.
The incentive effect of government subsidies is investigated in (1)–(3). As stated in hypothesis 2a, government subsidies can promote the green innovation of enterprises (β2=0.054, ρ<0.01). From a detail standpoint, government subsidies have a slightly higher incentive effect on SUBGI (β2=0.044, ρ<0.01) than SYMGI (β2=0.035, ρ<0.05). The possible reason is that conditions for the use of funds generally accompany the government subsidies provided to enterprises, and enterprises are more willing to conduct green innovation plans around the goals set by the government. Generally, the government prefers high-quality innovation (Boeing, 2016; Bai et al., 2019). Therefore, compared with SYMGI, government subsidies play a stronger role in promoting SUBGI. Therefore, hypothesis 3 is supported.
The inhibitory effect of regulatory capture is investigated in (4)–(6). Hypothesis 3a is supported; that is, regulatory capture plays a negative regulatory role in the process of ER in promoting the green innovation of enterprises. Furthermore, hypothesis 3b is confirmed in columns (5) and (6). The economic implication is that regulatory capture can damage the promotion effect of ER on enterprises’ SUBGI (β4=−5.030, ρ<0.01), and the impact on SYMGI (β4=−2.676, ρ>0.1) is not significant. Regulatory capture may be the main reason for the difference between the two green innovation behaviors.
Heterogeneity testDifferences in enterprise ownership structure, size, and life cycle may affect ER's driving effect on green innovation. The reasons for choosing these three characteristics are presented in the SM (pages S8 and S9). Then, we divide the sample into non-state-owned and state-owned enterprises according to whether the company's equity includes state-owned shares. We classify the size of enterprises according to the median number of employees and define small enterprises as having fewer than 1,000 employees and large as having more than 1,000 employees. Finally, the development stage is one of an enterprise's most basic characteristics. The enterprise's green innovation may be closely related to its life cycle; therefore, we divide the life cycle into three stages according to the age of the firm: startup period (1–6 years), growth period (7–11 years), and maturity period (12 years and above). The model results are shown in Table 4. SM (pages S10–S12 Table A3–Table A5) presents the heterogeneity test results of SYMGI and SUBGI.
Enterprise heterogeneity test results.
The parentheses are the robust standard error values. *** p < 0.01, ** p < 0.05, * p < 0.1.
In Table 4, the empirical results in columns (1) and (2) show that under the constraints of ER, state-owned firms must work harder to undertake green innovation, primarily because state-owned enterprises are obliged to fulfill government mandates. Additionally, they are the main subjects of the government to undertake social responsibilities, such as environmental protection (Li et al., 2015; Jiang et al., 2020; Wang & Jiang, 2021). Therefore, state-owned enterprises should assume greater responsibilities than non-state-owned in implementing the nation's green development via green innovation, and they should play a more exemplary role in the development of green innovation. Alternatively, due to the natural relationship with the government, state-owned enterprises are given priority for obtaining scarce government-controlled resources and are more likely to receive preferential policies, such as green subsidies, local protection, and exclusive licensing (Zhou et al., 2017; Bai et al., 2019).
Enterprise size heterogeneity testColumns (3) and (4) indicate that large enterprises can significantly promote green innovation under the constraints of ER. The possible reasons for this phenomenon are as follows. First, large-scale enterprises have abundant innovation resources, such as R&D capital, technical talents, and patent accumulation; moreover, they can obtain high-quality patents through purchase and independent R&D (Gupeng & Xiangdong, 2012; Hu et al., 2017). Conversely, small-scale enterprises have a low market share due to the constraints of talents, technology, capital, and other factors, leading to a lack of self-owned R&D funds (Bai et al., 2019). Strict environmental policies can cause small-size enterprises to enhance end-of-pipe pollution control more often than implementing green innovation. Second, large-size companies often have mature development, complete organizational systems, and relatively rich experience in innovation management. In contrast, small-size companies lack rich R&D experience and sound management processes (Yu et al., 2022b). Higher R&D risks are difficult to undertake, leading to ER policies having insignificant effects.
Enterprise life cycle heterogeneity testThe magnitude of the coefficient in columns (5)–(7) indicates that under ER's influence, the green innovation of growth-period companies is the highest, followed by mature-period companies; the green innovation of startup companies is the lowest. The main reason is that startup-stage enterprises can face many capital needs and severe financing constraints. Compared with the growth and maturity stages, enterprises face higher corporate risk-taking, leading to less investment in green innovation technology (Shahzad et al., 2019). Enterprises in the growth period have sufficient funds to increase R&D investments in environment-friendly products to improve products’ green technology added value (Cao & Cao, 2019). Similarly, mature enterprises have stable sources of unrestricted funds and strong risk-bearing capabilities. They have likely formed relatively complete management processes within the enterprise, which are all conducive to researching and developing green technologies (Yang et al., 2021). Thus, the green innovation of enterprises in the growth and maturity periods is higher. Especially in the growth period, enterprises have a strong sense of social responsibility and more active innovation activities, so the improvement of green innovation is more pronounced.
Parallel trend hypothesis testThis paper selects the year 2009 as the base period. The interaction term of the ER policy variable and annual dummy variable Year_Dummy is included in the basic model to investigate whether there are significant differences in enterprises’ green innovation capability before and after implementing the ER policy. Columns (1)–(3) in Table 5 (detailed information is shown in SM, page S13 Table A6) display the parallel trend test results. In the pretreatment period (i.e., before 2013), the estimates are insignificant, indicating no significant change in the green innovation ability of the treatment group and the control group before implementing the pilot policy. Meanwhile, the regression coefficients after implementing the pilot policy (except for 2014, 2015, and 2018 in column 2) are significantly positive, confirming our results. ER policy significantly improves the green innovation of enterprises, including SYMGI and SUBGI. In addition, the coefficient was not significant in 2013, which may be explained because, although enterprises began actively researching and developing new environmental governance technologies in the ER policy implementation year, the green innovation capability had a specific time lag.
The parallel trend hypothesis test results.
The parentheses are the robust standard error values. *** p < 0.01, ** p < 0.05, * p < 0.1.
This paper adopts the strategy of changing the econometric model to test its robustness. First, since the number of green patent applications is a discrete non-negative integer, a Poisson distribution model is adopted for regression. The estimated results are shown in columns (1)–(3) of Table 6 (detailed information is shown in SM, page S17 Table A7). Second, the index of green innovation capability is changed to a 0–1 variable, and the probit and logit models are used for regression analysis. In this model, if an enterprise's green patent applications in a specific year are greater than 0, the value of the patent variable in that year is 1; otherwise, it is 0. Columns (4)–(9) in Table 6 present the specific estimation results, showing that after the estimation method is changed, the estimation coefficient of ER is still significantly positive, and the coefficients of SUBGI and SYMGI increase successively; therefore, the basic regression conclusion is still valid.
Robustness test results.
The parentheses are the robust standard error values. *** p < 0.01, ** p < 0.05, * p < 0.1.
Finally, considering the delay of green patent grants, we choose the amount of green patent authorization in the t + 2 period as the explained variable. In columns (10)–(12) of Table 6, the coefficient of ER is static and significant, indicating that implementing ER significantly improves the amount of green patent authorization in the latter two periods. The robustness test results show that this paper's benchmark conclusions obtained are robust.
Conclusion and implicationsConclusionBased on the existing research on ER and enterprise innovation, this paper separates green innovation from general technological innovation ability and divides enterprise green innovation into SUBGI and SYMGI from the perspective of motivation. Then, the DDD method is used to establish the quasinatural experimental. The conclusions are as follows.
ER positively impacts both SUBGI and SYMGI. In the baseline model, ER positively impacts green innovation, SUBGI, and SYMGI (green invention patents and green utility model patents). This conclusion is still valid after conducting multiple robustness tests; however, from the perspective of the degree of influence, the impact of ER on green innovation, SYMGI, and SUBGI decreases successively. This shows that Chinese companies have not truly eliminated strategic innovation by pursuing the “quantity” of green innovation to obtain certain benefits. There is still much work before enterprises can realize “high-quality” green innovation behavior to promote green technology progress and obtain a competitive advantage.
To further explore the mechanism of ER policy's influence on the green innovation of enterprises and investigate the reasons for the difference between the two green innovation behaviors concerning motivation, we consider the two main subjects of “government-enterprise”: regulation object and regulated object. We then incorporate the two moderating variables of government subsidies and regulatory capture to test the mechanism. The regression coefficients of the interaction term between government subsidies and ER on green innovation, SUBGI, and SYMGI are all significantly positive. This finding indicates that under the influence of ER, government subsidies can eliminate the offset effect on “compliance costs,” thus promoting the improvement of green innovation indirectly. However, in terms of the degree of impact, there is little difference in the government subsidies’ impact on the green innovation behaviors of the two motivations. This finding suggests that government subsidies are not the main reason for the gap between the two green innovation behaviors. Additionally, regulatory capture plays a negative regulatory role during ER in promoting enterprises’ SUBGI and has no significant impact on SYMGI, which is the main reason for the difference between the two kinds of green innovation behavior.
The heterogeneity test results suggest that the differences in ownership, size, and life cycle of enterprises also significantly impact ER's green innovation incentives. Specifically, the SUBGI and SYMGI of state-owned enterprises can significantly improve after implementing ER policy. The explanation is that under the constraints of ER policy, state-owned enterprises can respond to policies and conduct green innovation faster than non-state-owned companies due to the incentive of responsibility and priority use of scarce resources. From the difference in enterprise size, only large enterprises can significantly promote green innovation under ER constraints, especially SYMGI. This is mainly because small-scale companies are restricted by talent, technology, and capital factors. Strict environmental policies can cause small companies to be more inclined to reduce other expenditures to enhance end-of-pipe pollution control rather than develop green technologies. Large enterprises mainly undertake the vital task of improving the quality of green innovation. In addition, we also found that under the influence of ER, the green innovation of growth-stage enterprises is the highest, followed by mature-stage enterprises; the green innovation of enterprises in the startup stage is the lowest, which is closely related to the capital demand and talent demand of enterprises at this stage.
Policy implicationsBased on the above conclusion, this section considers the policy implications of our research.
First, CETS has significantly improved enterprises’ green innovation, further verified the value of promoting carbon trading, and provided empirical support for ER's strong incentive effect on enterprises’ green innovation. In the future, we should first further liberalize the carbon emission trading market, accurately position the emission enterprises, activate the carbon market's trading and price discovery mechanism, and better stimulate the green innovation activities of enterprises in the carbon market. Second, we should strengthen the scientific design of environmental policy tools, further optimize the system design, transmit ER signals through strengthening the monitoring of enterprises’ emission reduction, and guide enterprises in conducting green innovation.
Second, more flexible and targeted government innovation subsidies policies should be adopted to realize the positive effects of subsidies on innovation. We should improve policies related to subsidies, strictly examine the qualifications of enterprises applying for subsidies, and pay attention to the appropriateness of subsidies. The subsidy cycle should match the development stage of the enterprise while encouraging independent innovation and fundamentally enhancing its core competitiveness.
Third, full attention should be given to the distorting effect of regulatory capture on ER's economic consequences. Excessive regulatory capture may block ER's green innovation incentive effect, especially high-quality substantive innovations. The intensity of ER should be promoted step by step. Suppose companies bear excessive environmental costs in the short term. They might be more inclined to regulatory capture rather than substantially improve green environmental protection technologies to cope with ER. This approach may ultimately destroy the incentive mechanism for green innovation by improving the intensity of ER, especially SUBGI, with higher costs and extended time.
Finally, environmental policy formulation should consider the pollution control capacity of different enterprises. Instead, of simply implementing a “one-size-fits-all” model, specific measures should be introduced according to enterprises’ ownership structure and life cycle characteristics to give full play to the adverse effect of ER on green innovation.
LimitationsThis study may have some limitations, as follows. First, this article divides green innovation into SUBGI and SYMGI according to innovation motivation, but it is challenging to find an appropriate indicator to measure innovation motivation directly. Therefore, this paper uses a type of green patent application to measure different innovative behaviors. Although this method can also reflect the green innovation choices of enterprises under different motivational perspectives to a certain extent, it is still not comprehensive. We will collect more detailed patent information to deepen subsequent research in the future.
Second, the government subsidy in this paper is GSB, measured by the total amount of subsidies received by the company that year, regardless of whether it is an innovation subsidy. At the same time, it fails to consider different government subsidies, such as direct and indirect subsidies, which have different effects on the innovation effect of enterprises. In the future, we will further classify government subsidies, examine the impact of different types of subsidies on green innovation, and determine the choice of innovative behaviors with different motivations.
Third, due to the concealment of regulatory capture behavior, there is a certain amount of noise in using the amount of ETC scaled by sales as a proxy of corporate regulatory capture. With the further deepening of related research, the design of more accurate regulatory capture measurement indicators can effectively provide verification and support for this paper's results.
Finally, ER mainly affects enterprises’ green innovation by the following two mechanisms: the “innovation compensation” effect and the “compliance cost.” Future research can use appropriate measurement methods to separate the individual effects of the two paths and explore the role of government subsidies and regulatory capture and their impact mechanism on green innovation behavior with different behavioral motivations.
Disclosure statementNo potential conflict of interest was reported by the authors.
The authors would like to acknowledge support from the Major Program of National Philosophy and Social Science Foundation of China (NO. 18ZDA125), the Key Program of National Philosophy and Social Science Foundation of China (NO. 17ATJ001), Major Social Science Foundation of Zhejiang, China (NO. 22QNYC14ZD), Social Science Foundation of Zhejiang, China (NO. 22NDQN245YB) and Zhejiang Gongshang University provincial colleges and universities basic scientific research business fees (NO. JR202101). This work also supported by the characteristic & preponderant discipline of key construction universities in Zhejiang province (Zhejiang Gongshang University- Statistics) and Collaborative Innovation Center of Statistical Data Engineering Technology & Application.