


Edited by: Abbas Mardari
More infoDigital finance has provided informal financial support to small- and medium-sized enterprises (SMEs) and solved the dilemma of acquiring formal financial support in emerging economies such as China. However, this may lead to structural changes in entity enterprises’ asset allocations. Based on SMEs listed on the Shenzhen Stock Exchange: Small and Medium Enterprise Board from 2011 to 2018, this study empirically examines the underlying mechanism of digital finance on the asset allocation behaviors of SMEs. The results show that digital finance enables SMEs to allocate more financial assets, thus intensifying the level of financialization of asset allocation. Furthermore, financing constraints partially mediate the relationship between digital finance and the financialization of asset allocation. Further, we investigate financialization motivation in particular and find that the impact of digital finance on the financialization of enterprises is more significant in enterprises with more investment opportunities and in areas with a speculative atmosphere. The results support that SMEs’ financial asset investment has an investment substitution motive rather than a reservoir effect. Digital finance relieves SMEs’ financing constraints and reduces their financing costs. When financing constraints are alleviated, digital finance also prevents the tendency of financialization in SMEs’ asset allocation. This study offers useful policy implications for preventing SMEs’ investment distortions in the development of digital finance.
Digital finance refers to the use of digital technology by Internet companies and financial institutions to expand related businesses, such as capital financing, payments, and information intermediation, thereby establishing an emerging technological model that goes beyond traditional financial operations (Berger & Gleisner, 2009; Huang & Huang, 2018). In this context, an important question emerges: Can digital financing affect a firm's asset allocation? Strong signs suggest that digital finance changes how enterprises raise funds and make payments, while also advancing their investment and business strategies through Internet technologies such as big data, blockchain, cloud computing, and artificial intelligence (Nigam et al., 2020). Digital finance can provide small businesses with appropriate financial services, ignoring the high-risk premiums and high operating costs associated with the traditional financial system, which affect an enterprise's cash flows (Chen & Li, 2023; David-West et al., 2020; Law et al., 2018). In addition, digital finance breaks down the financing barriers of small- and medium-sized enterprises (SMEs) with low total assets, prominent main businesses, and rapid growth and development; SMEs can acquire informal financial support and alleviate financing constraints. However, it may also result in “structural” changes in asset allocation by entity enterprises. In developing and emerging economies, digital finance is considered one of the most effective strategies for SMEs’ financial inclusion and stability (Knaack & Gruin, 2021).
Capital markets suffer from information asymmetries, agency problems, and difficulties in allocating residual control through contracts, which occur more frequently in emerging economies such as China. Inadequate monitoring prevents enterprises from accessing financing (Beck et al., 2005; Porta et al., 1997, 1998; Santos & Cincera, 2022). SMEs face significant challenges in seeking financing, and the scarcity of seed funding leads to a significant funding gap for start-ups and later-stage enterprises (Banerji & Fang, 2021). Digital finance offers new technologies that improve enterprises’ access to financing and new investment channels for investors (Buchak et al., 2018). Disrupting the traditional operating mode of financial institutions, digital finance introduces a new business model through intelligent algorithms and cloud computing that lowers the cost of financial services (Demertzis et al., 2018). Parallelly, digital finance provides a feasible solution to enterprises’ financing problems using big data, artificial intelligence, and other advanced technologies.
Digital finance plays a positive role in improving financial institutions’ business efficiency, alleviating information asymmetry, and expanding the source of capital supply (Lu, 2018). It also allows individuals, enterprises, and start-ups to acquire the necessary financing through the Internet, offering alternative traditional methods, such as banks, venture capital, angel financing, and government financing schemes (Gomber et al., 2017). The basic concept of contributing financing through many small customers is not new, but the Internet has reduced transaction costs and time, and simplified the process of bringing together those seeking financing and those willing to provide it (Zhang & Liu, 2012). In general, digital finance can help alleviate the financialization of entity enterprises. When the return on entity investments is lower than the return on financial assets, funds will be diverted from the entity economy and “hover” in the virtual economy, which in turn is reflected in the increasing proportion of investment in the financial assets of enterprises. The development of digital finance affects SMEs' asset allocation and encourages them to switch from an entity economy to a virtual economy. This may be because, on the one hand, large enterprises tend to have long-term strategic plans, while SMEs may be more inclined to pursue short-term profits for immediate benefits. On the other hand, SMEs often have limited access to financing, and digital finance development has alleviated their financing constraints (Santos & Cincera, 2022).
Although this topic is relevant to both research and practice, to the best of our knowledge, no studies have explored the impact of digital financing on asset allocation in an emerging economy. Previous studies have evaluated the economic effects of digital finance at the macro level or from the perspective of households, and studied the positive impact of digital finance on access to finance (Bollaert et al., 2021; Farag & Johan, 2021). Under financing constraints, SMEs can gain opportunities through digital financing. We extend this perspective by examining the effect of digital finance on firm-level financialization in asset allocation in Chinese SMEs. The underlying mechanism of digital finance in financialization has been neglected in the literature; thus, the current study focuses on the role of digital finance in micro-enterprises, and investigates the impact of digital finance on the financialization of SMEs and the specific influencing mechanism, thus opening the black box of the new financial sector's transmission mechanism that affects enterprises’ investment behaviors. In an additional analysis, we investigate the reservoir effect and investment substitution motivation of SMEs for digital finance and find that digital finance has a negative impact on the entity economy.
The remainder of this paper is organized as follows: Section 2 explores the theoretical background for developing the model and the hypotheses. Section 3 discusses the methods, data, and measures used in the study. We then present empirical results from our additional analyzes and hypotheses tests in Sections 4 and 5. Finally, we present our conclusions and implications in Section 6.
Theoretical background and hypothesesThe literature focuses on enterprises’ financial asset allocation behavior from the perspective of real economic financialization. Finance has a major impact on economic development (Dore, 2002), and enterprises, as participants in economic development, will eventually be affected by financialization (Collin-Dufresne et al., 2020). Economic financialization occurs more frequently at the micro-enterprise level. The profits of non-financial enterprises are derived more from their investments in the financial market and gradually separate from those in the real economy (Jin et al., 2022). Existing research proposes the concept of financialization for non-financial companies and discusses their financial investment behavior (Demir, 2007; Krippner, 2005). Two factors affectthe non-financialon-financial enterprises' allocation of financial assets: risk and return. From a risk perspective, previous studies suggest that non-financial enterprises invest in financial assets to hedge risks (Bodnar et al., 1995), deal with uncertainty regarding benefits and costs (Felix, 1998), deal with liquidity risks (Opler et al., 1999), and reduce business risks (Duchin, 2010; Duchin et al., 2017). The main reason for allocating financial assets from a profit perspective is that corporate governance in non-financial companies has shifted from focusing on long-term growth to pursuing short-term profits (Froud et al., 2000; Lazonick, 2010).
Academics have used the reservoir effect and investment substitution theory to explain the level of financialization in the asset allocation of entity enterprises. The reservoir theory suggests that entity enterprises invest in financial assets to cope with liquidity constraints in their businesses. By contrast, the investment substitution theory suggests that the tendency of financialization in the asset allocation of enterprises should be explained by the profit-seeking motive of capital (Demir, 2009). When the return on entity investment is lower than the return on financial assets, capital leaves the entity economy to “hover” in the virtual economy, which in turn is reflected in the increasing proportion of financial assets in the assets of entity enterprises. On the one hand, enterprises use part of their idle capital to invest in short-term financial assets and increase their liquidity. Thus, enterprises have achieved preservation and an increase in capital value to cope with future capital shortages. Enterprises’ financial investment is equivalent to that of capital reservoirs (Gehringer, 2013).
On the other hand, China's SMEs mainly obtain financing through shadow banks because of financing difficulties and high returns from financial investment (Du et al., 2017). An increasing number of non-financial enterprises participate in financial market transactions and use idle funds for lending to acquire high profits (Stockhammer & Grafl, 2010). Additionally, financial investment performance can improve an enterprise's credit rating and make it easier for enterprises to finance (Theurillat et al., 2010). Scholars have conducted several empirical studies on both theories, most of which suggest that the investment substitution theory better explains the financialization of enterprises (Demir, 2009; Krippner, 2005; Orhangazi, 2008). As more studies continue to explore the factors influencing the financialization of entity enterprises, scholars have found that the allocation of financial assets by entity enterprises is influenced by macro-environmental factors, including economic policy uncertainty, economic cycles, capital market development, monetary policy, industrial policy, and private financial development, as well as micro factors, including institutional investor shareholdings, intra-group capital markets, CEO financial backgrounds, management overconfidence, and diversification (Baker et al., 2016; González & Sala, 2014; Gulen & Ion, 2016; Julio & Yook, 2012; Lin & Tomaskovic-Devey, 2013; Luo & Zhu, 2014; Pástor & Veronesi, 2013). However, limited attention has been paid to how SMEs, as special beneficiaries of the rapid development of digital finance, allocate their assets and whether they increase their financial assets driven by profit-seeking capital.
In contrast to large enterprises, which generally have a standardized strategic decision-making process and asset investment decisions and are less restricted by financing sources, SMEs are more flexible in their decision-making and are more likely to be limited to immediate interests and rush after short-term profits (Liu et al., 2022; Nicolas, 2022; Saunila, 2020). However, they often have restricted access to financing (Singh & Kaur, 2021). In the traditional financial services system, financial capital is allocated mainly to inefficient but safe state-owned enterprises or policy-supported industries and sectors, while banks shut out many SMEs (Hornuf et al., 2021). Digital finance provides SMEs with substantial, low-cost access to financing. However, compared to large companies that can choose from diverse investment opportunities, SMEs often find it difficult to find good investment opportunities and may invest the financing they acquire through digital finance in financial assets to obtain short-term gains. The external financing environment for SMEs has changed, as has the financing approach; such changes will inevitably affect the asset allocation behaviors of enterprises. Financial asset investments require an enterprise to have spare funds and a certain level of risk management capability. The revolutionary changes brought about by information technology have made it easier to measure the rate of return and risks of investment projects, influencing the choice of investment in financial asset projects. Against this background, we propose the following hypothesis:
H1: The development of digital finance has a positive effect on financialization in SMEs’ asset allocation.
Digital finance has freed itself from the constraints of brick-and-mortar outlets and built direct communication platforms between the supply and demand sides of funds using artificial intelligence, big data, the Internet, and other network information technologies. Thus, it effectively brings together the funds of retail investors straying from the capital market at a lower cost, thereby enabling them to provide financial services with relative cost advantages and alleviating SMEs’ financing constraints. The impact of digital finance on asset allocation is mainly achieved by alleviating SMEs’ financing constraints, with information asymmetry often considered an important cause of financing difficulties for SMEs. While traditional banking and financial institutions focus more on hard information such as financial statements and collateral when approving loans (Jin et al., 2022), digital finance relies on a large amount of non-financial information deposited on the Internet to measure relevant credit models (Herzenstein et al., 2011). This big data processing model crosses the financing threshold set by traditional financial institutions and alleviates the disadvantage of inadequate hard information for SMEs, allowing them access to financing. In other words, digital finance can reduce information asymmetries and break down the financing boundaries set by traditional financial institutions, enabling capital markets to converge toward a state without financial markets.
However, emerging technologies have boosted technological innovation in the traditional financial services sector (Hilmersson & Hilmersson, 2021; Ma & Zhu, 2022), forcing traditional banks and other financial institutions to engage in intense market competition (Banerji & Fang, 2021), leading to a spillover effect in alleviating information asymmetry for SMEs. With a new disruptive impact on risk assessment, information mining, and risk management (Arjunwadkar, 2018), digital finance has prompted traditional financial institutions, such as banks, to actively make changes, with commercial banks embarking on the development of technologies, including fintech and digital finance (Giaretta & Chesini, 2021), in which they use big data technologies to mine customer information and increase the probability of including long-tail groups in the scope of their services. Consequently, on the one hand, digital financing directly increases the availability of information for SMEs; on the other hand, it forces banks and other financial institutions to make technological changes through competitive effects and spillover effects (Hu et al., 2021), thereby increasing information transparency for SMEs and ultimately alleviating their financing constraints.
However, it remains questionable whether easing financing constraints for SMEs affects their level of financialization in asset allocation. This study maintains that it is necessary to analyze different financialization motivations simultaneously. On the one hand, if the financialization motivation of SMEs is manifested as a reservoir to serve the entity economy, with the continuous development of digital finance, decreasing information asymmetry and increasing access to external financing opportunities that enterprises face will, to some extent, alleviate SMEs’ financing constraints (Si et al., 2021). On the other hand, the reservoir theory suggests that non-cash financial assets provide strong liquidity, and enterprises that identify potential investment opportunities or face financing constraints can quickly liquidate financial assets to ease liquidity constraints (Almeida et al., 2004). According to this logic, if digital finance eases SMEs’ financing constraints (Nikolov et al., 2021), it may reduce their allocation of financial assets. In other words, digital finance development should reduce the financialization of SMEs. However, existing literature reveals that there are still imbalances and inadequacies in the development of digital finance in China at the current stage, a fact that may result in new types of financial exclusion, as some disadvantaged groups are unable to fully enjoy the benefits of digital finance without appropriate Internet tools and financial literacy. Suppose SMEs lack hardware facilities or technical talent to cope with changes in information technology, or are in such a poor financial ecosystem that they are slow to respond to new technological changes and unable to keep up with the development of digital finance; in this case, this will have a limited impact on alleviating the enterprises’ financing constraints. Even if the financing environment of SMEs has somewhat improved, they will still make precautionary savings subject to the availability of resources to cope with possible future financial distress. In other words, digital finance may also increase the financial asset allocations in the context of the reservoir effect.
In contrast, if SMEs allocate financial assets motivated by the investment substitution theory, they may allocate higher-yielding financial assets when financing constraints are alleviated, and they are encouraged to improve their corporate performance and chase financial profits in the face of a downturn in the entity economy. Therefore, the alleviation of financing constraints through digital finance becomes a funding source for investments in financial assets, leading to a higher proportion of financial asset allocation. Accordingly, we propose Hypothesis 2.
H2: Digital finance improves the financialization level of SMEs by alleviating their financing constraints.
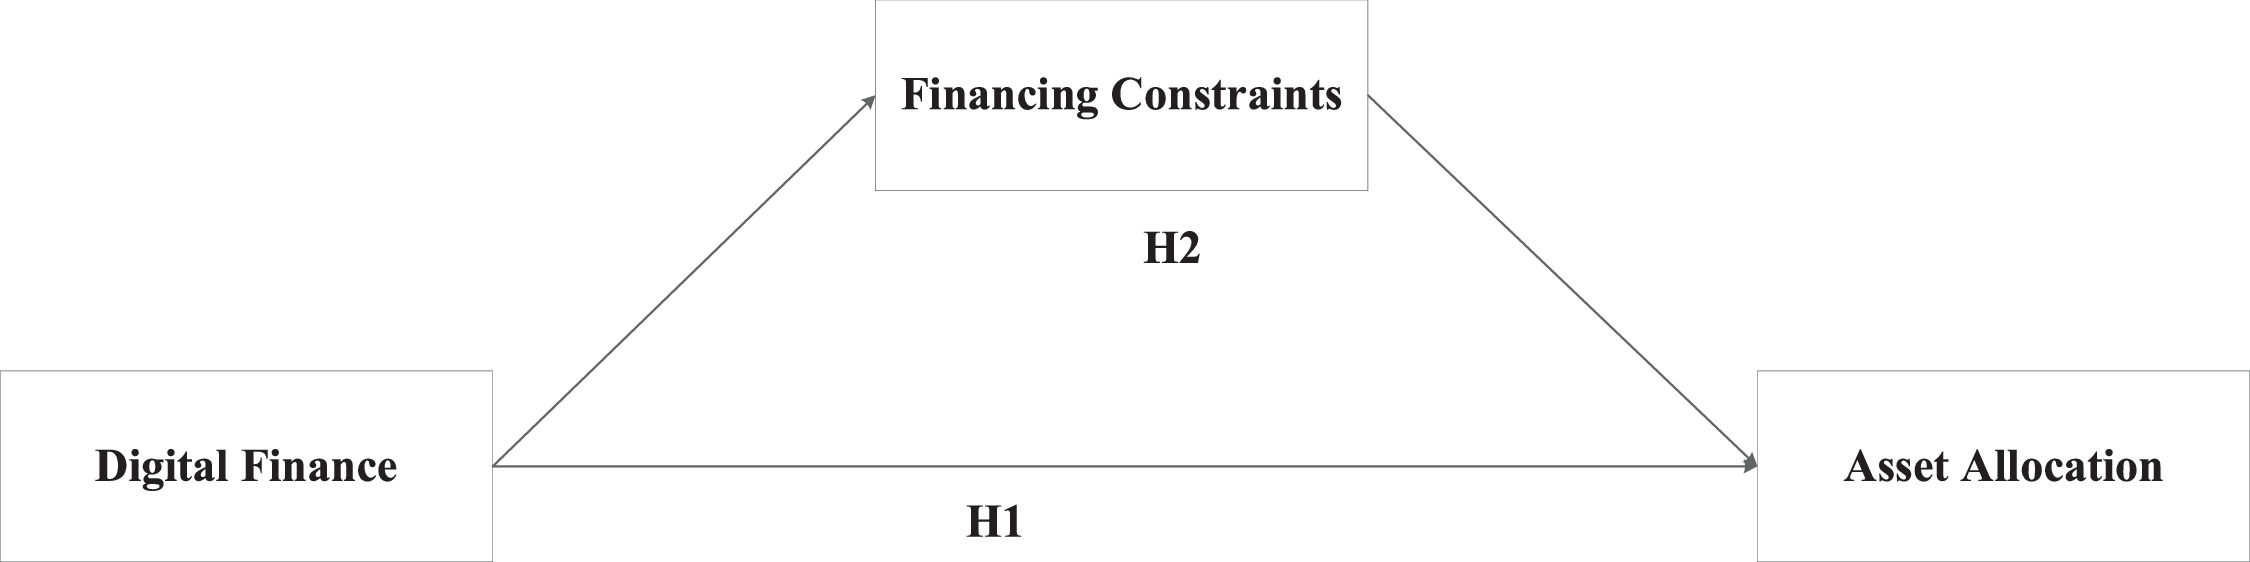
Summarizing the above hypotheses, we present the theoretical framework in Fig. 1, which demonstrates the relationship between digital finance and asset allocation. As an independent variable, digital finance is expected to be positively related to asset allocation (H1), and financing constraints mediate the relationship between digital finance and asset allocation.
MethodologySample selection and data sources
We primarily obtained financial data of companies listed on the China Shenzhen Stock Exchange: Small and Medium Enterprise Board (SMEB; the SMEs described in the current study refer to these enterprises) from 2011 to 2018 (Feng et al., 2022; Zhao & Su, 2022). The SMEB is an SME coalition set up by the Shenzhen Stock Exchange in February 2003 to encourage independent innovation. It is positioned to provide financing channels and development platforms for SMEs with prominent businesses and growth, promoting rapid growth and development. Companies listed on the SMEB are relatively small in scale compared to the main board, and SMEs often face financing constraints in China. Therefore, digital finance may affect investment behavior by alleviating corporate financing constraints. The core explanatory variable of this study is the digital finance index released by the Digital Finance Research Center of Peking University, and the data are available from 2011 to 2018.
To make the sample data more representative, they are processed as follows (Chen et al., 2020; Xu & Guo, 2021; Zhao & Su, 2022): we exclude ① banking, securities, insurance, and other financial listed companies; ② samples with missing data on the main variables; ③ company samples with negative book values of owner's equity; and ④ insolvent company samples. Among them, the digital financial related index comes from the Digital Finance Research Center of Peking University, the data for calculating financialization and the related financial data of listed companies come from the China Stock Market & Accounting Research Database (CSMAR), and data on the Monetary Policy and Regional GDP growth are derived from the “China City Statistical Yearbook.” All continuous variables were winsorized by year at the 1% and 99% levels. We selected listed companies from 2011 to 2018, including 3961 observations as our research sample.
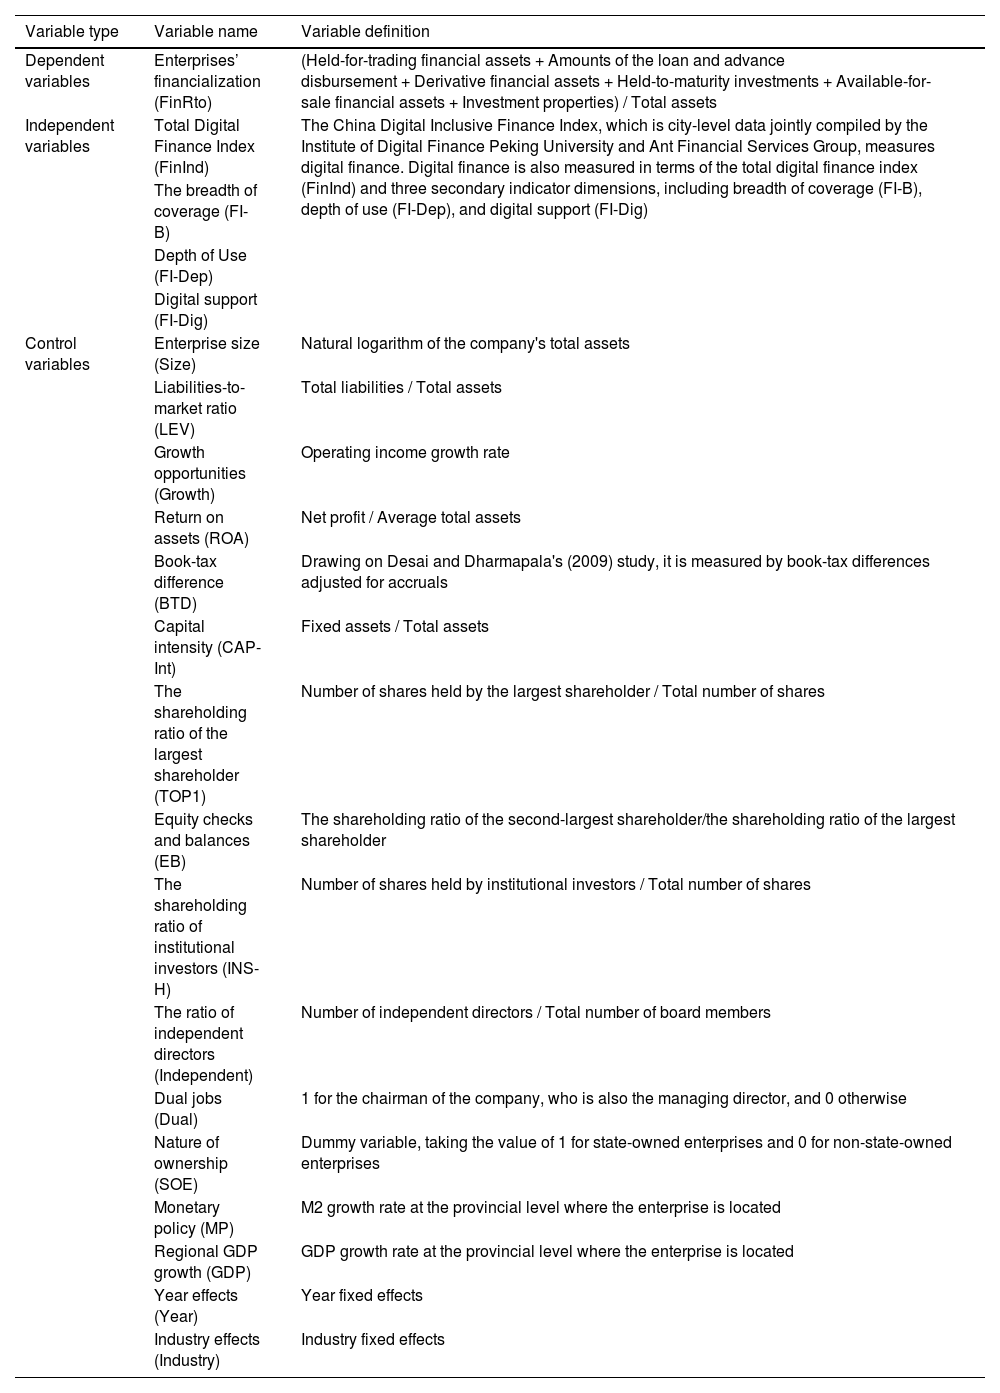
Definition of variablesDependent variablesFinancialization of the asset allocation of SMEs (FinRto): Drawing on Demir's (2009) study, the ratio of financial assets to total assets was used as a measure. Financial assets include held-for-trade financial assets, loan and advance disbursement amounts, derivative financial assets, held-to-maturity investments, available-for-sale financial assets, and investment properties (Bonizzi, 2013; Huang et al., 2022; Klinge et al., 2021; Sawyer, 2013). Held-for-trading financial assets refer to financial assets held by enterprises measured at fair value and whose changes are included in current profit and loss, including bond, stock, fund, and warrant investments. Held-to-maturity investments refer to debt securities that companies plan and hold due, such as fixed-rate treasury bonds and floating-rate corporate bonds purchased by companies from the secondary market. Available-for-sale financial assets refer to debt and equity securities other than trading financial assets and held-to-maturity investments. Enterprises purchase available-for-sale financial assets, including division able-for-sale stock investments, bond investments, and other financial assets, to obtain interest, dividends, or market value appreciation.
Independent variablesDigital finance (FinInd): This is measured by the China Digital Inclusive Finance Index, jointly compiled by the Institute of Digital Finance, Peking University, and Ant Financial Services Group. This indicator consists of the breadth of coverage (FI-B), depth of use (FI-Dep), and digital support (FI-Dig). The latest rules and methodology for compiling the index can be found in a prior study (Guo et al., 2020). The four indicator dimensions of inclusive finance development were scaled by dividing them by 1000 to obtain the same level of measurement.
Financing constraints (SA): Drawing on a method proposed in prior research (Hadlock & Pierce, 2010), SA is measured using the SA index.
Size is the size of the enterprise, and age is the duration since its establishment. The SA index calculated using the above method is negative, and the larger the SA index, the stronger the degree of financing constraints.Control variables
Drawing on relevant studies, we select the following control variables: enterprise size (Size), liabilities-to-market ratio (LEV), growth opportunity (Growth), return on assets (ROA), the book-tax difference (BTD), capital intensity (CAP-Int), the shareholding ratio of the largest shareholder (TOP1), equity checks and balances (EB), the shareholding ratio of institutional investors (INS-H), independent directors’ shareholding (Independent), Dual jobs (Dual), monetary policy (MP), and regional GDP growth rate (GDP). This study also controls for year fixed effects (Year) and industry fixed effects (Industry), as shown in Table 1.
Definition of variables.
Following prior research (Feng et al., 2022; Li et al., 2012; Liu & Liu, 2022; Zhao & Su, 2022), we build Model 2 and use the panel regression model to test the impact of digital finance on enterprises’ financialization (H1) :

Following previous studies (Chen et al., 2020; Davis, 2017; Zhao & Su, 2022), we use variables that may affect corporate financialization in the regression. In addition, we control for industry and year fixed effects by excluding the impact of heterogeneity among industries and years (Xu & Guo, 2021). Standard errors are clustered at the city levels (Abadie et al., 2023; Petersen, 2009; Thompson, 2011). Empirical analyzes were performed using Stata 17.0.
The dependent variable is FinRtoi,t, measured by the ratio of financialization of asset allocation in Model 2, wherein “i” represents the enterprise, “t” represents the time (year), and “c” represents the region (city). Considering the robustness of the results, we used both sub-dimensional indicators of digital finance in the regression results, including the breadth of coverage (FI-B), depth of use (FI-Dep), and digital support (FI-Dig). The α1 is significantly negative, which supports the reservoir effect of the financial asset allocation of SMEs. However, the α1 is significantly positive; it could be motivated by either the reservoir effect or investment substitution, for which further empirical testing is needed to determine the dominant motive.


Models (3) and (4) were built based on Model (2) to test the mediating effect of financial constraints. If β1 is significantly negative in Model (3), it indicates that the development of digital finance has alleviated SMEs’ financing constraints, and the intermediation effect is further tested using Model (4). In Model (4), if γ1 is significantly positive (negative) and γ2 is significantly negative, financing constraints have a partial mediating effect. If γ1 is insignificant and γ2 is significantly negative, it indicates that financing constraints have a full mediating effect.
Based on prior literature (Alesina & Zhuravskaya, 2011; Persico et al., 2004), we further examine the mediating effect of the mediator. We use Model (3) and Model (4) to test H2.
We mainly use Model (3) to investigate the influence of core explanatory variables on mediator variables, and the influence of mediator variables on explained variables is clarified with the help of previous literature and theoretical logic. In addition, referring to the stepwise method for testing the mediation effect proposed in prior research (Baron & Kenny, 1986), we include the intermediary variable SA in Model (4) and investigate the absolute value of the estimated coefficient of FinInd. Compared to Model (2), the mediation effect of financing constraints was tested, including the direct and indirect effects of digital finance on SMEs’ allocation of financial assets.
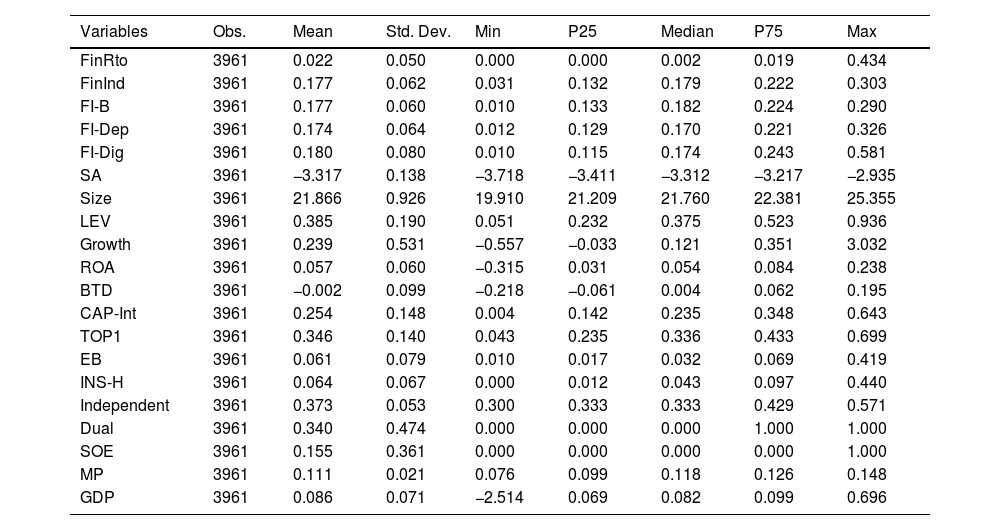
Empirical resultsDescriptive statistical analysisTable 2 presents the results of the descriptive statistics, with a mean of 0.022 and a median of 0.002 for FinRto. It is worth noting that this study only includes enterprises on the SMEB, which indirectly reflects the increased level of financialization of SMEs’ asset allocation in China in recent years. The 75th percentile of FinRto is 0.019, with a maximum value of 0.434, indicating that some SMEs show a high degree of financialization.
Descriptive statistical analysis.
For FinInd, the minimum and maximum values were 0.031 and 0.303, respectively. The gap between the maximum and minimum values of the secondary indicators FI-B, FI-Dep, and FI-Dig was also large, indicating considerable gaps in the development of digital finance in different years and cities. As a dynamic process, the development of digital financial inclusion continues to change with the development of the economy, society, and financial systems. The status of digital financial inclusion in the same region has changed in different years. In addition, owing to differences in endowment, economic development level, structure, policies, and systems, there will be differences in the performance of inclusive digital finance in different regions in the same year. This difference was mainly with regard to the time dimension (2011−2018), but there were also differences based on the regional dimension. The difference between regions is one order of magnitude, whereas the difference in the time dimension spans another order of magnitude (Demirgüç-Kunt & Klapper, 2012; Huateng et al., 2021).
China's digital financial inclusion achieved rapid development between 2011 and 2018 (Guo et al., 2020; Jingyi et al., 2016). The median value of the digital financial inclusion index for China's provinces in 2011 was 0.034, increasing to 0.294 in 2018, with an average annual growth rate of 36.4%. For example, the total index value of Beijing was 0.079 in 2011 and 0.369 in 2018, whereas the values for the Tibet Autonomous Region were 0.016 in 2011 and 0.274 in 2018. Regarding the sub-indices, the digitalization index of inclusive finance grew the fastest between 2011 and 2018, followed by the digital finance coverage breadth index (with a slight difference), and the digital finance uses depth index grew the slowest. The growth rate of each index category in different years also differed. The growth rate of the depth-of-use index is rapid, and it has become an important driving force for the growth of the digital financial inclusion index. Because the coverage of digital finance and the degree of digitization have reached a certain extent, the depth of use of digital finance will become an increasingly important driver of exponential growth.
From the regional dimension, the difference was relatively significant in 2011, but as time passed, the difference gradually narrowed. Although digital financial inclusion is growing, similar to most of China's economic characteristics, there are still significant regional differences in the degree of digital financial inclusion development in China. In 2018, Shanghai, which scored the highest on the digital financial inclusion index, was 1.4 times that of Qinghai Province, which had the lowest score. According to the scale of social financing, the increase in Shanghai's per capita social financing scale in 2017, which was the highest, was 8.4 times that of Jilin, which had the lowest score. These comparisons show that digital finance has better geographical penetration and has formed a broader coverage of inclusive finance than traditional finance. We believe that what matters is that the gap between regions in digital financial inclusion is smaller than that in traditional finance, but more importantly, whether the gap between regions in digital financial inclusion has narrowed over time. Suppose that regional differences in digital financial inclusion can be gradually reduced even if the backward regions are relatively lagging at the beginning of the period; in this case, there remains the possibility of catching up later so that they do not lose at the starting line, which should be a characteristic of digital financial inclusion.
Regression analysisTable 3 shows the regression results for H1. Columns (1), (2), (3), and (4) show the results of the regressions on the financialization level of the asset allocation of entity enterprises based on the total digital finance index (FinInd), breadth of coverage (FI-B), depth of use (FI-Dep), and digital support (FI-Dig). The regression coefficients for FinInd, FI-B, FI-Dep, and FI-Dig are 0.1144, 0.0789, 0.1062, and 0.0598, respectively, which are significantly positive at the 1% level. In other words, the empirical data support H1; digital finance development increases the proportion of financial asset allocation. The regression results of the control variables show that LEV, ROA, and CAP-Int are all negatively related to SMEs’ financialization. In other words, enterprises with a higher LEV are under financial pressure and lack the resources to allocate financial assets. In addition, SMEs with a higher ROA focus on their main business and do not allocate financial assets for precautionary or investment substitution motives. In contrast, SMEs with higher CAP-Int tend to invest in entity assets and are less likely to allocate financial assets. Size, BTD, and independence are positively related to SMEs’ financialization, indicating that larger enterprises have a higher tendency to invest in financial assets; enterprises with BTD motives may be more active in financial asset speculation; an increase in the proportion of independence also increases the level of financialization in the asset allocation of SMEs.
Development of digital finance and asset allocation of SMEs.
Note: *, **, and *** indicate significance at the 10%, 5%, and 1% levels, respectively. T-values adjusted for robust standard errors (clustering at the city level) are in parentheses.
While previous empirical results confirm that digital finance increases the level of financialization in SMEs’ asset allocation to a certain extent, omitted variables or reverse causality could disturb the findings of this study. To reduce these adverse effects, this study uses the provincial Internet penetration rate as an instrumental variable of digital finance, with Internet penetration measured primarily in terms of provincial Internet broadband access ports. On the one hand, Internet broadband access ports, as the infrastructure of digital finance, are closely linked to the development of digital finance; on the other hand, Internet broadband access ports do not affect the level of financialization of an enterprise's asset allocation. In other words, the Internet penetration rate, as an instrumental variable of digital finance, fully satisfies the conditions of relevance and exogeneity of instrumental variables. Table 4 presents the basic results of the approach of instrumental variables. The regression coefficients of the first-stage regression results for digital finance are significantly positive at the 1% level, indicating that the instrumental variables are related to the endogenous variables, with F-values of 732.62, 462.60, 546.00, and 498.14, indicating that there are no weak instrumental variables. In the second-stage regression, the first-stage regression is used to obtain the fitted values of FinInd^, FI-B^, FI-Dep^, and FI-Dig^ as replacements for actual digital finance development. The results show that digital finance positively influences the financialization level of SMEs’ asset allocation, indicating the robustness of the study's findings.
Regression results: Approach of instrumental variables.
Note: Values in parentheses in the first-stage regression results are t-values, whereas those in the second-stage regression results are z-values.
Additionally, this study uses the exogenous shock caused by the financial inclusion policy to solve the endogeneity problem. In November 2013, China officially proposed the development of inclusive finance in the “Decision of the Central Committee of the Communist Party of China on Some Major Issues Concerning Comprehensively Deepening Reform.” This indicates that digital finance has entered a new era. Therefore, we set 2014 as the initial year of the policy shock. We use a dummy variable (POST) to represent policy shocks. POST was defined as 0 if the year was between 2011 and 2013, and defined as 1 if the year was between 2014 and 2018. Digital finance and policy impacts are the independent variables. Table 5 shows the regression results for the impact of the financial inclusion policy. The coefficient of interaction FinInd*POST (β=0.1204, p < 0.05) is significantly positive. Therefore, digital finance significantly improves the financialization level of SMEs after the financial inclusion policy.
Results on the exogenous policy shock.
Note: *, **, and *** indicate significance at the 10%, 5%, and 1% levels, respectively. T-values adjusted for robust standard errors (clustering at the city level) are in parentheses.
Academics usually measure the level of financialization of an enterprise's asset allocation from financial assets and returns; however, there is no consensus on the specific variables to be used to measure financial assets. We redefine the components of financial assets from an asset perspective, with held-for-trading financial assets, derivative financial assets, net available-for-sale financial assets, net held-to-maturity investments, net long-term bond investments, entrusted loans, wealth management products, trust investments, investment properties, and the investment component of long-term equity investments in financial institutions defined as an enterprise's investment in financial assets and processed by the total asset deflator to obtain a new level of financialization of an enterprise's asset allocation (FinRtoN). Table 6 shows the regression results after replacing the financialization level of enterprises’ asset allocation. The coefficient of digital finance remains significantly positive. The finding that digital finance affects SMEs’ financialization level of asset allocation is not influenced by the current controversy regarding the definition of financial assets.
Measurement to replace the level of financialization of SMEs’ asset allocation.
Note: *, **, and *** indicate significance at the 10%, 5%, and 1% levels, respectively. T-values adjusted for robust standard errors (clustering at the city level) are in parentheses.
In the above descriptive statistical analysis, the minimum value of FinInd is 0, and the first quartile remains 0, indicating that at least 25% of SMEs did not allocate financial assets during the sampling period of this study. In other words, FinInd is the restricted dependent variable, and a linear regression using ordinary least squares for the entire sample may lead to inconsistent estimates. The Tobit regression method is appropriate when dependent variables are restricted or merged (McDonald & Moffitt, 1980; Tobin, 1958), which is standard practice for studies involving dependent variables with similar characteristics (Berchicci, 2013; Yi et al., 2017). The dependent variable FinRto in this study was eligible. Table 7 presents the results of the Tobit model. The regression coefficient for digital finance remains significantly positive, but the coefficient for digital finance is significantly larger than the ordinary least squares estimation. In other words, model estimation using ordinary least squares may underestimate the positive impact of digital finance on SMEs’ financialization of asset allocation.
Tobit model results.
Note: *, **, and *** indicate significance at the 10%, 5%, and 1% levels, respectively. T-values adjusted for robust standard errors (clustering at the city level) are in parentheses.
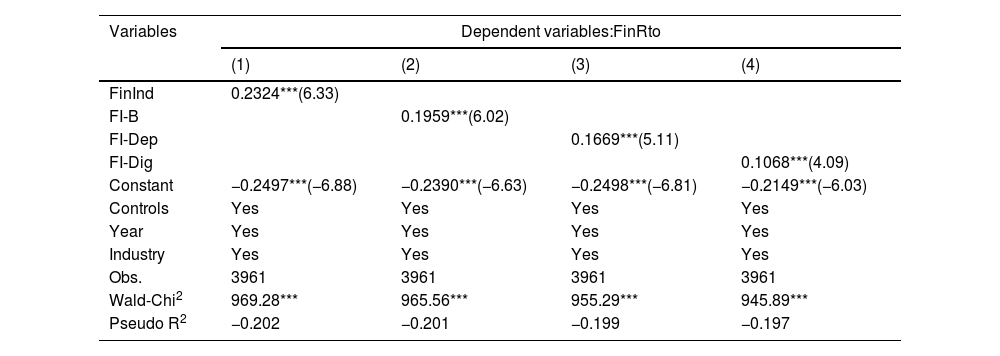
As digital finance benefits micro, small, and medium enterprises (MSMEs) and poor- and low-income groups, in the main regression results, we sampled enterprises on the SMEB to test the implementation effect of digital finance. However, some large-scale enterprises on the SMEB are not the actual targets of digital finance, which may affect the effective evaluation of digital finance. Consequently, we further sorted the research samples according to enterprise size and selected samples below the median to re-run the regression analysis. We used samples with 1981 observations and firm sizes below the median. The regression results are presented in Table 8. The regression coefficients of digital finance are 0.1569, 0.1063, 0.1241, and 0.1048, which are greater than those of the main regression results (0.1144, 0.0789, 0.1062, and 0.0598). Therefore, digital finance has a more positive impact on the financialization tendencies of small-scale enterprises, indicating that digital finance can better alleviate their financing constraints, thereby increasing their levels of financialization.
Samples of small-scale enterprises.
Note: *, **, and *** indicate significance at the 10%, 5%, and 1% levels, respectively. T-values adjusted for robust standard errors (clustering at the city level) are in parentheses.
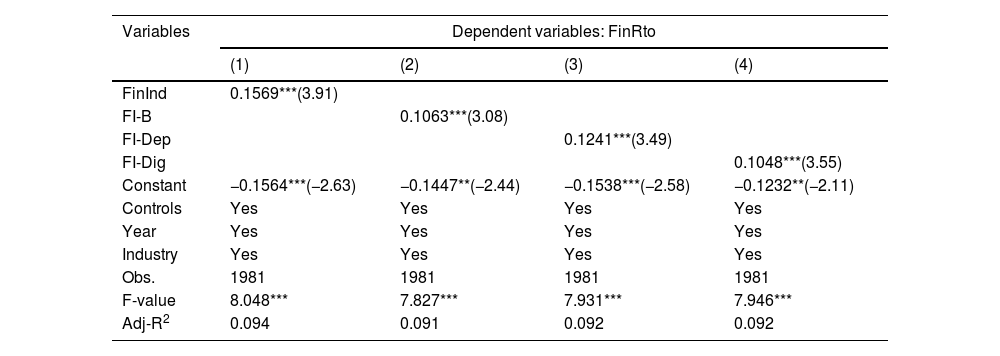
A typical event within the time range examined in this study is the 2015 stock market crash. A severe shock to the capital market aggravates uncertainty in the future business environment. The external economic environment also affects digital finance development. In a bull market, the capital market's high profits drive the corporate financial capital market to speculate on securities. However, financial asset prices fluctuate violently in bear markets, limiting enterprises’ financialization. Therefore, we remove the observations from 2015 and show the regression results using 3369 observations (Table 9) to eliminate the impact of the stock market crash. The significance of the regression coefficient of digital finance did not change, indicating that the stock market crash in 2015 had no substantial impact on the conclusions of this study.
Regression results of the sample without the year 2015.
Note: *, **, and *** indicate significance at the 10%, 5%, and 1% levels, respectively. T-values adjusted for robust standard errors (clustering at the city level) are in parentheses.
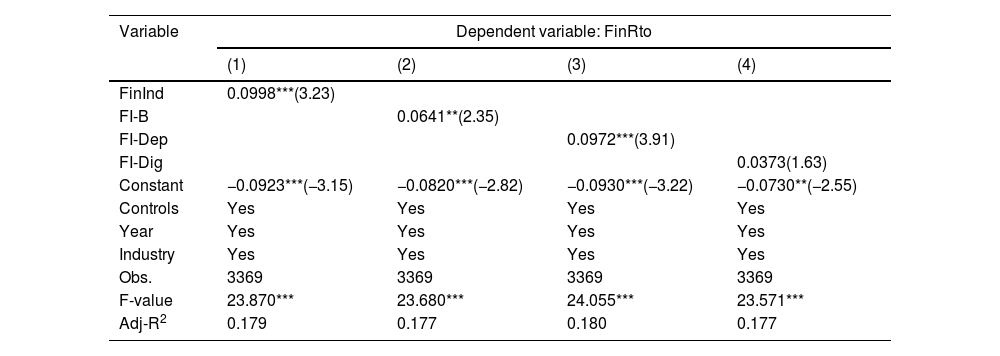
The Digital Finance Research Center of Peking University updated the Digital Financial Inclusion Index in 2021 (Phase III, 2011−2020) and 2022 (Phase IV, 2011−2021) in order to reflect China's current economic situation. We use data for 2019−2021 and 2011−2021 to re-examine the relationship between digital finance and financial asset allocation. In addition, it should be noted that in 2018, listed companies in China implemented the new edition of the “Accounting Standards for Business Enterprises,” which converges with the IFRS9 “Financial Instruments” standard for financial statements issued by the International Financial Reporting Standards Board (IASB) in 2014. The accounting treatment of financial assets changed significantly in the new edition of the Financial Instruments Standards. It stipulates the “business model” and “cash flow characteristics of financial assets contracts” held by enterprises as the bases for judging the classification of financial assets. Financial assets are classified into three categories: financial assets measured at amortized cost; financial assets measured at fair value and whose changes are included in other comprehensive income; and financial assets measured at fair value and whose changes are included in current profit and loss. “Investment to maturity” and “available-for-sale financial assets” are no longer used, while “debt investment,” “other debt investment,” “other equity instrument investment,” and “other illiquid financial assets” have been added (Huang et al., 2022; Xu & Guo, 2021; Zhao & Su, 2022).
Therefore, enterprises’ financialization from 2019 to 2021 was calculated according to the following equation (Bonizzi, 2013; Klinge et al., 2021; Sawyer, 2013): FinRto = (Held-for-trading financial assets + amount of loans and advances issued + derivative finance assets + debt investment + other debt investment + other equity instrument investment + other illiquid financial assets + investment real estate) / total assets of the enterprise. The empirical results are presented in Table 10. The coefficients of the core explanatory variables decrease but are still positive and significant at the 1% level, indicating that digital finance has increased the proportion of financial assets held by SMEs. Therefore, the use of updated data did not change the main conclusions.
Samples of 2019−2021 and 2011−2021.
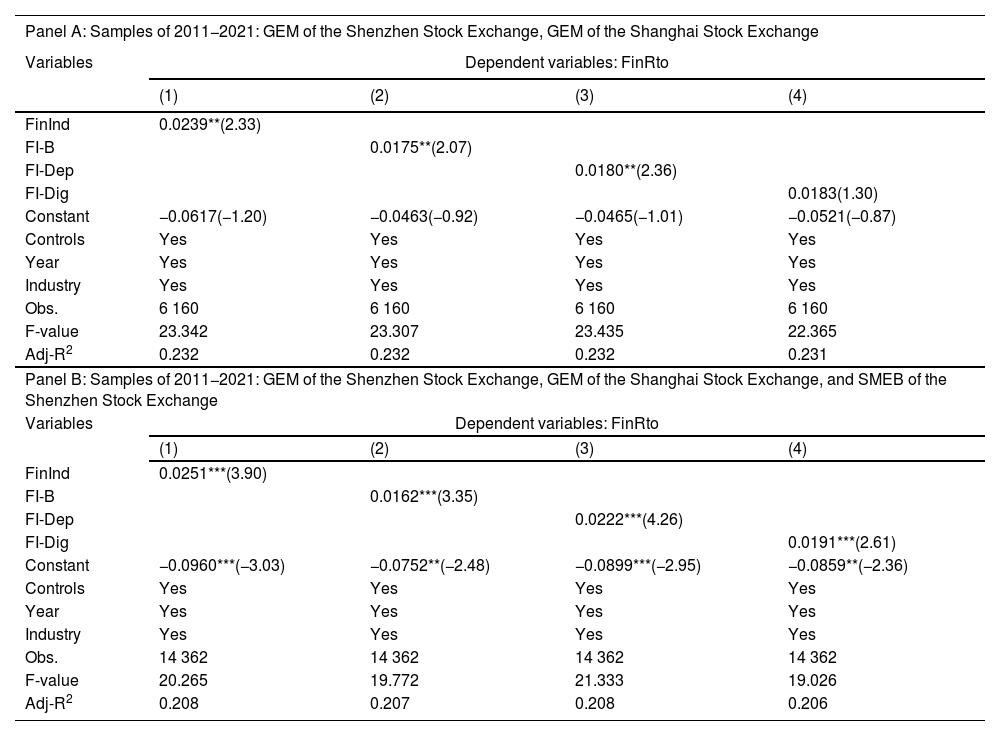
Chinese stock exchanges operate in several major markets, including the Shanghai and Shenzhen Main Board, Science and Technology Innovation Board (STIB), Growth Enterprise Market (GEM), and Shenzhen SMEB. The main board mainly serves large and mature enterprises, the GEM mainly serves to grow innovative and entrepreneurial enterprises, and the STIB mainly serves scientific and technological innovation enterprises. Shenzhen's SMEB mainly provides services for SMEs in specific regions.
To test the robustness of our conclusions, we first use samples from the GEM of the Shenzhen Stock Exchange from 2011 to 2021 and the STIB of the Shanghai Stock Exchange, which officially opened in July 2019. We then use the complete sample, which includes the GEM of the Shenzhen Stock Exchange, STIB of the Shanghai Stock Exchange, and SMEB of the Shenzhen Stock Exchange. The empirical results are presented in Table 11. The coefficient of the core explanatory variable remains unchanged, and the significance level is slightly different. Therefore, changing the sample does not change the main conclusions.
Samples of the GEM of the Shenzhen Stock Exchange, GEM of the Shanghai Stock Exchange, and SMEB of the Shenzhen Stock Exchange.
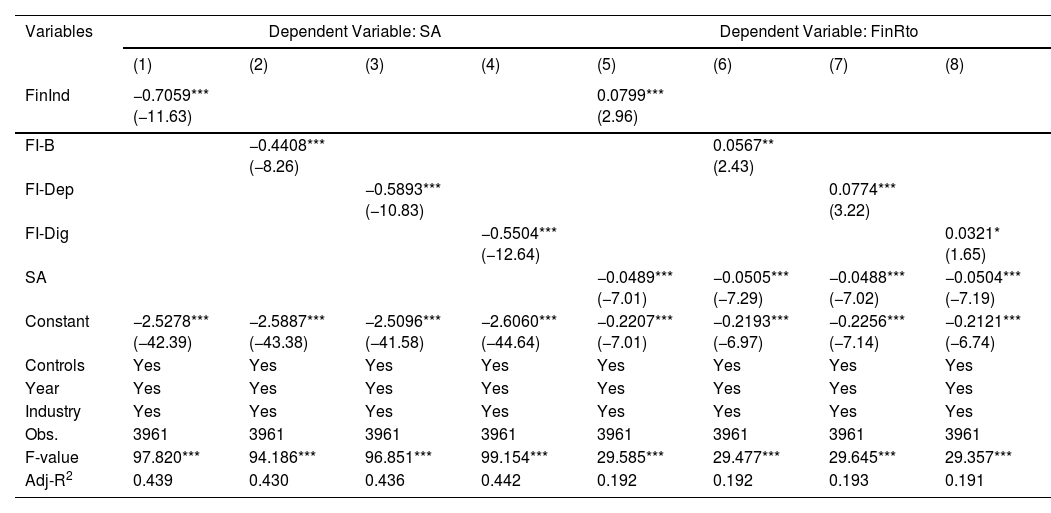
Table 12 shows the mediating effects of financing constraints. Columns (1)–(4) present the empirical results of the impact of digital finance development on enterprises’ financing constraints. This reveals that digital finance significantly reduces the degree of enterprises’ financing constraints, both in terms of the total digital finance indicator and the sub-indicators of each dimension; that is, the second step of the mediating effect test is valid, which then moves on to Model (4) to verify the existence of the mediating effect and the degree of mediation. Columns (5)–(8) provide further evidence of the mediating effect of financing constraints; the regression coefficient for financing constraints is significantly negative at the 1% level. That is, stronger financing constraints reduce enterprises’ financialization levels. By contrast, the regression coefficient for digital finance is significantly positive, at least at the 10% level. In other words, the total effect of digital finance on enterprises’ financialization remains, but the coefficient is lower than that of the main regression results, suggesting that financing constraints have a partial mediating effect on the influence of digital finance on enterprises’ financialization. The z-values of the Sobel test are 3.125, 3.303, 3.237, and 3.246 for the different digital finance measurement methods. In other words, the mediating effect of financing constraints was significant, verifying the validity of H2. The study further calculates the intermediary effect shares, which are 13.26%, 12.39%, 14.49%, and 17.91% for financing constraints when FinInd, FI-B, FI-Dep, and FI-Dig, respectively, are used as digital finance measurement methods. As a result, partial mediating effects of financing constraints exist both economically and statistically. However, Hayes (2022) criticizes the formulation of partial intermediaries, arguing that if some intermediaries are found statistically, the current model has not characterized at least some of them. Therefore, partial intermediaries must be interpreted with caution.
Tests on the mediating effects of financing constraints.
Note: *, **, and *** indicate significance at the 10%, 5%, and 1% levels, respectively. T-values adjusted for robust standard errors (clustering at the city level) are in parentheses.
Within the theoretical framework, we suggest that digital finance promotes financial asset allocation by alleviating the financing constraints. The motivation for SMEs’ financial asset investment may be either “precautionary saving” or “investment substitution.” Thus, we further investigate the influence of digital finance on SME financialization in different contexts to identify the dominant motive.
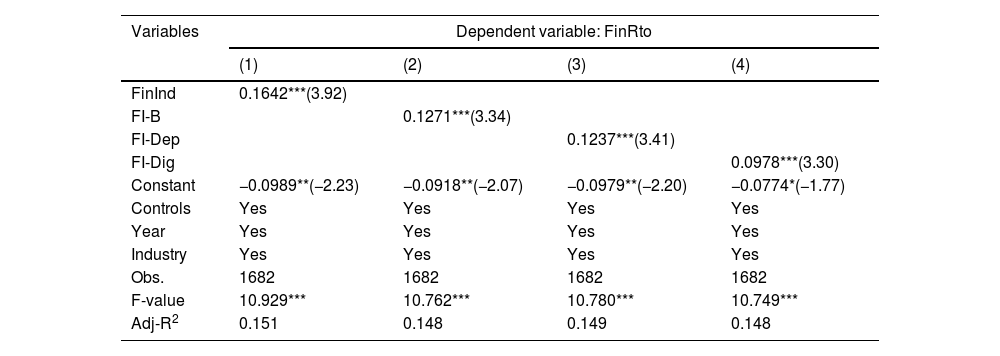
Effect of investment opportunitiesWe discuss asset allocation decisions when facing abundant external investment opportunities. On the one hand, when enterprises have sufficient external investment opportunities, they will sell financial assets to meet the capital needs of external entities if the motivation for financialization is precautionary saving. The influence of digital finance on SME financialization is significantly negative or non-significant for underinvested enterprises. However, although enterprises face good external investment opportunities, they lack the willingness to invest in the real economy if financialization motivates investment substitution. The influence of digital finance on financialization is significantly positive. Therefore, drawing on prior research (Richardson, 2006), we use the investment efficiency of enterprises measured by an inefficient investment model and a sample of underinvestment to build a regression model. The results are presented in Table 13. The coefficients of digital finance are significantly positive, supporting the perspective that financialization motivates investment substitution.
Regression model results on investment opportunities.
Note: *, **, and *** indicate significance at the 10%, 5%, and 1% levels, respectively. T-values adjusted for robust standard errors (clustering at the city level) are in parentheses.
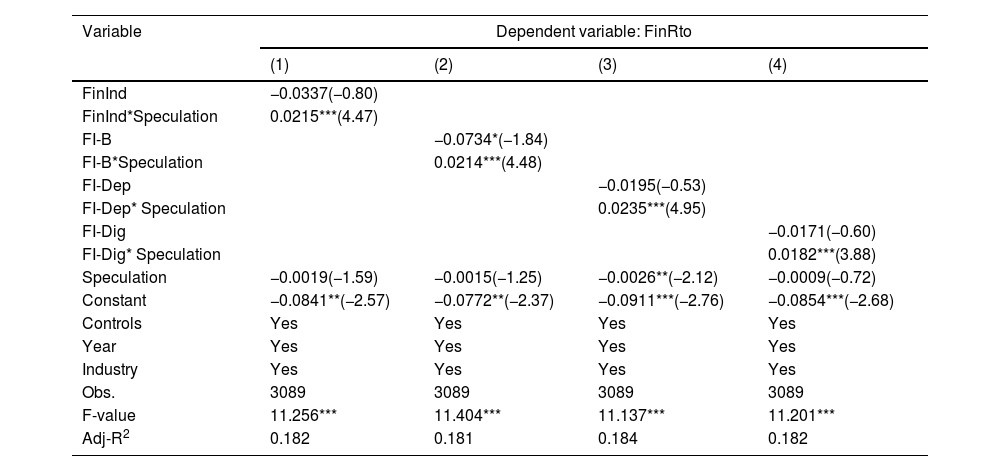
We then investigate the impact of speculation on the relationship between digital finance and financialization. Enterprises’ investment decisions are influenced by local informal institutions (Adhikari & Agrawal, 2016; Kumar et al., 2011), and so the speculation enhances the positive effect of digital finance on the financialization of SMEs if the allocation of financial assets is speculative. However, this speculation would make no difference if financial asset investments mainly avoid liquidity constraints in future business activities.
Referring to previous research (Griffiths, 1990; Walker, 1992), we use the number of regional gambling crimes to measure listed companies’ speculation. The data on gambling crime mainly come from the China Judgments Online databases and cover all Chinese cities from 2011 to 2018. The results of these speculative effects are presented in Table 14. The coefficient of interaction FinInd*Speculation (β=0.0215, p < 0.01) is significantly positive, supporting the view that speculation enhances the positive effect of digital finance on the financialization of SMEs.
Results on the speculation effects.
Note: *, **, and *** indicate significance at the 10%, 5%, and 1% levels, respectively. T-values adjusted for robust standard errors (clustering at the city level) are in parentheses.
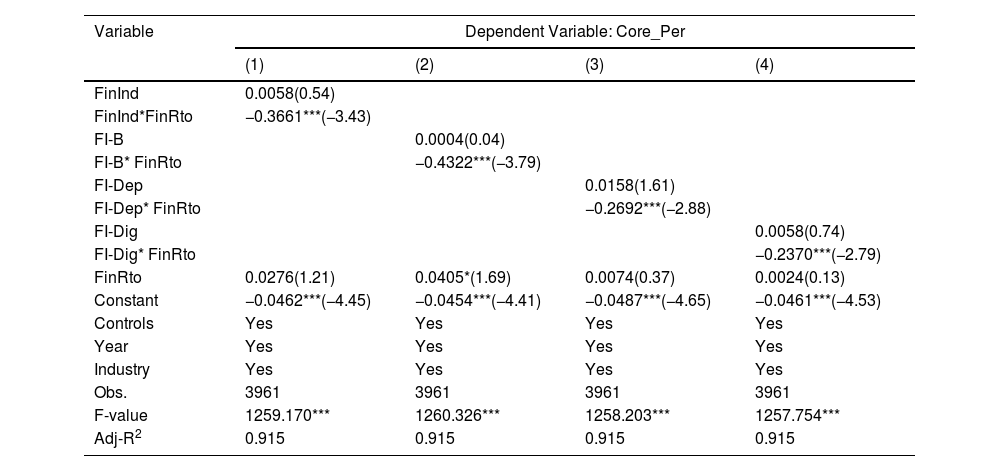
We examine the economic consequences of digital finance on the financialization of SMEs and identify motivations for financialization. From the alternative investment motivation perspective, scholars found that financialization did not provide capital for the development of the real economy but moved to the virtual economy, resulting in a series of negative consequences, including extrusion entity investment and innovation investment, risk of the stock price collapse, and damage to core performance. Therefore, the core performance of enterprises declines if the influence of digital finance on financialization is speculative. By contrast, core performance will increase if the influence of digital finance on the financialization of SMEs has a “reservoir effect.” The following formula calculates an enterprise's core performance:
Core performance (Core_Per) = (Operating profit - Investment income-gains on fair value changes + Investment income from associates and joint ventures) / Total assets
The regression results for the economic consequences of digital finance on SMEs’ financialization are shown in Table 15. The coefficient of interaction is significantly negative (β=-0.366, p < 0.01); although the development of digital finance alleviates financing constraints, SMEs allocate capital to speculative financial assets, thus reducing the performance of their main business in the future.
Regression results on core performance.
Note: *, **, and *** indicate significance at the 10%, 5%, and 1% levels, respectively. T-values adjusted for robust standard errors (clustering at the city level) are in parentheses.
Limited micro-level literature exists on the relationship between digital finance and corporate financialization in an emerging economy, and current literature is mainly on the positive impact of digital finance on access to finance (Bollaert et al., 2021; Farag & Johan, 2021). Digital finance provides opportunities for developing SMEs with strong financing constraints. However, the mechanisms underlying digital finance and asset allocation remain unclear. To bridge this gap, we investigate the impact of digital finance on firm-level financialization in asset allocation in Chinese SMEs. Our findings show that digital finance has a positive effect on financialization, and that financing constraints have a partial mediating effect on the relationship between digital finance and financialization. Further, this study investigates the motivation of SMEs’ financialization and finds that “investment substitution” rather than “precautionary saving” leads to SMEs’ financialization of asset allocation.
This study makes significant theoretical contributions to the literature. First, it adds to the literature on asset allocation by developing and testing a new model through which digital finance promotes financialization. Specifically, previous studies have focused on the macro-level antecedents of financialization, such as environmental regulation (Xie et al., 2022), new environmental protection measures (Liu & Liu, 2022), and economic policy uncertainty (Zhao and Sun, 2022); the current study strengthens prior research by introducing a new firm-level concept of digital finance that influences the asset allocation process. Second, this study enhances knowledge about the underlying mechanism of digital finance on financialization, which remains a neglected area in the literature. By demonstrating that financing constraints partially mediate the relationship between digital finance and financialization, we uncover some mechanisms of the black box therein.
Although the data in this study relate to Chinese SMEs, they also have significant implications for other emerging economies because of the rapid development of digital finance. Considering the above findings, this study has several practical implications for both existing and emerging business leaders and policymakers who should apply digital innovation to maximize the competitive advantage of SMEs. First, the findings suggest that digital finance can effectively alleviate SMEs’ financing constraints. Therefore, digital technologies related to digital finance, such as big data, artificial intelligence, cloud computing, and blockchain, should be actively utilized to lower barriers to financial services and empower the entity economy. Furthermore, SME managers should alleviate financing constraints through digital finance and enhance their main business performance by increasing the quantity and quality of external financing, actively participating in digital transformation, and taking advantage of the convenience of digital finance. In addition, the findings show that digital finance has expanded SMEs’ access to and methods of financing, reduced financing costs, and eased their financing constraints. However, this has also led to the alienation of investment behaviors. Therefore, policymakers should issue financial regulation plans and reduce the potential scope of arbitrage. The key to preventing increased levels of financialization in SMEs’ asset allocation is to increase profitability in entity enterprises while reducing profitability in the financial industry. Government departments may actively guide SMEs to invest in entity industries and encourage them to focus on their main businesses through tax policies, government subsidies (Huang et al., 2021), and other means. Although digital finance alleviates SMEs’ financing constraints, it does not play a good governance role in investments. Therefore, more attention should be paid to the basic characteristics of corporate behavior in the institutional design of relevant digital finance development. Regulatory authorities should actively utilize new information technology platforms, such as big data and blockchain, to efficiently monitor financial market transactions in real-time, crack down on unlawful behaviors such as illegal leveraging and improper arbitrage, and reduce the possible negative impact of the development of digital finance.
limitationsThe study has some limitations. First, the generalizability of this study is limited by the context factors. China is a fast-growing and rapidly developing digital economy, and the conclusion of this study may not apply to other developed economies with sluggish GDP growth. In the future, research on the impact of digital finance on asset allocation could sample enterprises from Western countries to illustrate the consequence of digital finance more comprehensively. The second limitation concerns the mechanism. This study investigates only the financing constraints mechanism. Future research could focus on other channels of digital finance's impact on asset allocation and further expand our understanding of how digital finance affects firm growth.
Funding statementResearch funded thanks to the training Program of Young backbone Teachers of Henan University of Technology in 2021 (21,420,175) and the General Research Project of Humanities and Social Sciences of Henan Universities in 2022 (2022-ZZJH-035).
Data availability statementThe data used to support the findings of this study are included within the article.