


This study considers spatial and nonlinear perspectives to examine the heterogeneous role of green technology innovation in the economic development and air quality of Chinese cities. We find that green inventive technology innovation benefits economic development and air quality improvement, which have significant spatial spillover effects. Conversely, green improved technology innovation has no significant spatial spillover effect on air quality. The results show that urban heterogeneity exists in the effects of green technology innovation on the economy and air quality. From a regional perspective, green technology innovation in the central region improves air quality in neighboring cities; however, no effective spatial synergy mechanism has been established within other regions. From an administrative perspective, green technology innovation in municipalities and provincial capitals can effectively drive the win–win development of the urban economy and environment. Moreover, this study verifies the nonlinear effect of economic development; the single-threshold result indicates that an increase in the level of regional economic development facilitates the effect of green technology innovation to improve air quality. Furthermore, we elucidate the mediating role of economic development. This findings of this study offer decision-making guidance to drive economic and environmental win–win development through green technology innovation and achieve synergistic regional green development.
Green technology innovation is a pathway to sustainable development and has the dual attributes of being green and innovative (Chen et al., 2022a; Yang et al., 2022a). High pollutant emissions are accompanied by global economic booms, and environmental pollution has become a serious challenge for countries worldwide (Lee et al., 2022a; Yi et al., 2022). Particularly, the dilemma between economic growth and resources and environmental damage in China has become increasingly prominent, and achieving environmentally inclusive growth has become urgent (Sinha et al., 2020). The report on the 20th CPC National Congress emphasizes that green technology innovation is a driver of sustainability and an important technological reinforcement for enhancing high-quality urban development. As the primary tool for resolving economic–environmental conflicts (Liu et al., 2022; García-Sánchez et al., 2023), it is essential to explore whether green technology innovation can generate economic and environmental dividends for Chinese cities. If so, what are the underlying mechanisms?
In the era of sustainable development, the potential benefits and drawbacks of green technology innovation have become important academic topics (Schiederig et al., 2012; Lv et al., 2021; Dong et al., 2022; Lin & Ma, 2022). Specifically, numerous studies have acknowledged that green technology innovation can create a win–win solution for the economy and the environment (Chen et al., 2022a); however, scholars have also argued that green technology innovation has non-negligible risks and long payoff cycles (Zhu et al., 2021a; Zhang et al., 2022). Meanwhile, the double externalities and rebound effects of green technology innovation make it uncertain (Wang et al., 2021). Overall, existing research has ignored the heterogeneous types of green technology innovation and mechanisms underlying the correlation between green technology innovation and economic and environmental development, leading to mixed evidence on the role of green technology innovation. Thus, this study extends existing knowledge about the role of green technology innovation by modeling the correlations between innovation and the economy- environment.
In recent years, air quality, which comprehensively reflects urban environmental quality, has become a focus of environmental economics (Xin & Xin., 2022). Among these, PM2.5, the main air pollutant, has become the main indicator of air quality for significantly affecting human health and the atmospheric (Wu et al., 2020; Zhang et al., 2021). The synergistic effect of the urban space as a vehicle for high concentrations of economic and social activities cannot be ignored (Wang et al., 2021). Studies have also indicated that technology, economy, and environment are often spatially linked, which potentially affects the action mechanisms among them (Peng et al., 2021; Wang et al., 2021). Furthermore, economists have highlighted that there are various types of green technology innovation with various characteristics (Lian et al., 2022), but the heterogeneous effect of green technology innovation across different types on air quality and the economy has been neglected in the literature. Therefore, adopting spatial and nonlinear perspectives, we explore how green technology innovation heterogeneously influences economic development and air quality across types.
This work examines the nexus between green technology innovation, economic development, and air quality and is the first attempt to answer the following questions: Does heterogeneous green technology innovation benefit both urban economic development and air quality? What internal mechanisms does it involved? Are there regional and administrative-level heterogeneities in the effects of green technology innovation on economic development and air quality? To answer these questions, we explores the influence mechanisms of green technology innovation on air quality and economic development using data from 166 cities from 2004 to 2019. Based on the empirical results, relevant management implications are reported.
The contributions of our work are threefold. First, we use the resource-based view (RBV) theory to extend our understanding of how green technology innovation plays a role in air quality and economic development from a spatial perspective. Second, regarding the study mechanisms, we consider the nonlinear role of economic development on the relationship between green technology innovation and air quality. Specifically, we verify the threshold and mediate the effects of economic development. Accordingly, this study constructs a theoretical framework for the influence of green technology innovation on air quality and economic development. Third, considering differential green technology innovation across diverse administrative levels and regions, the heterogeneous mechanisms of green technology innovation on urban economics and air quality are analyzed, expanding the depth of the work by considering urban resource endowment. The results can provide empirical support for formulating and improving differentiated green technology innovation-driving strategies.
Literature reviewGreen technology innovation is conducive to resource conservation, energy-efficiency improvements, and pollution prevention (Feng et al., 2022). The existing literature has provided mixed results on the correlations among green technology innovation, air quality, and economic development (Peng et al., 2021; Xie et al., 2022; Feng et al., 2021; Ma et al., 2022; Wang et al., 2022; Yang et al., 2022a; Yi et al., 2022; Wang et al., 2021; Zhai & An, 2021).
There are three main views on green technology innovation and air quality. Most studies have advocated that green technology innovation has environmentally friendly characteristics that can improve air quality by reducing pollutant emissions and alleviating the haze pollution crisis, for example, by optimizing energy usage (Jiang et al., 2020; Zhu et al., 2021b; Hussain et al., 2022). Conversely, some studies have indicated that green technology innovation leads to environmental degradation and the deterioration of air quality due to rebound effects (Wang et al., 2021). Recent studies have shown that the eco-friendly effects of green technology innovation are inconclusive and disputable. The main manifestations are nonlinear correlations and heterogeneities among the various types of green technology innovation (Chien et al., 2021). Yan et al. (2020) have proposed that the nonlinear influence of green technology innovation on air quality is primarily related to regional economic levels. The effect of green technology on air quality is disputable because of its diverse social and economic surroundings (Zeng et al., 2022). The heterogeneity of global green technology innovation indicators can also lead to differences in the effect on air quality (Yi et al., 2020); therefore, the effect of green technology innovation on air quality warrants further discussion.
Green technology innovation and economic development revolve around two perspectives. One is the RBV, which supports the positive correlation between green technology innovation and economic development, arguing that green technology innovation can bring tangible and intangible resources, thereby reducing production and operation costs and giving cities a “first-mover advantage” (Przychodzen et al., 2020). Moreover, the environment-friendly features of green technology innovation can effectively enhance a city's green image (Xie et al., 2022), which is conducive to enhancing its competitive advantage and promoting its economic development. The second view advocates the double externalities of high costs and risks, lead to uncertain economic outcomes of green technology innovation (Rennings, 2000). According to this view, green technology innovation has higher costs and uncertainties and may impose unnecessary costs on investors (Hussain et al., 2022), making its economic benefits questionable. Specifically, the attention-based view demonstrates that green technology innovation shifts an organization's attention from economic, managerial, and technological considerations to environmental responsibility due to cognitive and resource constraints, which can diminish its economic benefits (Mithani, 2017). Furthermore, the long payback cycle of green technology innovation exposes investors to potential financial risks (Zhang et al., 2022). Moreover, the knowledge gap divide and insufficient governmental support always accompany green technology innovation (Abdullah et al., 2016; Gong et al., 2020). These two perspectives suggest that green technology innovations present opportunities and challenges for cities’ economic development.
Recently, the growing body of research has recently recognized the significance of green technology innovation in green development. Scholars have shown an increased interest in the effect of green technology innovation on green development, which integrates economic and air quality considerations. Chen et al. (2022b) have asserted that green technology innovation can improve raw material utilization efficiency, lower the cost of resource utilization, and mitigate environmental pollution, all of which contribute to achieving green and sustainable development. Liao and Li (2022) have argued that the green technology innovation process aims to obtain the maximum green innovation output with the least input, while emitting the least harmful pollutants. Additional studies have reported that the influence of green technology innovation on the economic environment may be heterogeneous because of the differences in resource endowment (Hao et al., 2020; Liao & Li., 2022). The “polarization-trickle effect” is also worth further discussion. As the ultimate viable strategy to address global warming, green development has become a trend in ecological modernization, aiming to stimulate economic growth while curbing pollution emissions (Guo et al., 2020). Measuring green development requires the consideration of both economic and environmental factors. However, existing studies have mainly measured it by using single-factor indicators, such as carbon emissions, unit energy consumption, and air quality, or by constructing a comprehensive index based on deterministic parametric and stochastic frontier models (Hao et al., 2020; Sohag et al., 2021; Liao & Li, 2022; Shahzad et al., 2022). Few studies have examined whether green technology innovation can generate both economic and environmental dividends. Although studies on single-factor indicators and construction of a comprehensive index have considered the role of green technological innovation at the micro and systemic levels, they have not considered possible internal mechanisms. Thus, this study examines whether green technology innovation can fulfill a win–win situation for both the economy and the environment from a two-dimensional perspective and explores its internal mechanisms from a nonlinear perspective.
Existing research on this topic has provided mixed results, which could be attributed to previous studies ignoring the inner mechanisms and heterogeneous conditions of the correlations among green technology innovation, economic development, and air quality. Green technology innovation should ensure that it benefits both the economy and the environment, considering how the economy and environment interact; hence, we employ economic development and air quality as indexes for an alternative dependent variable. Furthermore, we construct a theoretical framework based on the STIRPAT and C–D production functions to report on a city's analysis of how green technology innovation affects air quality and economic development. More specifically, we apply spatial economics to systematically the role of green technology innovation in heterogeneously facilitating a win–win situation between the economy and the environment across types and spatial and nonlinear perspectives.
Mechanism analysis and the research hypothesisGreen technology innovation and air qualityWith the intensification of urban environmental pressures, the role of green technology innovation in air quality has gradually become a significant topic of scholarly attention. Green technology innovation emphasizes the energy-saving and emission-reduction characteristics of technology innovation, aiming to orient production toward environmental goals (Lee et al., 2022b). We argue that green technology innovation can realize energy savings and emissions reduction effects through input and output mechanisms to improve air quality. From an input perspective, advanced technology and production equipment can reduce material consumption per output unit. These eco-friendly energy innovations have contributed to improvements in air quality by reducing fossil fuel consumption and increasing green energy consumption (Niu, 2011). From an output perspective, industrial pollutant emissions can be reduced to a manageable range using new technology production. This help realize the emission reduction utility of green technology innovation and contribute to improving air quality (Fei et al., 2014). Therefore, the first hypothesis is proposed as follows:
Hypothesis 1: Green technology innovation is beneficial to air quality.
Green technology innovation, as a technical support for sustainability, has a critical effect on the regional environment (Zhong et al., 2022; Dong et al., 2022). The double externality of green technology innovation makes it a spillover characteristic that reduces the costs of the flow and integration of green technology elements across time and space (Qi et al., 2022). This situation is conducive to generating synergistic innovation effects and regional radiation effects, which subsequently enhance air quality in the regions where the factors flow. Furthermore, green technology innovation may show “pollution transfer” and “free-rider” phenomena, making it a negative externality (Zhong et al., 2022) that harms the surrounding areas’ ecological environment and cannot achieve coordinated governance across regions. Thus, the spatial spillover effect of green technology innovation on air quality through technology spillover mechanisms is worth considering; therefore, we propose the following hypothesis:
Hypothesis 2: Green technology innovation has a spatial spillover effect on urban air quality.
Green technology innovation and economic developmentExisting studies have demonstrated the positive (Przychodzen et al., 2020; Xie et al., 2022) and negative (Mithani, 2017) effects of green technology innovation on economic development. Despite the debated background of this subject, we rely on the RBV theory and argue that green technology innovation enhances economic development through resource advantage and technology spillover mechanisms. On one hand, green technology innovation brings tangible and intangible resource advantages that increase economic benefits (Zhang et al., 2022). Specifically, green technology innovation can optimize production methods and promote productivity, creating economic benefits through cost reduction and efficiency. Furthermore, the competitive advantage generated by green technology innovation helps capture a larger market share, forming a scale economies advantage (Zhu et al., 2021c). Therefore, we propose the following hypothesis:
Hypothesis 3: Green technology innovation is beneficial to economic development.
On the other hand, the literature has indicated that green technology innovation has spatial diffusion (Cao et al., 2022; Huang et al., 2022). Green technology innovation can produce spillover effects through the aggregation and flow of innovation factors and facilitate technology diffusion through learning effects and absorptive capacity (Zhang et al., 2022). Furthermore, technology diffusion breaks space constraints, optimizing the configuration of green technology resources and producing an innovation demonstration effect. This effect provides new solutions for the economic development of surrounding regions. Hence, the following hypothesis is proposed:
Hypothesis 4: Green technology innovation has a spatial spillover effect on urban economies.
The nonlinear role of economic developmentPrevious studies have reported that economic development and air quality are closely related, and that an “Environmental Kuznets Curve” exists. This indicates that the economic development level determines the direction of its impact on air quality (Zhu et al., 2021c; Yang et al., 2022a). We argue that a nonlinear economic driving effect exists between green technology innovation and air quality, and that its intrinsic logic is reflected in two aspects. First, the initial stage of economic development is often crude with high levels of investment, pollution, and low efficiency (Zeng et al., 2022). A boost in the cost of green technology innovation in cities may intensify the decoupling of economic growth and environmental development, increase energy consumption, aggravate air pollution, and subsequently worsening air quality (Zhang, 2021). Second, when economic development reaches a certain level, the health and environmental opportunity costs increase rapidly. This increase shifts the crude development model to a high-quality development transition that introduces green technology innovation by producing clean products, improving the production process, and enhancing energy use efficiency, significantly reducing air pollutant emissions and improving air quality (Ali et al., 2020; Li et al., 2021a). Thus, we propose the following hypothesis:
Hypothesis 5: Economic development has a threshold effect on the correlation between green technology innovation and air quality.
Green technology innovation is the advancement of green technology, which improves firm productivity and brings economic benefits, contributing to urban economic development. Green technology innovation that achieves marketization provides a stronger competitive advantage indicating that high-quality economic development can provide sufficient capital investment and technical support for urban environmental management, thereby improving air quality. Furthermore, the integrative view of this study on economic development and air quality reflects the natural RBV theory, which suggests that green technology innovation can help cities gain sustainable competitiveness and achieve win–win economic and ecological development. This can be achieved by changing the direction of technological progress and applying the advantages of resources and capabilities to environmentally friendly products and processes (Alam et al., 2019; Zhang et al., 2022).
Generally, the literature has revealed that green technology innovation indirectly affects air quality through economic development. We show that green technology innovation contributes to economic development and provides cities with a greater resource advantage. Green-oriented resource utilization can be enhanced through technological breakthroughs, leading to production and service toward environmental goals. Therefore, we suggest that economic development determines how green technology-innovative cities can improve their air quality. This leads to the sixth hypothesis, which is as follows:
Hypothesis 6: Economic development mediates the correlation between green technology innovation and air quality.
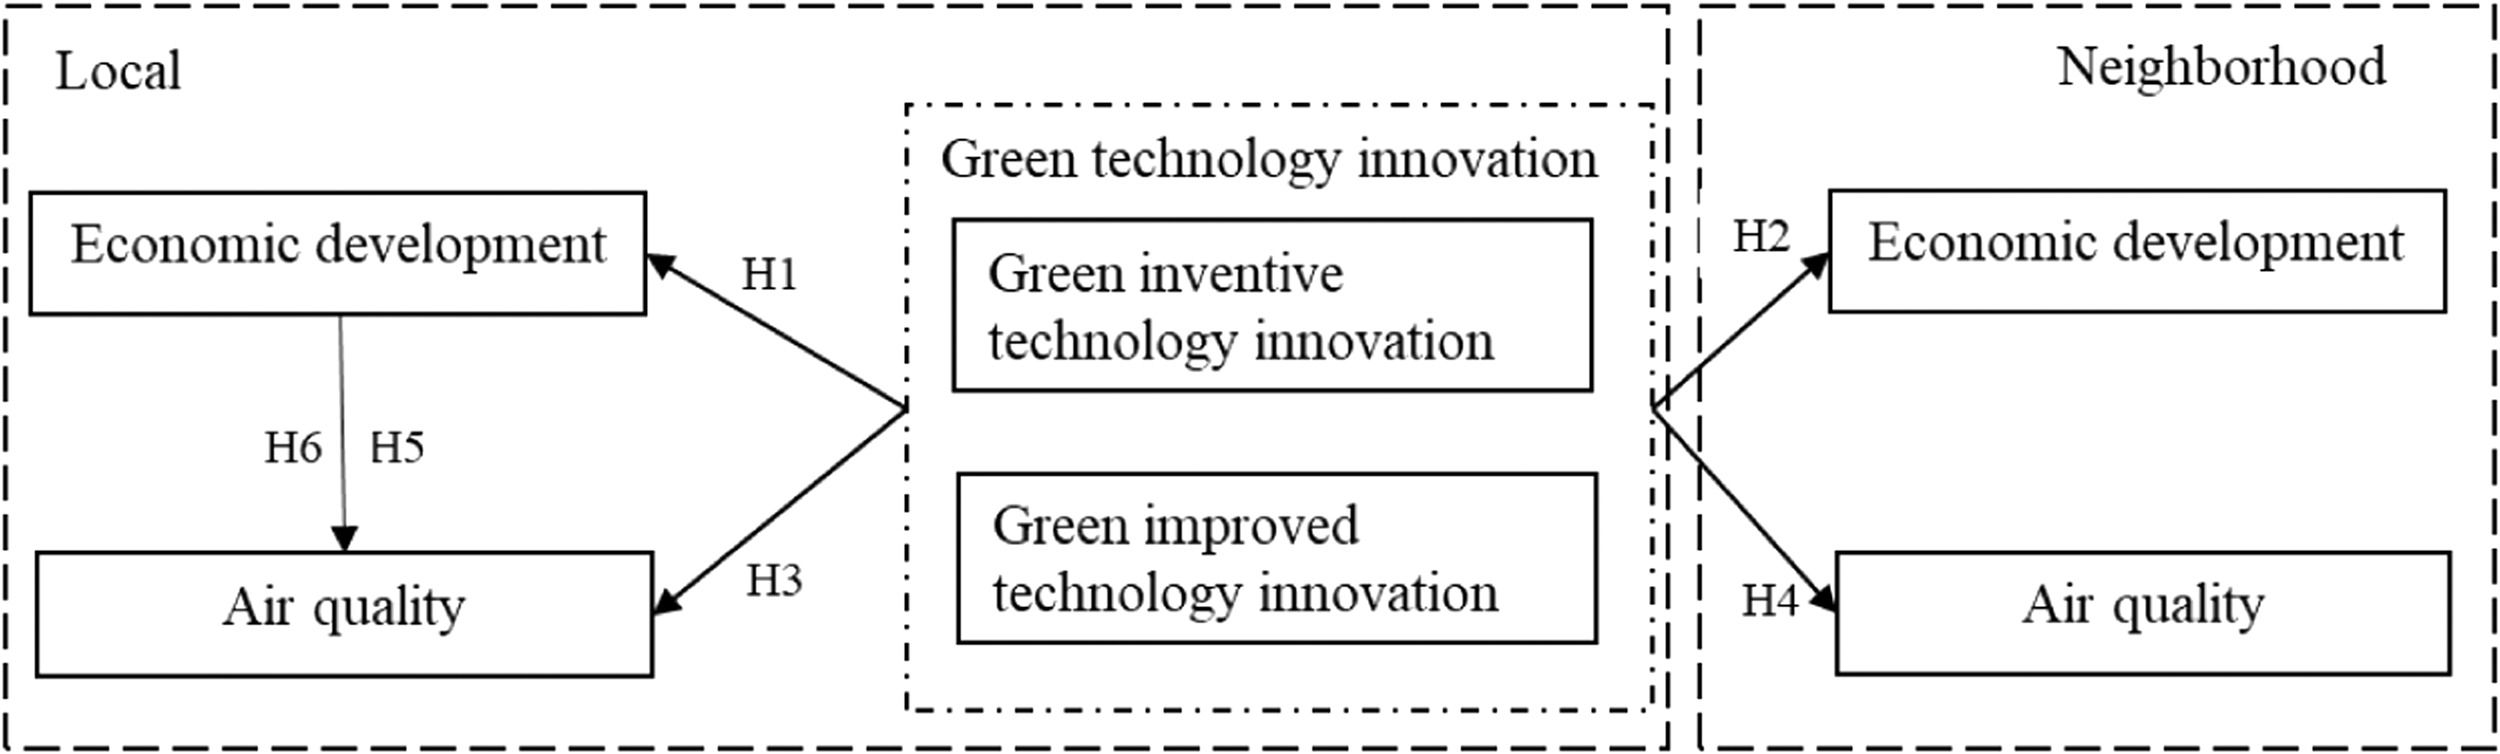
Fig. 1 presents our study's theoretical model, showing the hypothesis-evolution process. The lines with arrows indicate the influencing mechanisms and channels. Specifically, Hypotheses 1 and 3 examine the heterogeneous effect of green technology innovation on air quality and economic development. Hypotheses 2 and 4 focus on the spillover mechanisms of green technology innovation. Finally, Hypotheses 5 and 6 address the nonlinear role of economic development in the green technology innovation–air quality transmission mechanism.
Research designModel specification
We use the theoretical framework of the STIRPAT and C–D production function models to construct a model specification for exploring how green technology innovation affects air quality and economic development. The STIRPAT model proposed by Dieta and Rosa (1997) is widely used as a theoretical framework to explore the effect of technology innovation on environmental indices. It was constructed as follows:Iit=aPitbAitcTitdeit
The logarithmic forms of all variables are considered to eliminate heteroscedasticity, which can be expressed as follows:

Here, I denotes the environmental index, P is pollution, A is affluence, and T is the technology. The subscripts i and t represent the city and year, respectively; moreover, b, c, and d indicate the parameters to be estimated; a is the constant term and e is the error term. Following Ma et al. (2022), the technology level in STIRPAT can be represented by technology innovation. Thus, based on the STIRPAT framework, we develop models to investigate the effects of green technology innovation on air quality:


Here, PM2.5 indicates air quality, and ingp and newgp denote green inventive technology innovation and green improved technology innovation, respectively. Following Coad et al. (2016) and Zhu et al. (2021a), we lag the green technology innovation variables by one year to reduce potential endogeneity concerns in the econometric models. Furthermore, considering the multicollinearity problem, we construct a model to study the heterogeneous effects of different types of green technology innovation . stru, pop, fdi and pGDP are the control variables defined in Section 3.4.3. β1–β5 are the parameters to be estimated, and ai stands for individual effect.
The Cobb–Douglas production function can be expressed as follows:Yit=AitKitbLitceit
We take the logarithmic form for all variables to eliminate heteroscedasticity and extreme values, which can be expressed as follows:

Here, Y is the production index and K and L denote capital and labor, respectively; A represents other factors affecting production, such as technical progress. Referring to Shao et al. (2022), we introduce green technology innovation into the production formula, with the related explanatory variables controlled to build a model specification that investigates the effect of innovation on economic development.


Here, pGDP denotes economic development, the control variables include stru, pop, fdi, and kl, and the other variables are the same as before.
Spatial econometric modelConsidering that green technology innovation, economic development, and the environment have pronounced agglomeration and spillover effects, spatial correlations should be considered (Shao et al., 2022). Following Elhorst (2012), we adopt a spatial Durbin econometric model to examine the spatial dependence and heterogeneity of green technology innovation on the economy and environment, as shown in Eq. (7). Compared to the spatial error model (SEM) and spatial lag model (SLM), the spillover effect of the spatial Durbin model (SDM) is not restricted by endogenous or exogenous constraints. According, it can avoid parameter estimation bias caused by the spatial dependence of omitted variables (Zhai & An, 2021; Cao et al., 2022).

Here, y indicates the explained variables and x and β indicate core explanatory and control variables and their coefficients, respectively; w represents the geographical distance spatial weight matrix. w·y is a spatial lag term for the explained variables. ρ is the spatial correlation coefficient, measuring the spatial correlation strength between city i and its geographically neighboring city j. ∑j=1Nwijxjt and γ denote the spatial lag term and its coefficient vector for the independent variables, respectively. ai, λt, and eit refer to the space-fixed and time-fixed effects, and the error terms, respectively.
We capture the spatial marginal effect by employing a partial differential technique to disintegrate spatial spillover effects into direct, indirect, and total effects (Huang et al., 2022). Thus, the SDM can be rewritten as follows:

The partial derivative matrix of Y to Xk for different individuals at a specific time is given by Eq. (9). The direct and indirect effects are the averages of the sums of the diagonal and non-diagonal elements of the rightmost matrix, respectively.
Nonlinear effect regression model
Coordinating the economy and the environment are important for the perspective of high-quality development. According to the STIRPAT framework, the heterogeneous effect of green technology innovation on air quality is influenced by regional discrepancies in economic development. Considering China's large land area and its heterogeneous features, its economic development is unbalanced (Fang et al., 2022); therefore, there may be nonlinear linkages between green technology innovation and air quality. First, following Hansen (1999), we employ a panel threshold regression estimator to verify the nonlinear linkages:

Here, β is the coefficient to be estimated. I(.) is the indicator function, qit is the threshold variable, and c is a specific threshold value. gpit denotes green technology innovation and specifically includes lningp and lnnewgp. The threshold variable used in this study is lnpGDP. Xit is a vector of control variables and ai, λt, and eit are synonymous with Eq. (7).
Second, we adopt a stepwise regression method to verify the mediating role of economic development in the technology innovation–air quality relationship. The following models are estimated:


Here, γ, φ and β are the parameters to be estimated. The other variables are same as those in Eq. (10).
Variable description and data sourceExplained variablesAir quality (PM2.5) is measured using the annual average PM2.5 concentration. PM2.5 represents the degree of air pollution and urban environmental performance. Referring to Ma et al. (2022), the higher the PM2.5 content in the air concentration, the worse the air pollution is; thus, the environmental performance deteriorates.
Economic development (pGDP) is measured using per capita real GDP, a term commonly used in the related literature (Huang et al., 2022; Fang et al., 2022), to represent urban per capita wealth. It is a core indicator of urban economic growth and efficiency, and reflects local economic development.
Explanatory variablesGreen patents are an effective and robust indicator of green technology innovation output and productivity, and can be identified using the International Patent Classification code (Li et al., 2021b; Lee et al., 2022b; Zhang et al., 2022). China's patent law and existing studies define green patents as inventions and utility model patents (Lian et al., 2022). Specifically, green invention patents must meet the features of inventiveness, novelty, and practicality, as well as energy conservation and emission reduction. Green utility model patents refer to product or process improvement innovations with energy conservation and emissions reduction features. Accordingly, our work explores the heterogeneous effect of green technology innovation from a multidimensional perspective, including green inventive and green improved technology innovation. Considering that patent applications better reflect innovation activities without time lags and institutional preferences (Yang et al., 2022b), this work measures green inventive technology innovation (ingp) based on the number of green invention patent applications and green improved technology innovation (newgp) using the number of green utility model patent applications.
Control variablesBased on the theoretical framework of the STIRPAT and C–D production function models, we employ the following control variables: Industrial structure (stru) is measured by the tertiary industry output value to the secondary industry output value (Liu et al., 2022), and the optimization and upgrading of the industrial structure is a critical driver for enhancing high-quality economic development. Population density (pop) is measured using the number of resident populations per square kilometer, representing urban agglomeration capacity (Wang et al., 2022). Capital–labor ratio (kl) is measured as fixed assets to the number of urban employees. It considers capital and labor as the two primary factors of production, reflecting the intensity of either capital or labor (Zhang et al., 2022). Foreign direct investment (fdi) is measured as the actual foreign investment used in the year to the GDP, which is a crucial factor affecting regional economic development and environmental quality. On one hand, foreign investment can introduce advanced technology through demonstration and learning effects; on the other hand, foreign investment comes with the risk of the host country becoming a “pollution refuge” (Wang et al., 2021). Notably, all variables in the estimation of model parameters are logarithmically treated to eliminate the influence of heteroscedasticity.
Data source and descriptive statisticsConsidering data availability, this study employs 166 prefecture-level cities in China from 2004 to 2019 as the research object (some cities were not included in the examination because of missing PM2.5 and patent data). The innovation data were obtained from the CNDRS database. Other data were collected from the China City Statistical Yearbook (2005–2020). Missing data were manually collected from the websites of the local municipal governments. Descriptive statistics are shown in Table 1.
Descriptive statistics.
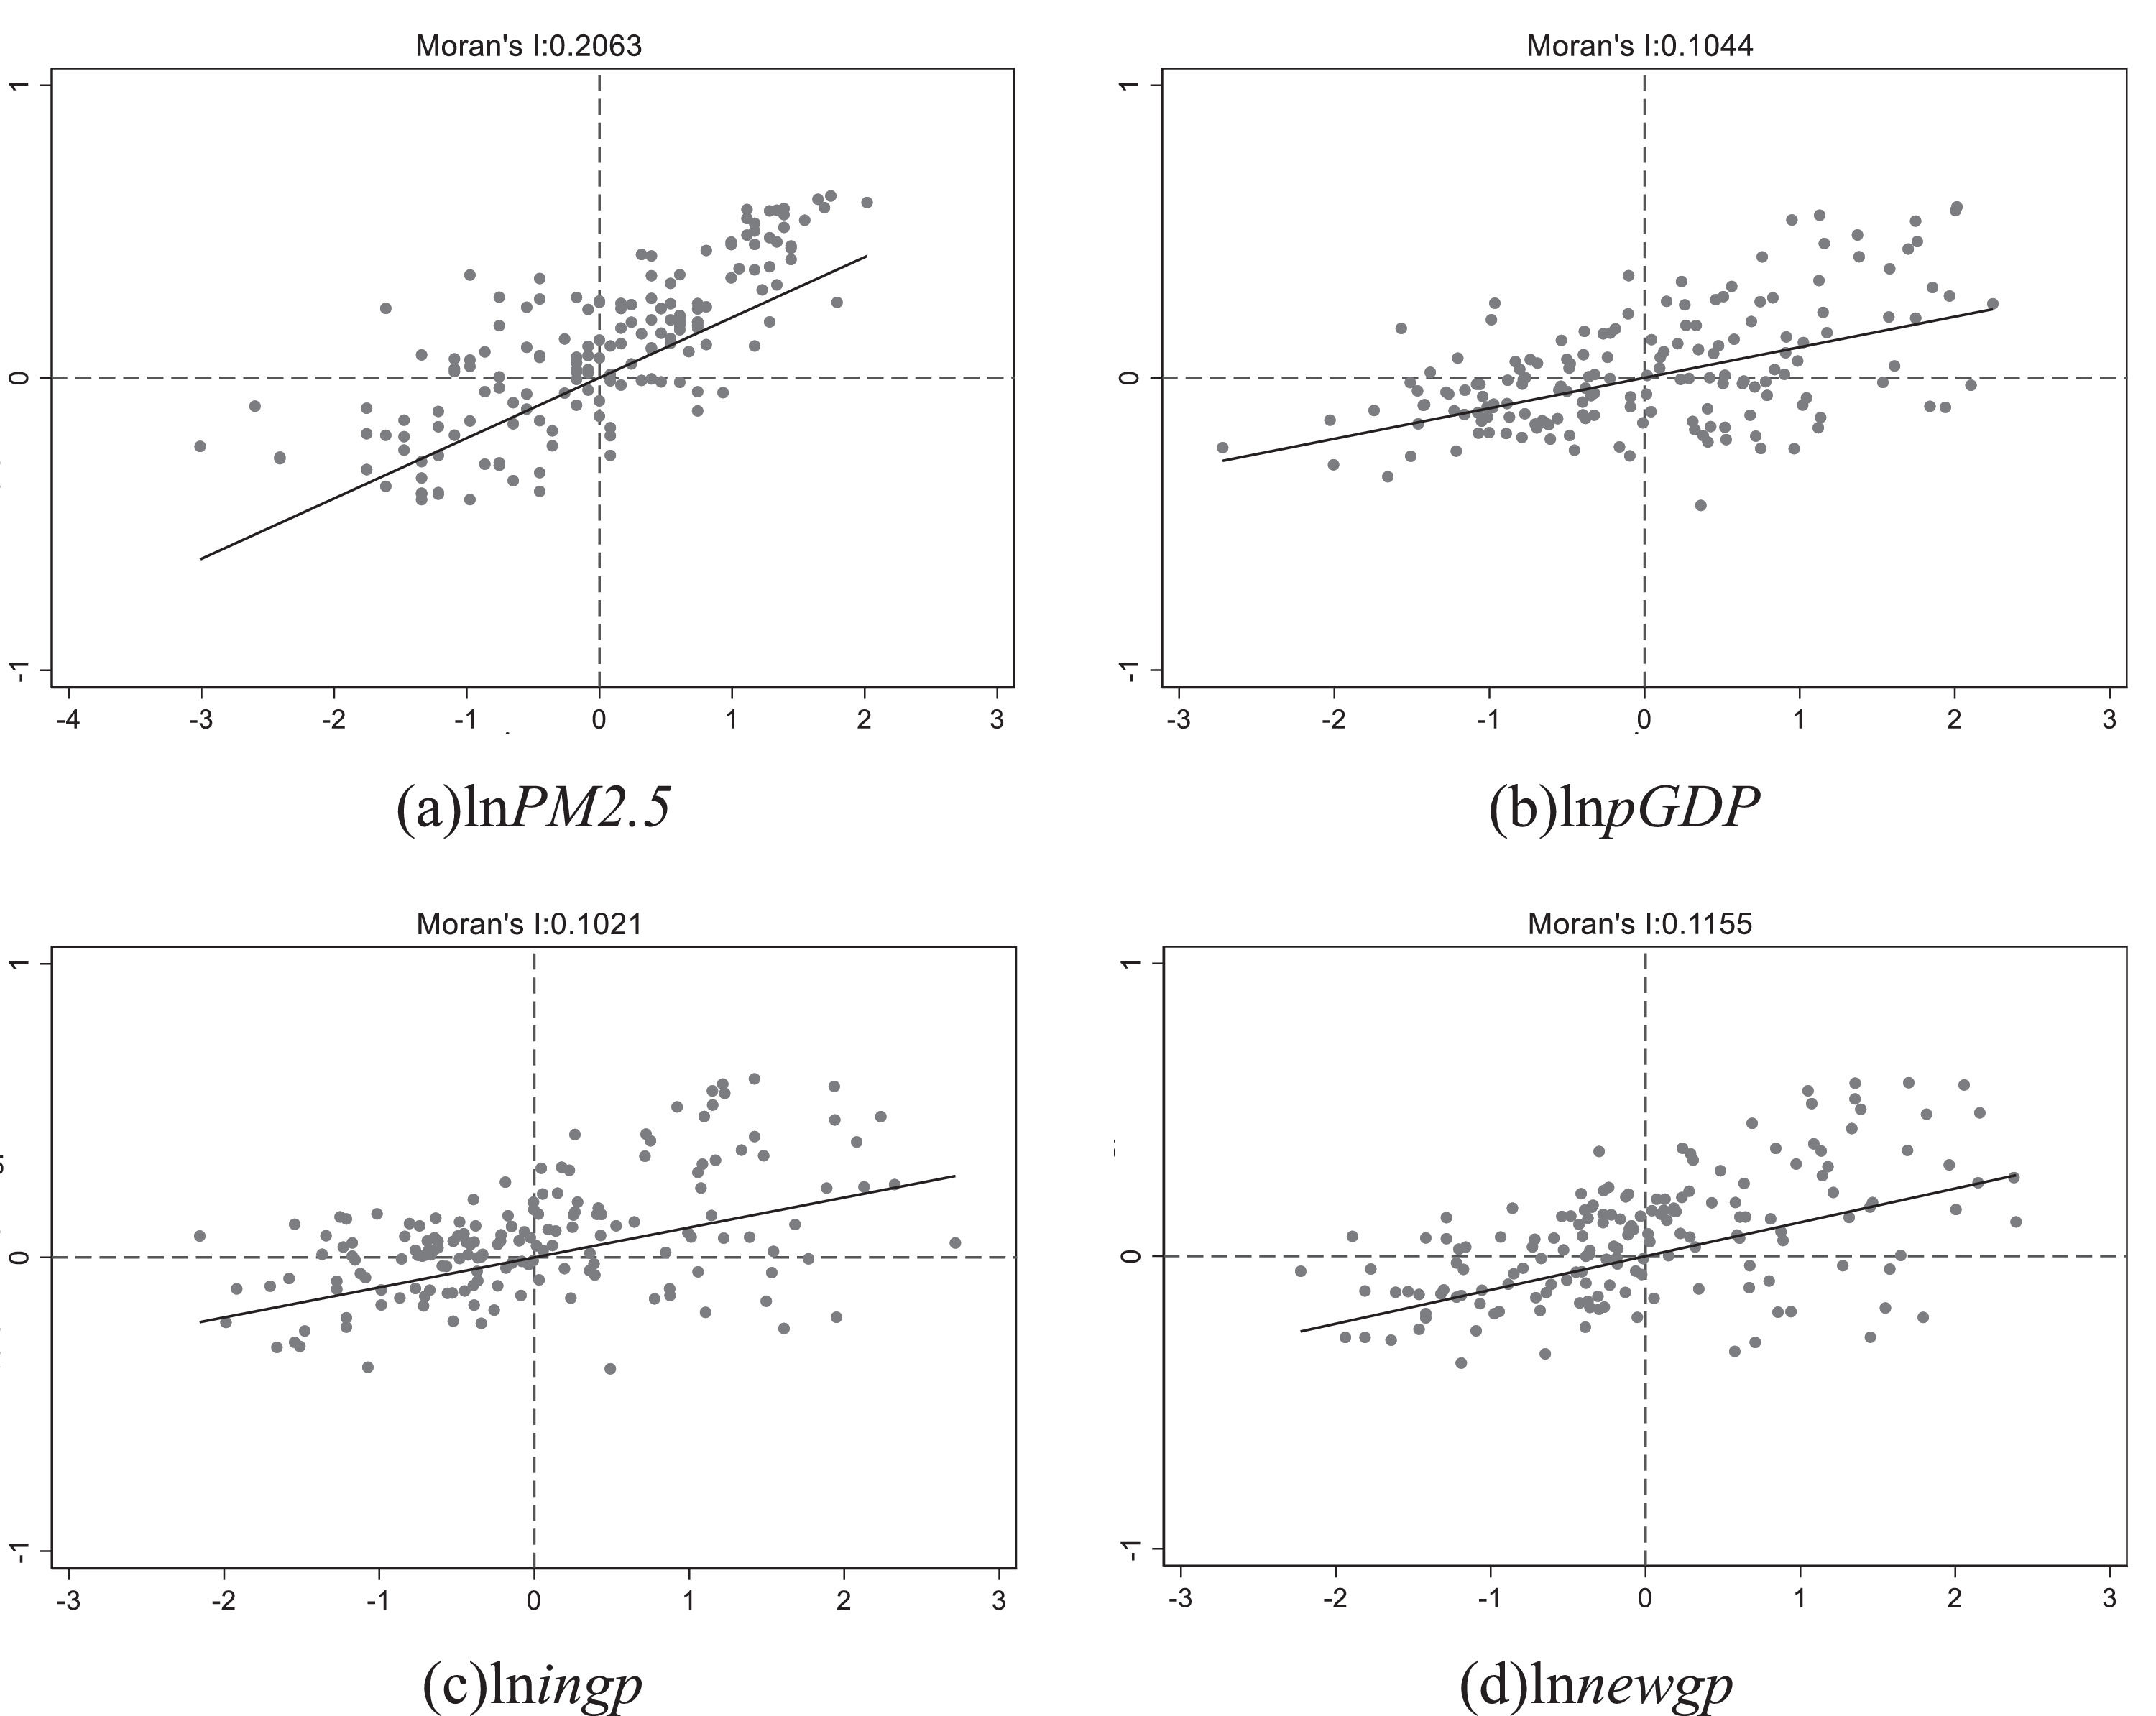
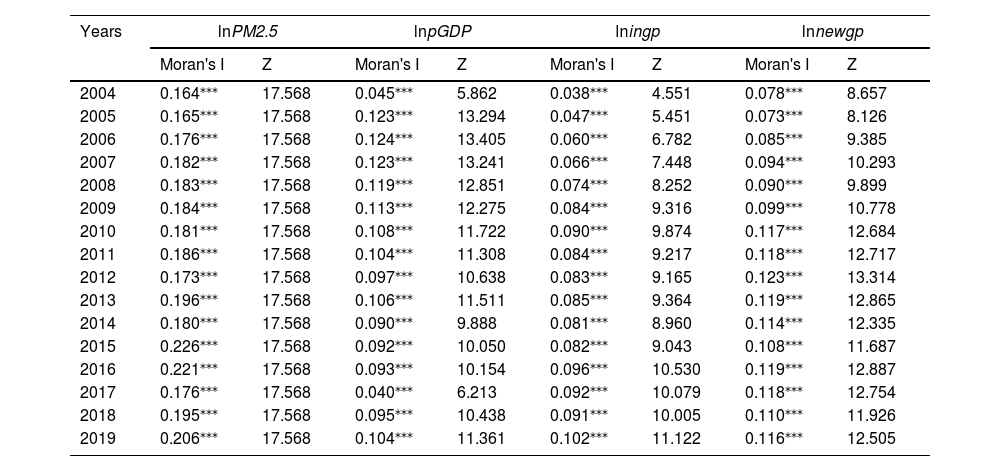
Global Moran's I statistic is a critical indicator for examining the presence of spatial dependence in variables. Table 2 shows that each value is always significantly positive, indicating that China's green innovation, air quality, and economic development have a significant positive spatial dependence among cities. Improvements in green technology innovation, air quality, and economic development in a city can significantly boost green technology innovation, air quality, and economic development in neighboring cities. Furthermore, we depict a local Moran's I scattergram of the core variables in 2019 to investigate the instability and type of local spatial agglomeration. Fig. 2 indicates that most cities fall in the quadrants I (high–high) and III (low–low), showing that a positive spatial dependence of core variables exists among cities in China. Considering the existence of spatial cluster characteristic, spatial econometrics must be employed.
Global Moran's I of variables from 2004–2019.
Note: ⁎⁎⁎ means significant at the levels of 1%.

Statistical tests of the spatial model applicability on the regression results for green innovation and air quality and green innovation and economic development were conducted, as shown in Table 3. First, the Lagrange multiplier (LM) (robust) test results significantly reject the null hypothesis at the 1% level, suggesting spatial dependence characteristics in the sample data. Second, the likelihood ratio (LR) test is used to verify whether the SDM could be simplified to an SLM or SEM and whether the two-way fixed effects could be simplified to spatial- or time-fixed effect models. Considering the LR test results, all hypotheses were rejected at the 1% level, indicating that the two-way fixed-effects SDM model is best suited for this study. Finally, the Hausman test result indicates that a fixed-effects model should be employed; hence, we conclude that the a spatial- and time-fixed SDM is optimal for our study.
Evaluation of spatial measurement model selection.
Note: ⁎⁎⁎ means significant at the levels of 1%.
This study employs a two-way fixed SDM to investigate the effect of green innovation on air quality and economic development. Tables 4 and 5 show that the direct effect explains the intra-region effect of green technology innovation, whereas the indirect effect explains the effect of green technology innovation on the surrounding regions, which represents the spillover effect. Finally, the total effect explains the effect of green technology innovation on the entire region.
Spatial effects decomposition results of heterogeneous green technology innovation on PM2.5.
| Variable | Direct effect | Indirect effect | Total effect | Direct effect | Indirect effect | Total effect | |
|---|---|---|---|---|---|---|---|
| lningp | −0.032⁎⁎* | −3.569⁎⁎* | −3.602⁎⁎* | ||||
| (0.009) | (1.342) | (1.350) | |||||
| lnnewgp | 0.019⁎⁎ | 0.067 | 0.086 | ||||
| (0.008) | (1.003) | (1.008) | |||||
| lnstru | −0.046 | 1.823 | 1.777 | −0.052 | 0.136 | 0.084 | |
| (0.043) | (5.817) | (5.847) | (0.044) | (6.056) | (6.086) | ||
| lnpop | −0.041 | −4.645 | −4.686 | −0.045 | −5.208 | −5.253 | |
| (0.031) | (4.109) | (4.137) | (0.032) | (4.319) | (4.348) | ||
| lnpGDP | −0.104⁎⁎* | −14.916⁎⁎* | −15.020⁎⁎* | −0.125⁎⁎* | −18.128⁎⁎* | −18.253⁎⁎* | |
| (0.031) | (4.928) | (4.958) | (0.036) | (5.812) | (5.812) | ||
| lnfdi | 0.138⁎⁎ | 23.718⁎⁎* | 23.855⁎⁎* | 0.205⁎⁎* | 34.417⁎⁎* | 34.622⁎⁎* | |
| (0.053) | (8.092) | (1.350) | (0.068) | (10.788) | (10.851) | ||
| ρ | 0.955⁎⁎*(0.011) | 0.956⁎⁎*(0.011) | |||||
Note: Robust standard errors are shown in parentheses. ⁎⁎⁎.
Spatial effects decomposition results of heterogeneous green technology innovation on pGDP.
| Variable | Direct effect | Indirect effect | Total effect | Direct effect | Indirect effect | Total effect | |
|---|---|---|---|---|---|---|---|
| lningp | −0.012 | 0.343⁎⁎* | 0.331⁎⁎* | ||||
| (0.014) | (0.120) | (0.118) | |||||
| lnnewgp | 0.022 | 0.373⁎⁎* | 0.395⁎⁎* | ||||
| (0.017) | (0.142) | (0.139) | |||||
| lnstru | −0.403⁎⁎* | −1.533* | −1.936⁎⁎ | −0.388⁎⁎* | −1.514* | −1.903⁎⁎ | |
| (0.082) | (0.855) | (0.833) | (0.082) | (0.852) | (0.829) | ||
| lnpop | −0.002 | 0.223 | 0.220 | −0.005 | 0.066 | 0.062 | |
| (0.035) | (0.532) | (0.537) | (0.035) | (0.532) | (0.538) | ||
| lnfdi | −0.146⁎⁎ | 0.085 | −0.061 | −0.154⁎⁎ | −0.283 | −0.436 | |
| (0.066) | (0.759) | (0.756) | (0.066) | (0.725) | (0.721) | ||
| lnkl | 0.104⁎⁎* | 0.902⁎⁎* | 1.005⁎⁎* | 0.103⁎⁎* | 0.990⁎⁎* | 1.093⁎⁎* | |
| (0.023) | (0.246) | (0.242) | (0.023) | (0.252) | (0.248) | ||
| ρ | 0.224*(0.122) | 0.224*(0.122) | |||||
Note: Robust standard errors are shown in parentheses. ⁎⁎⁎.
As shown in Table 4, the autocorrelation coefficient ρ of PM2.5 is significantly positive at the 1% level, indicating a highly positive spatial spillover effect of PM2.5. PM2.5 can characterize urban environmental pollution through spatial aggregation and dependence, which aligns with Ma et al. (2022). Furthermore, different green technology innovations have heterogeneous impacts on air quality. Specifically, the direct effect coefficient of lningp is significantly negative, indicating that green inventive technology innovation can effectively suppress local PM2.5 emissions while improving urban air quality. The indirect effect coefficient of lningp is also significantly negative, indicating that green inventive technology innovation affects air quality of the surrounding areas; it can also be seen as having “symbiotic effects” (Zhong et al., 2022). This phenomenon can be attributed to the positive externalities of green inventive technology innovation and air quality (Xu et al., 2021). Notably, the indirect effect coefficient of lningp is higher than the direct effect coefficient, implying that green inventive technology innovation has a significantly greater impact on the air quality of surrounding cities via spillover effects. Thus, the total effect is significantly negative, reflecting that green inventive technology innovation can positively improve urban air quality across regions. The coefficient of lnnewgp is positive; however, only the direct effect passes the statistical significance test. This results suggests that green improved technology innovation is one of the elements that aggravate local air pollution; moreover, its corresponding spatial distance spillover mechanism has not yet been formed and does not have any spatial spillover effects. Thus, Hypotheses 1 and 2 are partially verified. Our results regarding air pollutants are consistent with those of Ma et al. (2022) and Yi et al. (2022); however, we focus on air quality considering heterogeneous green technology innovation.
Table 5 shows that the autocorrelation coefficient ρ of pGDP is significantly positive at the 1% level, implying that urban economic development has significant spatial spillover effects and that the “local club phenomenon” exists. Furthermore, the direct effect coefficients of lningp and lnnewgp are insignificant, while the indirect and total effect coefficients are significantly positive. Therefore, green technology innovation does not improve local economic development; however, the heterogeneous types of green technology innovation can drive the economic growth of neighboring cities, which supports H3 and H4. Unlike Feng et al. (2021), our results concerning the spatial effect of green technology innovation are consistent with those of Peng et al. (2021). They have argued that the network effect of green technology innovation can expand the spatial spillovers of tacit knowledge and facilitate the absorption of knowledge and technology, thereby playing a significant role in fostering the surrounding cities’ economies. Overall, green inventive technology innovation significantly promotes economic development while suppressing the increase in PM2.5 concentration, showing that green inventive technology innovation can drive win–win economic development and air quality.
Among the control variables, lnpGDP has a significantly negative effect on PM2.5, indicating that economic development is conducive to urban air quality improvement. lnfdi has a significantly positive effect on PM2.5 and a significantly negative direct effect on pGDP, implying that FDI is detrimental to urban air quality improvement and local economic development. lnstru significantly and negatively affects economic development, indicating that the current structure of secondary and tertiary industries is not conducive to economic development and that it is necessary to optimize the industrial structure. Additionally, the coefficients of lnkl on pGDP are significant and positive, indicating that greater capital intensity benefits urban economic development.
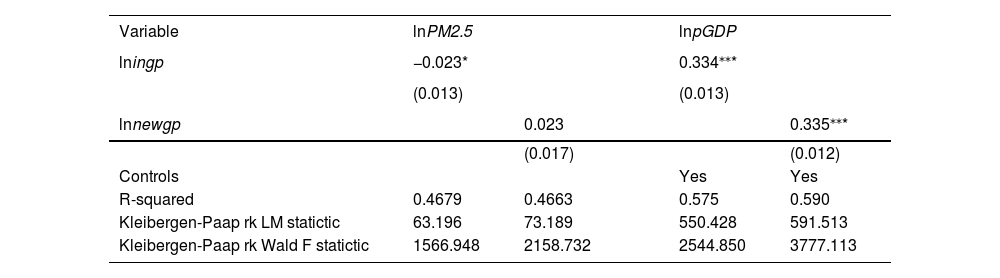
Endogeneity problemsTo address the potential endogeneity problems caused by bidirectional causality, we employ the instrumental variable (IV) method, which effectively mitigates the effects of endogeneity problems (Lee et al., 2022b; Wu et al., 2022). As Liu et al. (2022) have suggested, we select the third-order lags of urban total post and telecommunications businesses as the IV to conduct a 2SLS regression estimation, as shown in Table 6; the IVs are valid. Furthermore, the coefficients of green inventive and improved technology innovation align with the total effect of the spatial benchmark regression results, supporting the conclusions of this study. Accordingly, we can conclude that the results obtained from the benchmark model remain robust after considering potential endogeneity problems.
Endogenous problem analysis.
| Variable | lnPM2.5 | lnpGDP | |||
|---|---|---|---|---|---|
| lningp | −0.023* | 0.334⁎⁎* | |||
| (0.013) | (0.013) | ||||
| lnnewgp | 0.023 | 0.335⁎⁎* | |||
| (0.017) | (0.012) | ||||
| Controls | Yes | Yes | |||
| R-squared | 0.4679 | 0.4663 | 0.575 | 0.590 | |
| Kleibergen-Paap rk LM statictic | 63.196 | 73.189 | 550.428 | 591.513 | |
| Kleibergen-Paap rk Wald F statictic | 1566.948 | 2158.732 | 2544.850 | 3777.113 |
Note: Robust standard errors are shown in parentheses. ⁎⁎⁎.
We verify these results by conducting three robustness tests (Table 7). First, we modify the spatial weight matrix. Following Zhong et al. (2022), we replace the geographic distance spatial weight matrix with a geographic proximity 0–1 matrix to justify the dependability of our spatial model estimation results. Our study is considered robust because the results are generally consistent with those of previous studies. Second, following Deng et al. (2022), we replace the original core explanatory variables with the number of patent grants instead of applications. The results indicate that the coefficients’ features of the green inventive and improved technology innovation are consistent with the results of the spatial benchmark; this further verifies the robustness of the research results. Third, we exclude the odd values of the core explanatory variables. We apply a 1% two-sided tailing process to green inventive and improved technology innovation variables to reduce the interference of outliers with the study results. The results show no change in the significance and coefficient sign of the green technology innovation variables, further verifying the reliability of the results.
Robustness test.
| Variables | lnPM2.5 | lnpGDP | ||||
|---|---|---|---|---|---|---|
| Direct effect | Indirect effect | Total effect | Direct effect | Indirect effect | Total effect | |
| Replace the spatial weight matrix | ||||||
| lningp | −0.021⁎⁎* | −1.168⁎⁎* | −1.189⁎⁎* | −0.018 | 0.298⁎⁎* | 0.280⁎⁎* |
| (0.006) | (0.332) | (0.335) | (0.014) | (0.082) | (0.083) | |
| lnnewgp | 0.009 | −0.656* | −0.647* | 0.021 | 0.177⁎⁎ | 0.199⁎⁎ |
| (0.007) | (0.350) | (0.352) | (0.017) | (0.088) | (0.088) | |
| Controls | Yes | Yes | Yes | Yes | Yes | Yes |
| (2) Replace the core explanatory variables | ||||||
| lningp | −0.052⁎⁎* | −5.956⁎⁎* | −6.008⁎⁎* | −0.001 | 0.226⁎⁎ | 0.225⁎⁎ |
| (0.012) | (1.889) | (1.900) | (0.014) | (0.114) | (0.113) | |
| lnnewgp | 0.007 | −0.428 | −0.429 | 0.008 | 0.320⁎⁎ | 0.328⁎⁎ |
| (0.008) | (0.954) | (0.959) | (0.017) | (0.134) | (0.132) | |
| Controls | Yes | Yes | Yes | Yes | Yes | Yes |
| Excluding odd values of core explanatory variables | ||||||
| lningp | −0.025⁎⁎* | −3.341⁎⁎ | −3.366⁎⁎ | −0.012 | 0.348⁎⁎* | 0.336⁎⁎* |
| (0.009) | (1.291) | (1.298) | (0.014) | (0.118) | (0.116) | |
| lnnewgp | 0.028⁎⁎* | 0.502 | 0.530 | 0.022 | 0.381⁎⁎* | 0.403⁎⁎* |
| (0.008) | (1.010) | (1.015) | (0.017) | (0.139) | (0.137) | |
| Controls | Yes | Yes | Yes | Yes | Yes | Yes |
Note: Robust standard errors are shown in parentheses. ⁎⁎⁎.
and * mean significant at the levels of 1%, 5% and 10%, respectively. For space limitations, the results of parameter estimation of control variables are not presented, and the estimation results of green inventive technology innovation and green improved technology innovation are shown in the same column and distinguished by the horizontal lningp and lnnewgp, respectively.
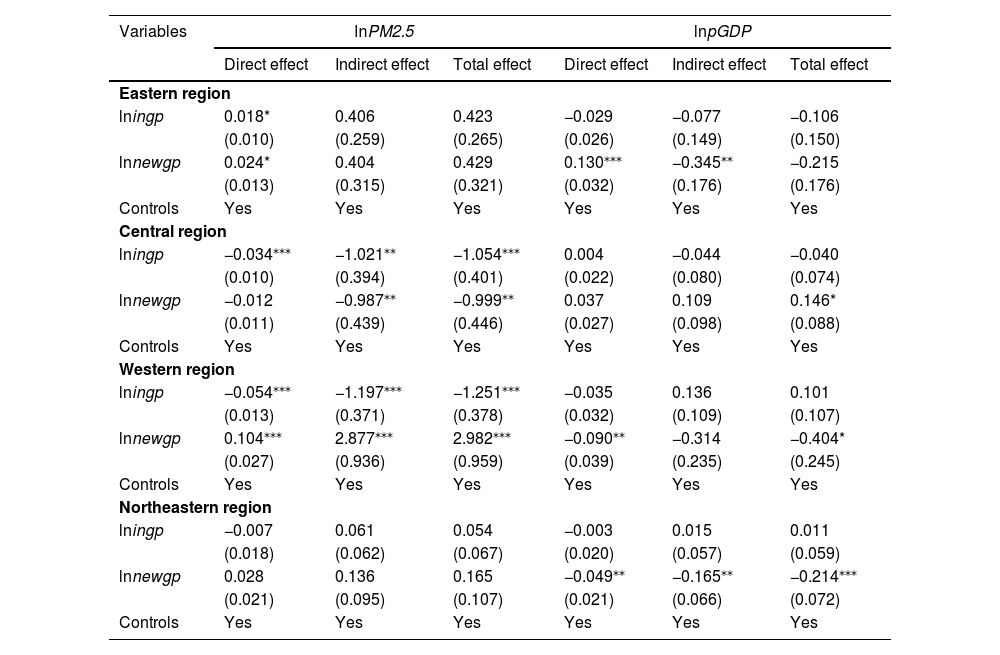
Regional heterogeneity. China is a vast territory with significant differences in regional green technology innovation and socioeconomic development (Shao et al., 2022). Based on Zhang and Liu (2022), this study further examines spatial heterogeneity by dividing the sample cities into the following four subsamples: eastern, central, western, and northeastern. Table 8 shows that the estimation results for green inventive and improved technology innovation show pronounced spatial heterogeneity.
Estimation results for the SDM by region.
Note: Robust standard errors are shown in parentheses. ⁎⁎⁎,⁎⁎ and * mean significant at the levels of 1%, 5% and 10%, respectively. For space limitations, the results of parameter estimation of control variables are not presented, and the estimation results of green inventive technology innovation and green improved technology innovation are shown in the same column and distinguished by the horizontal lningp and lnnewgp, respectively.
Considering the effects on air quality in the central and western regions, the direct and indirect effects of green inventive technology innovation on PM2.5 are significantly negative. Furthermore, a significantly negative spatial spillover effect of green improved technology innovation exists in the central region. Moreover, we observe a significantly positive spatial spillover effect in the western region. These results indicate that green inventive patent production in the central and western cities can improve local air quality and have spillover effects on neighboring cities. The findings support that the “demonstration–imitation” mechanism of green inventive technology innovation is applicable (Shao et al., 2022), indicating that green inventive patent production can also improve the air quality of surrounding cities. Furthermore, green design-based patent production can help neighboring cities in the central region improve air quality; however, it is unfavorable to neighboring cities in the western region. Additionally, the absolute value of the indirect effect coefficient is significantly larger than that of direct effect, implying that cities within the central and western regions are more closely connected in terms of modern ecological technology. In the northeastern region, the effects of green technology innovation are insignificant. Green technology innovation can aggravate local environmental pollution in the eastern region, and no intraregional spatial distance spillover mechanisms are observed. This result is supported by that of Zhang and Liu (2022), who have pointed out that green technology innovation has a “crowding effect” and has entered a bottleneck because of long preferential development in the eastern region.
Considering the effects on economic development, the indirect effects of green inventive technology innovation on urban economic development are not significant in any region, while green improved technology innovation has significantly negative indirect effects in the eastern and northeastern regions. The results indicate that the positive spatial spillover effect of green technology innovation on Chinese economic development is mainly realized cross-regionally. A possible reason for this phenomenon is that the Chinese economy is at a stage of high-quality development, whereas the level of green technology innovation is in the early development stages. The country's high costs and long cycle characteristics are insufficient to drive synergistic economic growth within the region. Simultaneously, similar resource endowments within the region face competitive pressure for development, and the awareness of learning and cooperation for green technology is weak; therefore, effective synergistic effects have not yet been formed.
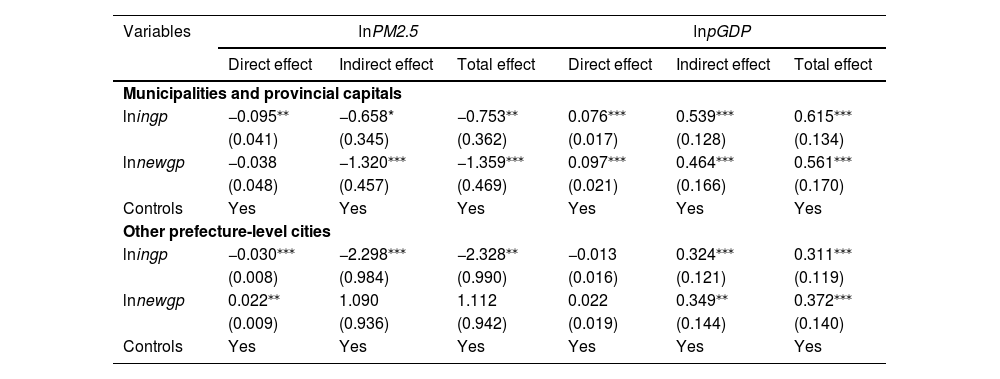
Administrative-level heterogeneity. We further explore the heterogeneous effects of green technology innovation on the economy and environment under the constraints of different urban resource endowments. Following Zhang et al. (2018), this study divides the sample into the following two groups to consider the differences in city administrative levels: municipalities and provincial capitals and other prefecture-level cities. This division allows us to analyze the heterogeneous spatial spillover effects of green technology innovation from the perspective of administrative-level heterogeneity, as shown in Table 9.
Estimation results for the SDM by administrative levels.
Note: Robust standard errors are shown in parentheses. ⁎⁎⁎,⁎⁎ and * mean significant at the levels of 1%, 5% and 10%, respectively. For space limitations, the results of parameter estimation of control variables are not presented, and the estimation results of green inventive technology innovation and green improved technology innovation are shown in the same column and distinguished by the horizontal lningp and lnnewgp, respectively.
For municipalities and provincial capitals, green inventive and improved technology innovation have significant spatial spillover effects, meaning that green technology innovation can significantly promote urban economic development while effectively improving environmental quality. This finding suggests that partnerships between municipalities and provincial capitals are formed, and the improvement of local green technology innovation positively affects neighboring cities. This drives neighboring municipalities and provincial capitals to achieve a win–win economy and environment quality development. Green technology innovation has an insignificant direct effect in other prefecture-level cities. However, it has a significantly positive spatial spillover effect on economic development. Green improved technology innovation exacerbates local environmental pollution and has no significant spatial spillover effect. This result indicates that different types of green technology innovation have heterogeneous effects among other prefecture-level cities. Specifically, green inventive technology innovation can drive neighboring prefecture-level cities to enhance their economies and environment, while green improved technology innovation is not environmentally friendly. Our results expand the findings of Zhang et al. (2018), who have argued that municipalities and provincial capitals given their higher administrative levels, are generally factor-gathering places and business centers within each province. Accordingly, they have better talent and technology transfer platforms than other prefecture-level cities. Higher administrative levels with more solid support and resource advantages allow green technology innovation to exert economic and environmental effects and achieve synergy; thus, differentiated policies are crucial for varying administrative levels of cities. Government departments can allocate green scientific and technology innovation resources through scientific and reasonable administrative means to optimize the spatial patterns of the urban economy and environment.
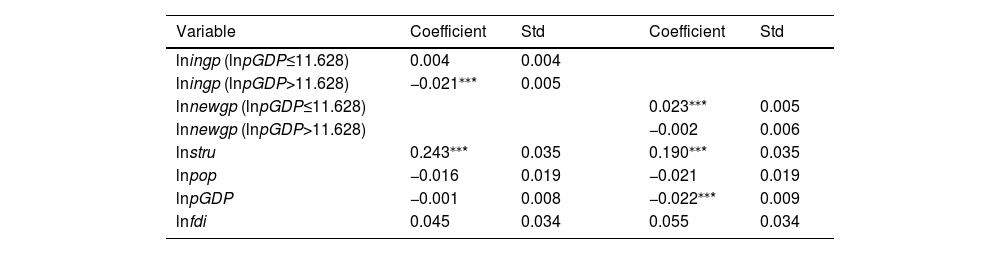
Nonlinear effects mechanism analysisDu et al. (2019) and Zeng et al. (2022) have stated that economic development is vital for harmonizing green technology innovation and air quality. To verify the nonlinear transmission mechanisms of economic development, we examine the threshold and mediating effects. We suggest that the heterogeneous effect of green technology innovation on air quality is correlated with the intensity and types of green technology innovation and is related to the varying levels of economic development. Using economic development as the threshold variable, the results in Table 10 show that green inventive and improved technology innovation have single-threshold effects with the threshold value of 11.628; thus, Hypothesis 5 is verified.
Table 11 reports the threshold effects of regression resulting from the heterogeneous green technology innovation on PM2.5. The estimated parameters of green inventive technology innovation are insignificantly positive (0.004) and significantly negative (−0.021). Conversely, green improved technology innovation is significantly positive (0.023) and insignificantly negative (−0.002). The results indicate that when lnpGDP is below 11.628, green inventive technology innovation has an insignificant effect on PM2.5, and green improved technology innovation significantly and positively affects PM2.5. When lnpGDP exceeds 11.628, green inventive technology innovation significantly and negatively affects PM2.5, and green improved technology innovation has an insignificant effect on PM2.5. This impact is manifested by the backward economic development level, which hinders green technology innovation from promoting air quality and leads to the failure of the economic driving effect. However, a relatively high economic development facilitates green technology innovation to achieve the emission reduction effect. The threshold effect results reveal that Chinese green technology innovation is synergistic with economic and environmental development, and economic development does not crowd out attention to environmental factors, such as air quality. When economic development is low, the focus should be on green inventive technological innovation because resource constraints accelerate economic development. Once economic development has reached a certain level, dual economic and environmental dividends are realized through green technological innovation, which based on sufficient resources and mature markets. Consistent with Zeng et al. (2022), our results reveal the improvement of a green environment at the advanced economic growth stages. This may be because in the early stages of economic development, when the economic level is relatively backward and the green technology innovation investment is low, the traditional high-pollution model can be adopted to enhance the boom of urban economies. However, this is not beneficial to achieving the ecofriendly utility of green technology innovation. When the economy is highly developed, green technology innovation receives sufficient investment, which contributes to improved air quality.
Threshold effects results of heterogeneous green technology innovation on PM2.5.
| Variable | Coefficient | Std | Coefficient | Std | |
|---|---|---|---|---|---|
| lningp (lnpGDP≤11.628) | 0.004 | 0.004 | |||
| lningp (lnpGDP>11.628) | −0.021⁎⁎* | 0.005 | |||
| lnnewgp (lnpGDP≤11.628) | 0.023⁎⁎* | 0.005 | |||
| lnnewgp (lnpGDP>11.628) | −0.002 | 0.006 | |||
| lnstru | 0.243⁎⁎* | 0.035 | 0.190⁎⁎* | 0.035 | |
| lnpop | −0.016 | 0.019 | −0.021 | 0.019 | |
| lnpGDP | −0.001 | 0.008 | −0.022⁎⁎* | 0.009 | |
| lnfdi | 0.045 | 0.034 | 0.055 | 0.034 |
Note: ⁎⁎⁎.
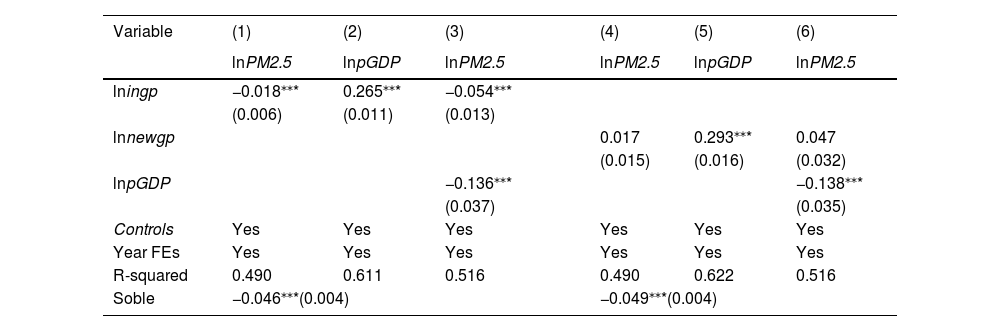
This study further employs a stepwise regression mediating mechanism test to explore the nonlinear role of economic development in the correlation between green technology innovation and air quality, as shown in Table 12. Economic development mediates the relationship between green technology innovation and air quality. Both green inventive and improved technology innovation are significantly positive in terms of economic development (see Columns (2) and (5)), even through they have a heterogeneous effect on air quality (see Columns (1) and (4)). Second, economic development has a significantly negative effect on air quality (see Columns (3) and (6)). Additionally, the Sobel test results for economic development are significant, indicating that the mediating effects are robust; thus, Hypothesis 6 is supported. These findings are similar to those reported in Liu and Dong. (2021) and Dong et al. (2022), who have proposed that green technology innovation is environmentally relevant, and high-quality technology that promotes sustainable economic development. As economic development improves, more attention is paid to environmental governance, which helps achieve emission-reduction targets and green development.
Mediating effects results of heterogeneous green technology innovation on PM2.5.
| Variable | (1) | (2) | (3) | (4) | (5) | (6) | |
|---|---|---|---|---|---|---|---|
| lnPM2.5 | lnpGDP | lnPM2.5 | lnPM2.5 | lnpGDP | lnPM2.5 | ||
| lningp | −0.018⁎⁎* | 0.265⁎⁎* | −0.054⁎⁎* | ||||
| (0.006) | (0.011) | (0.013) | |||||
| lnnewgp | 0.017 | 0.293⁎⁎* | 0.047 | ||||
| (0.015) | (0.016) | (0.032) | |||||
| lnpGDP | −0.136⁎⁎* | −0.138⁎⁎* | |||||
| (0.037) | (0.035) | ||||||
| Controls | Yes | Yes | Yes | Yes | Yes | Yes | |
| Year FEs | Yes | Yes | Yes | Yes | Yes | Yes | |
| R-squared | 0.490 | 0.611 | 0.516 | 0.490 | 0.622 | 0.516 | |
| Soble | −0.046⁎⁎*(0.004) | −0.049⁎⁎*(0.004) | |||||
Note: Robust standard errors are shown in parentheses. ⁎⁎⁎.
The results demonstrate that green inventive technology innovation directly affects air quality, while indirectly affecting air quality through economic development. Although the green improved technology innovation does not directly affect air quality, it can indirectly enhance it through economic development. Better economic development can produce more funding and technical support to improve urban air quality (Zhang et al., 2019). This finding supports the natural RBV theory, indicating that green technology innovation activities accompany the production of intangible resources and capabilities (Zhang et al., 2022). This theory emphasizes that green technology innovation must attach importance to the natural environment protections and the rational allocation and utilization of natural resources to obtain sustainable competitive advantages. Consequently, green technology innovation benefits urban economic development by improving the production products and processes. Furthermore, cities with high-quality economic development can use green technology innovation to improve air quality. Our results confirm that heterogeneous green technology innovation can improve air quality through direct or indirect transmission mechanisms; this finding is supported by Feng et al. (2021). Therefore, green technology innovation is critical for urban sustainability.
Conclusions and implicationsConclusionsOur study adopts the RBV theory to examine the internal mechanisms of the correlations between heterogeneous green technology innovation and air quality and economic development from spatial and nonlinear perspectives. Using panel data from 166 Chinese prefecture-level cities between 2004 and 2019, we empirically explore the heterogeneous spatial effect of green technology innovation on air quality and economic development, as well as the nonlinear role of economic development (from mediating and threshold effects). Furthermore, this study examines regional and administrative heterogeneity characteristics.
The following conclusions are drawn. First, green inventive technology innovation has significant spatial spillover effects on improving economic development and air quality. Second, green improved technology innovation has a significantly positive spatial spillover effect on economic development but no significant spillover effect on air quality. Third, the mechanism analysis proves that a nonlinear linkage exists between heterogeneous green technology innovation and air quality. On one hand, this shows the single-threshold characteristics of economic development; on the other hand, green technology innovation significantly and indirectly improves air quality through economic development. Fourth, the heterogeneity analysis shows that the effects of green technology innovation on air quality and economic development have regional and administrative levels of heterogeneity. Moreover, green inventive technology innovation has a significantly negative spillover effect on air quality in the central and western regions and an insignificant spillover effect on economic development in all regions. Furthermore, green improved technology innovation has a significantly negative spillover effect on air quality only in the central region. Compared to other administrative levels, green inventive and improved technology innovation in municipalities and provincial capitals with high administrative levels can significantly drive economic and air quality win-wins situations while having significant spatial spillover effects.
Theoretical contributionsThis theoretical contributions of this study are as follows: First, the study utilizes the RBV theory to develop a theoretical model that includes green technology innovation, economic development, and air quality, which expands previous research (Jiang et al., 2020; Zhang et al., 2022; Chen et al., 2022b). Additionally, this study extends the understanding of the spatial linkages and synergistic effect mechanisms of green technology innovation on air quality and economic development from a spatial spillover perspective. We confirm the heterogeneous characteristics of spillovers at the regional and administrative levels.
Second, the theoretical framework for the internal mechanisms of green technology innovation, economic development, and air quality is extended by exploring the threshold and mediating role of economic development. We find a single-threshold role of economic development. Furthermore, heterogeneous green technology innovations can indirectly improve urban air quality by boosting economic development.
Third, based on existing studies, our study contributes to the theory by investigating the role of green technology innovation from a multidimensional perspective, including green inventive and improved technology innovation. Different from Zhang et al. (2018) and Lee et al. (2022b), we consider various types of green technology innovation to expand the literature on urban green technology innovation. Varying types of green technology innovation have heterogeneous effects on economic development and air quality. Multidimensional green technology innovation measures offer a more comprehensive basis for managers to develop green technology innovation strategies.
Practical implicationsThe policy implications of our study are as follows. Policymakers should encourage heterogeneous green technology innovation. Green technology innovation can be seen help create a win–win economy and environment by enhancing to economic development and air quality. Policymakers should also understand the resource utilization of urban green technology innovation. Managers should pay attention to the spillover and nonlinear mechanisms of green technology innovation to optimize their effectiveness.
The findings have specific implications for future research. First, policymakers should offer service guarantees to safeguard the gathering and support of green technology innovation elements. Furthermore, because economic development is conducive to air quality, it is necessary to focus on improving the market-oriented nature of green technology innovation to cater to customer needs. Accordingly, that it can be recognized and paid for by the market and generate economic benefits. Moreover, different policy orientations should promote the patent effects of green inventions and utility models.
Second, concerning the contribution of green technology innovation to the economy and air quality improvement of neighboring cities through spatial spillover, the government should encourage regional green technology cooperation to narrow technology gaps. Simultaneously, given that green technology innovation within each region has not yet formed an effective and benign spatial spillover mechanism, the government should build green technology innovation exchange platforms faster and guarantee the sharing and exchange of green technology innovation results among cities within regions. This way, the development mode can changes from beggar-thy-neighbor to partner-thy-neighbor.
Third, considering that green technology innovation in cities and provincial capitals is beneficial to local economic development and air quality and has significant economic and environmental spillover effects, policies and financial support for green technology innovation in municipalities and provincial capitals should be strengthened. The advantages of the region's own resource endowments can be brought into play by stimulating green technology innovation in municipalities and provincial capitals. The “strong alliance” between municipalities and provincial capitals should be promoted to realize a win–win situation for the overall regional economic environment.
Limitations and future researchSome limitations need to be addressed in the future. Specifically, considering the availability of data, this study uses urban data as the sample to investigate the influence mechanisms of green technological innovation driving the economy and improving air quality. Examining the green technology innovation effect at the firm level can complement that at the urban level, which is beneficial for comprehensively and systematically expanding key bottleneck of green technology innovation drive from the macro to the micro level. Therefore, further research on dimension reduction at the enterprise level is required. Despite these limitations, this study remains vital to policymakers, as the vision of cities to realize the double dividend of a green technology innovation-driven economy and air quality runs unabated, which is conducive to green development.