


In a time of persistent and fierce “war for talents,” which is naturally inherent to the knowledge-intensive industries, the issue of employees’ job satisfaction is of the utmost managerial significance. In that respect, this study explores certain intrinsic factors that underlie the job satisfaction concept, as well as the durability of employees’ job satisfaction. Based on the extant literature, a theoretical model of job satisfaction was designed, which was subsequently tested using the data gathered through the surveys conducted over the ten years. The results obtained by model testing show that employees’ job expectations make up that particular intrinsic factor that differentiates job satisfaction from non-satisfaction. More intriguingly, the results showed that prior job satisfaction is not a reliable predictor of later job satisfaction.
As the IT industry mature, its impact on the economy and society becomes progressively larger and more profound. The processes and concepts like digital transformation, cybersecurity, artificial intelligence, to mention but a few, have paved the way for growth and advancement in all facets of modern society and, particularly, in the realm of business. This immense progress, however, poses many challenges for both business and society. Aside from the growing ethical and legal issues related to privacy, security, and confidentiality, present-day IT companies are also facing numerous technological and managerial challenges – emerging technologies adoption, creating a new market or existing market growth, the introduction of innovative business model, and alike. Wise decision-making concerning these and similar issues is critical for their business success and, in some cases, even their mere existence.
To cope with all these issues, IT companies must have an adequately numerous and capable workforce. Consequently, the implementation of sound human resource management (HRM) practices and processes, and in particular – employee recruiting, training, and retention, are of the utmost importance to these companies. Moreover, today’s companies are highly dependent on their most talented employees, so the issue of employee retention becomes of critical importance. Because of its extremely high talent turnover rate (Booz, 2018), this issue is particularly evident in the IT industry, which results in an intense and fierce “war for talents” between IT companies (Korsakienė, Tankevičienė, Šimelytė, & Talačkienė, 2015).
Many studies show that high job satisfaction is negatively related to employee turnover intentions and, consequently, positively related to employee retention (e.g., Chen, Ployart, Cooper Thomas, Anderson, & Bliese, 2011; Mobley, 1977). The same goes for the IT industry/IT professionals, but for a deeper understanding of this relationship, some specific antecedents of job satisfaction for the IT context should also be considered (Damien, Ng, Koh, & Ang, 2007). IT professionals are fully aware of the value of the human capital they possess and the general shortage of talents, which significantly increases their ease of movement between organizations, both perceived and actual. Therefore, to motivate, engage, and retain them, besides the adequately provided main extrinsic factors of job satisfaction (e.g., base salary, work conditions, supervision), which is implicitly granted, managers have to provide, above all, the proper intrinsic factors of job satisfaction (Allen, Armstrong, Reid, & Riemenschneider, 2008; Šajeva, 2007; Salas-Vallina, Alegre, & Guerrero, 2018). Accordingly, the first research question of the study is as follows: RQ1:Which specific intrinsic factors have a significant impact on employees’ perceptions of job satisfaction?
Having in mind all positive outcomes of a high level of employees’ job satisfaction, a very interesting and important question of strength and durability of the achieved satisfaction level emerges. Furthermore, considering the high dynamism and quick changes in both situational and dispositional factors in the IT industry, this issue of the temporal stability of job satisfaction is further reinforced, which leads to the second research question of this study: RQ2:Is the effect of a previous job satisfaction fleeting, or it has a notable influence on the later job satisfaction?
These two research questions define the scope and purpose of this study. On that basis, a relevant research design was proposed, which contains a corresponding theoretical model of job satisfaction. This model was subsequently tested using the data gathered through an appropriate survey.
The following section reviews the relevant literature related to the research topics and then presents a set of research hypotheses, which outlines a conceptual model of job satisfaction. The third section describes the data and data analysis methods that were used in the study. This section ends with a detailed result interpretation and discussion, followed by the limitations of research and recommendations for future research. Finally, the paper finishes with some concluding remarks about the study and its main findings.
2Literature reviewLooking chronologically into the development of modern management practice and thought, the first distinguishable era – the “scientific management era” – was succeeded by the “social person era” (Wren & Bedeian, 2009). The latter period, which began in the early 1930s, is characterized by the belief that positive human relations are the main precondition for work effectiveness and efficiency. Its beginning had been marked by the famous Hawthorne studies, which can be considered as a cradle of the job satisfaction concept, primarily through the works of Elton Mayo (1933). The job satisfaction concept, one of the most widely exploited in social sciences, has been used to explore and explain numerous phenomena in organizational behaviors and workplace dynamics (Hodson, 1991).
2.1Employees’ job satisfaction – the conceptAlthough thoroughly studied for almost a century now, the concept of job satisfaction and its use in explaining workplace behaviors is still very actual. Such longevity and vigor resulted in the appearance of several different approaches to the study of this concept (Hodson, 1991). Consequently, the definition of job satisfaction has been given in several ways by different authors (e.g., Griffin & Moorhead, 2014; Locke, 1969; Spector, 1997), thus emphasizing the importance and broad utilization of this concept in social sciences (Aziri, 2011). Nevertheless, all those definitions, no matter how different they may be, point to the single most important determinant of the concept, which is how people feel about (perceive) their job – positively (higher satisfaction) or negatively (lower satisfaction). Adhering firmly to this particular determinant gives the necessary breadth to the definition of job satisfaction concept, which is very important for its extensive usage within the different research works (Robbins & Judge, 2017).
Employees’ satisfaction with their jobs is usually measured with a sophisticated composite measure (e.g., Mihajlović, Živković, Prvulović, Štrbac, & Živković, 2008; Smith Randolph, 2005), which consists of several indicators (job facets). Such measure complexity provides a deeper insight into existing and potentially problematic job aspects, which is of utmost importance for HR managers. Following Herzberg’s two-factor theory (Herzberg, Mausner, & Snyderman Bloch, 1959), indicators of job satisfaction (e.g., work nature, salary, career advancement, work environment, supervision…) are usually divided into two groups – extrinsic (hygiene) and intrinsic (motivational) factors. Hygiene factors measure the level of employees’ dissatisfaction and can be treated as the necessary conditions for job satisfaction. Only if these factors are adequate should the motivational factors be emphasized in order to increase the level of employees’ job satisfaction (Robbins & Judge, 2017). In that regard, the most important intrinsic factors are personal achievement, recognition, and work itself (Herzberg, 2003).
Having discussed the concept of job satisfaction and its determinants, some significant effects of this concept should be considered further. It is generally regarded that satisfied workers are more productive, engaged with their work, and perform on a higher level. The two most important outcomes of the employees’ job satisfaction (or lack of it) are job performance and employee turnover. Although some researchers believe that highly satisfied employees do not necessarily perform better (Griffin & Moorhead, 2014), many studies point toward a rather strong and positive relationship between job satisfaction and job performance (Al-Dalahmeh, Masa’deh, Khalaf, & Obeidat, 2018; Eliyana, Ma’arif, & Muzakki, 2019; Judge, Thoresen, Bono, & Patton, 2001). Similarly, the relationship between job satisfaction and employee turnover is very strong. Namely, a decrease in job satisfaction level strongly predicts an increase in employees’ intention to leave the organization (e.g., Chen et al., 2011; Korsakienė et al., 2015). These two, as well as some other outcomes of job satisfaction (e.g., customer satisfaction, life satisfaction) or dissatisfaction (e.g., absenteeism, tardiness), suggest that managers should thoughtfully consider the employees’ job satisfaction since it can strongly influence overall organizational effectiveness and efficiency.
2.2Employees’ job satisfaction – the IT industry particularitiesA positive outcome of high job satisfaction has been found across a number of different industries, which is confirmed by many studies (e.g., Al-Dalahmeh et al., 2018; Prockl, Teller, Kotzab, & Angell, 2017; Smith Randolph, 2005). At the same time, the level of job satisfaction in related industries (for example, service industries) does not depend on a particular sector, but primarily on some other factors, such as country, earning level, and occupation (Bednarska & Szczyt, 2015). A similar finding, that is, that there is no difference in job satisfaction between high tech and traditional industries, has been revealed by Gamst and Otten (1992). All this points out that the main determinants of job satisfaction are job characteristics (e.g., personal recognition and advancement, supervision, salary, working environment), regardless of the industry. Moreover, it does not matter whether those characteristics are common to many different industries or idiosyncratic to any particular industry. It should be noted, however, that the cultural dimension has a significant impact on the relative importance of the mentioned job characteristics (Andreassi, Lawter, Brockerhoff, & Rutigliano, 2012).
Even when compared among the various economy sectors (i.e., private, public, and voluntary sectors), job satisfaction has the same positive outcomes, and its antecedents do not differ a lot (Hsieh, 2016). A very similar finding comes from research on job satisfaction determinants among highly educated professionals from different fields (Cohrs, Abele, & Dette, 2006). Appreciating these similarities across different economy sectors, industries, and professions, industry specificities, nonetheless, have a substantial effect on the importance of particular job satisfaction determinants. In people-care industries and related professions, the emotional component of work has a decisive effect on job satisfaction. Namely, the work’s emotional value is a critical job satisfaction determinant for nurses (Liu, Aungsuroch, & Yunibhand, 2016), while emotional exhaustion is a key job satisfaction determinant for flight attendants (Ng, Sambasivan, & Zubaidah, 2011). As another example, teachers’ self-efficacy is an important determinant of job satisfaction in education (Caprara, Barbaranelli, Steca, & Malone, 2006). Similarly, for many other sectors, industries, and professions, one can find job satisfaction determinants that outweigh others (e.g., Prockl et al., 2017; Ting, 1997). The same goes for the high-tech industries, where the IT industry belongs – industry particularities moderate the most important determinants of employees’ job satisfaction.
The information technology (IT) industry consists of three main groups: software and services industry, technology hardware industry, and semiconductors industry. It is among the five fastest-growing industries globally, with a seven-year average annual growth of 4.2% and a projected output in 2020 of $5.2 trillion (CompTIA, 2019). The IT industry belongs to the high-tech industry sector, which is characterized by rapid environmental and technological change and continual and consistent products and services innovation. A high proportion of workers in STEM (Science, Technology, Engineering, and Mathematics) occupations is another significant characteristic of the IT industry. According to many on-line resources (e.g., LinkedIn, Readers Digest, CNBS), the most in-demand skills and jobs belong to the IT realm. Thus the IT professionals feel very confident about their future (CompTIA, 2019). In addition, medical professions aside, IT professionals hold almost half of the ten highest-paid occupations worldwide.
The described IT industry particularities have a substantial impact on the industry’s employees’ characteristics and behavior. In general, employees from labor-intensive high-tech industries, such as the IT industry (so-called “knowledge workers”), constitute a major part of the engaged human capital. Knowledge workers possess the knowledge as their most potent resource (Drucker, 1974), which enables them to move freely between many different employers and businesses. Although some companies benefit very much from this mobility, the companies of departure can experience a significant loss both from the knowledge drain and weakening of competitive edge. To avoid such adverse outcomes and decrease voluntary employee turnover, IT companies should manage relationships with their employees at multiple levels (Von Hagel & Miller, 2011).
Another important trait of IT professionals is the high level of individualism (Sutherland & Jordaan, 2004), even between those coming from traditionally collective cultures of the East and South-east Asia (Jirachiefpattana, 2015). Consequently, in their jobs, IT professionals are primarily looking for self-actualization, personal development, and work flexibility (Šajeva, 2007; Tampoe, 1993). These two characteristics – mobility and individualism, play a major role in how IT companies (should and do) motivate the knowledge workers and ensure their job satisfaction (e.g., Damien et al., 2007; Korsakienė et al., 2015; Šajeva, 2007).
2.2.1IT industry in Bosnia and HerzegovinaBosnia and Herzegovina (BiH), a country from Southeast Europe, with a population of 3.5 million and GDP per capita of 5674 US$, belongs to the group of developing countries (Schwab, 2019). BiH, as a transitional economy, is considered the least competitive in the region, primarily for its lack of a single economic space and inadequate institutional support for business. After the devastating war from 1992 to 1995, BiH entered into a period of substantial economic revival with an average annual GDP growth rate of 21.47% (The World Bank, 2019). However, from the year 2009, a fast economic expansion was significantly decreased by the destructive political climate.
In recent years, one of the most promising industry sectors in BiH has been the IT sector (US Department of State, 2017). During the period from the year 2012 to the year 2016, this sector has recorded 201% income growth and 1419% employment growth (Official Gazette of BiH 42/17, 2017). Furthermore, according to some recent industrial research in BiH, there is a need for about 6000 new people in the IT industry over the next few years (Bit Alliance, 2019). All of this points to the great potential of the IT industry in BiH.
Unfortunately, the high labor demand cannot be met by the present, rather obsolete education system in BiH, whose output is only around 300 new IT engineers annually. Such a deficit of qualified IT workforce, augmented with a significant drain of IT staff to EU countries and the USA, results in a fierce struggle among the HR departments of IT companies. Consequently, IT people are highly valued, extremely well paid (the second-highest average wage in BiH), and provided with numerous privileges and benefits (sophisticated workplaces, bonuses, professional training, and others), which makes job positions within the IT sector highly attractive.
2.3Employees’ job satisfaction – the modelGiven the fact that a job satisfaction concept has been thoroughly studied since the late 1960s, in the existing literature one can find a plethora of research models that relate to this concept (e.g., Djoemadi, Setiawan, Noermijati, & Irawanto, 2019; Prockl et al., 2017; Staples & Higgins, 1998). These models, elaborated to a greater or lesser extent, focus on various aspects of the job satisfaction concept, thus exploring its many different influential factors. Building on such knowledge, the primary goal of this study is to design a proper theoretical model of job satisfaction, which has the capacity to provide satisfactory answers to the research questions posed. Besides, the proposed model needs to be parsimonious enough in order to be used within a rather complex research design.
Promotion, as an employee’s advancement in rank or position in a hierarchical structure, represents a very important aspect of career progress, which usually comes with more or less significant pay growth (Blau & Devaro, 2007; Francesconi, 2001; McCue, 1996). The salary increase, when all other influential factors are unchanged, may also come as a result of worker’s increased job performance and/or productivity (Bartel, 1995; Dickens et al., 2007). Moreover, both promotion and pay growth, which combined can be considered as a close proxy for career advancement, have a significant impact on job satisfaction (Kosteas, 2011; Smith, 2015). Therefore, the first research hypothesis is posed as: H1:The actual employees’ career progress has a direct and positive impact on their overall job satisfaction.
The effects of job expectations on job satisfaction have been studied for a while, starting with Porter and Steers’ (1973) seminal work and their famous met expectations hypothesis. This relation between job expectations and job satisfaction was further elaborated in Clark (1992) important research about the job satisfaction phenomenon, as well in many subsequent studies (e.g., Irving & Montes, 2009; Kosteas, 2011; Long, 2005). All these studies have pointed out the positive link between fulfilled job expectations and job satisfaction. Finally, if the work performed met one’s job expectations, what intuitively comes is that such an outcome ought to affect her/his job satisfaction positively. Thence, the second research hypothesis is as follows: H2:The extent of fulfillment of employees’ expectations about the work has a direct and positive impact on their overall job satisfaction.
The very interesting issue about the job satisfaction concept is connected to its relationship with time. Some early research on this topic (Gerhart, 1987; Staw & Ross, 1985) have found that prior job satisfaction predicts later job satisfaction. Somewhat different findings, however, one can find in more recent research (Riza, Ganzach, & Liu, 2018). Nevertheless, an extensive meta-analysis of more than 800 articles showed that overall job satisfaction positively changes over time (Ng & Feldman, 2010). Based on all these findings, the third hypothesis is as follows: H3:The previous level of employees’ job satisfaction has a direct and positive impact on their current job satisfaction.
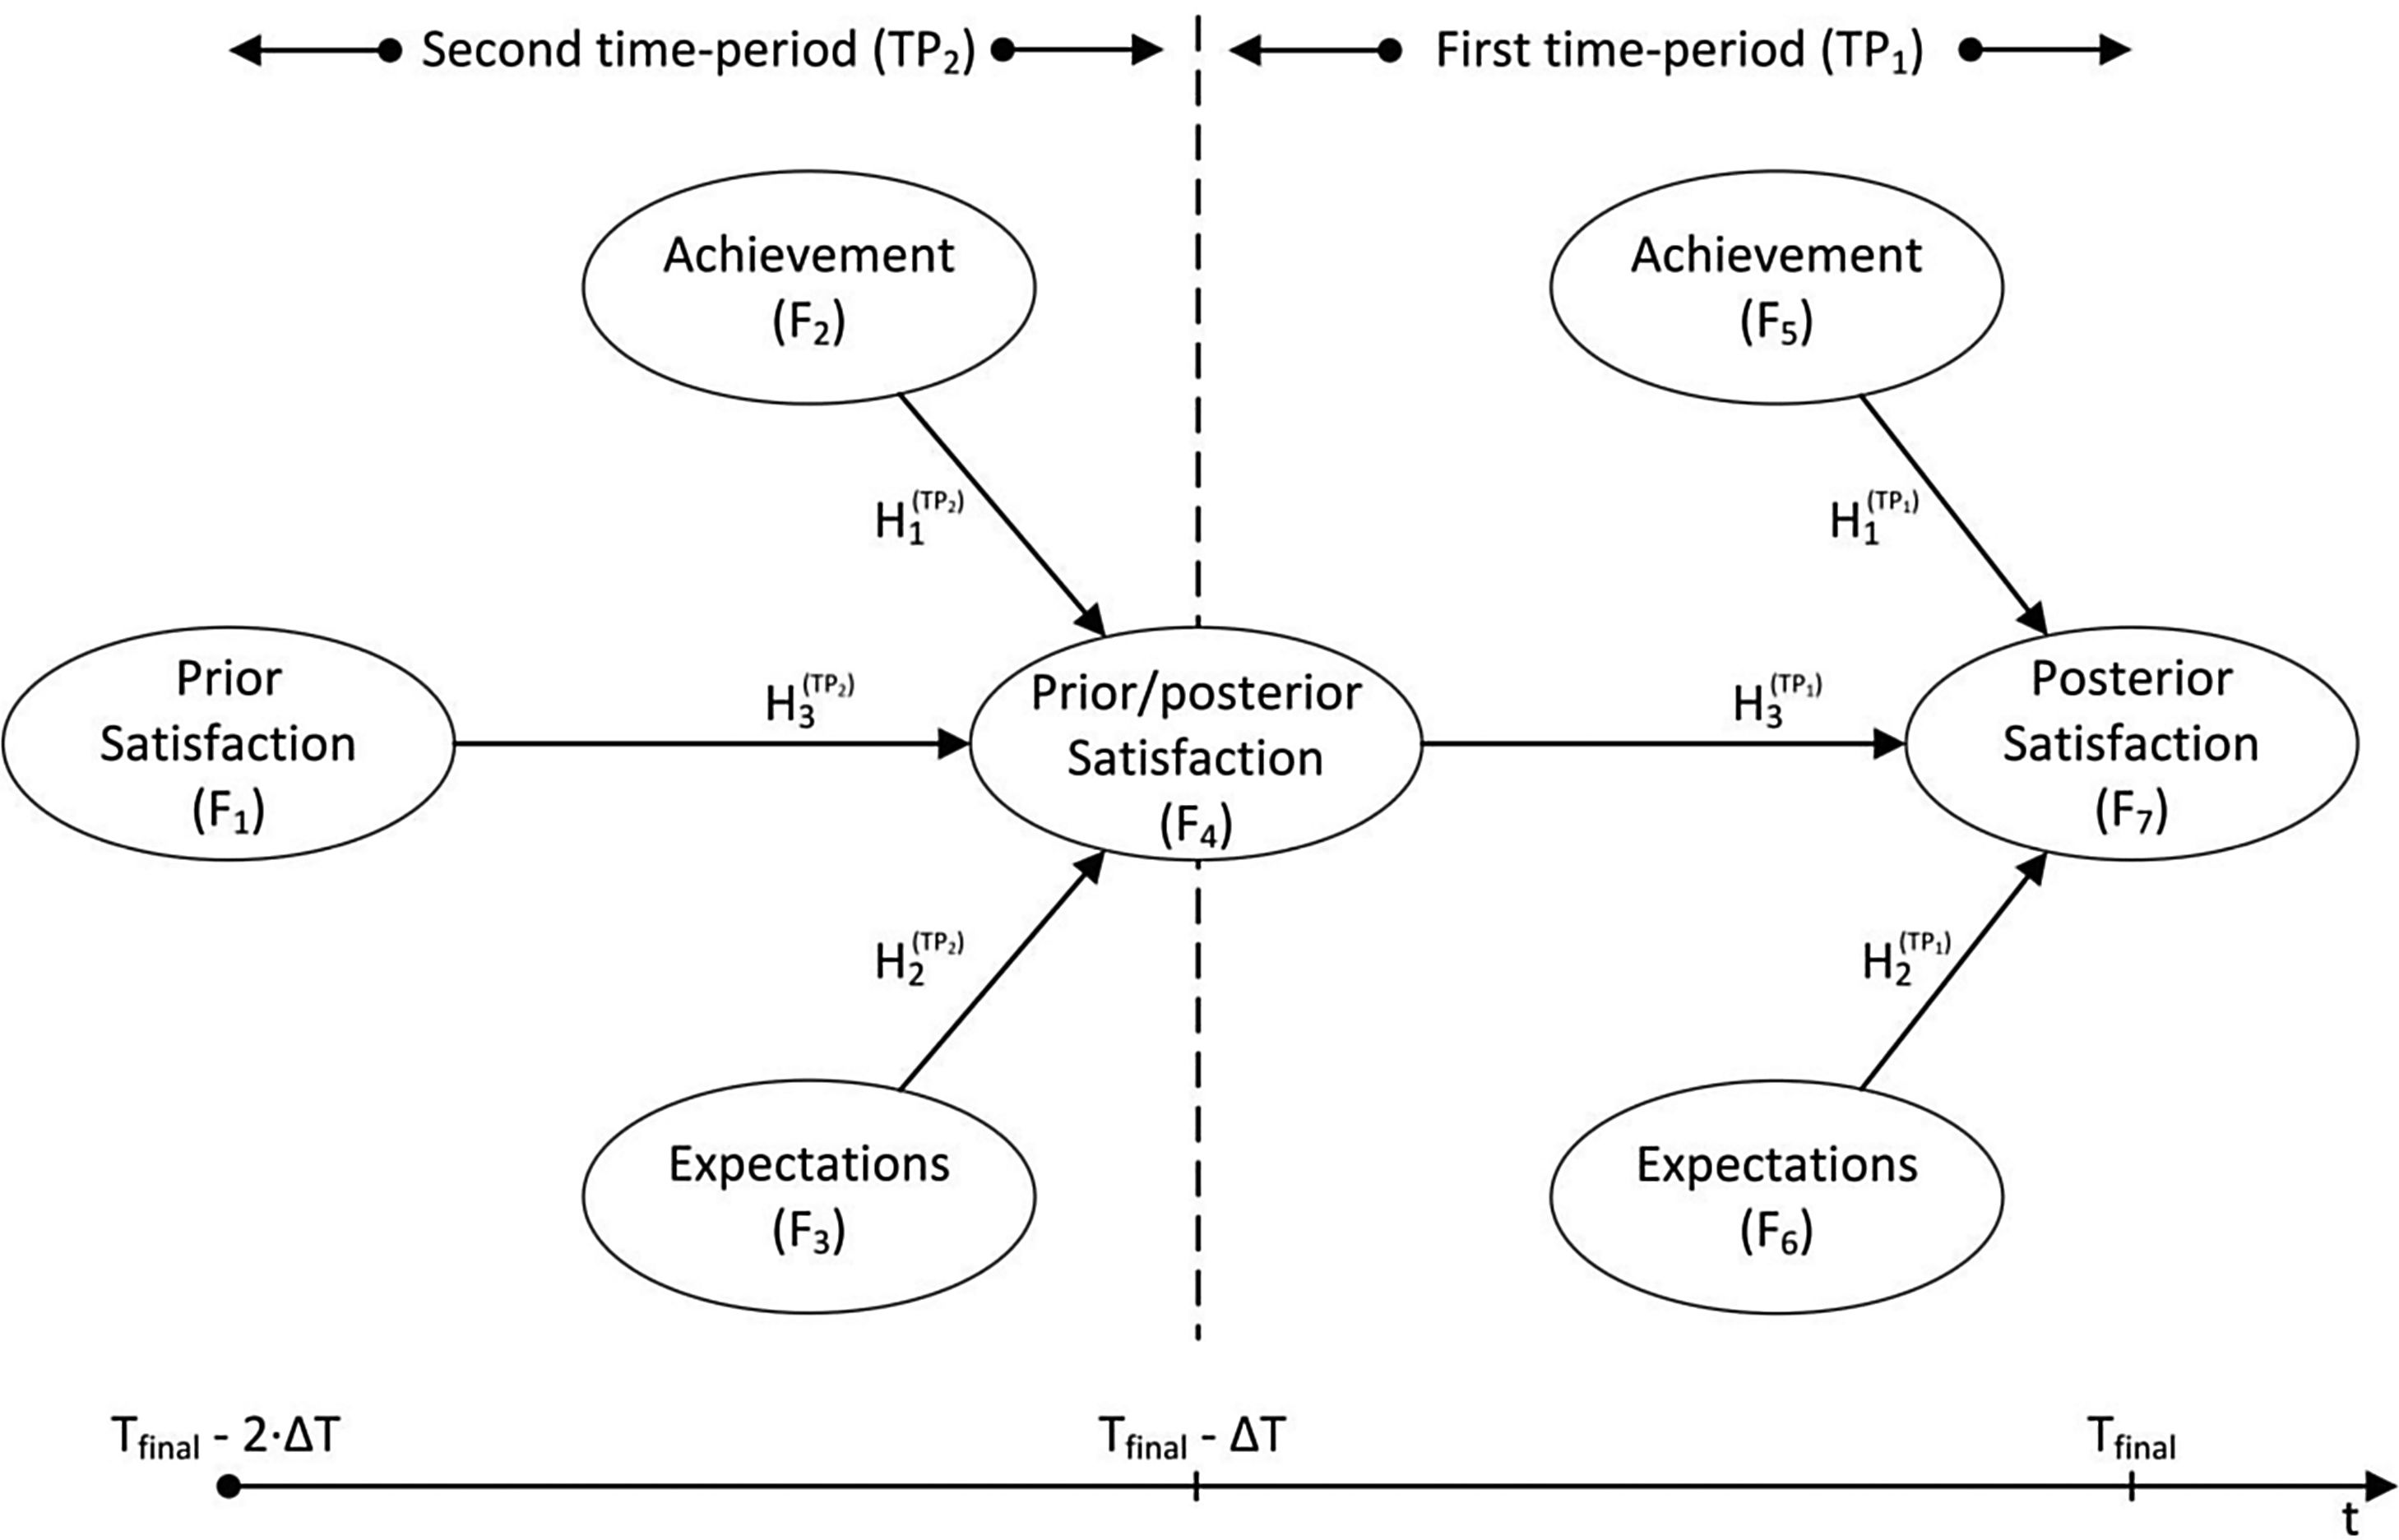
These three hypotheses have shaped the theoretical (conceptual) model of job satisfaction. The proposed model comprises all factors of the job satisfaction concept that are important for this research, and yet it is simple enough to be used for the more complex research design (Fig. 1).
3Data and methodology
The research was set out within a single computer and software engineering company (“The Company”) from the Federation of Bosnia and Herzegovina. “The Company” was founded in 1997 and primarily targets large and complex business and government systems, but also offers a range of services and solutions for the market of medium-sized enterprises. For many years “The Company” has employed over 50 full-time staff members (10-year average amounts to 56 employees), most of them highly qualified in the field of computer and software engineering. Employee fluctuation is relatively low (10-year average – 3 departures annually) in comparison to other companies from the same industry, while the employees’ average length of service amounts to 9 years.
To test the hypothesized model, an appropriate survey questionnaire was developed and sent to all eligible employees each year during the period from the year 2008 to the year 2018. Eligible employees are those that comply with the following profile:
- •
employed in “The Company” for at least five consecutive years,
- •
not members of the company’s management, and
- •
did not occupy positions in ancillary services.
A total of 412 responses to the surveys were received, out of which 355 (or 86.16%) were qualified for the research (responses that came from the employees that comply with the above profile). These qualified responses were received from 46 persons that have been employed by “The Company” during the survey period from the year 2008 to the year 2018.
The second part of the study was archival research of personal data for the employees whose responses to the survey were qualified for further research. Archival research assumed the obtaining of necessary data for an objective assessment of employees’ performance. The data were obtained from the personal records from the company’s official archive.
3.1Research design and measuresThe main interest of this study is employees’ job satisfaction or, more specifically, the underlying concepts that have a positive effect on the overall employees’ work contentment. Besides, the study aims to develop and test an appropriate model, which enables analysis of the employees’ job satisfaction over different time-periods.
The corresponding research design is presented in Fig. 1. The hypothesized model of employees’ job satisfaction was tested through two consecutive periods. The first period (TP1) ends at the present time (Tfinal), which is in the year 2018 or at the last year of the worker’s employment in “The Company,” and begins ΔT years earlier. The second period (TP2) ends at the beginning of the first period (i.e., at Tfinal – ΔT) and begins ΔT years earlier (i.e., at Tfinal – 2·ΔT). The basic length of both periods is two years, but for the model validation purposes, the determiner of time-periods length (ΔT) varies between two and four years.
All model indicators, which are listed and described below, were measured using the data from the conducted surveys and the company’s official archive. The measurements span different time-periods between the year 2008 and the year 2018.
3.1.1Prior/Posterior satisfaction (F1, F4, F7)This construct relates to employees’ perceived job satisfaction. It designates the extent to which employees are stimulated with the work they perform and are content with the overall career outcome. To measure this construct, a three-indicator measure, which is based on the identified particularities of the IT industry and important traits of IT professionals – individualism and self-actualization, was developed. Those three indicators are as follows:
- •
“Challenging Work” (X11 / Y21 / Y31) – ranks (1–7) the perceived level of how much the job is challenging, interesting, and motivating at both the beginning (prior) and the end (posterior) of the measurement period.
- •
“Career Advancement” (X12 / Y22 / Y32) – ranks (1–7) the perceived potential for promotion in rank (seniority) within the company based on achieved working results, at both the beginning (prior) and the end (posterior) of the measurement period.
- •
“Professional Improvement” (X13 / Y23 / Y33) – ranks (1–7) the perceived potential for improvement of technical proficiency, knowledge, skills, and working experience at both the beginning (prior) and the end (posterior) of the measurement period.
This construct refers to the actual employees’ work success and career progress, or how really successful in performing her/his job had a particular employee been during the measurement period. To measure this construct, a rather simple two-indicator measure, which refers to the employees’ promotion and wage increase, was used. Those two indicators are as follows:
- •
“Promotion” (X21 / X31) – ranks (1–7) the actual advancement in rank (seniority) of the employees during the measurement period. The lowest rank is assigned to those employees who were demoted during the measurement period, while the highest rank is assigned to those employees who were promoted to the most senior rank during the measurement period.
- •
“Relative Wage Increase” (X22 / X32) – ranks (1–7) the actual wage increase of the employees during the measurement period. The lowest rank is assigned to those employees whose wages were decreased during the measurement period, while the highest rank is assigned to those employees whose wages were increased by more than 90% during the measurement period.
It has to be noted that the proposed model uses material compensations only as an indicator of actual career progress. Besides, these indicators are objective proxies for actual work achievement (career progress), and they differ from all other indicators in the model by their origin and nature.
3.1.3Expectations (F3, F6)This construct relates to the extent to which employees’ expectations about the work are met. A three-indicator measure proposed for this construct provides a measurement scale that shows the expectations fulfillment level perceived by the employees. The proposed indicators were selected based on the responses gathered from a multi-year survey (conducted within “The Company”) about the most important expectations employees pose to their jobs. Those indicators are as follows:
- •
“Empowerment” (X23 / X33) – ranks (1–7) the perceived balance between responsibility and authority, measured at the end of the corresponding period.
- •
“Organization of Work” (X24 / X34) – ranks (1–7) the perceived level of clear and timely communicated work tasks and expected results, measured at the end of the corresponding period.
- •
“Incentives” (X25 / X35) – ranks (1–7) the perceived possibility to propose and implement own business-related ideas, measured at the end of the corresponding period.
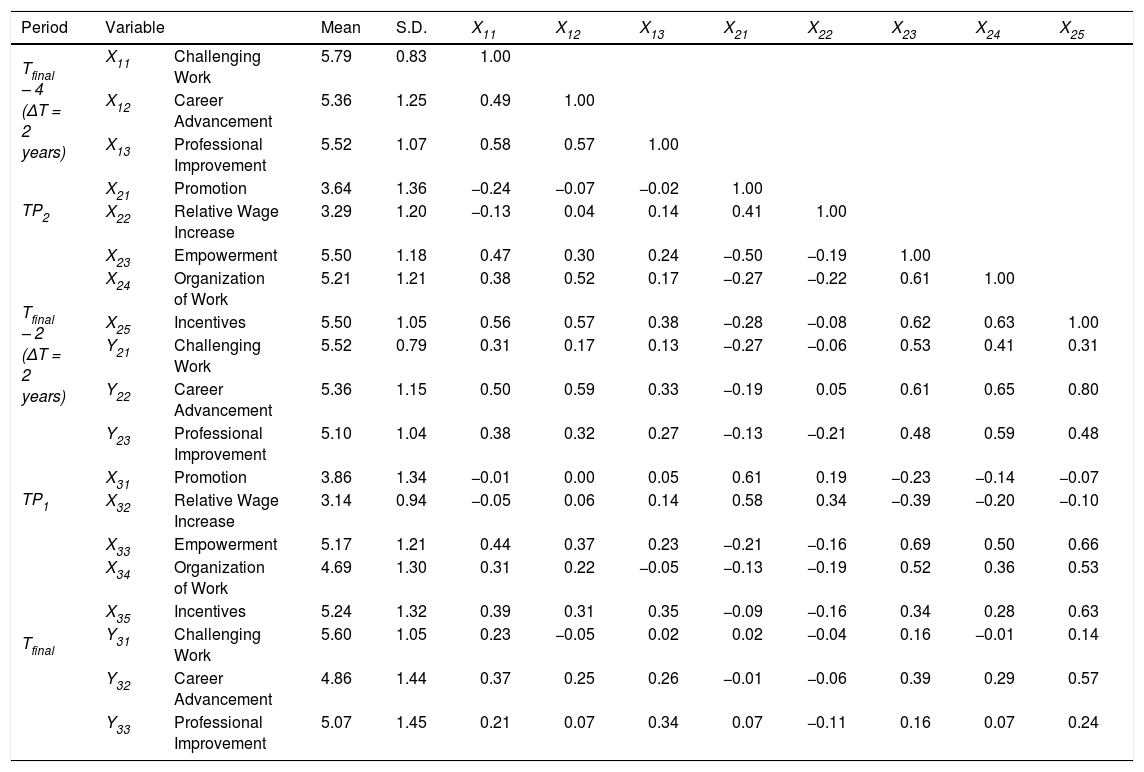
All model variables are ordinal, whose means, standard deviations, and mutual correlations are given in Table 1. The partial least squares structural equation modeling (PLS-SEM), which enables simultaneous testing of several dependence relationships within a single theoretical model, was employed for testing the hypothesized model. Using the software application SmartPLS 3.2.7 (Ringle, Wende, & Becker, 2015), both the structural and measurement models were tested, which complies with the proposed procedure for applying PLS-SEM (Hair, Hult, Ringle, & Sarstedt, 2017).
Means, standard deviations and correlations between model variables.
| Period | Variable | Mean | S.D. | X11 | X12 | X13 | X21 | X22 | X23 | X24 | X25 | |
|---|---|---|---|---|---|---|---|---|---|---|---|---|
| Tfinal – 4 (ΔT = 2 years) | X11 | Challenging Work | 5.79 | 0.83 | 1.00 | |||||||
| X12 | Career Advancement | 5.36 | 1.25 | 0.49 | 1.00 | |||||||
| X13 | Professional Improvement | 5.52 | 1.07 | 0.58 | 0.57 | 1.00 | ||||||
| TP2 | X21 | Promotion | 3.64 | 1.36 | −0.24 | −0.07 | −0.02 | 1.00 | ||||
| X22 | Relative Wage Increase | 3.29 | 1.20 | −0.13 | 0.04 | 0.14 | 0.41 | 1.00 | ||||
| Tfinal – 2 (ΔT = 2 years) | X23 | Empowerment | 5.50 | 1.18 | 0.47 | 0.30 | 0.24 | −0.50 | −0.19 | 1.00 | ||
| X24 | Organization of Work | 5.21 | 1.21 | 0.38 | 0.52 | 0.17 | −0.27 | −0.22 | 0.61 | 1.00 | ||
| X25 | Incentives | 5.50 | 1.05 | 0.56 | 0.57 | 0.38 | −0.28 | −0.08 | 0.62 | 0.63 | 1.00 | |
| Y21 | Challenging Work | 5.52 | 0.79 | 0.31 | 0.17 | 0.13 | −0.27 | −0.06 | 0.53 | 0.41 | 0.31 | |
| Y22 | Career Advancement | 5.36 | 1.15 | 0.50 | 0.59 | 0.33 | −0.19 | 0.05 | 0.61 | 0.65 | 0.80 | |
| Y23 | Professional Improvement | 5.10 | 1.04 | 0.38 | 0.32 | 0.27 | −0.13 | −0.21 | 0.48 | 0.59 | 0.48 | |
| TP1 | X31 | Promotion | 3.86 | 1.34 | −0.01 | 0.00 | 0.05 | 0.61 | 0.19 | −0.23 | −0.14 | −0.07 |
| X32 | Relative Wage Increase | 3.14 | 0.94 | −0.05 | 0.06 | 0.14 | 0.58 | 0.34 | −0.39 | −0.20 | −0.10 | |
| Tfinal | X33 | Empowerment | 5.17 | 1.21 | 0.44 | 0.37 | 0.23 | −0.21 | −0.16 | 0.69 | 0.50 | 0.66 |
| X34 | Organization of Work | 4.69 | 1.30 | 0.31 | 0.22 | −0.05 | −0.13 | −0.19 | 0.52 | 0.36 | 0.53 | |
| X35 | Incentives | 5.24 | 1.32 | 0.39 | 0.31 | 0.35 | −0.09 | −0.16 | 0.34 | 0.28 | 0.63 | |
| Y31 | Challenging Work | 5.60 | 1.05 | 0.23 | −0.05 | 0.02 | 0.02 | −0.04 | 0.16 | −0.01 | 0.14 | |
| Y32 | Career Advancement | 4.86 | 1.44 | 0.37 | 0.25 | 0.26 | −0.01 | −0.06 | 0.39 | 0.29 | 0.57 | |
| Y33 | Professional Improvement | 5.07 | 1.45 | 0.21 | 0.07 | 0.34 | 0.07 | −0.11 | 0.16 | 0.07 | 0.24 | |
| Period | Variable | Y21 | Y22 | Y23 | X31 | X32 | X33 | X34 | X35 | Y31 | Y32 | Y33 | |
|---|---|---|---|---|---|---|---|---|---|---|---|---|---|
| Tfinal – 2 (ΔT = 2 years) | Y21 | Challenging Work | 1.00 | ||||||||||
| Y22 | Career Advancement | 0.42 | 1.00 | ||||||||||
| Y23 | Professional Improvement | 0.60 | 0.47 | 1.00 | |||||||||
| TP1 | X31 | Promotion | −0.15 | 0.00 | 0.10 | 1.00 | |||||||
| X32 | Relative Wage Increase | −0.13 | −0.09 | 0.01 | 0.55 | 1.00 | |||||||
| Tfinal | X33 | Empowerment | 0.28 | 0.61 | 0.46 | 0.03 | −0.17 | 1.00 | |||||
| X34 | Organization of Work | 0.27 | 0.49 | 0.36 | −0.01 | −0.12 | 0.73 | 1.00 | |||||
| X35 | Incentives | 0.06 | 0.38 | 0.38 | 0.11 | 0.11 | 0.63 | 0.51 | 1.00 | ||||
| Y31 | Challenging Work | 0.43 | 0.08 | 0.38 | 0.08 | 0.06 | 0.45 | 0.36 | 0.38 | 1.00 | |||
| Y32 | Career Advancement | 0.23 | 0.55 | 0.41 | 0.18 | 0.07 | 0.68 | 0.66 | 0.74 | 0.45 | 1.00 | ||
| Y33 | Professional Improvement | 0.26 | 0.18 | 0.51 | 0.21 | 0.13 | 0.47 | 0.33 | 0.71 | 0.57 | 0.63 | 1.00 | |
The dataset contains responses from 42 employees, with no missing data. The sample size of 42 observations is well above the minimum 30 observations dictated by the “10 times rule” (Barclay, Higgins, & Thompson, 1995). In accordance with the stricter guidelines for sample size (Cohen, 1992), this sample provides for detection of R2 values of around 0.25, assuming a significance level of 5% and statistical power of 0.8 (Hair et al., 2017).
Working with ordinal variables cause that both univariate and multivariate normality was violated. Even though PLS-SEM does not require normal data distribution, it is preferable that the data do not deviate much from normality. Considering that all but three variables in the proposed model show only a slight non-normality (|skew| < 1, |kurtosis| < 2), this preference was satisfied. Since all assumptions were met, the next steps in the PLS-SEM procedure could have been taken.
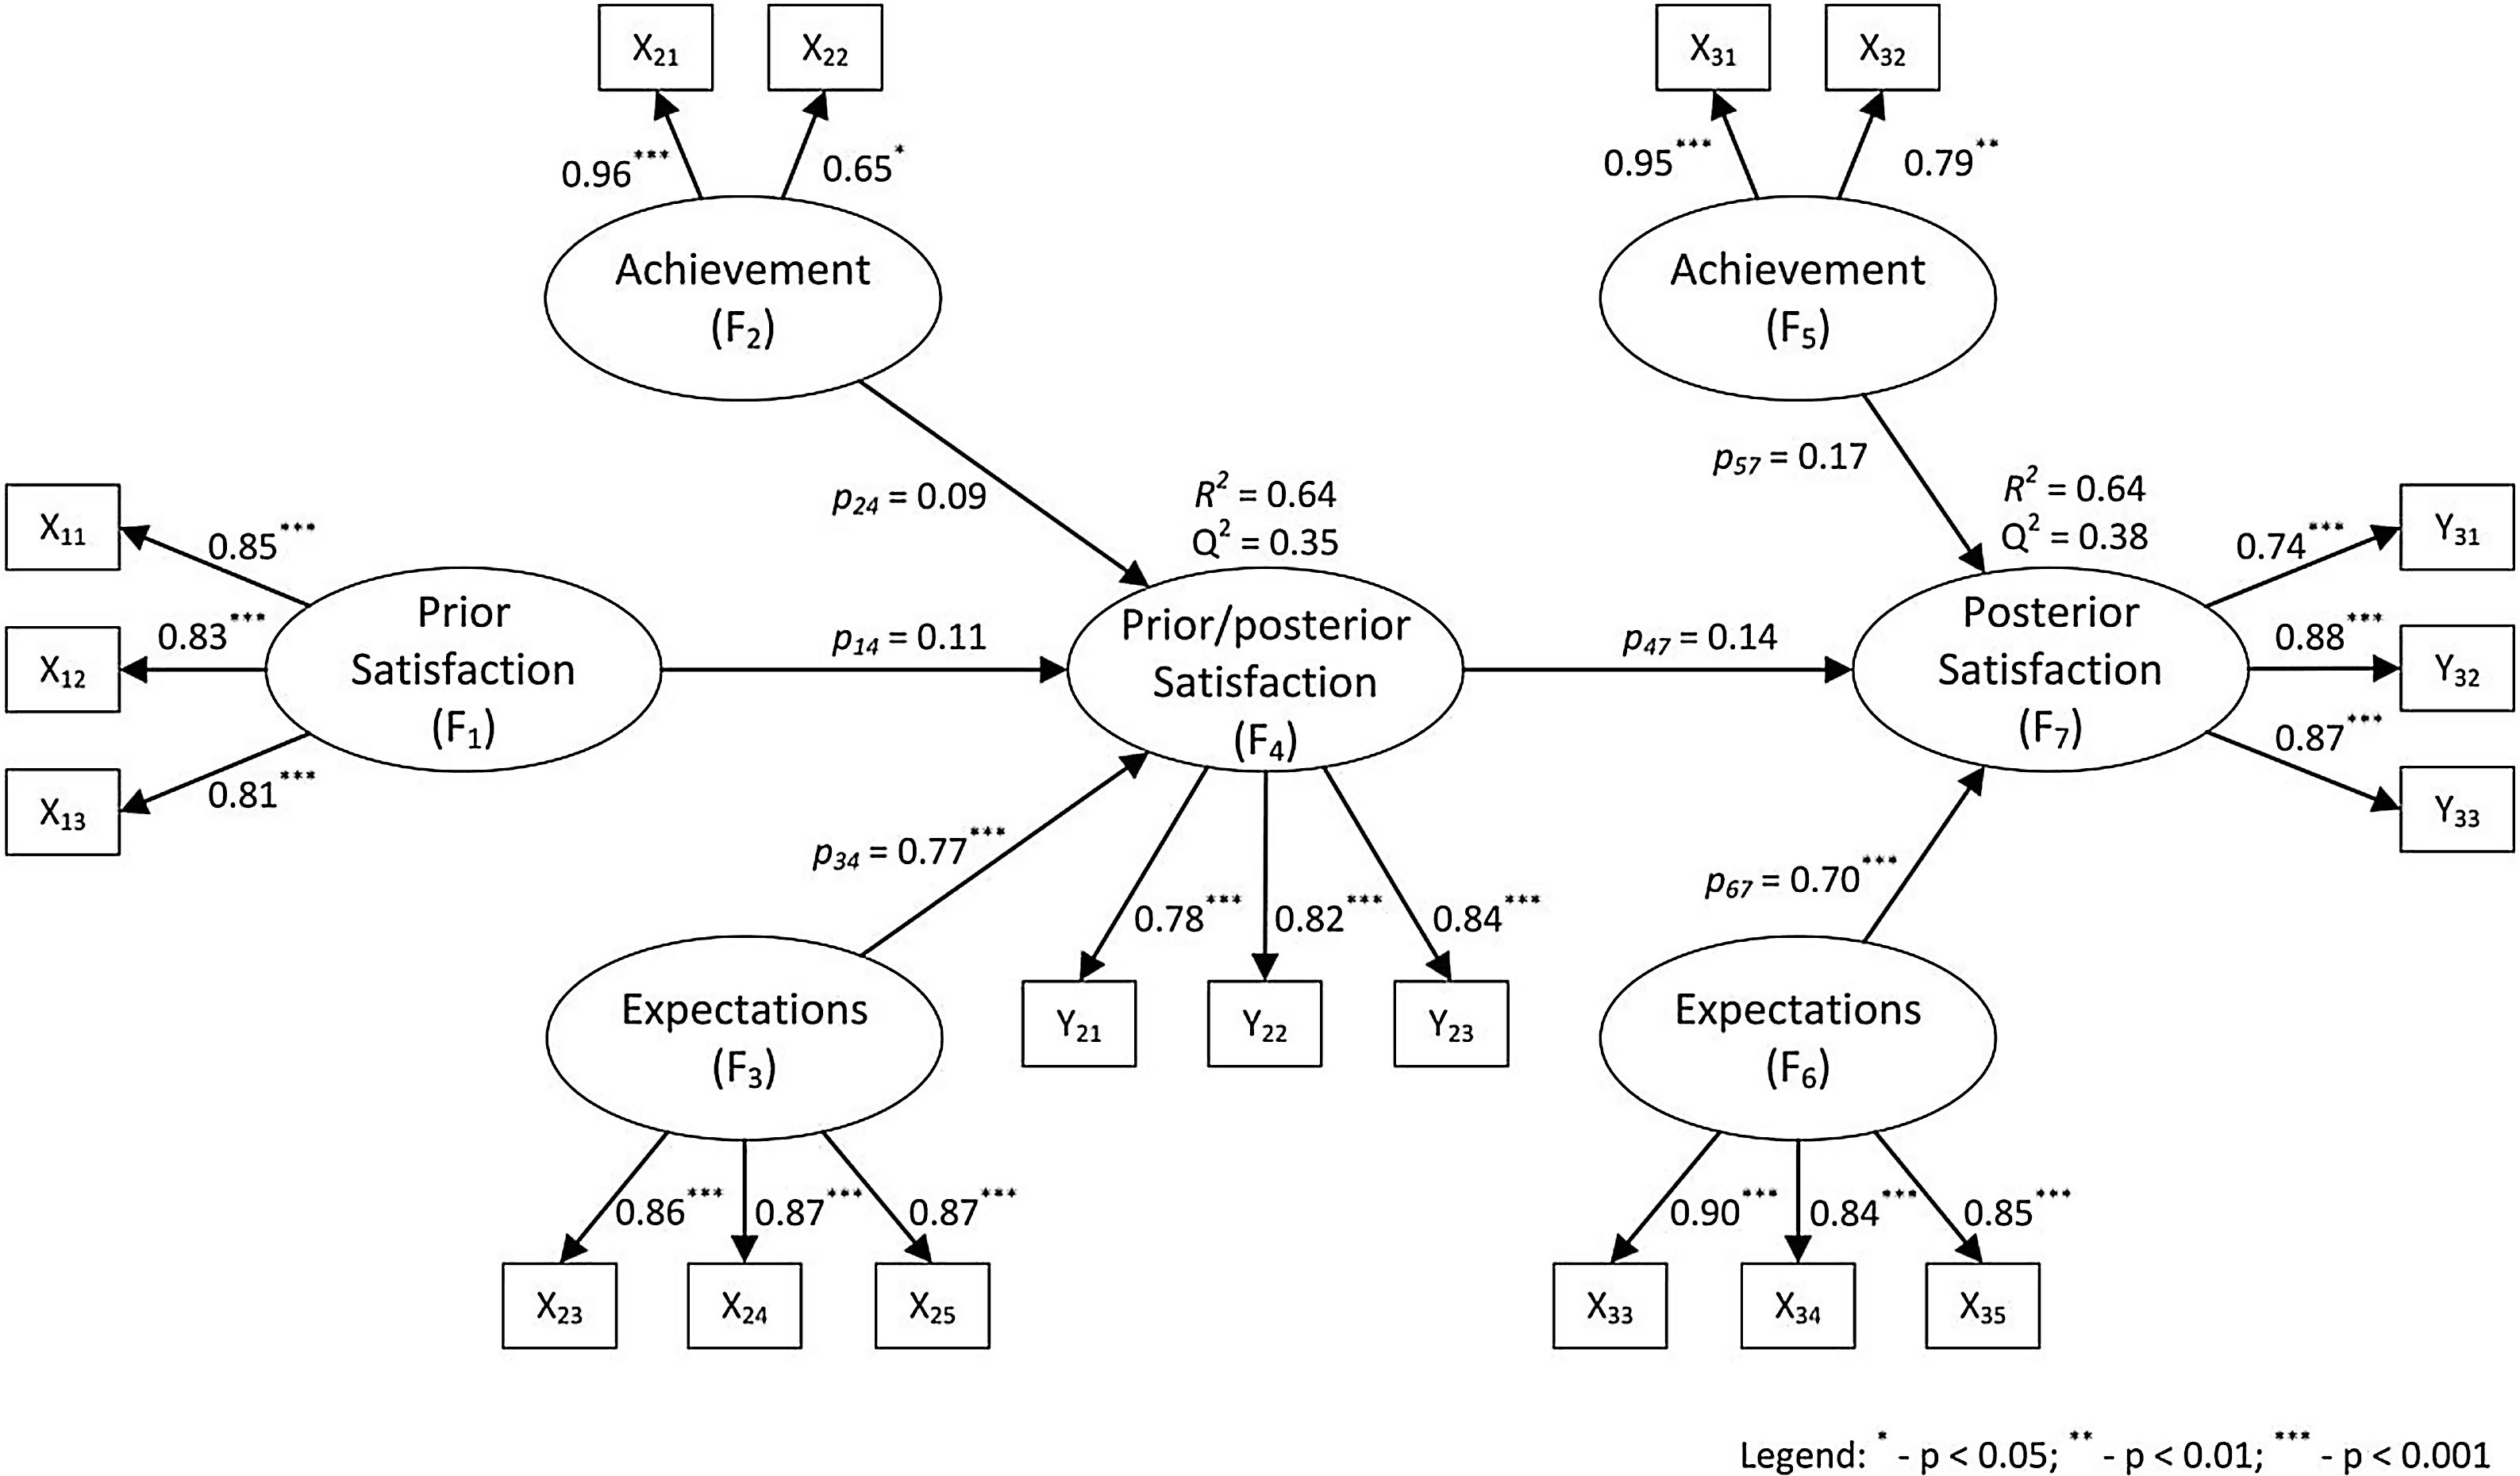
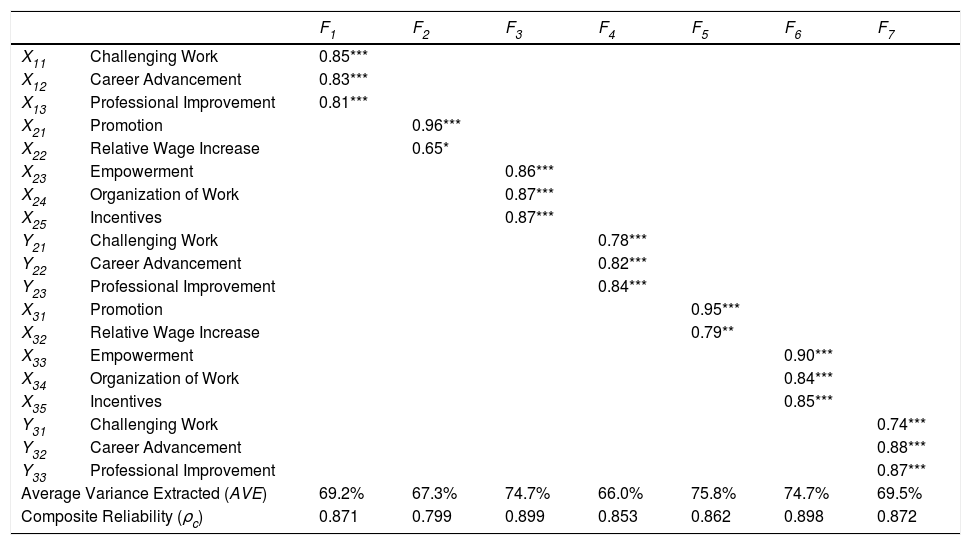
3.2.2Measurement modelThe hypothesized path model is shown in Fig. 2. A set of three tests – model reliability, convergent validity, and discriminant validity, was used to evaluate the measurement model. Table 2 displays standardized outer loadings for the measurement model, where it can be seen that all indicators are of the expected direction and are statistically significant (p < 0.05). Furthermore, all but one outer loading are greater than the desired value of 0.7 (outer loading for indicator X22 is 0.65). These findings provide for the indicators’ reliability.

Standardized factor loadings, average variance extracted, reliability estimates.
| F1 | F2 | F3 | F4 | F5 | F6 | F7 | ||
|---|---|---|---|---|---|---|---|---|
| X11 | Challenging Work | 0.85*** | ||||||
| X12 | Career Advancement | 0.83*** | ||||||
| X13 | Professional Improvement | 0.81*** | ||||||
| X21 | Promotion | 0.96*** | ||||||
| X22 | Relative Wage Increase | 0.65* | ||||||
| X23 | Empowerment | 0.86*** | ||||||
| X24 | Organization of Work | 0.87*** | ||||||
| X25 | Incentives | 0.87*** | ||||||
| Y21 | Challenging Work | 0.78*** | ||||||
| Y22 | Career Advancement | 0.82*** | ||||||
| Y23 | Professional Improvement | 0.84*** | ||||||
| X31 | Promotion | 0.95*** | ||||||
| X32 | Relative Wage Increase | 0.79** | ||||||
| X33 | Empowerment | 0.90*** | ||||||
| X34 | Organization of Work | 0.84*** | ||||||
| X35 | Incentives | 0.85*** | ||||||
| Y31 | Challenging Work | 0.74*** | ||||||
| Y32 | Career Advancement | 0.88*** | ||||||
| Y33 | Professional Improvement | 0.87*** | ||||||
| Average Variance Extracted (AVE) | 69.2% | 67.3% | 74.7% | 66.0% | 75.8% | 74.7% | 69.5% | |
| Composite Reliability (ρc) | 0.871 | 0.799 | 0.899 | 0.853 | 0.862 | 0.898 | 0.872 | |
* - significant at 0.05; ** - significant at 0.01; *** - significant at 0.001.
The obtained values for the average variance extracted (AVE) are all above the threshold value of 0.5 (Table 2), which, along with the previous findings about indicators reliability, implies that the convergent validity for the model was met.
The internal consistency reliability of the model is evaluated using composite reliability (ρc), whose values for all constructs are above the cut-off value of 0.7 (Table 2). Such an outcome means that indicators of each construct reliably measure that same construct.
Finally, all AVE estimates for the model’s constructs are greater than the squared inter-construct correlations, which, in accordance with the Fornell-Larcker criterion, indicates that there are no problems with discriminant validity.
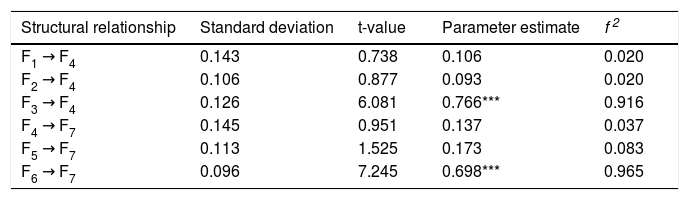
3.2.3Structural modelThe first step in the structural model testing procedure is the assessment of coefficients of determination (R2 values) of endogenous constructs. R2 values of the corresponding factors are displayed in Fig. 2. In accordance with general guidelines (Hair et al., 2017), R2 value of both the construct F4 (R2F4 = 0.643; adjusted R2F4 = 0.615) and the construct F7 (R2F7 = 0.642; adjusted R2F7 = 0.613) can be considered as moderate. Along with the coefficient of determination, the effect size (f2) of all exogenous constructs was calculated. Based on the threshold values proposed by Cohen (1988), the effect sizes that constructs F1 and F2 have on construct F4 are small. The same goes for the effect sizes that constructs F4 and F5 have on construct F7. At the same time, the effect sizes of constructs F3 and F4 on constructs F6 and F7, respectively, are large (Table 3).
Structural path estimates.
| Structural relationship | Standard deviation | t-value | Parameter estimate | f 2 |
|---|---|---|---|---|
| F1 → F4 | 0.143 | 0.738 | 0.106 | 0.020 |
| F2 → F4 | 0.106 | 0.877 | 0.093 | 0.020 |
| F3 → F4 | 0.126 | 6.081 | 0.766*** | 0.916 |
| F4 → F7 | 0.145 | 0.951 | 0.137 | 0.037 |
| F5 → F7 | 0.113 | 1.525 | 0.173 | 0.083 |
| F6 → F7 | 0.096 | 7.245 | 0.698*** | 0.965 |
*** - significant at 0.001.
The last step in structural model assessment is the examination of structural path estimates (Table 3). It could be seen that only two structural path estimates, those between the constructs F3 and F4, and between the constructs F6 and F7, are statistically significant and in the predicted direction. All other structural paths are statistically insignificant (p > 0.05).
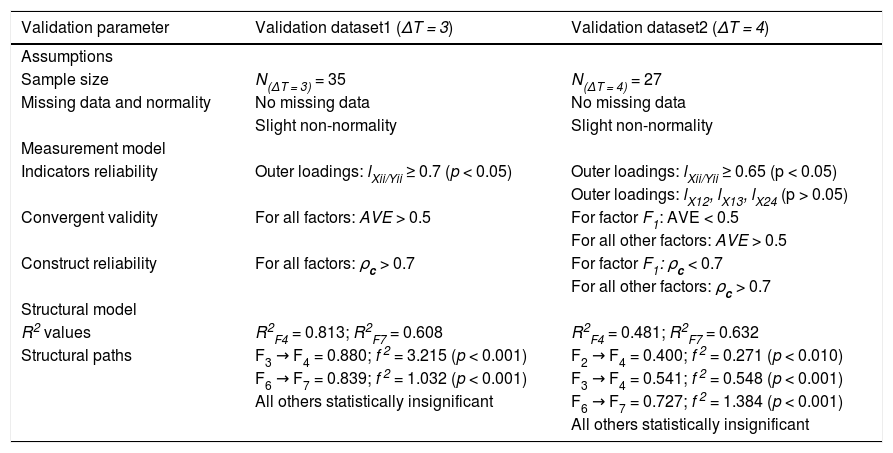
3.2.4Model validationThe proposed theoretical model has been tested with two additional datasets that correspond to two different lengths of periods TP1 and TP2. These lengths were set to four (ΔT = 3 years) and five years (ΔT = 4 years). The results of the validation procedure for both datasets are given in Table 4. As can be seen from Table 4, the results obtained using the first validation dataset (ΔT = 3 years) are almost identical to the results obtained by the main dataset. These results indicate measurement invariance, as well as invariance for factor loadings and structural path estimates, which fully validate the proposed theoretical model. On the other side, model testing using the second validation dataset (ΔT = 4 years) did not provide such support either for the measurement model or the structural model (Table 4). The testing results obtained using this dataset, however, cannot be treated as reliable since the sample size of 27 observations is below the minimum of 30 observations dictated by the “10 times rule”. Hence, having almost the same testing results from two datasets (ΔT = 2 and ΔT = 3), it can be considered that the proposed theoretical model is valid.
Validation results for two additional datasets – ΔT = 3 years, and ΔT = 4 years.
| Validation parameter | Validation dataset1 (ΔT = 3) | Validation dataset2 (ΔT = 4) |
|---|---|---|
| Assumptions | ||
| Sample size | N(ΔT = 3) = 35 | N(ΔT = 4) = 27 |
| Missing data and normality | No missing data | No missing data |
| Slight non-normality | Slight non-normality | |
| Measurement model | ||
| Indicators reliability | Outer loadings: lXii/Yii ≥ 0.7 (p < 0.05) | Outer loadings: lXii/Yii ≥ 0.65 (p < 0.05) |
| Outer loadings: lX12, lX13, lX24 (p > 0.05) | ||
| Convergent validity | For all factors: AVE > 0.5 | For factor F1: AVE < 0.5 |
| For all other factors: AVE > 0.5 | ||
| Construct reliability | For all factors: ρc > 0.7 | For factor F1: ρc < 0.7 |
| For all other factors: ρc > 0.7 | ||
| Structural model | ||
| R2 values | R2F4 = 0.813; R2F7 = 0.608 | R2F4 = 0.481; R2F7 = 0.632 |
| Structural paths | F3 → F4 = 0.880; f 2 = 3.215 (p < 0.001) | F2 → F4 = 0.400; f 2 = 0.271 (p < 0.010) |
| F6 → F7 = 0.839; f 2 = 1.032 (p < 0.001) | F3 → F4 = 0.541; f 2 = 0.548 (p < 0.001) | |
| All others statistically insignificant | F6 → F7 = 0.727; f 2 = 1.384 (p < 0.001) | |
| All others statistically insignificant | ||
Since all assumptions for PLS-SEM were satisfied, and the proposed theoretical model was further validated using a separate dataset, the results from the conducted analysis can be considered as reliable. Therefore, a few insights about intrinsic factors that underlie the perceived employees’ job satisfaction may be inferred and, consequently, some more profound understanding of the job satisfaction phenomenon. Of course, all of that considering the modulating social, economic, and technological conditions of Bosnia and Herzegovina.
The results obtained by testing the measurement model (Table 2) indicate an excellent fit between the theoretical model and reality represented by the data. The measurement validity and reliability of the proposed constructs were assessed using several model metrics, where all evaluation criteria were met.
For the structural model testing, all model evaluation criteria were also met, which has enabled a reliable structural path analysis and, consequently, testing of the proposed hypotheses. The values of coefficients of determination for the endogenous constructs F4 and F7 (R2F4 = 0.643, and R2F7 = 0.642), along with the corresponding predictive relevance indicators, whose values are above zero (Q 2F4 = 0.350, and Q 2F7 = 0.384), and large effect size (f 2F4 = 0.916, and f 2F7 = 0.965), implies rather high predictive (and explanatory) power of the proposed model (Hair et al., 2017).
The results of the structural path evaluations (Table 3) show that the structural path estimations between constructs F3 and F4, as well as between constructs F6 and F7, are both statistically significant and in the expected direction. In contrast, all other structural paths are statistically insignificant. Such an outcome points out that the model does not support the hypotheses H1 and H3 for both periods, while it fully supports hypothesis H2 for both periods, too. In particular, the extent to which employees’ expectations about the job are met is a strong predictor of their job satisfaction. At the same time, the actual employees’ job achievement is not a significant predictor of their job satisfaction. The same goes for prior job satisfaction, which is also not a significant predictor of posterior job satisfaction.
The obtained research results unambiguously suggest that, when the extrinsic factors are the same for all parties, employees’ job expectations are just the one particular intrinsic factor that decides whether or not they are satisfied with their job. Although there are some differences regarding the interpretation of extant literature on the met expectations hypothesis (Irving & Montes, 2009), this research finding is consistent with its most common interpretation (Wanous, Poland, Premack, & Davis, 1992). Therefore, given the specific metric of the “Expectations” construct, further insight regarding the organizational practices may be drawn from this research finding. Empowering employees, not only regarding the technical aspect of their work (which is probably taken for granted by most of them) but also regarding the organizational and business issues, is the managerial “way to go” to increase the employees’ job satisfaction.
Another interesting research result is that the actual employees’ career progress (job performance) has no significant impact on job satisfaction. Such an unusual finding may, to a certain degree, be explained by the proposition that an individual’s dispositions influence her/his perceived job satisfaction, or, in other words, the expectations for job performance has a stronger influence on job satisfaction than the actual job performance (Walker, 2016). In light of the foregoing reasoning, this research finding, combined with the previously elaborated one, further reinforces the model’s support for the second research hypothesis.
Finally, a particularly important research finding is related to the durability of the employees’ job satisfaction. Namely, to analyze this aspect of the job satisfaction concept, the direct and positive time relationship between the prior and later job satisfaction was embedded within the proposed theoretical model and further augmented by the research design. The obtained research results consistently point out that previous job satisfaction does not predict later job satisfaction. Even though somewhat unexpected, this finding is congruent with the most recent research literature on the topic, where even a negative relationship between the employees’ tenure and job satisfaction over time was assumed (Riza et al., 2018). Undoubtedly, such an outcome tells us that job satisfaction depends only on present job-related circumstances, at least in the short-run.
3.3.1Limitations of the researchThere are several limitations, both design and technical, that apply to this research. To start with design limitations, the study is focused on only the intrinsic motivational factors. At the same time, it was assumed that extrinsic motivational factors are constant and the same for all participants (which is tenable, considering the data sample’s nature). Besides, to keep the design simple and comprehensible, a limited set of indicators was used. Consequently, a smaller portion of endogenous constructs’ variance was explained, which lowers the model’s prediction power and explanatory value. Therefore, one of the recommendations for future research would be to seek out new indicators and, possibly, entire factors in order to improve the model’s predictive capability.
From a technical point of view, the data used in this study come from one company only, which runs its business in a country with a very peculiar economic and political setting. Therefore, the obtained results may be specific to that particular context and, thus, could not be generalized to the broader population. In addition, the sizes of both samples, the original and validating, are just adequate for this research design, and they do not provide for revealing significant small effects in the underlying population. Future studies may remedy the above described technical limitations by applying this (or similar) research design to other IT companies or, better, to a completely different context.
4ConclusionGiven that a high level of job satisfaction arguably has a number of positive outcomes for both the business and non-business organizations, creating and maintaining a favorable and desirable working environment is of utmost importance. Aligning with a large cohort of researchers who consider job satisfaction as an important concept for the creation and exploitation of knowledge in the field of social science, this study has primarily addressed the issue of durability of employees’ job satisfaction. Besides, the study has aimed to explore those intrinsic factors that have a significant impact on employees’ job satisfaction. Accordingly, an appropriate research model was proposed and tested using longitudinal data from an IT company from the Federation of Bosnia and Herzegovina (F BiH).
The study provides some deeper insight into the organizational behavior and talent management within a highly attractive IT industry under the conditions of a weak economy and immature labor market of the F BiH. The main implication of the study, both theoretical and practical, are described below.
4.1Theoretical implicationsNothing lasts forever. The most important (and very interesting) study finding is that previous employees’ job satisfaction has no impact on their current job satisfaction, at least not in a statistically significant manner. The utilized research design has provided a rigorous test of interaction between previous and future job satisfaction levels through three consecutive points in time. Unlike some extant research findings, this study’s results have shown that a previous high level of job satisfaction will not hurt (e.g., Riza et al., 2018), but also will not increase the later job satisfaction (e.g., Gerhart, 1987). Such an outcome leads to the conclusion that satisfaction with one’s job is a rather volatile state of mind. Apparently, the present level of job satisfaction does not last long and cannot be used as a sound predictor of future satisfaction level. The study results undoubtedly show that more recent events have a decisive impact on the actual job satisfaction level.
Satisfaction cannot be bought. The previous line of reasoning can also explain another important study finding, which, counter to the extant literature (Kosteas, 2011; Smith, 2015), shows that the actual employees’ career progress, measured by pay growth and promotion, has no significant impact on employees’ job satisfaction. Namely, model indicators measure career advancement through the whole measurement period and not only the most recent changes, but, according to the previous finding, events that are more distant in time have a small and statistically insignificant impact on the present level of job satisfaction. This finding is in full congruence with extant literature that shows that financial and akin material compensations cannot ensure job satisfaction (e.g., Prockl et al., 2017), or, more specifically, they are necessary but not sufficient for ensuring employees’ job satisfaction (Robbins & Judge, 2017).
Met expectations matter the most. The obtained research results show that empowering and engaging (knowledge) workers within a suitably structured organization fulfills their job expectations, which in turn leads to higher job satisfaction. Namely, when employees’ job expectations are met, their job satisfaction is increased, which is highly congruent with the met expectations hypothesis (Porter & Steers, 1973) and numerous subsequent studies on the same topic (e.g., Irving & Montes, 2009; Wanous et al., 1992). Moreover, when the extrinsic factors are invariant, fulfilling the employees’ expectations is the most influential intrinsic factor of their job satisfaction. It is important to emphasize the short-term nature of this factor (namely, it reflects the most recent workers’ perception of job expectations), which reinforces the assertion about job satisfaction transience.
Intrinsic factors only. The main premise of this research was to use only intrinsic (especially non-financial) indicators. Based on that premise, an appropriate theoretical model with corresponding constructs and individual indicator items was designed, along with necessary measurement scales. Under the stated premise (i.e., intrinsic elements only) and supposed conditions (i.e., having the invariant extrinsic factors), the model proved very robust. Thus, the model, or some suitable variant of it, can be used in future research works as a reliable tool for measuring employees’ job satisfaction by using only intrinsic factors and indicators.
4.2Practical implicationsThere are but few managers who do not know about Herzberg’s two-factor theory suggestions and directions. Namely, the extrinsic rewards (financial and material rewards and incentives) will not motivate the employees in the long-run. To create and keep really motivated and satisfied employees, managers must provide them with proper intrinsic rewards – challenging, stimulating, and interesting work, as well as an opportunity for personal growth (Herzberg, 2003). The obtained research results directly support such an assertion, which is particularly important considering the research context’s specificity – quite unstable and immature market conditions of BiH. The study outcomes confirm that HR managers may (and should) rely on the best practices and insights about talent management from highly developed business environments, regardless of the economic conditions under which their organizations operate. Specifically, to attract and retain the most wanted talents, HR departments and managers, in general, have to ensure that employees’ job expectations are continuously fulfilled, thus providing the necessary intrinsic rewards that would lead to higher levels of job satisfaction and, likely, lower attrition.
The high predicting power of the proposed model (i.e., R2F4 = 0.643, and R2F7 = 0.642) highlights that the most recent job attitudes are the most important regarding job satisfaction. Managers should not look at a present (high) level of job satisfaction as a determinant of its future (high) level. They should instead seek to anticipate and, subsequently, fulfill the employees’ job expectations. To prevent a decline in job satisfaction levels, managers need to look for novel ways of employee empowerment and engagement proactively. For example, managers can include employees early in the decision-making process, provide for members rotation between different teams, and cultivate the culture of the self-organizing teams (Hamel, 2012). In addition, to provide for employees personal growth, managers can organize different forms of educational tracks (internal and external training, paid formal education, job reallocation and rotation, sabbaticals) and establish and maintain a mentorship system that will engage both long-term employees and newcomers.
Holistically looking at the study findings, it can be inferred that organizations should not rely much on present employees’ work contentment or the current awareness about the organizational recognition of their performance. Instead, organizations should concentrate on making and maintaining a creative and challenging working environment that enables professional actualization and continual advancement of the employees. When all extrinsic motivators were equally provided for everyone, as is the case in the IT industry in BiH, only empowered, well-organized, and self-actualized workers will be fully satisfied with their job. In turn, organizations will benefit from increased productivity, decreased employee fluctuation, and, most importantly, ever-creative engagement of self-motivated workers.
