


Faced with increasingly severe environmental challenges and the rapid development of digital technologies, enterprises’ green innovation and digitalization strategies have attracted much attention. However, research that links green innovation with enterprise digitalization and explores the internal mechanism of this link is still scant. Therefore, based on the dynamic capability theory and capability hierarchy, this study develops and examines a conceptual model that describes the digitalization–green innovation relationship. Using data covering 1,166 listed manufacturing firms in China during 2008–2019, we apply the ordinary least squares method to verify that enterprise digitalization can positively affect green innovation, and absorptive capacity mediates this relationship. Moreover, we find that green credit strengthens the positive relationship between absorptive capacity and green innovation. Based on these findings, this study provides valuable theoretical reference and practical enlightenment for promoting green innovation more effectively.
With rapid economic growth, environmental issues, such as natural resource shortages and excessive carbon emissions, have gradually become prominent. To address these challenges, enterprises are encouraged to pursue green innovation to shoulder their social responsibilities (Eweje & Sakaki, 2015). As a type of innovation, green innovation with the effect of saving resources and reducing environmental pollution, helps enterprises to balance profitability and environmental responsibility (Lian et al., 2022; Xie et al., 2022). Accordingly, green innovation has become an indispensable strategy for enterprises to achieve sustainable development while also responding to environmental protection requirements (Shahzad et al., 2022). How to promote green innovation has become an urgent problem.
In practice, digitalization is gradually becoming an important force for enterprises to develop green innovation. For instance, as one of the world's leading household appliance enterprises, Haier innovatively applies digital technologies to achieve energy-saving products and real-time monitoring of industrial waste emissions.1 However, in the theoretical field, scholars have not yet reached insightful conclusions on whether digitalization plays a significant role in promoting green innovation. Some scholars hold that digitalization can provide support for green innovation (El-Kassar & Singh, 2019; Isensee et al., 2020; Wei & Sun, 2021), whereas others argue that digitalization will compete for scarce organizational resources and hinder green innovation (Ardito et al., 2021). The relationship between enterprise digitalization and green innovation remains controversial. Moreover, although the role of digitalization in green innovation has been explored, the underlying mechanism has not been thoroughly analysed with adequate empirical evidence (El-Kassar & Singh, 2019; Wei & Sun, 2021). Therefore, we introduced digitalization to explore its effect and mechanism on green innovation.
Meanwhile, with the introduction of digital technologies, the ways of interacting with the external environment and working in organizations have profoundly changed (Martínez-Caro et al., 2020). For example, digital platforms enable the sharing and use of common knowledge within and across enterprises (Cenamor et al., 2019). In this process, enterprises’ absorptive capacity may be enhanced owing to the broadening of knowledge exchange channels. Absorptive capacity represents an enterprise's capability to identify, absorb, and exploit external knowledge (Cohen & Levinthal, 1990). It is widely considered as an essential capability of enterprises to foster green innovation (Aboelmaged & Hashem, 2019; Zhang et al., 2021). Therefore, we introduced absorptive capacity to explore the influence mechanism between digitalization and green innovation.
However, compared with other types of innovation, enterprises may be less motivated to use absorptive capacity for green innovation because of high investment and multiple uncertainties. Green credit brings environmental protection factors into the framework of bank loan management (He et al., 2019), which may guide enterprises to use absorptive capacity for green innovation. Consequently, we examined the moderating role of green credit in the relationship between absorptive capacity and green innovation.
The unique contributions of this study are as follows: First, it extends the research in the field of green innovation, and provides empirical evidence that digitalization plays a supporting role in achieving green innovation. Second, the mediation mechanism of absorptive capacity between digitalization and green innovation is established and analysed. This provides more detailed empirical insights into the dynamic capability theory and capability hierarchy. Finally, this study expands the boundary conditions of the absorptive capacity–green innovation relationship and offers a more comprehensive understanding of green credit.
Theoretical background and hypothesis developmentUnder environmental protection pressure, green innovation is a crucial approach for enterprises to obtain competitive advantages (Song & Yu, 2018). It is defined as the improvement of processes or products for the purpose of energy-saving, waste recycling, pollution control, and environmental management (Chen et al., 2006) and consists of two dimensions: green process innovation and green product innovation (Song & Yu, 2018; Aboelmaged & Hashem, 2019). Green process innovation represents the improvement and development of manufacturing processes (El-Kassar & Singh, 2019), and green product innovation represents the environmentally friendly design of products (Chan et al., 2016). In general, green innovation represents innovative activities based on the principle of environmentally friendly and sustainable development. Scholars usually use the number of green patents that directly reflect these innovation outputs to measure green innovation (Wurlod & Noailly, 2018; Lian et al., 2022; Zhu & Tan, 2022).
According to the dynamic capability theory, abilities represent an essential precondition for enterprises to obtain sustainable competitive advantages (Teece, 2007; Heredia et al., 2022). Following this logic, enterprises must cultivate certain technical capabilities to obtain the benefits of green innovation (Tsai & Liao, 2017; Wu et al., 2020). Wu et al. (2020) proposed that enterprises with high technological capabilities are more likely to solve complex technical problems in green innovation. In this regard, digitalization, as the embodiment of technology capability (Heredia et al., 2022), emphasizes how enterprises use digital technologies to alter existing business processes, services, and products (Yoo et al., 2010; Denner et al., 2018; Ritter & Pedersen, 2020; Reima et al., 2022), which has been identified as an enabler in promoting environmental innovation in enterprises (Isensee et al., 2020).
Furthermore, from the perspective of the capability hierarchy, enterprises’ capabilities can be divided into lower-order capabilities and higher-order capabilities, and lower-order capabilities are the foundation of higher-order capabilities. In this respect, some scholars indicate that IT capability is a type of lower-order capability that is the basis for the formation of other higher-order capabilities in an enterprise (Liu et al., 2013). Digitalization, a very important IT-related capability of enterprises in the digital era, is regarded as a crucial driving force for developing higher-order capabilities (Li et al., 2022). Accordingly, absorptive capacity represents the higher-order ability for enterprises acquiring, assimilating, transforming, and exploiting new knowledge (Zahra & George, 2002; Liu et al., 2013), which is introduced into this research. Moreover, since absorptive capacity enables enterprises to better absorb external environmental knowledge, some studies identify it as an essential factor in developing green innovation (Aboelmaged & Hashem, 2019; Galbreath, 2019).
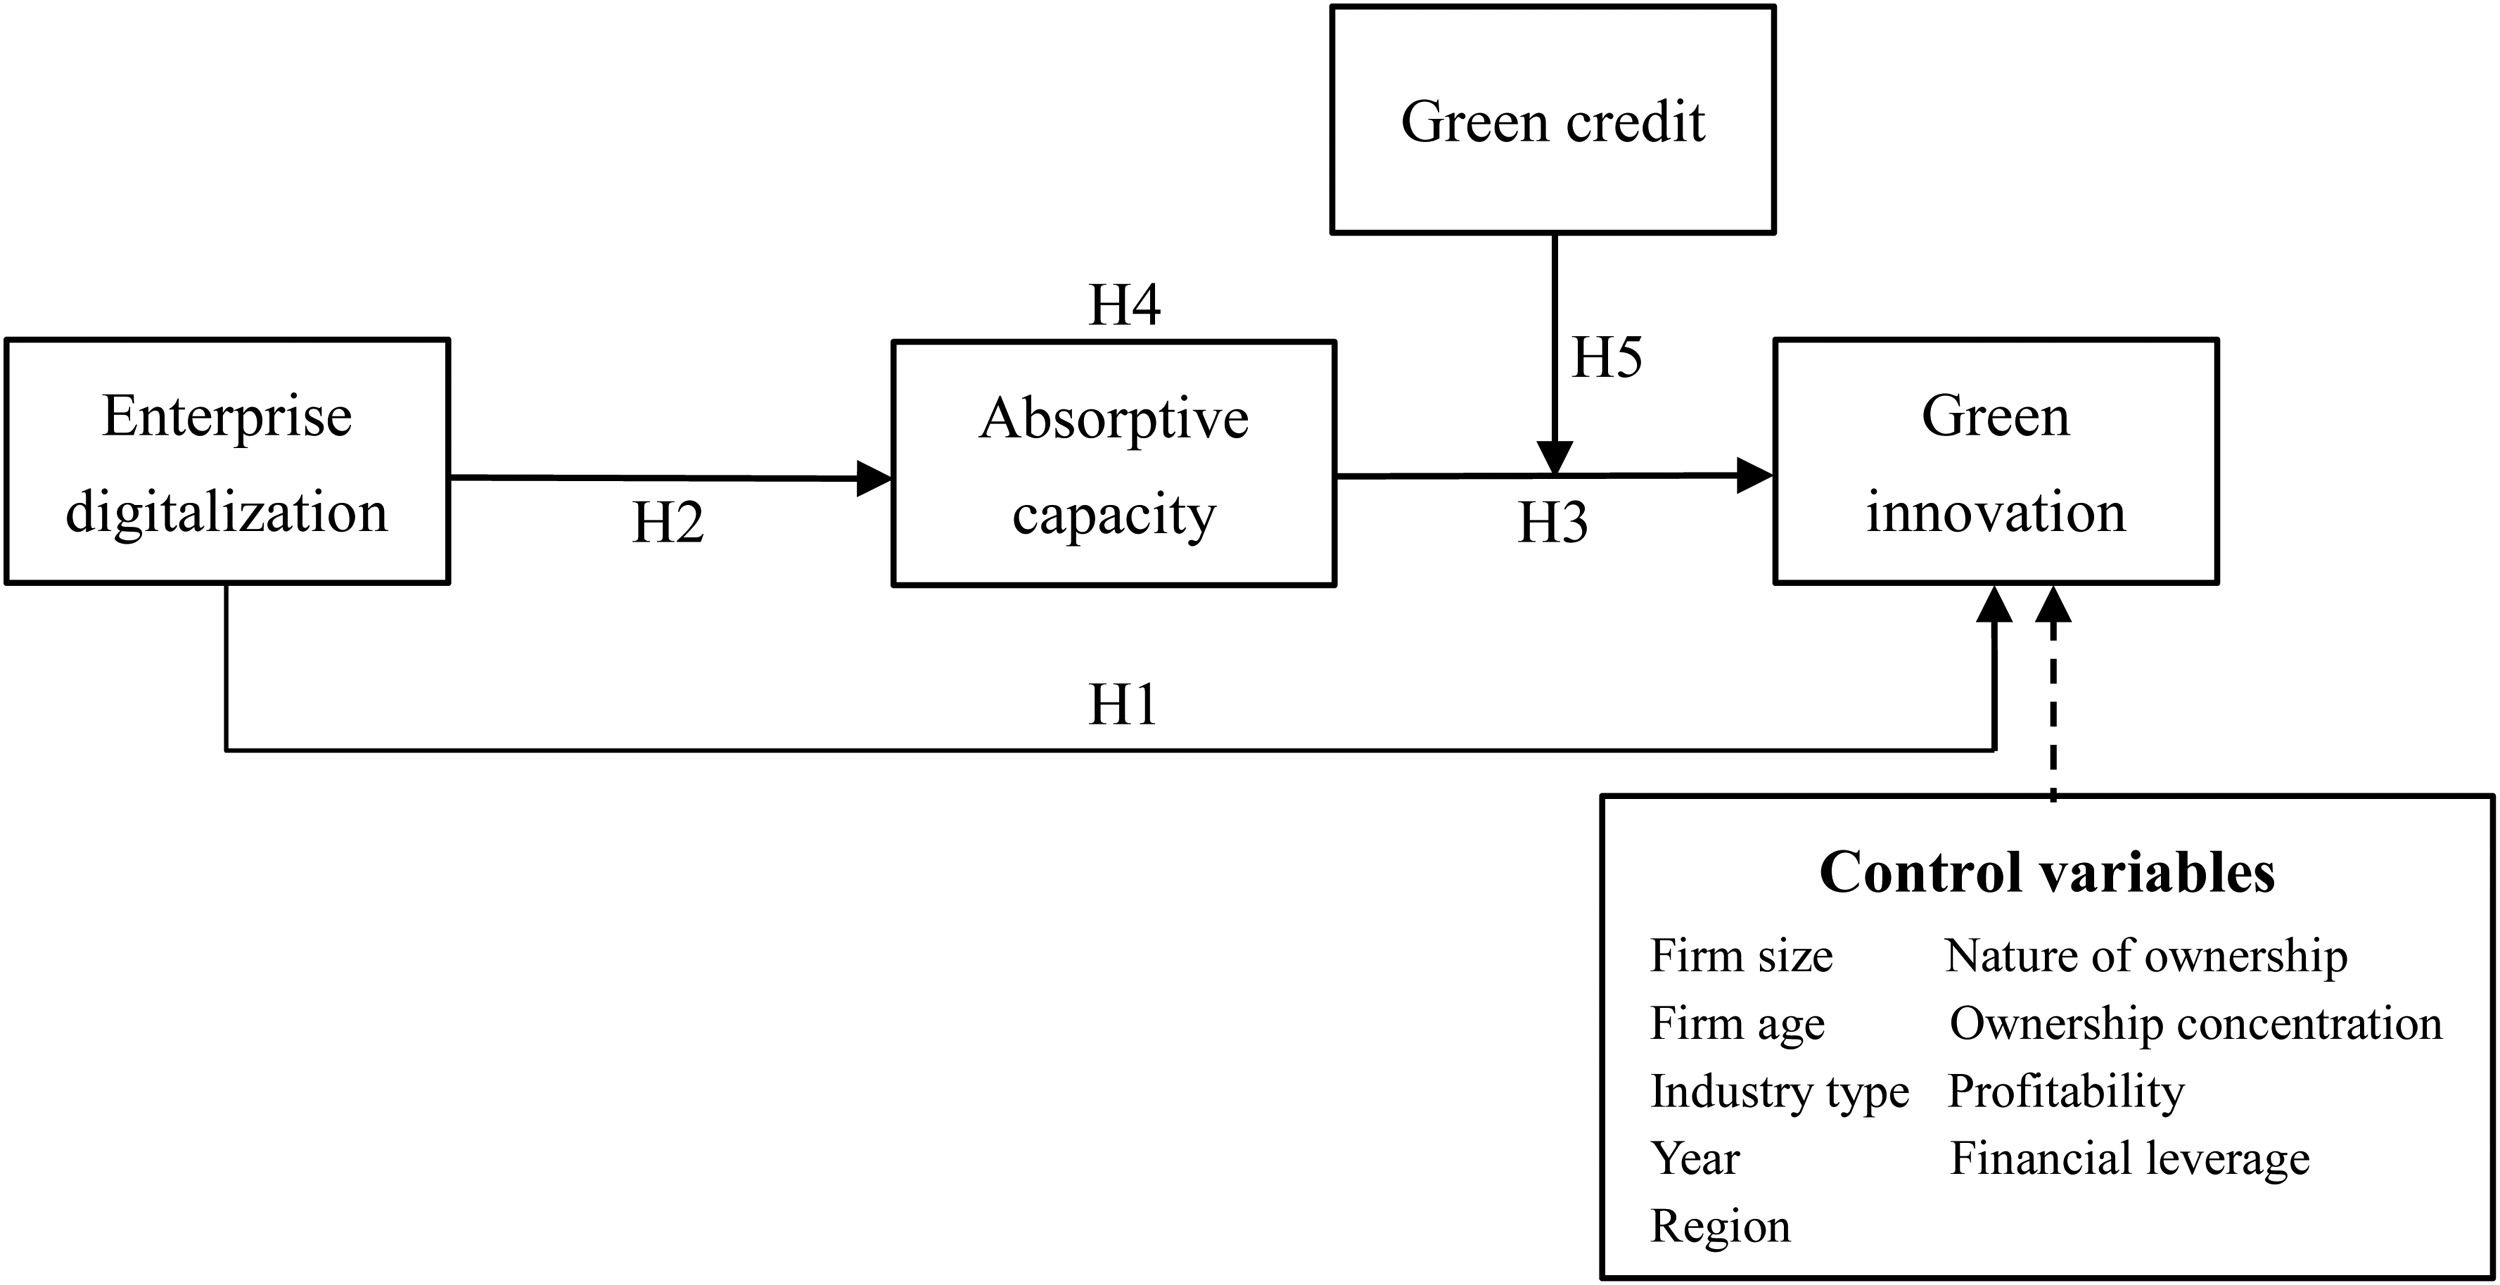
Although absorptive capacity is important for green innovation, understanding the boundary conditions for its connections is scant. According to the dynamic capability theory, dynamic capabilities play a more prominent role in dynamic environments and are more conducive to creating and maintaining competitive advantages for enterprises (Teece, 2007). As an external environmental element, the financing environment can significantly influence the enterprise capability–green innovation relationship (Ghisetti et al., 2016). Therefore, it is necessary to incorporate financing environment factors into the boundary conditions. In this regard, green credit, as differentiated credit issued by financial institutions based on enterprises’ environmental behaviours (Zhang et al., 2021), is one kind of an external financing environment for enterprises (He et al., 2019; Wang et al., 2020). Accordingly, it may influence enterprises’ intentions and force them to focus on transforming environmental knowledge into green innovation. Following this logic, we further introduce green credit to explore its moderating effect on the absorptive capacity–green innovation relationship. To summarise the theoretical analysis above, this study is based on the conceptual model shown in Fig. 1.
Enterprise digitalization and green innovation
Driven by digital technology, digitalization provides support for enterprises to implement green innovation (Li & Shen, 2021; Feng et al., 2022). Specifically, for green process innovation, grasping real-time data at each manufacturing stage is crucial for reducing environmental hazards (Wei & Sun, 2021). With digital technologies, enterprises can install embedded intelligent devices in machines and facilities to acquire and store real-time energy parameters during the production process (Tao et al., 2016; Trujillo-Gallego et al., 2022). By relying on these data, enterprises can understand energy consumption patterns and more accurately monitor energy waste in the production process (Shrouf & Miragliotta, 2015). Moreover, Gobbo et al. (2018) proposed that digital technologies can optimize information collection to better control environmental pollution.
To conduct green product innovation, enterprises must modify or change their product design (Chan et al., 2016; Albort-Morant et al., 2018). However, product design is a complex and iterative process (Tao et al., 2016) that may require a long cycle. To address this issue, digital technologies such as virtual experimentation and simulation can be used in product design. This can accelerate the R&D process for green products by enabling enterprises to explore multiple options, uncertainties, and sensitivities for new products (Farrington & Alizadeh, 2017). Moreover, digital technologies can support design-for-disassembly and elevate the possibility of enterprises turning end-of-life products back into usable ones through remanufacturing (Kerin & Pham, 2019). In summary, we propose the following hypothesis:
Enterprise digitalization positively affects green innovationEnterprise digitalization and absorptive capacityThrough digitalization, communication and knowledge flow boundaries are eliminated (Vial, 2019; Peng & Tao, 2022), facilitating enterprises to acquire, absorb, and apply external knowledge. Specifically, digital technologies radically change how enterprises interact with the external environment (Martínez-Caro et al., 2020; Peng & Tao, 2022). For instance, digital platforms bring suppliers, customers, and service providers together to coordinate economic activities. Through this process, opportunities for enterprises to interact and establish relationships with the external environment can be expanded (Cenamor et al., 2019). This will help enterprises acquire environmental knowledge (Naqshbandi & Jasimuddin, 2022).
Second, the efficiency of knowledge absorption can be improved through in-depth interactions with external knowledge sources (Ricci et al., 2021). Zahoor et al. (2021) further proposed that maintaining mutual trust is key for enterprises to achieve deep-knowledge interactions. Through digitalization, enterprises can establish mutual monitoring mechanisms to make relationships more transparent (Cenamor et al., 2019) and effectively improve mutual trust. In other words, digitalization can help enterprises better absorb new knowledge.
Finally, digital technology connectivity breaks the organizational barrier and enables knowledge transfer and reorganization across functional units (Liu et al., 2013). Meanwhile, digitalization promotes a consistent understanding of knowledge amongst organizations by allowing broader users to access common data and resources (Jiménez-Castillo & Sánchez-Pérez, 2013). In addition, for the exploitation of knowledge, digital technologies also enable organizations to organize, rearrange and process internal knowledge for creating new value through multiple ways (Martinez-Caro et al., 2020). In conclusion, we hold that digitalization can improve absorptive capacity, and propose the following hypothesis:
Enterprise digitalization positively affects absorptive capacityAbsorptive capacity and green innovationGreen innovation is a knowledge-intensive activity (Stojčić, 2021). Developing green innovation requires enterprises to master multifaceted knowledge, which often differs from their existing knowledge base (Albort-Morant et al., 2018). As enterprises may not possess the complete knowledge needed to develop green innovation, external knowledge plays a crucial role. In this context, absorptive capacity can help enterprises easily obtain external green knowledge such as environmental protection technology (Hashim et al., 2015).
Galbreath (2019) proposed that absorptive capacity is a learning mechanism for adapting to external knowledge. With absorptive capacity, enterprises can better integrate new knowledge with existing knowledge and apply integrated knowledge more effectively to improve production efficiency and reduce waste (Delmas et al., 2011; Galbreath, 2019; Zhou et al., 2021). Moreover, absorptive capacity ensures an adequate understanding of external knowledge within an organization (Zhou et al., 2021). Consequently, managers can better monitor product development to minimise adverse effects on the environment (Qu et al., 2022). Consequently, we propose the following hypothesis:
Absorptive capacity positively affects green innovation
Based on all the above hypotheses, this paper also proposes that:
Absorptive capacity mediates the enterprise digitalization–green innovation relationshipThe moderating effect of green creditGiven the high investment, market uncertainty, and long return period of green innovation (Wang & Jiang, 2021), enterprises that develop green innovation often face difficulties in obtaining financing (Irfan et al., 2022). Financial constraints would restrain enterprises' green innovation capabilities (Yu et al., 2021), while green credit can significantly resolve this dilemma. Specifically, green innovation brings challenges to enterprises such as increasing technological complexity and R&D costs (Berchicci, 2013; Wu et al., 2020). To alleviate these challenges, enterprises usually rely on absorptive capacity to obtain the knowledge needed for R&D or even directly purchase patents on green technology (Duong et al., 2022). However, such processes involve searching for and coordinating new collaborations, which require greater investment (Berchicci, 2013). Green credit provides financial support that enhance enterprises’ absorptive capacity to acquire green knowledge, thus accelerating green innovation.
In addition, many enterprises believe that developing green products and making operations sustainable will increase their costs, and thus put them in an inferior position compared to competitors (Cecere et al., 2014; Tsai & Liao, 2017). Therefore, they prefer traditional innovation rather than green innovation (Xie et al., 2019). This means that low willingness to participate due to high costs may reduce the conversion efficiency of absorptive capacity into green innovation. Green credit effectively reduces the capital cost of green innovation by providing a loan preference for environmental protection projects (Wang et al., 2022). This enhances enterprises’ motivation for green innovation, thus using absorptive capacity in green innovation. Moreover, green credit increases the opportunity cost and risk of enterprises’ negative environmental behaviour through credit access mechanism (Wang et al., 2022). This will make enterprises more willing to undertake compliance innovation to internalize these external costs (Romero-Castro et al., 2022), thus enhancing the use of absorptive capacity in green innovation. Consequently, we propose the following hypothesis:
Green credit positively moderates the absorptive capacity–green innovation relationship
MethodsSamples and dataOver the past two decades, China's environmental performance has improved significantly owing to the widespread use of ICT (Wen et al., 2021). It can be said that China has provided valuable practical experience for promoting eco-innovations in industries with digital technologies. Therefore, this study selected Chinese manufacturing firms listed on the Shanghai Stock Exchange and Shenzhen Stock Exchange as the research samples.
The sample data for green patents that measured green innovation originated from the China National Intellectual Property Administration (CNIPA). Digitalization data were obtained from the annual reports of listed manufacturing firms. Green credit data were collected from the China Industrial Statistics Yearbook. Other corporate data were sourced from the China Stock Exchange Market and Accounting Research Database (CSMAR).
In this study, the time window was set as 2008–2019. The year 2008 was selected as the start year because the Chinese government stepped up efforts to protect environment from this year (Wang & Jiang, 2021). Furthermore, considering the availability of data, the year 2019 was determined as the termination year.
Initially, 3, 087 manufacturing firms were identified, based on the industry classification of listed firms released by the China Securities Regulatory Commission. After eliminating firms with special treatment (ST) and those with serious data missing, a total of 11,427 observation samples were finally obtained from 1,166 listed manufacturing firms from 2008 to 2019. An interpolation method was applied for a small amount of missing data. In addition, to eliminate the influence of outliers, all continuous variables were winsorised on the 1% quantile.
Model settingsTo test the hypotheses, we constructed the following econometric models: Models (1) to (3) were constructed to examine the relationship between digitalization, green innovation, and absorptive capacity. Model (4) was constructed to examine the moderating effect of green credit. In these models, GI represents green innovation. ED represents enterprise digitalization. AC×GC denotes the interaction between absorptive capacity and green credit.2Controls represents the control variables. α is the coefficient, i stands for the firm, t is the year, and ε is the error term.
Following existing studies (Wang & Jiang, 2021; Ren et al., 2022; Zhu & Tan, 2022), this study adopts the widely used ordinary least squares (OLS) method to test the hypotheses.
MeasuresGreen innovation. According to previous studies, green patents reflect the achievements and development trends of green innovation; thus, they have been widely used to measure green innovation (Yu et al., 2021; Lian et al., 2022; Zhu & Tan, 2022). Accordingly, green innovation is measured by the number of firms’ green patent applications. Based on the "IPC Green List" developed by World Intellectual Property Organization, we screened the patent application information of sample firms on the website of CNIPA to identify green patents. CNIPA grants patents for inventions, utility models, and external designs. However, as Lian et al. (2022) proposed, green patents related to external design do not involve the requirements of green innovation. Accordingly, this research uses the number of green patent applications for inventions and utility models to measure green innovation. Furthermore, Chen et al. (2021) argued that green patent applications may only reflect enterprises’ emphasis on green technologies but cannot represent the development progress of technologies. In contrast, green patent grants can effectively reflect the degree of technological innovation because of their strict review process. Therefore, following Zhu and Tan (2022), the number of green patent grants was taken as an alternative measure of green innovation in the robustness test.
Enterprise digitalization. Chen et al. (2015) proposed that the higher the frequency of a certain type of keywords appearing in a firm's annual report, the more attention, and resources the firm devotes in this field. Therefore, we use text mining to construct digitalization measurement indicators based on the occurrence frequency of specific keywords in firms' annual reports. First, the Python crawler was used to download the annual reports of sample firms on the official websites of the Shanghai Stock Exchange and Shenzhen Stock Exchange. Then, the jieba function in Python was used to segment the firms’ annual reports. After word segmentation, 100 initial keywords were selected by the statistical frequency. Based on the relevant expressions in the digital-related literature (Vial, 2019; Skare & Riberio Soriano, 2021; Heredia et al., 2022) and discussions with field experts from universities and enterprises, the keywords were further refined and integrated, as shown in Table 1. Finally, Python was used to extract the frequency of digitalization keywords in the annual reports of sample firms from 2008 to 2019, and the natural logarithm of frequency was taken after adding 1 as the measurement indicator.
Keyword vocabulary.
Absorptive capacity. Absorptive capacity is often a by-product of an organization's R&D investment (Albornoz et, al.,2014; Xie et al., 2019). Previous studies regard R&D expenditure as a significant indicator of absorptive capacity because it can reflect the purchase of research materials and manpower in a firm (Volberda et al., 2010; Huang et al., 2015). Therefore, we used the ratio of R&D expenditures to operating revenues to measure absorptive capacity. This ratio is further multiplied by 100 to avoid the problem of the regression coefficient display.
Green credit. Thus far, most listed firms have not disclosed environmental information; thus, obtaining green credit data from each individual firm is difficult. Therefore, we use the green credit level of the province where the firm is located to reflect its green credit situation. Following Song et al. (2021), we measure the green credit of the provinces by dividing the interest expenses of six energy-intensive industries by the interest expenses of the industry. As this is a negative indicator, we multiply it by −1 to turn it into a positive indicator to facilitate the analysis.
Controls. We controlled for the following variables that may affect green innovation when testing the hypotheses: (1) Firm age (Age). Early-stage firms are often more innovative than mature ones (Duong et al., 2022). We control for firm age using the natural logarithm of firms’ listed years. (2) Firm size (Size). Large firms can invest more capabilities and resources in green innovation (Hashim et al., 2015). Following Lian et al. (2022), we control for firm size using the natural logarithm of total assets. (3) Nature of ownership (Soe). Wang and Jiang (2021) propose that state-owned firms face stricter environmental requirements than non-state-owned firms, which may affect their strategic choices. We controlled for the nature of ownership by setting a dummy variable. (4) Ownership concentration (Hold). As corporate governance can affect corporate financing and green innovation (Xing et al., 2021), we selected the governance characteristic indicator, ownership concentration, as a control variable (Peng & Tao, 2022). (5) Financial leverage (Lev). Firms’ environmental investment decisions may be affected by their capital structures (Wang & Jiang, 2021). Following Wang et al. (2020), we controlled for financial leverage by dividing total liabilities by total assets. (6) Profitability (Roa). Because firms with high profitability tend to participate in green practices, we control for profitability by dividing net income by total assets (Liu et al., 2021). (7) Industry Type (Ind). As polluting firms are susceptible to environmental regulation, we control for Industry Type by setting a dummy variable. Moreover, considering the effects of different years (Year) and regions (Reg), we control for them by setting dummy variables. The specific measurement methods for all variables in this study are listed in Table 2.
Variables and measurements.
Table 3 shows the descriptive statistics and correlation analysis results. The mean for GI is 0.33, indicating that the overall development of green innovation in the sample firms is poor. GI is significantly correlated with ED, AC and GC, and ED is significantly related to AC, which provides preliminary support for the hypotheses. Moreover, all correlation coefficients are less than 0.5, indicating that there is no serious multicollinearity problem.
Descriptive statistics and correlation analysis.
Note: *, **, and *** represent significance at the 10%, 5%, and 1% levels, respectively.
Table 4 reports the regression results of basic hypotheses. In Column (1), the results show that Size and Soe positively affect green innovation, while Age and Hold negatively affect green innovation, which is in consistent with the prior literatures (Hashim et al., 2015; Wang & Jiang, 2021; Duong et al., 2022; Peng & Tao, 2022). Column (2) adds ED to Column (1) to test its impact on GI. The results show that ED positively affects GI (α = 0.069, p < 0.01), thus H1 is supported. In Column (5), AC is taken as the dependant variable to test the impact of ED on it. The results show that ED positively affects AC (α = 0.408, p < 0.01), thus H2 is supported. Column (3) adds AC to Column (2) for testing the mediating effect of AC. The result shows that both ED (α = 0.055, p < 0.01) and AC (α = 0.035, p < 0.01) positively affects GI. This indicates that ED can indirectly promote GI through AC, thus H3 and H4 are supported.
Regression results.
Note: Numbers in parentheses are t-values. ***, **, * respectively represent p-values are less than 0.01, 0.05, 0.1.
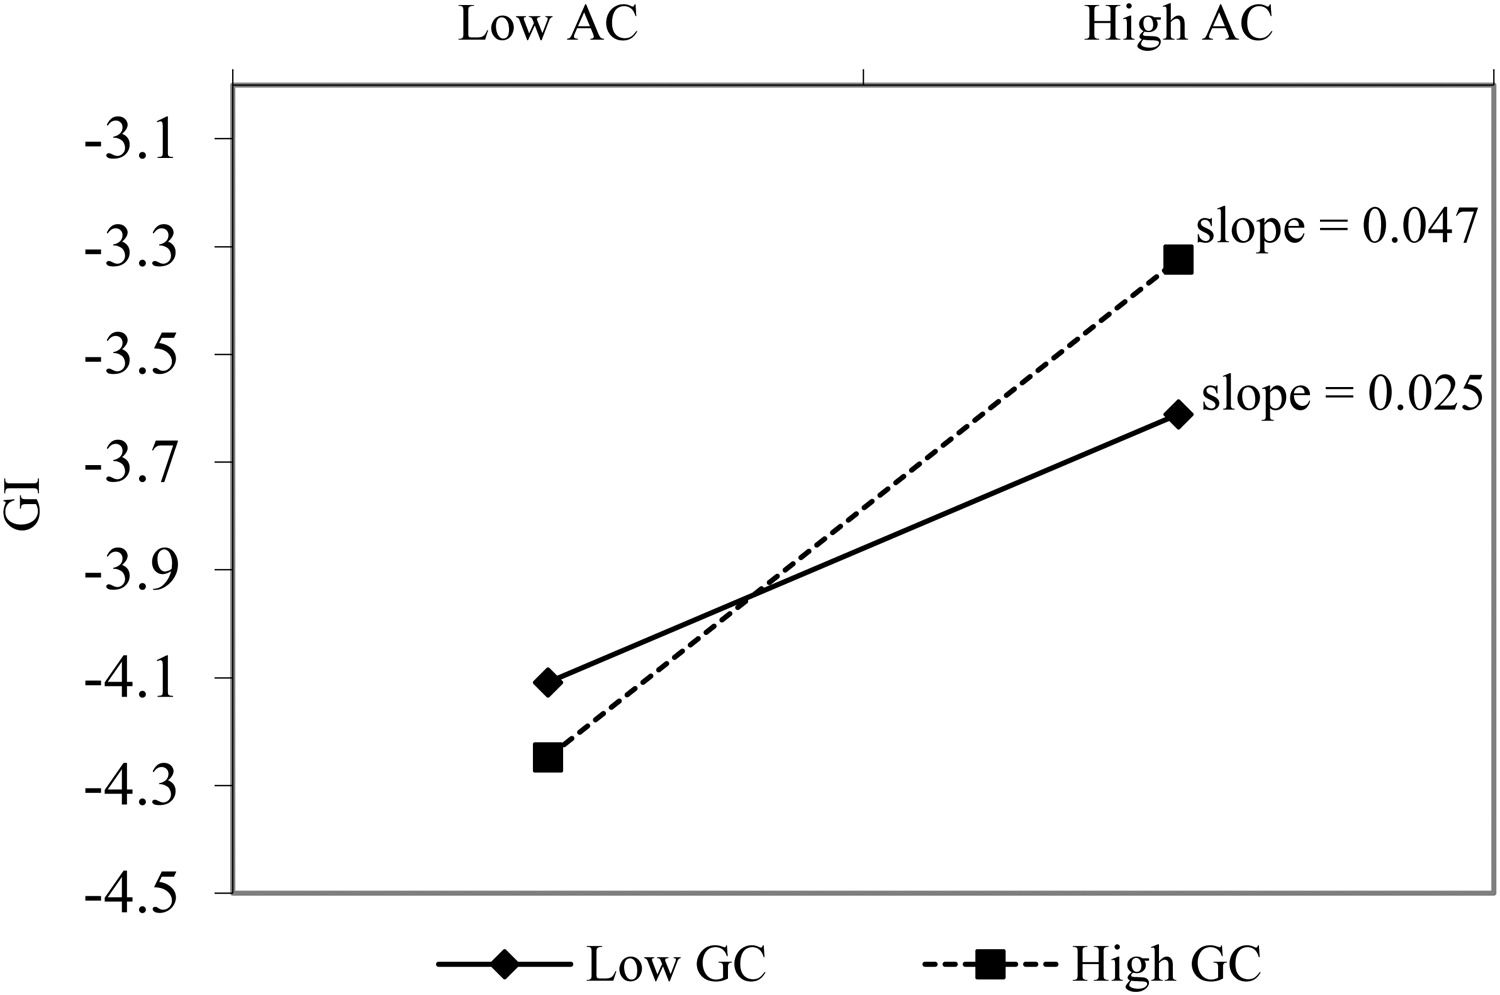
Moreover, in column (4), AC×GC positively correlated with GI (α = 0.036, p < 0.05). This indicates that GC can positively moderate the relationship between AC and GI, thus verifying H5. We further plotted the moderating effect diagram of GC, as shown in Fig. 2. The slope of solid line (α=0.025, p < 0.01) is lower than the slope of the dotted line (α=0.047, p < 0.01), which indicates that compared to low GC, high GC strengthens the promoting of AC on GI.
Robustness test
Because different variable measurements, study periods, and economic models may affect the research results, we conduct robustness tests to prove the reliability of the results. First, we used the commonly used method of changing the measure of the dependant variable to avoid variable measurement errors (Wang & Jiang, 2021; Zhu & Tan, 2022; Ren et al., 2022). Second, we adjusted the sample period to eliminate possible interference of years with special events (Wang et al., 2022). Finally, we used Tobit regression to avoid econometric model selection errors (Ren et al., 2022; Lian et al., 2022). If the above results do not change significantly in the robustness tests, the conclusions are proved to be robust.
Changing the measure of green innovationAs mentioned, we use alternative measurement methods for green innovation for the robustness test. Following Zhu and Tan (2022), the number of green patent grants was taken as an alternative measure. The results in Table 5 show that the regression coefficients between the main variables remain significantly positive. Moreover, considering that digitalization may lead to an increase in the number of total patents but a decrease in the share of green patents, we further use the proportion of green patent applications in the total patent applications as another alternative measure to run the test. These results support baseline findings.3
The regression results of changing the measure of green innovation.
Note: Numbers in parentheses are t-values. ***, **, * respectively represent p-values are less than 0.01, 0.05, 0.1.
According to Wang et al. (2022), important events occurring during the study period may have led to an estimation bias. Therefore, considering the severe impact of the global financial crisis in 2008–2009 on the Chinese manufacturing industry, we deleted the sample data for these two years in the robustness test. As shown in Table 6, the coefficient significance did not change, further validating the baseline findings.
The regression results of adjusting the sample period.
Note: Numbers in parentheses are t-values. ***, **, * respectively represent p-values are less than 0.01, 0.05, 0.1.
In this section, we conduct a robustness test by modifying the econometric model. amongst the sample data, 77.97% of the observed value of green innovation is zero. According to prior studies (Ren et al., 2022; Duong et al., 2022), the Tobit model is suitable for analysing this type of data and is selected for regression. As shown in Table 7, the results support baseline findings. In summary, the baseline results are reliable.
The results of Tobit regression.
Note: z-values are listed in parentheses. ***, **, * represent p-values are less than 0.01, 0.05, 0.1, respectively.
Reverse causality4 can lead to endogenous problems and thus biases the research results. Based on this, we adopted the instrumental variable (IV) method to further examine enterprise digitalization–green innovation relationship. Following Qiu et al. (2020), we take the lag value of ED in a period as an instrumental variable. Additionally, according to Ren et al. (2022), a firm may tend to imitate the behaviour of other firms in the industry. Thus, the digitalization behaviour of a manufacturing firm may be influenced by similar behaviour of other manufacturing firms. Meanwhile, the firm's green innovation cannot be directly affected by the digitalization level of other firms. Therefore, we consider the digitalization level of other firms as another instrumental variable. It is measured by the digitalization-related keyword frequency of other firms divided by the keyword frequency of all firms. Columns (1), (2), and (3) in Table 8 report the estimation results of two-stage least squares (2SLS), limited-information maximum likelihood (LIML), and generalized method of moments (GMM). The Kleibergen-Paap rk LM statistic is significant, indicating that the null hypothesis of the under-identification of IVs is rejected. The Kleibergen-Paaprk Wald F statistic is larger than the critical value of F statistic, indicating that the null hypothesis of weak IVs is rejected. Shea's partial R2 is 0.746, indicating that IVs have excellent explanatory power. The Hansen J statistic is 0.103, indicating that the IVs satisfy the exogenous condition. These results indicate that the IVs were reasonable and reliable. Furthermore, the estimated coefficients of ED remain positive after eliminating endogeneity, which proves the reliability of the research conclusions.
The results of IV estimation.
Note: z-values are listed in parentheses. ***, **, * represent p-values are less than 0.01, 0.05, 0.1, respectively.
Our empirical results reveal that digitalization can promote green innovation. This supports the proposition of Isensee et al. (2020) that digitalization can empower enterprises to achieve low-carbon and sustainable development. Previous studies have emphasized the important role of digitalization in improving environmental performance (Wen et al., 2021; Trujillo-Gallego et al., 2022). El-Kassar and Singh (2019) verify that big data indirectly improve environmental performance through green innovation. These arguments indicate that green innovation may be the underlying mechanism by which digitalization influences the environmental performance of enterprises. Our findings partially support this view.
To reveal how digitalization affects green innovation, we consider absorptive capacity as a mediator and explore its impact. We find that absorptive capacity contributes to green innovation in enterprises, which is consistent with prior studies (Hashim et al., 2015; Albort-Morant et al., 2018). In addition, we demonstrate that absorptive capacity mediates enterprise digitalization–green innovation relationship. In line with Usai et al. (2021)’s argument, absorptive capacity facilitates the acquisition of the necessary knowledge for green innovation, and new technologies make the whole process much easier.
In addition, the results show that the absorptive capacity–green innovation relationship is positively moderated by green credit. Enterprises in regions with high green credit have more channels to obtain capital from financial institutions, which encourages them to enhance their absorptive capacity to dedicate more energy to green innovation. This conclusion supports Tsai and Liao (2017)’s argument that external conditions, such as environmental policies, can influence the effect of innovation capability on green innovation.
ConclusionBased on the dynamic capability theory and capability hierarchy, this study integrates enterprise digitalization, absorptive capacity, green innovation, and green credit into a unified framework to explore the influencing relationships amongst them. Using data from 1166 listed manufacturing firms in China, we find that digitalization can positively promote green innovation, and absorptive capacity mediates this relationship. Moreover, we reveal that green credit strengthens the absorptive capacity–green innovation relationship. These findings provide insights into how digitalization empowers firms to develop green innovation in terms of their internal capabilities and external financing environment.
Theoretical contributionsBased on these conclusions, this study makes three theoretical contributions. First, it contributes to the research on digitalization and green innovation. When considering the impact of digitalization on enterprises, previous studies have mostly focused on the level of innovation (Muninger et al., 2019; Ardito et al., 2021). This study enriches the relevant research by focusing on green innovation. Meanwhile, we respond to the call of de Sousa Jabbour et al. (2018), who advocate that future research can empirically examine how digital technologies affect corporate sustainability. In addition, Ardito et al. (2021) argue that firms’ digitalization and environmental strategies may conflict. This study provides evidence that digitalization can support green innovation.
Second, this study verifies that absorptive capacity is a mediation mechanism that explains the digitalization–green innovation relationship. On the one hand, the finding emphasizes the critical impact of absorptive capacity on facilitating green innovation. This is consistent with the view of dynamic capability theory (Teece, 2007) and provides empirical evidence. On the other hand, it also emphasizes the critical impact of digitalization on improving absorptive capacity, which further reinforces the view of capability hierarchy (Liu et al., 2013). In addition, the research also responds to the call of Roberts et al. (2012), who emphasized that the relationship between IT and absorptive capacity needs to be verified by empirical methods.
Finally, this study expands the boundary conditions of the absorptive capacity–green innovation relationship and provides new insights into the impact of green credit. Most prior studies have demonstrated the critical role of absorptive capacity in green innovation (Hashim et al., 2015; Aboelmaged & Hashem, 2019). However, little is known about the factors that promote firms’ use of absorptive capacity in green innovation. In this regard, this study enriches the relevant research by demonstrating the moderating effect of green credit. In addition, existing studies on the green credit–green innovation relationship mainly focus on its direct impact (He et al., 2019; Wang et al., 2022). Few studies regard green credit as a regulatory mechanism that promotes the transformation of a firm's capability into green innovation. Therefore, this study provides a new perspective to understand green credit.
Managerial implicationsThis study also has several managerial implications for firms and governments. First, given that digitalization is a prerequisite for green innovation, firms should focus on equipping and integrating digital technologies to establish sound digital infrastructure for green innovation. Firms should not view digitalization and green innovation as conflicting or unrelated strategies. Instead, firms should actively explore ways in which digital technology can be applied to green innovation, such as using big data to predict and control pollution.
Second, firms should focus on improving their organizational absorptive capacity through digitalization. On the one hand, firms can use digital technology (such as digital platform) to connect with partners and customers, creating pre-emptive opportunities to acquire more environmental knowledge and technology. On the other hand, firms can use digital technology to connect all departments and employees to strengthen cooperation, thus improving the efficiency of the integration and utilization of green knowledge.
Finally, firms should consciously improve their willingness to engage in green innovation and effectively use preferential credit channels to develop green innovation. Additionally, government departments can encourage firms to develop green innovation by improving the level of regional green credit. Meanwhile, the government should take some measures, such as optimizing the green innovation identification system and establishing information-sharing channels to prevent the "greenwashing" behaviour of firms.
Limitations and future researchThis study has some limitations that need to be explored further in future studies. First, our research sample was limited to listed manufacturing firms in China. Subsequent studies should use different samples to verify the universality of the results. Second, this study only considers one mediator, absorptive capacity, when developing the mechanism of digitalization's influence on green innovation. Future research could expand on other possible factors to offer a more comprehensive understanding of this relationship. Moreover, since data on green credit at the firm level have not been released, we can only take provincial data as substitutes. Future research can look for more effective measures of green credit as more data are available. Finally, in the absence of more effective quantitative indicators, we can only use the frequency of digital keywords in a firm's annual report to measure enterprise digitalization. Alternative methods can be applied in future studies.
This work was supported by the National Natural Science Foundation of China(NSFC) [grant numbers 71804169, 72102218], and the 2022 Qingdao Social Science Planning Research Project [grant number QDSKL2201015].