


The main goal of this study is to investigate and to evaluate the selected indicators of the circular economy to advance the development of effective tools and policies regarding the circular economy system. This investigation is supported by the three research questions covering the topics of dependence of the circular economy on the use of reusable material, help with the reuse of circular material for economic sectors to establish a platform for effective policy development and implementation, and finally, the necessity of quantifying circular economy indicators to obtain an accurate picture of the circular economy sector relationships. The eight research hypotheses are considered, five of which are rejected. The gross investment of the circular economy sector in tangible goods in the both explored variants – expressed in the currency units also as the share of gross domestic product, circular economy sector value added at factor cost, the glass packaging waste recycling rate, the metallic packaging waste recycling rate, and the municipal waste act in the statistically significant way. The study applies a regression analysis technique with consistently validating test outcomes. The discussion section introduces the implications of the analytical outcomes with a potential of the setting current policies in the circular economy system and the construction of the new ones.
The goal of the introduction of the concept of a circular economy is to bring simultaneous economic, environmental, and social benefits and to build a system, which the development and protection of the economy, society, and the natural environment are coordinated in accordance with the goals of sustainable development in. The circular economy is one of the main economic policy priorities of the economic policy of the European Union that strengthens the countries’ economies, increases competitiveness, and ensures future economic growth, while also protecting the environment (European Commission, 2018). In the transition to the circular economy, enterprises face increasingly demanding challenges and new levels of complexity. Accelerated technological development has changed enterprises’ business models and decision-making processes, with considerable influence on social trends and consumer demand, taste, and preferences. Nowadays, the technological progress has introduced many new approaches to all the economic sectors, and each country determines how to tackle with the technological innovations that represent the main driving force of every economic dimension. The development of the circular economy concept at the microeconomic, mesoeconomic, and macroeconomic levels necessitates the construction of evaluation mechanisms with a system of indicators that would comprehensively quantify progress in the introduction of the circular economy at the enterprise, sectoral, municipal, regional, and national levels (Radavičius & Tvaronavičienė, 2022).
Regarding the above-mentioned considerations, the research question 1 is formulated as follows: the circular economy is dependent on the use of material that is reusable.
Although many concepts and models have been developed for implementing a circular economy, the success of such models requires new thinking and an understanding of the managerial and policy implications. The existence of a large number of concepts is clear evidence that a consensus regarding the definition of circular economy has not been reached (European Environment Agency, 2019). This lack of consensus also affects the circular economy processes themselves and implementation. In the recent period, extensive research examines how to establish optimal practical processes to motivate the economic actors to review and revise current models, to initiate changes in strategic concepts in accordance with circular economy principles, and to search for new markets, customers, and resources in the context of the circular economy (Esposito et al., 2018). For circular economy models to function effectively, systemic thinking aimed at understanding the influences, interdependencies, various correlations, and changes in the system is essential. The individual components of the system should be assessed simultaneously considering economic, operational, environmental, and social impacts and contexts.
These considerations are extremely important, leading to the research question 2: the reuse of circular material helps economic sectors to establish a platform for constructing effective strategies and policies.
Many studies developed by the international organisations and the regulatory bodies – such as those conducted by the Organisation for Economic Co-operation and Development, the World Bank, and the European Commission – consider the circular economy implementation processes and its indicators. The European Union member countries have also independently developed national circular economy indicators that are adapted to the strategies implemented, related policies, and activities that are specific to each country. Although the significant heterogeneity of the national indicators has a negative effect on international comparison, these constructs are important for setting monitoring and regulatory mechanisms for the national economies supporting the introduction of circular economy principles in the various economic sectors. The adoption of circular economy models also indicates enterprises’ significant motivation and related activities. Such models should support the introduction of new technologies and business models based on renewability, longevity, reuse, modernisation, repair, renovation, and similar approaches. Policymakers and enterprises have to be prepared to manage stakeholders in a relation to potential losses in the transition to a circular economy. Thus, it is also essential to develop the optimal organisational design to facilitate these transitions.
In the context of these circumstances, the research question 3 is formulated successively: the quantification of the circular economy indicators is essential for obtaining an accurate picture of the circular economy sectoral relationships.
The research studies as well as the outcomes of real practice confirms the necessity of creating effective strategies, revaluating existing goals, and setting the new ones. It is crucial to conduct systematic analyses to verify the validity of the assumptions, which the original circular economy goals are formulated from. Active participation of the business sector, institutional collaboration, and collaboration among sectors in the creation of new policies is also essential. These concerns are the main motivation for this study to support the development of an analytical platform for the business sector and relevant policies.
The main goal of the study is to investigate and to evaluate the selected indicators of the circular economy in the particular sectors to create the development of effective tools and policies for establishing the system for the circular economy. This is determined by conducting a literature review with emphasis on structures within sectoral dimensions.
The paper is structured as follows. The Introduction section opens a dispute to the explored topic. Successively, the Theoretical Background section introduces many fruitful ideas related to the circular economy. The sections on Data and Methodology reveals the origin of the data and the statistical techniques that are applied in the analysis. The Analysis section presents the results, and the Discussion section explores the outcomes of previous studies and the unique insights gained from the study results. Finally, the Conclusion section offers a summary of the findings.
Theoretical backgroundThe circular economy represents a sustainable approach applying a circular economy framework that is based on the efficient and sustainable use of biomass. The approach makes use of the efficient transformational platforms and provides a sustainable approach for the integrated biological products (Duan et al., 2022) with the biotechnological application possibilities for industrial, commercial, agricultural, and energy sectors. This segment covers the whole global market value of biowaste to energy technology that equals approximately 25.32 billion USD and it is expected to be increased up to 40 billion USD in the year 2023 (Awasthi et al., 2022). The integration of biorefinery concepts within biological waste management processes is one of the most important ways to mitigate the issues of resource scarcity and climate change. The high complexity of these concepts and their integration into a circular economy system confronts many barriers related to infrastructure, the availability of raw materials, investment, technological adaptability, and related considerations. Zabaniotou (2018) classifies these barriers into the environmental, economic, and social dimensions. Many authors primarily examine technological barriers with the ties to investment and process sides (Mohan et al., 2016; Tantau et al., 2018Guo et al., 2019; Leong et al., 2021; Jain et al., 2022) or social aspects (Falcone et al., 2019; Eversberg and Fritz, 2022), but the barriers in the personnel dimension are only sporadically analysed in the studies. An important regulatory role in the circular bioeconomy is also ensured by the European Union policies (European Commission, 2018), the Organisation for Economic Co-operation and Development policies (Organisation for Economic Co-operation and Development, 2018), and are represented at the national level as a critical initiator in the construction of rules, incentives, and government financing conditions (Droste et al., 2016). When evaluating the circular bioeconomy, it is also crucial to examine geographical dimensions (Ubando et al., 2020; Angouria-Tsorochidou et al., 2021).
Globalisation processes affect the labour market through changes in production processes, trade, demand patterns, aggregate incomes, macroeconomic conditions, and competitiveness (Frey and Osborne, 2017; Nassar and Tvaronavičienė, 2021). The circular economy can exert various impacts on the labour markets, including the creation of novel employment opportunities, the redefinition of job roles, disappearance of some jobs, and other effects. Many economic models provide important analytical frameworks for examining the impact of resource efficiency policies on labour markets and employment. From an international perspective, matched comparison of employment data in the circular economy sector is highly problematic due to the application of diverse methodological approaches (Chateau and Mavroeidi, 2020) The experts emphasise the issue of not considering the indirect or induced effects of the circular economy on employment. This information is rudimentary for policymakers to ensure that labour supply matches labour demand. A mismatch between the different knowledge foundations, skills, experiences, and other considerations can also present challenges (Bowen and Kuralbayeva, 2015; Consoli, et al., 2016). Due to the complex heterogeneity of the circular economy sector and its subsectors, educational programmes has to be adapted to related skill requirements. Changes in the working-age population employment are usually not realised as a result of responses to the green growth policy, with the exception of changes resulting from education, training, migration, and the other similar life fields.
Laubinger et al. (2020) argue that properly implemented policies can lead to a net increase in employment, but measuring the effectiveness of such policies is highly problematic due to the heterogeneity of individual sectors and geographic characteristics. The policies related to circular economy will influence the labour market changes through sectoral restructuring.
The Organisation for Economic Co-operation and Development member countries are characterised by considerable differences in unemployment, and there are many sources of unemployment, which makes it challenging to define them in the context of circular economy principles. Nham (2022) examines the circularity of the European countries choosing the six characteristic points, including municipal waste, number of patents on the circular economy, circular material use, recycled waste rate, biowaste recycling rate, and electronic waste rate. The results of the study confirm that initial development of digitalisation can help the European countries to move to the circular economy, but excessive digitalisation can constrain the development of the circular economy sector. The author confirms the nonlinear relationship between digitalisation and circularity. Burger et al. (2019) and Consoli et al. (2016) argue that neither the fundamental nor supporting circular economy sectors in Central Europe have the same requirements for circular economy-related employment. Horbach et al. (2015) emphasise the fact that quantifying the effects of the circular economy on gross employment is only partially possible. According to the author, many dynamic aspects of policies regarding resource productivity are difficult to capture.
Sulich and Sołoducho-Pelc (2022) investigate the creation of green jobs in the 28 European countries, finding that green jobs are most prevalent in the environmental goods and services sector. Unay-Gailhard and Bojnec (2019) also consider sectoral specificities in the creation of green jobs, finding that some economic sectors such as agriculture and construction require more active policy support from the government. Enterprises’ size can be a determinant for the creation of new ecologically oriented jobs (Moreno-Mondéjar et al., 2021). Reuse of materials and potential for redesign also affect the probability of job creation, and are positively associated with the probability and number of green jobs. Larger enterprises are more likely to offer such jobs in business groups. Enterprises’ technological capabilities, openness to external sources of knowledge, and specialisation in green products and services increase the probability and number of green jobs. Additionally, implementation of circular economy business models in the service-oriented technology sector is exceedingly demanding (Heyes et al., 2018). A greening process is also evident in the field of sustainable development (Androniceanu and Sabie, 2022; Streimikiene et al., 2022). The main goals of the international institutions are represented in multiple sectoral perspectives. However, the general sustainable development goals include the same framework as the circular economy in terms of supporting objectives (Streimikiene et al., 2023).
As a part of the circular economy development process, the effects of innovations and investments are also often investigated. Innovation is a fundamental prerequisite for circular economy development (Prieto-Sandoval et al., 2018) and it also requires significant investment. Limited resources to ensure the development and installation of cost-effective technology are one of the main obstacles to the transition to a circular economy (Kirchherr et al., 2018). Lehmann et al. (2022) confirm that innovations and investments significantly mitigate environmental degradation, but higher investments have no effect on resource efficiency. De Jesus and Mendonça (2018) argue that investments are an important factor in the decision-making process for the introduction of the circular economy in various sectors and enterprises. The authors emphasise the role of government in supporting the circular economy and improved access to finance for small and medium-sized enterprises that are active in recycling, repair, and innovation that apply the circular economy principles. Few studies examine the barriers to the development of a circular economy in the context of enterprises’ capital structure, size, sector specificities, or legal form, and so forth (Ghenţa and Matei, 2018). Nevertheless, many studies declare that access to funding sources can be a strong stimulus for circular economy development. Therefore, enterprise characteristics can also indirectly indicate the potential for its development (Marino and Pariso, 2020; Kristoffersen et al., 2021). Fiscal incentives can be a strong determinant of country's circular economy development, regardless of enterprise size and type.
Construction and demolition waste is prioritised in many policies at the global level due to its serious impact on the environment. The production processes of new construction materials have a low product recovery rate. Therefore, the adoption of effective circular economy concepts is essential for this sector. Construction and demolition waste is characterised by a high volume of production and inadequate management (Ruiz et al., 2020). The statistics from the World Economic Forum (2016) indicate that only 20 % to 30 % of construction and demolition waste is recovered worldwide. The adoption of circular economy concepts in the construction sector can open many economic opportunities. This sector also provides significant employment opportunities, which is also justified by its share of gross domestic product at a European level, with a 6.3-per-cent share and at the world level with a 6.2-per-cent share of world gross domestic product (Eurostat, 2017). This establishes a strong assumption for high employment in the sector during the transition to the circular economy. As a consequence of the methodological challenges, the employment impacts of the circular economy are only partially captured in previous research studies (Chateau and Mavroeidi, 2020; Laubinger et al., 2020). The process analyses of the individual life cycle phases and the available strategies could reveal the design of an active support mechanism that establishes an appropriate methodology for quantifying the economic, social, and environmental effects of the circular economy in the construction industry. The previous research studies are usually aimed at technical processes, application of the circular economy principles in the construction (Ghaffar et al., 2020), application of construction and demolition waste minimisation procedures (Won & Cheng, 2017), issues with circular economy implementation (Benachio et al., 2020), and environmental assessment (Dahlbo et al., 2015). The economic studies concerning the circular economy in the construction industry mainly focus on quantifying the changes to construction and production processes and model creation (Busu, 2019; Robaina et al., 2020; Knäble et al., 2022).
The European Union strategies in the fields of recycling and meeting circular economy goals help to enhance the sorted waste collection system. Many studies reveal significant differences in the rate of packaging waste collection, including paper, plastic, metal, composite material, and glass, suggesting a strong potential for its increase. According to Tallentire and Steubing (2020), an additional 18,000,000 t of waste could be collected annually in Europe, with the implementation of more efficient systems for the collection of sorted waste. Regarding the efficient use of resources, it is insufficient to only focus on improving collection systems and it is crucial to eliminate any material losses across the value chain (da Cruz et al., 2014; Eriksen et al., 2019). A strong platform to enhance processes can be created applying the evaluation mechanisms aimed to assess the life cycles of material recycling in the waste management system (Ferreira et al., 2014; Gala et al., 2015). By the end of the year 2025, the European Union member countries have to recycle at least 50 % of all aluminum packaging waste. The metallic waste recycling mechanisms introduced may not always be adequate and realistic that is also confirmed by the numerous studies. Warrings and Fellner (2019) reveal significant issues when comparing the recycling rates within the European Union member countries. The primary cause is attributed to an international database that may be dominated by incorrect, estimated, or wrongly assumed data. At the microeconomic level, it is essential to examine and to evaluate various waste separation and handling approaches, to determine the different procedures employed in the individual countries. Differentiations in waste categories also affect the different monitoring and evaluation processes for individual types of waste. Regional and national surveys also have great importance, and the results can be shared at the international level. In the case of municipal waste, the authors recommend an investigation of households’ sociodemographic characteristics, the time spent on waste sorting and handling, and the use of recycling facilities. Attitudinal factors, personal motivation, and social influence are also extremely important considerations in this field (Nainggolan et al., 2019).
The significant heterogeneity of factors and influences also affects the methodological difficulty of evaluating effectiveness or determining the further potential of sorted waste collection and recycling processes and schemes. It is crucial to establish consistent, high-quality monitoring and evaluation mechanisms as a foundation for developing effective political initiatives to achieve the more efficient sorted waste collection systems and recycling processes.
DataThe data set covers the period beginning in the year 2000 and ending in the year 2021, while not all of the years included are involved in every indicator that is explored. Nevertheless, this minor potential shortcoming is not significant as the applied methodology addresses this consideration in an appropriate manner. The whole data set is obtained from the online Eurostat database provided by Eurostat – the statistical office of the European Union.
The input data set for all the analytical processes bears a panel form. In addition to the noted time perspective, there is a geographical territorial view covering almost all the current European Union member countries with the former member representing the United Kingdom of Great Britain and Northern Ireland, which is included based on the fact that it was a member for the long period representing a majority of the period explored in this analysis. Hence, the countries included are the Republic of Austria – AT, the Kingdom of Belgium – BE, the Republic of Bulgaria – BG, the Swiss Confederation – CH, the Republic of Cyprus – CY, the Czech Republic – CZ, the Federal Republic of Germany – DE, the Kingdom of Denmark – DK, the Republic of Estonia – EE, the Hellenic Republic – EL, the Kingdom of Spain – ES, the Republic of Finland – FI, the French Republic – FR, the Republic of Croatia – HR, Hungary – HU, Ireland – IE, Iceland – IS, the Italian Republic – IT, the Principality of Liechtenstein – LI, the Republic of Lithuania – LT, the Grand Duchy of Luxembourg – LU, the Republic of Latvia – LV, the Republic of Malta – MT, the Netherlands – NL, the Kingdom of Norway – NO, the Republic of Poland – PL, the Portuguese Republic – PT, Romania – RO, and the United Kingdom of Great Britain and Northern Ireland – UK. The abbreviations listed are assigned to the countries according to the standard country codes and the codes for subdivisions (International Organization for Standardization, 2013). The order is sorted according to the standard abbreviations assigned to the countries.
The explained indicator is represented by the circular material use rate variable (Eurostat 2022a).
This analysis investigates the following eight explanatory indicators:
- -
biowaste to population ratio – BTP (Eurostat, 2022b);
- -
circular economy sector employment – E (Eurostat, 2022c);
- -
circular economy sector gross investment in tangible goods – GI;
- -
circular economy sector value added at factor cost – VA (Eurostat, 2022c);
- -
construction and demolition waste recovery rate – CADW (Eurostat, 2022d);
- -
glass packaging waste recycling rate – GPW (Eurostat, 2022e);
- -
metallic packaging waste recycling rate – MPW (Eurostat, 2022e);
- -
municipal waste – MW (Eurostat, 2022f).
The circular economy sector gross investment in tangible goods is demonstrated by the two variables representing values in the currency unit marked GI1 firstly (Eurostat, 2022c) and in the share of the gross domestic product marked GI2 secondly (Eurostat, 2022c).
MethodologyThe main methodological approach employed in this study is regression analysis (Galton, 1989). This technique applies multiple panel regression based on fixed effects from two perspectives of time and geography. The statistical significance of the individual variables included in the regression model is evaluated according to the p-values of the estimated regression coefficients.
The man research topic is an investigation of how the circular economy sector affects the processing of the circular material, focusing on the circular material use rate in the terms of reusable material, which is a crucial aspect of each circular economy.
Therefore, the three research questions are determined:
- -
research question 1: the circular economy is dependent on the use of the material that is reusable;
- -
research question 2: the reuse of circular material helps economic sectors to establish a platform for constructing effective policies and strategies;
- -
research question 3: the quantification of circular economy indicators is essential for obtaining an accurate picture of circular economy sectoral relationships.
Besides these three research questions and according to the indicators being investigated, the eight related research hypotheses are formulated.
The following research hypotheses are explored in the analytical process:
- -
research hypothesis 1: the biowaste to population ratio does not influence the circular material use statistically significantly;
- -
research hypothesis 2: the circular economy sector employment does not influence the circular material use statistically significantly;
- -
research hypothesis 3: the circular economy sector gross investment does not influence the circular material use statistically significantly;
- -
research hypothesis 4: the circular economy sector value added at factor cost does not influence the circular material use statistically significantly;
- -
research hypothesis 5: the construction and demolition waste recovery rate does not influence the circular material use statistically significantly;
- -
research hypothesis 6: the glass packaging waste recycling rate does not influence the circular material use statistically significantly;
- -
research hypothesis 7: the metallic packaging waste recycling rate does not influence the circular material use statistically significantly;
- -
research hypothesis 8: the municipal waste does not influence the circular material use statistically significantly.
These research hypotheses are constructed referencing studies that are primarily based on regression analysis. Research hypotheses 1 related to biowaste is examined by Tomić and Schneider (2020), emphasising the idea of closing the loop, examining European Union legislation that concentrates on avoiding waste generation by investigating fields of biowaste, glass packaging waste, metallic packaging waste, and municipal waste too that serve as a basis for the research hypotheses 6, 7, and 8. Burger et al. (2019) examine employment as an important factor of the circular economy from many perspectives, investigating this macroeconomic indicator in a very detailed manner through the estimated regression coefficients. Their analysis opens a space for further investigation focusing on the research hypothesis 2. Investment in the circular economy sector represents a driving force into a better tomorrow for the whole economy. The importance of the research hypothesis 3 references the regression model of Heshmati and Rashidghalamb (2021) who emphasise at the investment challenges in this sector. Stanković et al. (2021) apply principal component analysis and preference ranking organisation method for enrichment evaluation to determine the factors that are the most significant for value added in the circular economy sector as presumed by the research hypothesis 4. Construction and demolition waste recovery is examined referencing regression analysis proposed by Kabirifar et al. (2021) who confirms that this is an extremely crucial aspect of the circular economy sector as represented in hypothesis 5.
This study conducts several statistical tests to confirm the statistical significance of the constructed regression model. However, the coefficient of determination showing the fundamental overview of the regression model exactness along with the total sum of squares and the residual sum of squares are calculated first.
In addition to the mentioned statistics, the F test is conducted to determine whether the chosen variables correctly model the explained variable applying the following hypotheses (Box, 1953):
- -
the null hypothesis H0: the regression model with no independent variable fits the data as the tested regression model;
- -
the alternative hypothesis H1: the regression model fits the data better than the regression model with an intercept only.
The regression model statistical significance is tested through the fundamental regression analysis assumptions, including normality of residuals, homoscedasticity, and multicollinearity. All the testing procedures are evaluated according to a five-per-cent threshold of statistical significance. An exception is made in an assessment where the common levels are applied from a tenth-per-cent threshold through a one-per-cent threshold to a five-per-cent threshold. Notably, this could be a point for further research or for creation of a wider analytical outcome set with possible demonstrations of several statistical significance thresholds to show the robustness of the analytical outcomes and interpretative power.
Firstly, normality of residuals is tested through the Jarque–Bera test (Jarque and Bera, 1980) with the following test hypotheses:
- -
the null hypothesis H0: residuals of the regression model are distributed according to the normal distribution;
- -
the alternative hypothesis H1: residuals of the regression model are not distributed according to the normal distribution.
Secondly, a presence of homoscedasticity in the explored data set is investigated through the Goldfeld–Quandt test (Goldfeld & Quandt, 1965) based on its three alternatives – greater, less and two-sided – with the following hypotheses:
- -
the null hypothesis H0: the residuals are distributed with equal variance;
- -
the alternative hypothesis H1: the residuals are not distributed with equal variance.
Thirdly, multicollinearity between the variables in the data set is examined using the variation inflation factor (Snee, 1981), which is not actually a test, but demonstrates the possible value of the presence of multicollinearity for the individual variable.
Regarding the numbers listed in this study, those lower than 1 are noted with two decimal points or with three valid figures separated by a decimal comma. Otherwise, the numbers are displayed with full series in front of a decimal comma and the two figures behind it.
All the analytical processes are conducted in the R statistical environment (R Core Team, 2022), with help of the additional packages – car (Fox et al., 2022), gplots (Warnes et al., 2022), lmtest (Hothorn et al., 2022), plm (Croissant et al., 2022), reshape2 (Wickham, 2020), shape (Soetaert, 2021), and tseries (Trapletti et al., 2022).
AnalysisAmong the nine variables explored, five have a positive sign, while the remaining four have negative signs. This is a notable finding for differentiating the direction of variables’ influence. While the biowaste to population ratio, the circular economy sector gross investment in tangible goods of gross domestic product, the circular economy sector value added at factor cost, the construction and demolition waste recovery rate, and the metallic packaging waste recycling rate influences the circular material use rate in a positive way., the circular economy sector employment of total employment, the circular economy sector gross investment in tangible goods, the glass packaging waste recycling rate, and the municipal waste affects the explained variable negatively.
Table 1 presents a summary of the regression coefficients, the standard errors, the and p-values.
Regression model.
Source: own elaboration by the authors.
Table 1 reveals that the most influential variable is the circular economy sector gross investment in tangible goods of gross domestic product as its estimated value peaks at value of 18.05. Notably, this is implied in only an absolute way since the input data is not normalised. Conversely, the lowest regression coefficient is the circular economy sector employment to total employment, which is lowest at a level of -2.83. From a perspective of the absolute numbers, it is the second highest regression coefficient. The absolutely lowest value is kept by the circular economy sector value added at factor cost standing at a level of 4.67 . 10−4. The second lowest position is held by the circular economy sector gross investment in tangible goods that lies at a level of 1.93 . 10−3. There is to note that their estimated values are affected by their expression in sum of millions considerably. Besides these variables, the biowaste to population ratio is the lowest one not expressed in the higher series than ones. It stands at 1.67 . 10−2.
Regarding the statistical significance of the estimated regressors, there are the two variables fulfilling the strongest level of the statistical significance that is represented by a tenth-per-cent threshold, which the and the municipal waste, whose p-value lowers at 2.60 . 10−4, and the glass packaging waste recycling rate standing at a level of 9.46 . 10−4 belong among. The second-best statistical significance level embodied by a one-per-cent threshold is not represented. The third level of the statistical significance characterised by a five-per-cent threshold is kept by the four variables. Firstly, the circular economy sector value added at factor cost p-value lies at a level of 1.32 . 10−2. Secondly, the circular economy sector gross investment in tangible goods p-value reaches a value of 2.13 . 10−2. Thirdly, the circular economy sector gross investment in tangible goods of gross domestic product p-value stands at a level of 3.02 . 10−2. And fourthly, the metallic packaging waste recycling rate p-value reaches a value of 3.98 . 10−2. Successively, there are the three variables that do not meet any of the statistical significance levels. Despite of being statistically insignificant from this perspective, they are left in the regression model because of the several reasons. The primary one and the most substantial point is their p-values lie slightly above a ten-per-cent threshold that is sometimes considered to be as the lowest statistical significance level. Here, this level is omitted because of no variable evaluated by it, so it would be senseless to include it in this analysis. Secondly, another point of an inclusion of these three variables lies in the fact that they complete explanation of the explained variable fairly well. And the last, but not the least point is that their regression coefficients clarify the circular material use rate in the correct way.
According to the mentioned statistical significance of the estimated variables through the regression model, the hypotheses 2, 3, and 6 are not rejected, but laterally they are rejectable for precise explanation of the explained indicator. On the other hand, the hypotheses 1, 4, 5, 7, and 8 are rejected based on the p-values of the regression model indicators.
The interpretation of the obtained regression coefficients is as follows. An increase of the biowaste to population ration by one unit causes an increase of the circular material use rate by 1.66 . 10−2 percentage points. A one-percentage-point increase of the circular economy sector employment of total employment results in a decrease of the circular material use rate by 2.83 percentage points. If the circular economy sector gross investment in tangible goods raises by one million EUR, the circular material use rate falls by 1.93 . 10−2 percentage points. On the other hand, this variable expressed as a share of gross domestic product shows an opposite behaviour. Its increase by one unit causes an increase of the explained variable by 18.05 percentage points. If the circular economy sector value added at factor cost raises by one million EUR, the circular material use rate rises by 4.67 . 10−4 percentage points. The waste recovery and recycling rates behave differently too. An one-percentage-point increase of the construction and demolition waste recovery rate causes an increase of the explained variable by 1.24 . 10−2 percentage points. The glass packaging waste recycling rate affects the circular material use rate negatively in a way that its a one-percentage-point increase causes a decrease by 1.17 . 10−1 percentage points. On the other hand, if the metallic packaging waste recycling rate increases by one percentage point, the explained variable increases by 4.19 . 10−2 percentage points. Finally, a mass of the collected municipal waste is raised by one kg per inhabitant, the circular material use rate decreases by 3.12 . 10−2 percentage points.
Overall, these outcomes appear to demonstrate a certain level of interconnectedness. A possible continuation of this research could investigate the correlations between the explored indicators expressed in alternative ways than those examined here to introduce new perspectives to the field.
The fixed effects of the countries examined are illustrated in Table 2.
Fixed effects of the regression model.
Source: own elaboration by the authors.
The three perspectives emerge from the fixed effects calculation. Firstly, the angle of results demonstrates the absolute value of the fixed effects assigned to each country investigated using the regression analysis. Secondly, deviations from the base observed country are displayed, and third, the deviation from the mean fixed effects is calculated. The highest fixed effects, which peak at a level of 46.15, are assigned to the Netherlands and on the other hand, Romania hold the lowest fixed effects at a level of 14.56. In a case of the fixed effects deviation, the extremes are held by the Netherlands with the highest value of 15.18 and by Hungary with the lowest value of -10.71. The mean fixed effects value is equal to 26.87. Hence, the highest positive deviation from the mean value is kept by the Netherlands with a deviation of 19.10 and the highest negative deviation by Romania at a level of -12.50. Croatia possesses the most similar value to the mean fixed effects with a deviation standing at a level of -0.83.
Table 3 summarises the regression model fundamental statistical descriptions.
The coefficient of determination of the regression model reaches a level of 3.97 . 10−1, indicating that the model explains 39.7 % of the data variability of the investigated data set. The total sum of squares reaches a value of 150.75, while the residual sum of squares lies at a level of 90.90.
The next section examines the results of the tests conducted to support the statistical significance of the regression model.
Table 4 summarises the tests’ outcomes.
Testing summarisation.
Source: own elaboration by the authors.
The F test is carried out in order to find out whether the independent variables are selected in a way that support an explanation of the dependent variable. Here, the regression model test statistic reaches a value of 3.88 with p-value of 7.94 . 10−4. Therefore, the null hypothesis representing an inclusion of no suitable independent variables fitted in the model is rejected, confirming that an appropriate outcome is reached.
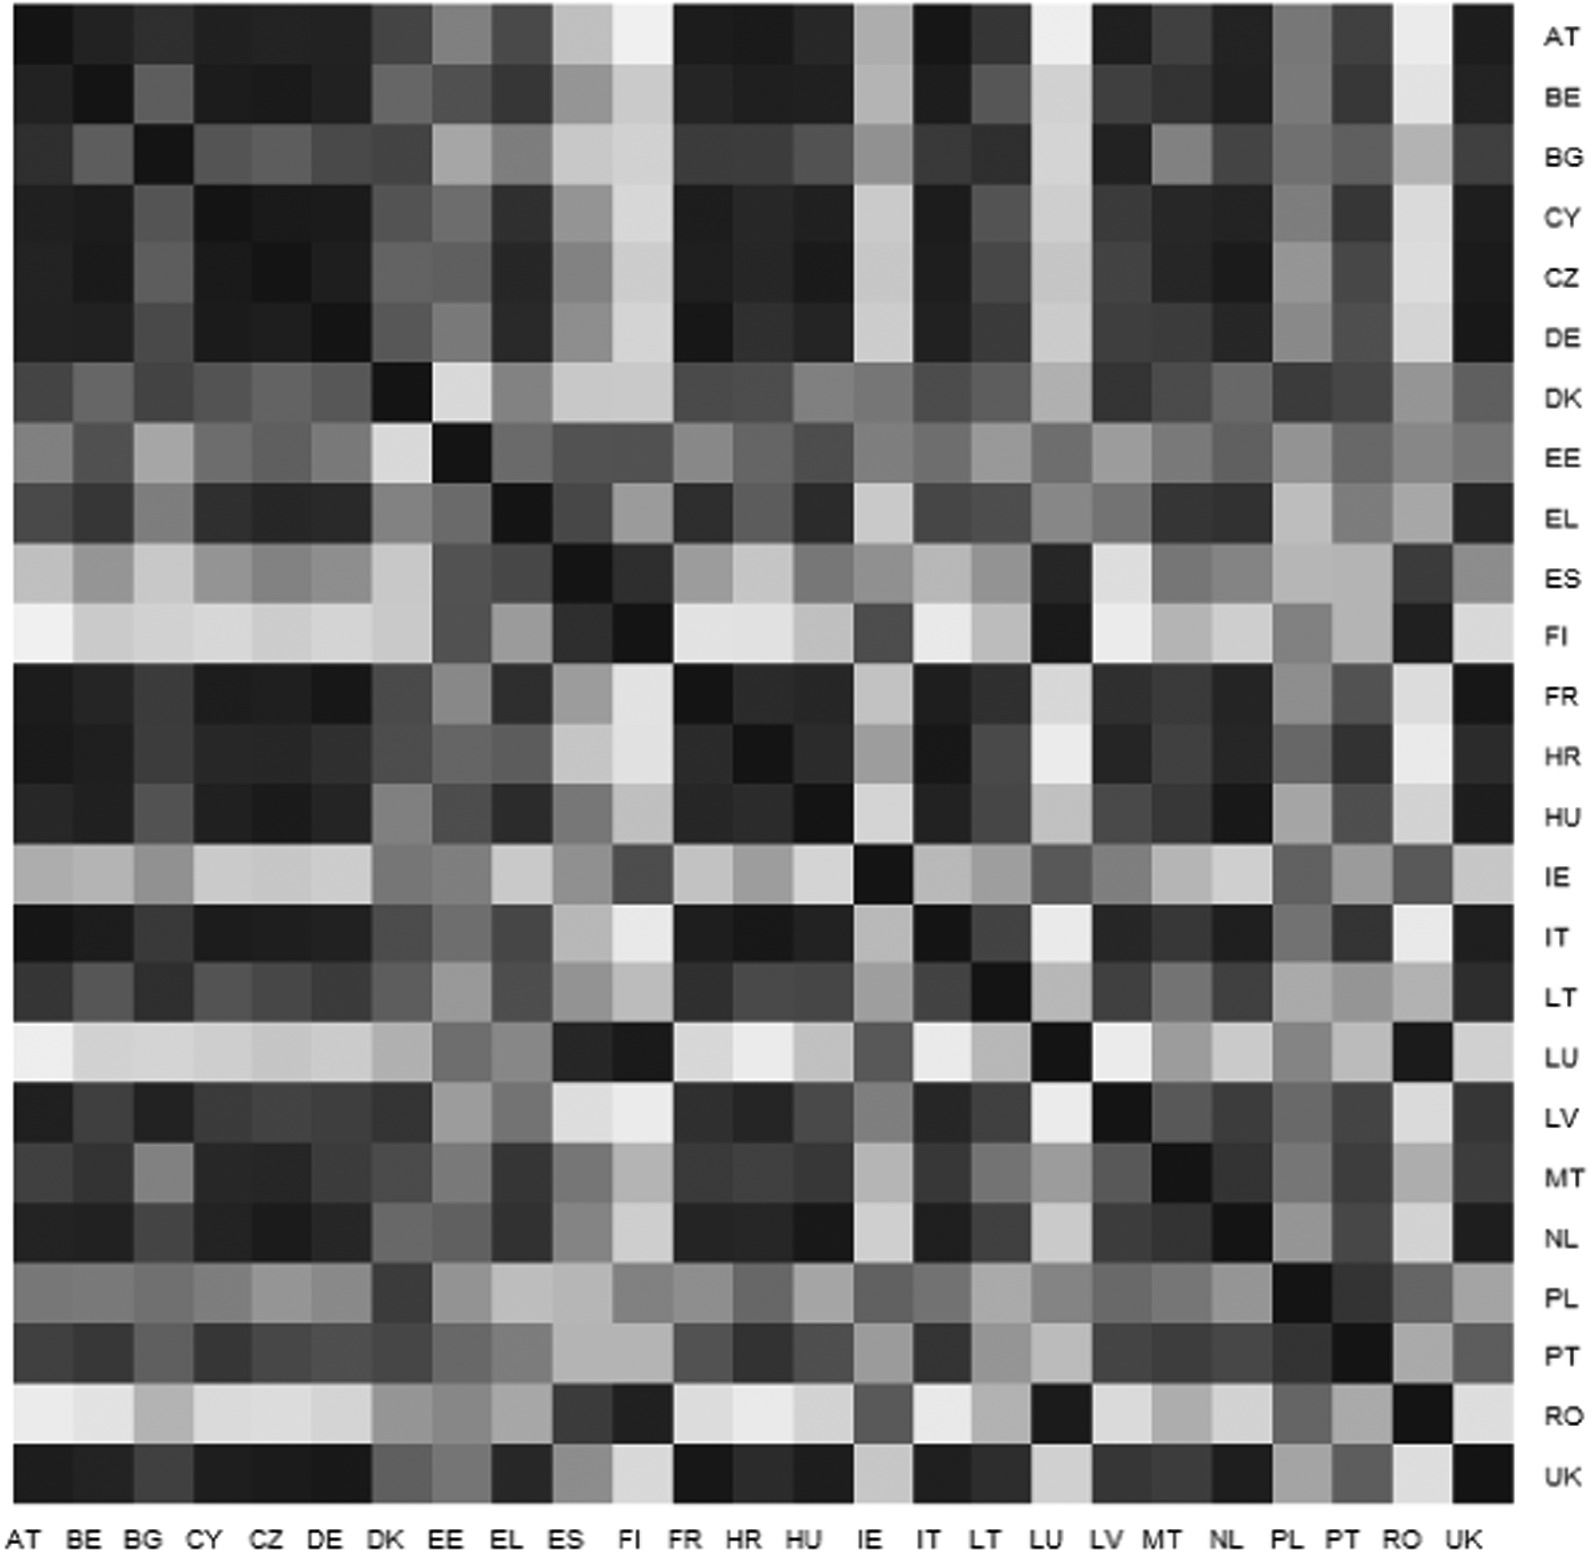
As the explained variable, the circular material use rate behaves in an unusual manner, revealing extremely high disparities among the countries examined. The successive heat map on Fig. 1 illustrates these differences. As this represents the explained variable of the regression model, it is highly challenging.

The Fig. 1 heat map represents the correlation matrix. It is symmetrical; therefore, the values assigned to the individual pairs are illustrated twice. A darker colour indicates higher correlation between a particular pair. The huge disparities are also demonstrated throughout the whole range of correlation coefficient values, from a maximum value of 0.97 between Austria and Italy to the minimum value of -0.96 between Austria and Finland.
Several additional tests are conducted in the analytical process examining regression analysis performance. These tests are important for validating the statistical significance of the variables in the regression model. All the statistical tests are executed in a standard way with a five-per-cent threshold to determine statistical significance of the particular output.
Firstly, a presence of the normal distribution among the origin of the residuals is tested through the Jarque–Bera test. Its test statistic reaches a value of 1.41 . 10−1 with p-value standing at a level of 9.32 . 10−1. This result confirms no rejection of the null hypothesis asserting normal distribution, this shows a positive outcome, confirming that the residuals are distributed according to the normal distribution.
Secondly, a presence of heteroscedasticity is investigated through the Goldfeld–Quandt test. The desired outcome representing a presence of homoscedasticity is tested through the three variants of the Goldfeld–Quandt test. Each of the performed variants conclude that there is a presence of desired homoscedasticity in the explored regression model. The test statistic reaches a value of 1.73 with p-value standing at a level of 6.23 . 10−2 in a case of the so-called greater alternative, at a level of 9.38 . 10−1 in a case of the so-called less alternative, and finally, at a level of 1.25 . 10−1 in a case of the two-sided alternative. it can be concluded that the general assumption is fulfilled.
Thirdly, multicollinearity between the scrutinised variables is examined. Table 5 summarises the outcomes of the multicollinearity testing, sorted from the best to worst values.
The fundamental method employed in order to test a presence of multicollinearity is the variance inflation factor. On the one hand, the lowest test statistic is at a level of 1.16 reached by the metallic packaging waste recycling rate and the on the other hand, the highest value at a level of 4.45 is reached by the circular economy sector gross investment in tangible goods. This approach demonstrates that all the values calculated according the testing methodology lies under a threshold of 5 that is considered to be the highest acceptable value.
The robustness of the observed regression model is also tested to fully meet the regression analysis criteria. All the regressors involved are covered individually.
Table 6 presents the testing outcomes.
Robustness testing.
Source: own elaboration by the authors.
Notably, robustness testing is conducted by altering the explanatory variable, which is presented in the first column of the Table 6, separately explaining the circular material use rate for each case. The regression coefficient for each regression model is presented in the second column, with standard errors presented in the third column. Considerable differences are evident in comparison to the base regression model. Undoubtedly, the combined regression model is more robust than separate regression models. Likewise, the smaller samples observed have lower significance. This is partially understandable since the mutual affects caused by all the regressors are on a higher level than those of separate considerations. Otherwise, this represents a desired state that supports the intent of the regression model. Moreover, the circular economy sector gross investment in tangible goods expressed in the currency unit possesses an opposite sign along with the glass packaging waste recycling rate and the municipal waste. On the one hand, this represents a change from the positive sign to the negative one. On the other hand, there is a case of the circular economy sector gross investment in tangible goods expressed as the share of the gross domestic product that demonstrates the opposite change of a sign. Altogether, it is a significant mark of a robustness presence in the explored regression model.
The robustness test is conducted to confirm the above analytical outcomes, emphasizing the interpretative power of the analytical processing executed. All the statistical tests examine the potential incongruities of the data set and applied models. Overall, the analytical outcomes meet the desired criteria for validating the results as statistically significant.
In summary, the robustness testing outcomes confirm the statistical significance of the study regression model, with all the testing and modeling phases conducted in accordance with standard techniques that are common to analytical processing.
DiscussionPrevious research focused on quantifying selected variables representing the circular economy using tools with several restrictive characteristics or limiting the examination of the spread of the circular economy through binding its boundaries. The circular economy sector does not work in a closed system and has clear direct and indirect effects on the economy. For a comprehensive evaluation of its effects, it is essential that the quantifying constructs for examining the circular economy sector comprehensively cover different characteristics and contain all the significant dimensions. This includes different scopes of implementation processes that are defined differently by the authors. The microeconomic, mesoeconomic, and macroeconomic level of a circular economy evaluation is also disputable, as its geographical dimensions are investigated to a lesser extent in the economic studies (Androniceanu et al., 2021). This is also one of the negatives when conducting the comparative analyses at the national and international levels.
This topic is investigated using several research methodologies. Most recently, many studies employ regression analysis as the main analytical technique (Burger, 2018; Tomić and Schneider, 2020; Di Foggia and Beccarello, 2021; Kuo and Chang, 2021; Nishitani et al., 2021; Pincelli et al., 2021; Hao et al., 2022; Magazzino and Falcone, 2022; Shang et al., 2022; Alkaraan et al., 2023; Stucki et al., 2023). The other analytical methods are represented in the fewer studies – for instance, the analysis of variance (de Oliveira Neto et al., 2022), the cluster analysis (He et al., 2023), the correspondence analysis (Parchomenko et al., 2019), or the structural equation modelling (Nordin et al., 2022). Also, an exceptional approach is found in a case with the multiple analytical techniques applied in the sole study (Erdiaw-Kwasie et al., 2023). Case studies and simulation methods are not evident in previous research. This is also related to a lack of data representing the business sphere. There more techniques would certainly be applied if the available data were more comprehensive. Moreover, the inclusion of big data would be beneficial to introduce additional perspectives for analytical processing (Riaz et al., 2023).
Establishing the statistical significance of the variables explored is a key aspect of the analytical process. Another perspective is quantification of the observed indicators’ influence on the circular material use rate. Regarding the first aspect, many studies could confront this (Kuo and Chang, 2021; Ghosh et al., 2023). However, a more relevant view is offered by applying influence evaluation. The higher the biowaste to population ratio, the more efficient are the procedures of the circular economy as confirmed by Tomić and Schneider (2020) and Ferronato et al. (2022). Circular economy sector employment represents the sector's workforce, and its increase also advances all circular economy processes as argued by Burger (2018) and Hao et al. (2022). The circular economy sector gross investment in tangible goods in both variants explored is statistically significant. However, while its expression via currency unit reveals a decrease in the circular material rate, the second expression reveals an increase. These relations are also found in studies by Shang et al. (2022) and Stucki et al. (2023). Nishitani et al. (2021) argues that the circular economy sector value added at factor cost is also a statistically significant indicator. This study explores construction and demolition waste recovery and glass and metallic packaging waste recycling rates as individual indicators, which are usually explored in a group, as in the studies by Pincelli et al. (2021), Heshmati and Rashidghalam (2021), and Alkaraan et al. (2023). Finally, the municipal waste is one of the most important components of the regression model as this substitutes the whole common waste generated by the population. Its statistical significance is confirmed also by Di Foggia and Beccarello (2021) and Magazzino and Falcone (2022).
Due to the lack of success with current circular economy processes, more effective circular economy strategies should also be strategically developed and implemented. The analytical outcomes of this study could help policymakers to reevaluate circular economy objectives and design a system of new objectives for advancing the transition of the common economy to a circular economy. This study outcomes clearly demonstrate that the circular economy construct is rich in concepts and approaches, but there is a lack of research regarding the processes related to the implementation of the circular economy. This is also evident in the different levels of introduction and circular economy use across the nations considered. Among the European Union member countries, Belgium, France, Germany, Italy, the Netherlands, Spain, and the United Kingdom have the most advanced circular economies (Esposito et al., 2018).
Multiple research studies issue a strong appeal for the implementation of more detailed analyses, application of longer time series for the data analysed, a broader range of indicators, relevant models, and relevant composite indicators, the use of primary enterprise, data and the development and application of various statistical and econometric methods and models (Burger, 2018; Parchomenko et al., 2019; Tomić and Schneider, 2020; Di Foggia and Beccarello, 2021; Kuo and Chang, 2021; Nishitani et al., 2021; Pincelli et al., 2021; de Oliveira Neto et al., 2022; Hao et al., 2022; Magazzino and Falcone, 2022; Nordin et al., 2022; Shang et al., 2022; Alkaraan et al., 2023; Erdiaw-Kwasie et al., 2023; He et al., 2023; Stucki et al., 2023). Advancing this research agenda requires access to the more comprehensively structured macroeconomic and microeconomic data from individual sectors and households. Previous research findings indicate that progress in the introduction of the circular economy is not occurring in all the observed areas and processes of the circular economy, and there is a lack of mapped data to determine barriers to the given areas, sectors, and enterprises. Hence, this study sought to examine the current potential of the individual European Union member countries for advancing the transition to a circular economy and defining time frames is necessary. There are still no clear procedures that individual countries should implement for the circular economy transition, nor specified processes that should be applied for economic transformation according to the principles of the circular economy. The social and institutional changes that will not affect the areas of production and consumption must also be precisely defined (Alonso‐Almeida et al., 2020). From a macroeconomic perspective, the influence of technological innovations on the introduction of the circular economy is also minimally examined. In addition, limited insight is available regarding the necessary circular economy monitoring and regulatory mechanisms in relation to the associated policies at the national and international levels. Development of circularity is studied also at a mesoeconomic level with an emphasis of the ecological innovations (Gonçalves et al., 2022). Environmental challenges and policy solutions are generally complex because they involve many actors and different perspectives; therefore, considerable attention has to be paid to the microeconomic sphere. Few research studies examine the positions of enterprises and interest groups in the implementation of the circular economy (Kristoffersen et al., 2021; Kuo and Chang, 2021). It remains unclear which types of enterprises, what type of characteristics, and which sectors and particular geographic locations achieve superior or inferior results in engaging the introduction of the circular economy, and neither barriers nor processes and economic potential are mapped. Systemic thinking, strong motivation, and enterprises’ circular economy activities must also be considered to advance the effective introduction and efficient functioning of circular economy models. Enterprises have to initiate also and to support the evolution of new circular economy supporting technologies and introduce novel circular economy business models (Levický et al., 2021; Polyakov et al, 2022). This area is presumed to be extremely sensitive to the alteration of the environment. It is assumed that the lack of activity in the introduction of the circular economy in this area is also related to a lack of information regarding the benefits of the circular economy and related concerns about the financial burden of implementing changes. To overcome many barriers, researchers and experts articulate the need to develop new circular economy policies that are built on a strategic platform of actors’ willingness to make changes and solve current challenges. Financial indicators are also a crucial subject of circular economy research (Horbach and Rammer, 2020). Attention is also paid to political dynamics as a new phenomenon in the creation and implementation of circular economy policies (Duygan et al., 2019).
ConclusionThe circular economy is an increasingly pressing concern on a global scale and is intensively correlated with contemporary sustainable development goals. The principles of the circular economy are supported by multiple action plans and progress is measured using several indicators. In recent years, the circular economy is perceived as a policy to minimise the burden of modern consumption on the environment and as a tool for advancing sustainable socioeconomic systems.
This study confirmed that regulating the circular economy is not only about following green principles, but policies must also support key concerns and meet the criteria established by the important indicators identified in the field. Although it is not a statistically significant indicator, biowaste has a substantial role in the circular economy as a quantified measure that is assigned to each inhabitant in the world that is fundamental for revealing the circular economic chain. Increasing biowaste value also raises the circular material use rate by 1.67 . 10−2. The workforce employed in the circular economy sector is the further statistically not significant indicator, but as mentioned in the analytical section, it brings a decrease to the circular material use rate with the estimated coefficient of 2.83. The circular economy sector gross investment in tangible goods behave in the two different ways – firstly through an decrease of the circular material use rate from a perspective of an expression in the currency units via the regression coefficient of -1.93 . 10−3 and secondly, an increase in the terms of its expression as the share of the gross domestic product via the regression coefficient of 18.05. A further addition to the circular material use rate is caused by the circular economy sector value added at factor cost at a level of 4.67 . 10−4 and by the construction and demolition waste recovery rate at a level of 1.24 . 10−2. The packaging waste recycling rate is a considerably statistically significant indicator. The glass packaging waste recycling rate and the metallic packaging waste recycling rate brings to the circular material use rate a decrease at a level of -1.17 . 10−1 and an increase at a level of 4.20 . 10−2 respectively. This is a crucial insight for setting sorted waste collection policy to determine how individual types of waste influence the circular material mass. Finally, the municipal waste causes a decrease of the circular material use rate. It is well understandable as the higher of the not sorted waste, the lower potential for circulation of material.
The boundaries of circular economy definitions remain unclear, regardless of the overriding fact that its development and implementation into country policies requires the application of the specific methods and measurement tools. Several international agencies propose various support mechanisms with elementary methodologies and indicators that are insufficient. The growing necessity of quantifying the dimensions of the circular economy has generated pressure for holistic evaluations that include environmental, economic, social, and technical aspects of the circular economy sector.
The outcomes of the study support the development of programmes to implement effective circular economy strategies that are responsive to a review of the existing goals in the field and set new ones. This study emphasises the necessity of systematic implementation of analyses and verification of the assumptions upon which current goals and policies within circular economy are based. In this process, active sectoral collaboration with the business sector is essential for effectively designing new strategies and policies that make the introduction of circular economy programmes as motivating as possible. At the same time, new policies should actively strive to eliminate barriers of circular economy introduction for enterprises and support the implementation of the new technologies and innovative processes. The study and its outcomes are highly beneficial for policymaking, strategic development of circular economy programmes, and for the business sphere and institutions operating in the various sectors.
Ethical approvalAll procedures performed in studies involving human participants were in accordance with the ethical standards of the institutional and/or national research committee and with the 1964 Helsinki declaration and its later amendments or comparable ethical standards.
This work was supported by the Slovak Research and Development Agency under the Contract no. APVV-21-0188: Development of concepts of strategic investment and development packages for regions of Slovakia with a causal link to the creation of methodology for quantifying their effectiveness and efficiency.