


Globally, energy is considered a backbone for any country's sustainable growth. However, Pakistan has still encountered a massive energy crisis that affects its society economically. Therefore, policymakers keenly focused on distinguishing factors contributing to Pakistan's sustainable energy plan in the current scenario. Given the importance, it is vital to examine technological innovation, institutional quality, public-private partnerships in energy, and GDP with electricity consumption from 1980 to 2019. The study uses novel dynamic ARDL simulations, and Cumulative Fourier Frequency Domain Causality (CFFDC) approaches for empirical estimation. The findings show that GDP and institutional quality have an affirmative short- and long-run effect on energy consumption. On the other hand, technological innovation has a long-term positive influence on electricity consumption. In contrast, public-private partnerships in energy were found insignificant. The outcomes suggest that technological innovation, institutional quality, and GDP are the most effective determinants and have the greatest effect on energy consumption. Other problems must be addressed, such as pervasive corruption and bureaucratic complexities, underdeveloped grids, and insufficient resource management.
Augmented Dickey-Fuller 15
Augmented Mean Group 6
Autoregressive Distributed lag 1
Breusch_Pagan_Godfrey 14
Common Correlated Effects Mean Group 6
Cumulative Fourier Frequency Domain Causality 1
Energy Consumption 5
Fully Modified Ordinary Least Squares 7
Gross Domestic Product 1
Generalized Method of Moments 6
Index Decomposition Methods 4
Institutional Quality 6
Kwiatkowski–Phillips–Schmidt–Shin 15
Mean Group 6
megawatt 2
Phillips–Perron 15
Public-Private Partnerships 7
Total Factor Energy Efficiency 6
Technological Innovation 5
Vector Error Correction Modeling 5
Electricity is considered the lifeline of every economy and an essential tool for a country's socioeconomic growth. In operating machinery in factories and manufacturing units, electricity is vital for lighting our cities. Every government's main problem is ensuring energy access for industry and providing expanded access to society's weak sectors. As a result of economic progress and population growth, energy demand has grown tremendously compared with energy production. Consequently, energy availability is much less than the actual demand, which is the cause of various challenges (ICCI, 2013).
Over the past several decades, many nations have dealt with power sector restructuring and privatizing. Developed nations started the energy sector reformation process before spreading to developing economies. Asian nations joined the reform movement in the 1980s and made steps to reorganize and dismantle their power industries. The primary motive for deregulation in industrialized nations is a rise in the production and productivity of the electrical sector due to the inclusion of competition in electricity generation and transmission (Ahmed & Bhatti, 2019). In terms of emerging economies, the motivations for the reform proposals are twofold: first, to spur private sector participation in the industry for competition, and second, to reconfigure electricity prices as per the real cost of producing energy such that electricity services can be conveyed to each sector at the least possible tariff levels. State power firms charge higher prices than their marginal cost to profit from monopolies. Excessive prices, resource waste, corruption, a lack of R&D investment, a huge circular debt, poor maintenance, and insufficient power supply characterize these. However, pricing matches marginal costs in an adequately balanced market; therefore, private businesses cannot generate excess profits. There are no barriers to entrance or leave, and new participants with possibilities for increased revenue will enter the sector (Ahmed & Bhatti, 2019).
The energy infrastructure of Pakistan is not well established but is relatively regarded as undersized and feebly maintained. The nation is currently encountering a terrible energy catastrophe. No significant effort has been made to build new generation capacity amid steady economic progress and the rising energy demand over the past years. The situation has deteriorated with rapid development in demand, line losses due to obsolete structure, energy theft, and seasonal drops in hydroelectric supply. Consequently, demand surpasses supply, and thus load-shedding is a widespread occurrence of power closure. Pakistan inherited 60MW of electricity generating capacity for 31.5 million at the time of independence, yielding 4.5 units’ per capita usage. Twelve years later, the production capacity had risen to 119 MW when WAPDA was formed in 1959. In 1964–65, the capacity to produce electricity grew from 119 in 1959 to 636 MW, from 781 MKWH to around 2.500 MKWH. The rapid development witnessed a new life for the country's social, technological, and economic institutions; mechanized agriculture began, gained industrialization, and improved overall living standards. The challenge of speeding up the rate of power production was chosen promptly, and by 1970, with the construction of a range of thermal and hydel power units, the generating capacity increased from 636 MW to 1331 MW in another five years (PES, 2019).
The Asian Development Bank reported that 45% of Pakistan's population was deprived of electricity access in 2006. The energy crisis in Pakistan deteriorated in 2008 as energy shortages rose to 4000 MW. Owing to the low water levels at hydroelectric dams, Pakistan's industrial consumers faced an electricity deficit (ICCI, 2013). The year 2011 began with a shortfall of electricity and the worst load shedding of all time and ended with the same condition. Summers are the worst time for people in Pakistan, where up to 16 to 18 h of load shedding is observed in some places; however, winters are also the vilest, with up to 8 h of power cut-off. Electricity shortages triggered factory losses, which caused many closures and work losses for Pakistani citizens. The energy sector in Pakistan has long been a governmental monopoly. The liberalization process involved separating the highly productive segment (i.e., power generation) from the true free market fraction of the electricity industry (i.e., transmission and distribution) and splitting the natural monopoly portion of the industry into transmission and distribution networks. The industry's network rudiments are subject to lawmaking, and distribution utilities also function as retail electricity suppliers (A. J. Khan, 2014). Also, by the end of December 2018, the circular debt was about 1000 billion rupees; the energy sector for the new government was a big challenge as abrupt steps were needed to revive a collapsed industry. The transmission sector has also reformed since introducing more than 10,000 MW of new generation capacity over the past five years, whereas the distribution sector has been malformed. To cope with this situation, many studies (Lin & Yousaf, 2021; Pao & Fu, 2013; Rehman et al., 2021; Sakah et al., 2019) concentrated on distinctive factors to overcome energy challenges but could not build a firm consensus. Given this backdrop, it is pivotal to pinpoint the distinguishing factors that may contribute to robust policymaking and helps in the precision of Pakistan's energy challenges.
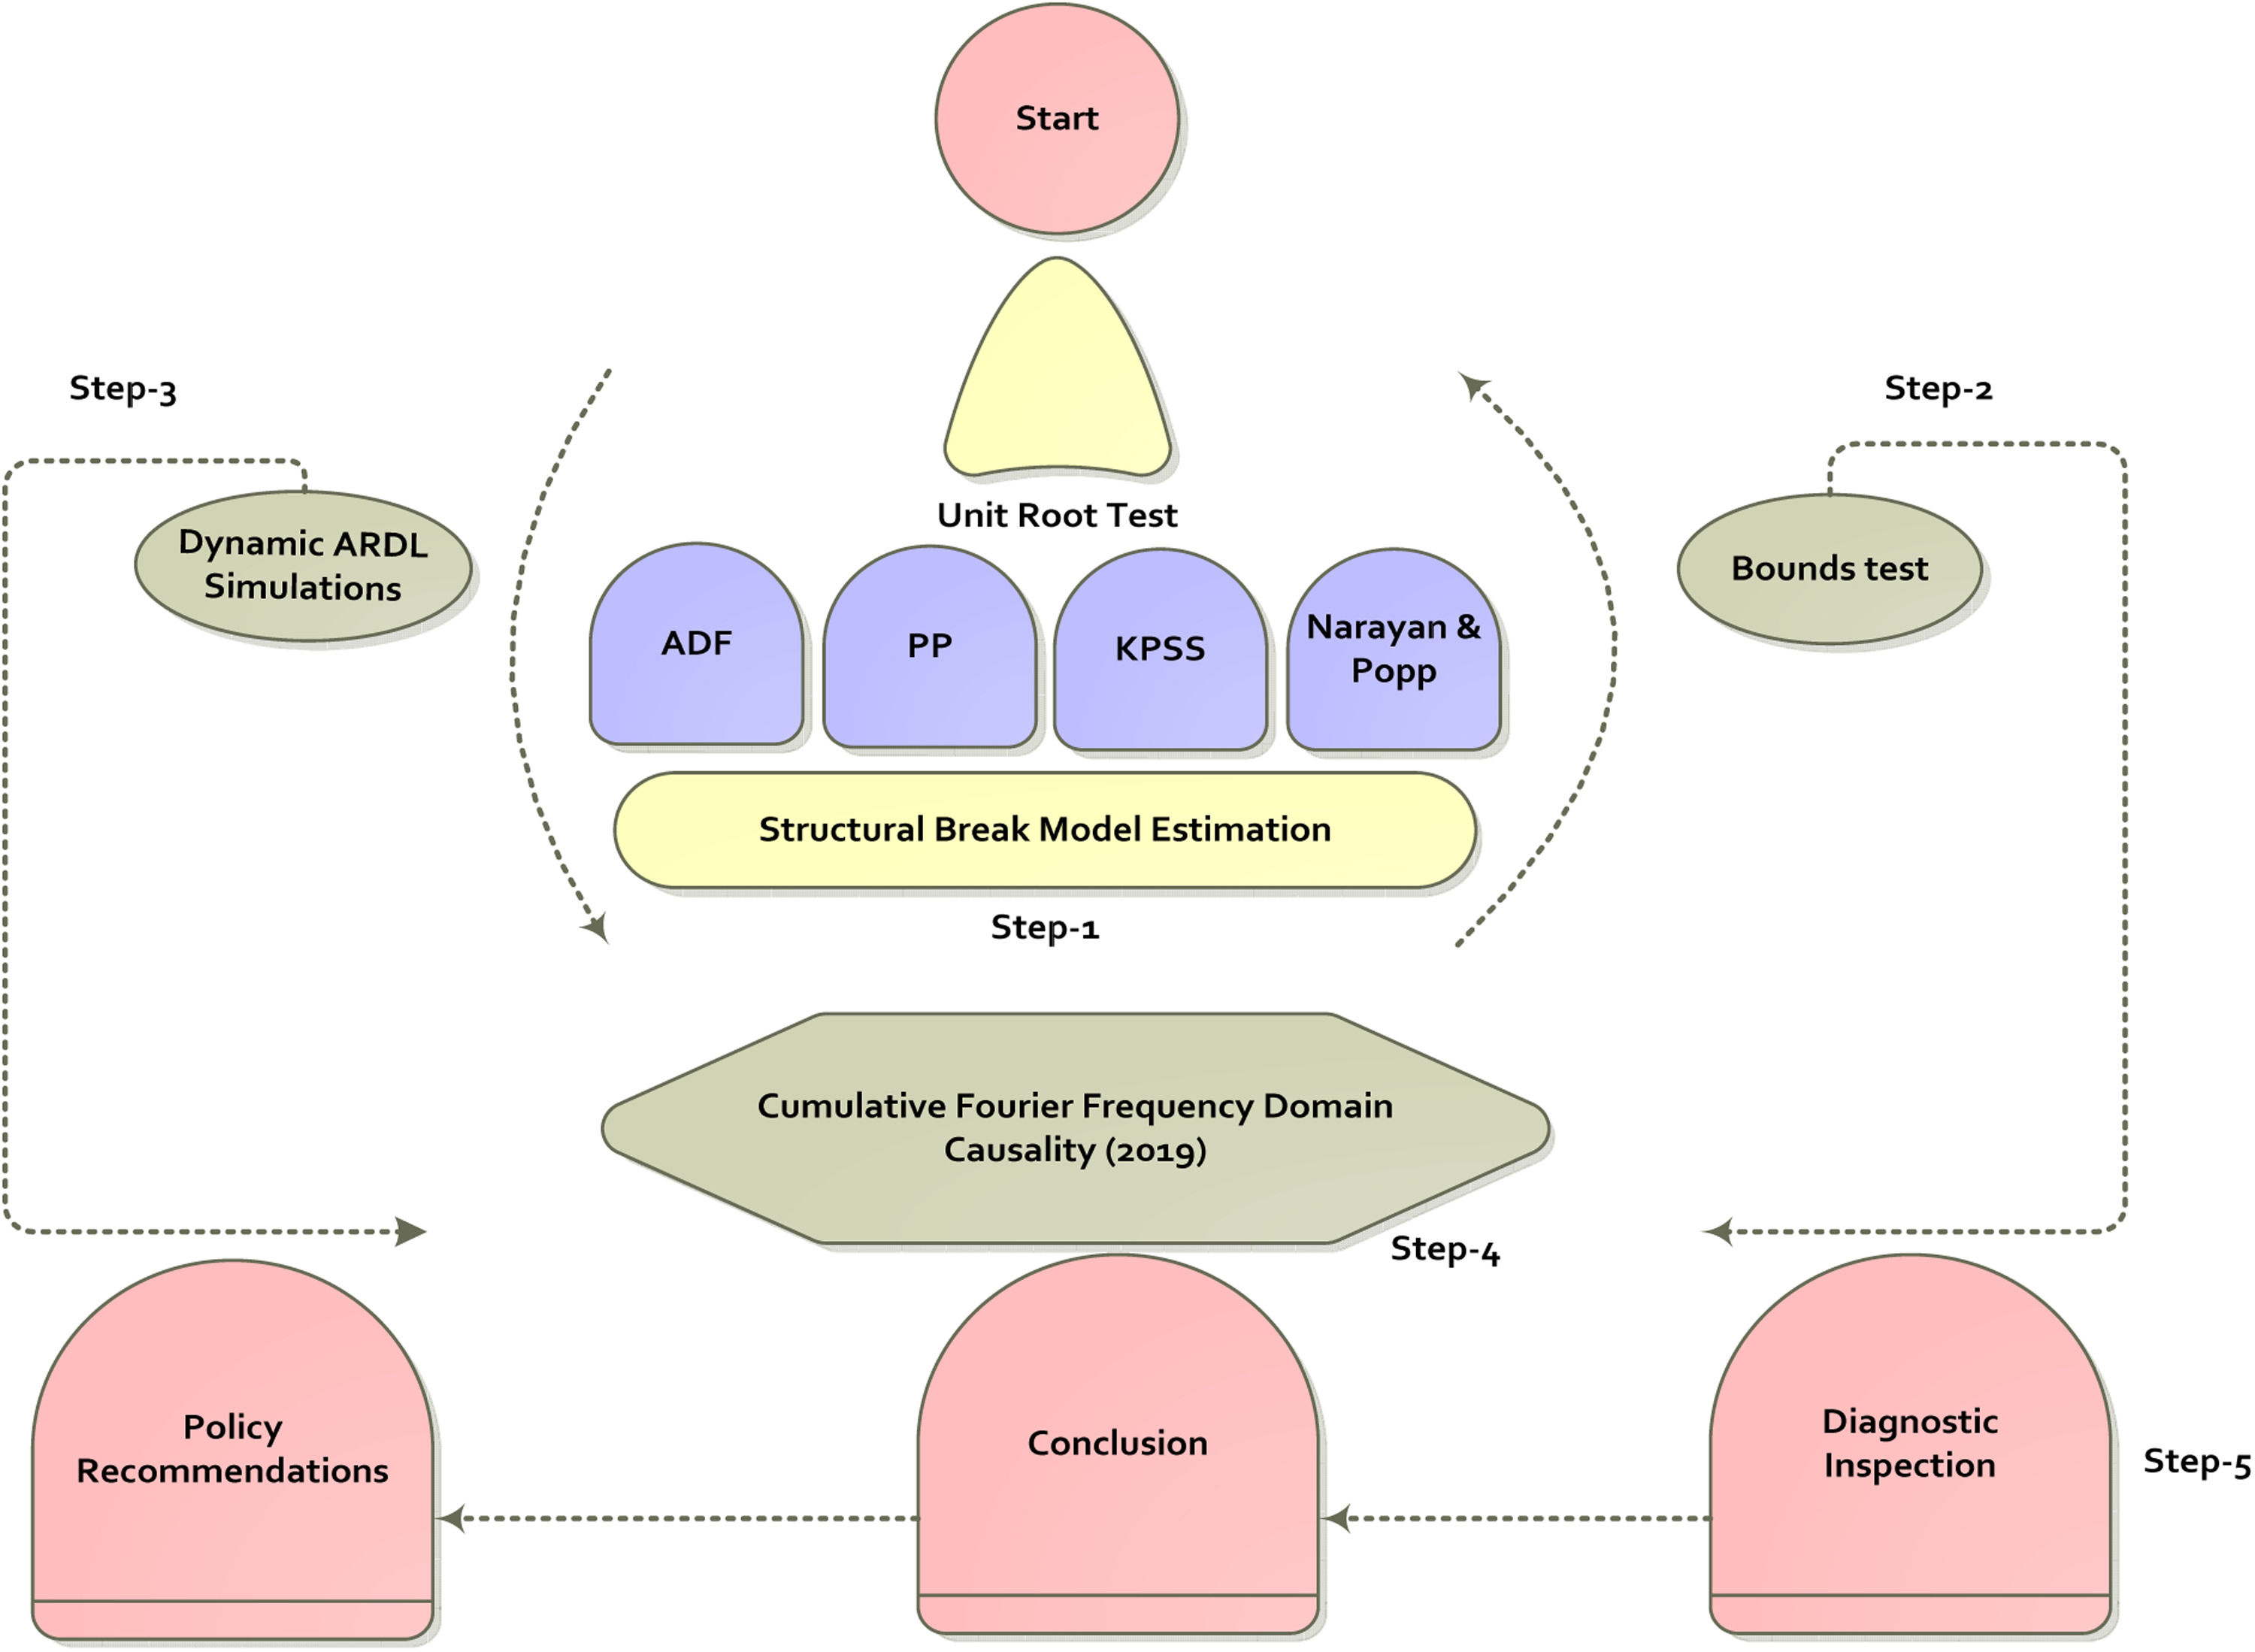
With this motivation, the study makes the following contributions: first, we examine the effects of technological innovation, institutional quality, public-private partnerships in energy, and GDP on Pakistan's energy consumption from 1980 to 2019. Second, unlike other studies, this is the first to identify distinct factors overlooked in previous studies. Third, the research adopted a unique dynamic Autoregressive Distributed Lag Simulations (ARDLS) approach developed by Jordan and Philips (2018, 2019) to examine the short and long-run relationship between the variables. The dynamic ARDLS technique has the distinct benefit of identifying short- and long-run associations and triggering, estimating, and generating graphs in real-time to predict positive and negative changes in variables. Four, the research applies a structural break test recently devised by Ditzen et al. (2021) to eliminate data redundancy and give a robust policy framework. Five many studies in the energy literature in Pakistan employed Granger causality, but none used Cumulative Fourier Frequency Domain Causality, 2019 (CFFDC). The advantage of CFFDC is the capability to address structural breaks. Due to the fact that missing structural breakdowns in a VAR model resulted in a misspecification mistake based on Monte Carlo simulations (Enders & Jones, 2016). Thus, our study uses the CFFDC technique to determine the causal link. Lastly, we adopted the most appropriate method to address the problem and proposed a robust policy framework to assist Pakistani legislators. Fig. 1 depicts the study variables' max, min and mean values.

The rest of the research is systematized as follows: Section 2: the literature addressed previous research. Section 3 conceptual and methodological framework Section 4: results and discussion Section 5: conclusion and policy suggestions.
Literature reviewThe link between energy use and economic growth has been empirically scrutinized in several studies stretching back to the last decades in the energy economics literature. Many studies analyzed energy use, non-renewable energy, industrial value-added, and economic development. The research focused on the relevant studies, splitting the literature into four sections.
Related studies on electricity consumption in PakistanFurthermore, (Lin & Yousaf, 2021) used Index Decomposition Methods (IDM) to assess Pakistan's electricity usage from 1989 to 2018 using the proportion of energy usage, economic growth, energy intensity, economy per capita, and population. Besides, an effective decoupling research approach is used to determine the association between relevant variables and sustainable development mechanisms at the sectoral and national levels. The findings show that the structural economic sector's influence was the crucial driving force for escalating electricity demand in Pakistan, with positive energy intensity variations. (Abbasi et al., 2021) examined the link between electricity consumption, electricity prices, and GDP for different sectors in Pakistan by employing Johansen cointegration and the VECM model. The results indicated a long-term association between industrial and domestic sectors and aggregate. The commercial and agricultural sectors found a long-term association between the feedback effect on electricity consumption to prices. Also, unidirectional causality has been observed throughout all sectors, excluding aggregate. Furthermore, (Alvi et al., 2018) measured the extent of the direct rebound impact of household energy use in Pakistan utilizing time series data spanning 1973–2016. Cointegration econometric methodology and error correction model was used. The findings show that the direct rebound effect's extent is 69.5% in the long term and 42.9% in the short run. Furthermore, climate change has shown that energy use is rising climate change in the short and long term. (Khalid & Sunikka-Blank, 2018) established numerous patterns for urban housing spatial structures that have arisen, continued and evolved, contributing to excessive energy usage levels in middle-class household members. A mixed method of collecting data was introduced, including a study of archival materials, construction guidelines, house designs, case studies, oral history accounts, and interview guides. They uncovered three main concepts crucial to understanding the growing demand for housing electricity moving from outside to interior operations, shifting from interior to exterior architecture, and structural diffusion of activities. (Rehman et al., 2020) analyzed the energy output from various sources in Pakistan and related such resources to economic development. The ADF test verified the parameters' consistency, whereas the ARDL bounds test confirmed the long-term association amid the analysis factors. The results indicated that electricity generated from coal, hydropower, natural gas, and nuclear sources has a major effect on Pakistan's economic development. (Shahid et al., 2020) examined several supply-side situations to identify the best rival of trade as the normal situation and technically aimed to maximize the share of renewable energy in electricity production. Utilized Pakistan's energy sector as a case study and forecasts electricity demand in all industries. The results suggested that commercial enterprise's power generation is costlier than solar, wind, and hydel.
Technological innovation (TI) and energy consumption (EC)The association between technological progress and energy usage has evoked much attention in prior research over the last couple of decades. Determining the consequences of technical innovation on sustainable development is vital when evaluating energy policy. Many studies, such as (Muhsin Ali et al., 2020), examined technological innovation's relationship with consumption-based emissions in China, while Pakistan (Minhaj Ali et al., 2022) applied ARDL and FDC approaches. Moreover, Turkey and Japan (Abbasi et al., 2022; Adebayo & Kirikkaleli, 2021; Beton Kalmaz & Kirikkaleli, 2019) utilized ARDL, FMOLS, and DOLS estimators and revealed the importance of technological innovation. (Wahab et al., 2020) explored the effect of energy intensity, international trade, and, in particular, the distinction between exports and imports and TI and economic output on consumption-based carbon emissions for the G-7 nations between 1996 and 2017. Cross-section dependency and slope heterogeneity determined the unit root test. The CS-ARDL model was used to examine both long- and short-term connections; the AMG and CCMG tests were employed to assess robustness. Their results indicated that energy intensity, exports, and technical innovation are adversely linked to consumption-based carbon emissions in the G-7 nations. In contrast, imports and gross domestic product are positively connected to consumption-based carbon pollution. On the other hand, (WJin & Zhang, 2016) demonstrated that technological innovation could reduce energy usage. Contrary to this, (Fei & Rasiah, 2014), concentrating on the connection between EC and TI, concluded that TI does not affect the long-term variance in energy output. Additionally, (Wang & Wang, 2020) investigated the TFEE of cities in China and the effect of TI on TFEE. A two-stage study method performed covering the years 2001 to 2013 was performed. According to the Malmquist-DEA results, the TFEE of Chinese cities is increasing overall. Still, significant discrepancies exist between the four regions, with the eastern region having the highest TFEE, the central region having the second-highest TFEE, the northeastern region having a lower TFEE, and the western region having the lowest TFEE. The GMM regression findings indicated that technological innovation substantially affects TFEE at the country level. (Tang & Tan, 2013) discovered that TI drives EC and has had a detrimental impact on Malaysia's EC. Compared to the direct burning of fossil fuels, electricity use may help improve the environment since RE is more ecologically benign. (Irandoust, 2016) claimed that TI produces RE, whereas (Abul, 2016; Adedoyin et al., 2020) endorsed that TI has a beneficial impact on the spread of RE. Each of the research above is based on a certain kind of energy. (Adewale Alola, 2021; Adewale Alola et al., 2021; Alola et al., 2019, 2019; Du & Yan, 2009; Sohag et al., 2015) evaluated the connection between EC, TI, and ED and concluded that TI lessens EC, which results in energy efficiency. At the same time, there was considerable variation across the counties.
Institutional quality and energy consumptionThe empirical research on institutional quality and energy use in underdeveloped nations, particularly rising economies, is limited. As a result, the current study looks at the importance of institutional quality. Pakistan has a high level of energy use, resulting in high energy demand. (Wirth, 2014) investigated how communities organize the execution of biogas firms in Northern Italy's Autonomous Province of South Tyrol. The results imply that a 'community spirit,' a cooperative culture, and principles of locality and responsibility all had a significant role in developing and forming biogas firms. (Cifor et al., 2015) assessed the possibility and practicality of structured markets by examining the technical mechanisms of the western power grid and its political, institutional, economic, legal, and cultural characteristics. (Chang & Wang, 2017) studied the growth and use of maritime, renewable energy in China, but not developers' legal assistance. He found that China's government cannot provide institutional support for substantial marine renewable energy development, resulting in sluggish growth. (Meo et al., 2021) used the non-linear ARDL model to investigate the asymmetric effect of EC and IQ on TA in Pakistan from 1984 to 2017. The outcome of the bounds test showed cointegration and suggested an unbalanced link between EC, IQ, and TA in the short run. (Haldar & Sethi, 2021) examined the effect of IQ in reducing the impact of EC on CO2 emissions in 39 developing nations from 1995 to 2017. To get empirical findings, MG, AMG CCEMG, dynamic system GMM, panel grouped-mean FMOLS, and panel quantile regression were used. Several estimate methods discovered that institutional quality reduces energy usage and carbon emissions. Both IQ and sector-specific EC significantly influence CO2 emissions. (Uzar, 2020) studied the link between RE and IQ in 38 nations over two decades, they concluded that IQ had a favorable impact on RE use in the long term. (Ahmad et al., 2021) examined the impact of economic complexity, IQ, disaggregated EC, and ED on environmental pollution in developing economies between 1984 and 2017. The researchers used an advanced econometric technique, CS-ARDL, for short- and long-run estimates, which allows for variation in slope parameters and dependencies between nations. The findings indicated that RE reduces the EFP while NRE usage increases it.
When it comes to institutional quality in Pakistan, (Ilyas, 2021) analyzed the degree to which users of energy sources may be ascribed to the country's IQ, which focuses on assessing the beneficial effect of institutional quality on the efficiency of essential services. Over 35 years, the demand functions of energy sources (electricity, natural gas, and petroleum products) for four major economic sectors (i.e., residential, industrial, commercial, and agricultural sectors) have been analyzed using the bound testing to cointegration (ARDL) method, which is a variation of the bound testing to cointegration method (1984- 2019). The findings revealed that the quality of an institution has a substantial beneficial effect on energy usage.
Public-private partnerships (PPPs) and energy consumptionMany researchers used time series and panel data sets for single countries and sets of nations to explore the influence of public-private investment on various parameters. For instance (Kirikkaleli & Adebayo, 2021) examined the impact of RE use and PPP in energy on India's consumer-based carbon dioxide emissions from 1990Q1–2015Q4 while balancing TI and ED. The research investigated these dynamics using Maki cointegration, Bayer-Hanck cointegration, FMOLS, DOLS, and FDC tests. The findings indicated cointegration among the determinants; while RE is beneficial for reducing consumption-based carbon dioxide emissions, PPP investment in energy makes a long-run encouraging input, and PPP in energy contributes positively to consumption-based carbon dioxide emissions in the long run. (Shahbaz et al., 2018) used a bootstrapped ARDL cointegration method to investigate the drivers of carbon emissions in the French economy. They utilized R&D as a metric for measuring public energy investment. Their findings showed that public investment in energy leads to energy-efficient technologies, which enhance environmental quality by reducing carbon emissions. The study further shows unidirectional causality from governmental investment in the energy industry to carbon emissions. (Lee et al., 2018) developed a framework for determining the economic benefits obtained from PPP arrangements. The framework aided in developing an empirically amenable specification for the effect of PPPs on the aggregate economy. Empirical evidence revealed that raising the share of PPP investment in GDP increases access to quality infrastructure services while possibly boosting economic growth. (Shahbaz & Balsalobre, 2019) investigated the EKC hypothesis for OECD nations from 1995 - 2016 by reflecting on the critical role of public energy investment, i.e., the public budget for the energy sector. They confirmed the existence of the EKC theory. According to their findings, public investment in the energy industry is favorably related to environmental sustainability.
Notwithstanding a large body of literature inspecting the link between energy consumption, economic growth, and other variables, we are skeptical of any research attempting to examine the impact of technological innovation, institutional quality, and public and private energy investments on energy consumption in Pakistan. This research might be considered a trailblazer in the field of energy-intensive research. Fig. 2 depicts the methodological framework.
Materials and methodsModel construction
The study determines the link between TI, IQ, PPP and GDP with EC. The effect of TI and PPP on EC would help to narrow the gap between now and when structural changes are required at a broader scale αi1,3=∂ECit∂TIandPPPit>0. Additionally, institutional quality is a critical element in regulating energy demand and supply across all economic sectors in Pakistan, making it imperative to evaluate the overall institutional quality for energy management could be positive or negative αi2=∂ECit∂IQit>0or0. Most studies utilized GDP as a key factor in electricity use (Abbasi et al., 2020; Abbasi et al., 2021; Al-bajjali & Yacoub, 2018); they concluded that people could use more power when the economic position improves; hence, increase GDP rise EC αi4=∂ECit∂GDPit>0. Finally, the preeminent econometric formulation will be formed as:

Where GDP, IQ, TI, and PPP stand for gross domestic product, institutional quality, technological innovation, and public-private partnerships. Similarly, εt is the regression error term, α1 to α5 are parameters. Table 1 lists the data sources as well as the variable descriptions.
Description of data.
| Variables | Symbol | Sources | Scale unit |
|---|---|---|---|
| Electricity consumption | EC | (NTDC, 2019) | Gigawatt hour (GWh) |
| Technological innovation | TI | (WDI, 2019) | Combined Patent |
| Institutional quality | IQ | (WDI, 2019) | Ranked (0–100) |
| Public-private partnership in energy | PPP | (WDI, 2019) | (current US$) |
| Gross domestic product | GDP | (WDI, 2019) | Billion |
In this study, the approaches of quantitative and inductive assessment stats are explored. A time-series analysis framework is utilized for empirical objectives. The foremost important aspect of using time series data is removing seasonal fluctuations. The variables are transformed to logarithmic form to eradicate the issue of heteroscedasticity. Estimation approaches based on an ARDL are common in the social sciences. A cointegration test becomes essential when using an ARDL model with error correction. As per (Jordan & Philips, 2018), the Pesaran (2001) ARDL cointegration test is more conventional in limited data, typically used in social sciences when the study sample is lower than 80. Besides that, most statistical programs it does not have a standard application. An ARDL model may incorporate advanced dynamic features involving manifold lags, first differences, and deferred, in addition to error correction. This renders understanding the effects of changes in the independent variable(s), whether short- or long-term, more problematic. (Jordan & Philips, 2018) tackled the problem by creating a flexible function that vigorously facilitates handlers to simulate alternative ARDL models, such as the error correction model. Henceforward, (Jordan & Philips, 2018, 2019) created the dynamic ARDL model to address the shortcomings of the present ARDL model for examining short- and long-term connections between study variables. The dynamic ARDL simulation approach is useful for predicting, stimulating, and anticipating the graph of the immediate change in the regressor and its impact on the regressand, whereas the other parameters in the equation remain stable. For dynamic ARDL simulations use, the variables should be stationary at I(0) or I(I), and cointegration among the variables (Abbasi et al., 2021, 2021; Sarkodie et al., 2019). Because of the novel benefits, the study uses a dynamic ARDLS model to assess the empirical shift in the dependent variables due to a parameter.
Narayan and Popp's structural break unit root testBeforehand performing dynamic ARDLS, we must conduct a unit root test to determine the stationarity and integration of the selected variables. Because of its flexibility, the method can be helpful regardless of variable movement, that is, I(0), I(1), or a mixture of both, and it is a highly trustworthy methodology. Similarly, (M. K. Khan et al., 2019) stated that any non-stationary series might lead to false regression. To ensure that we perform unit-root tests generally inspected through (Dickey & Fuller, 1979), (Phillips & Perron, 1988), and (Kwiatkowski, Phillips, Schmidt, & Shin, 1992), followed by Abbasi et al. (2021).
In addition, given the discrepancies in conventional unit root tests, we use the most recent unit root test, which includes two structural breakdowns proposed by Narayan and Popp (2010). The Monte Carlo simulations by Paresh Kumar Narayan (2013) showed that this unit root test has dependable strength and accurately identifies the breaks' accurate periods. As a result, we decided to use this unit root test to assess the order of each series. They presented two approaches for determining the order of integration. Model-A allows just structural breaks in the intercept, while Model-B allows structural breaks in both the intercept and the slope of the trend feature. To investigate the relationship between the variables, the following model expression is postulated:
where wt is the parameter under consideration, α, φ, ϑ is the first difference amplifier, (wt−wt−1) and (e1t,e2t) are the disturbances terms implied by customarily distributed and white noise, respectively. To avoid serial correlation, the first difference lagged the controlled variable (∑i=1PΔwt−ip) is included in the model, (p) optimal lag order determined by general-to-specific t-stats provided by Hall, (2012). As per (Foon et al., 2016), this method is more efficient than AIC and SBC. DUi,t=1(t>TB,i) and DTi,t=1(t>TB,i)(t−TB,i), i = 1, 2 correspond to the dummy variables indicated in the intercept and slope of the trend function developing over time TB1 and TB2 to detect potential structural breakdowns. The potential break dates TB1 and TB2 are selected using the grid scan or sequential method described in Narayan and Popp (2010). Finally, the t-statistic for w_ is used to compare the H0 of a unit root to the stationary H1 wt−1.Model estimation of structural breaks

Structural breakdowns (or shifting points) in the associations between significant variables can occur in time series or panel time series. Besides that, calculations and forecasts are based on structural breakdown information. Structural weaknesses may influence inferences and suggested policies. Breaks can happen in singles or triples, which can be unknown or well-known. The study utilizes a newly established structural break test (Ditzen et al., 2021) to eliminate data inefficiency and offer a concise policy framework. If the dates of the break can be known, test Hypothesis 1 (no break versus s breaks): If the dates of the break can be identified, then (Andrews, 1993):

If the break dates are not known, the supF test statistic is applied:
τ∈ is a subset of [0, T] s representing every conceivable combination of a breakpoint with a minimum length for each set of η. Bai and Perron provide asymptotic critical values based on the number of breaks s and regressors. Test Hypothesis 2 (No break vs 1 ≤ s ≤ s * breaks) and examine whether a maximum of structural breaks happens. "Double Maximum" test, in which the maximum of the test using hypothesis 1 for the number of pauses between 1 and s is calculated.

For structural breaks are α and q regressor cα,s,q is the CV at a level. While Bai and Perron provide asymptotic CV based on the number of breaks (s) and regressors (q).
ARDL-bounds test approachThe bounds test is used to assess the long-run connection between the variables. To evaluate the long-run connection between the variables, the following ARDL bounds testing technique is developed based on the hypothesis:

Where Δ signifies the first difference, whereas EC, TI, IQ, PPP, and GDP stand for energy consumption, technological innovation, institutional quality, public-private partnerships in energy and gross domestic product; additionally, t–i displays the optimum delays selected by AIC, and φ, ß, analyzing the long-run connection. Following (Abbasi & Adedoyin, 2021) stated that if variables exhibit a long-run connection, we estimated the ARDL model in short and long runs.
Dynamic ARDLSGiven the complexities in the simple ARDL model's, we are convinced to apply the (Jordan & Philips, 2018) model that offers to predict, stimulate, and instantaneously draw probability graphs. The dynamic ARDLS error correction algorithm uses 5000 simulations. Additionally, the graphs determine the real change in the regressor and its effect on the controlled variable. As per (Jordan & Philips, 2018, 2019), the new version of the dynamic ARDLS for error correction is as follows:
Cumulative Fourier frequency domain causality (CFFDC)
The model developed by Toda and Yamamoto, (1995) is derived from the vector autoregressive (VAR) model proposed by Sims (1980). When determining the optimum lag length, ρ+dmax is appended to the lag of dmax (the time series' maximum integrated order). As a result, the VAR model's output is untrustworthy (Enders & Jones, 2016; Enders & Lee, 2012). Thus the Fourier Toda - Yamamoto causality test, an invention by Nazlioglu et al. (2016), is developed into five distinct models to capture structural changes in the Granger causality analysis and include smooth shifts. It can also be referred to as the "gradual shift causality test." The Fourier Granger causality test was recently started using a Single Frequency (SF) and Cumulative Frequencies (CF) correspondingly, recognized as the Fourier approach (Nazlioglu et al., 2019). The modified Wald test statistic (MWALT) combines the TY-VAR assessment and Fourier estimation. Considering that the intercept coefficients are constant throughout time, this changes the VAR model as follows:
where yt stands for each model parameter, σ, β, ε, and t for intercept, coefficient vectors, error term, and time expression. The following Fourier expansion is presented in Eq. (10) to represent the structural change:

The frequency magnitude and movement have been determined by γ1k and γ2k, respectively, and n refers to the frequency integer. When Eq. (10) is substituted for Eq. (9), the structural shift is taken into account, and the Fourier causality with cumulative frequencies (CF) is stated as follows in Eq. (11).

The symbol k indicates estimation frequency. Eq. (12) depicts the elements of a single frequency as:

Eq. (9) was replaced for Eq. (10) in Eq. (13) to construct the Fourier causality with a single frequency as:

The H0 for non-causality is tested in this case (H0: ß1 = ß0 = 0), and the Wald statistic can be employed to confirm the assumption. This research also uses diagnostic tests to evaluate the model stability of CUSUM OLS. The Breusch_Godfrey Lagrange multiplier confirms serial correlation (LM). The Breusch_Pagan_Godfrey (BG) verifies heteroscedasticity. Lastly, the Ramsey reset test is utilized for the model specification test.
Results and discussionDescription statisticsThe descriptive statistic provided in Table 2 is used to consider the characteristics of the series. Table 2 describes a statistical summary, including the factors' mean and the max, min, and SD for each. Pakistan's energy consumption ranges from 3.941 to 5.045, with a mean value of 4.591 throughout the research period. It also displays the peak via Kurtosis and the normal distribution pattern, which supports Jarque-Bera test data, in which the mean PPP is 20.820 higher than other series. The outcomes illustrate an upward trend in the EC, GDP, TI, IQ, and PPP.
Descriptive statistics.
The first stage is to check the variables' links to confirm order I(1) or I(0), particularly the described variable. Second, incorporate all variables of order one or show the seasonal unit root. To satisfy the criteria, we first investigate the order of integration using the ADF, PP, and KPSS tests. The empirical results in Table 3 indicate that none of the series is stable at I. (2). The empirical data show that the results of the ADF, PP, and KPSS tests are mixed, indicating that all variables are stable at the level and first difference, which allows us to proceed next step.
Unit root analysis.
Notes: (abc) denotes 1%, 5% and 10%.
Furthermore, Narayan and Popp's two structural breaks test was used to eliminate the possibility that conventional unit root tests are biased and incorrect when confronted with a structural break (s). According to the outcomes in Table 4, all parameters are steady at the 1, 5, and 10% levels; that confirms integration for all the data series, and the observations are appropriate for applying the dynamic ARDL bounds testing procedure.
Structural break estimationRecently, (Ditzen et al., 2021) established a technique for predicting model structural breakdowns. The research utilized structural break estimates in the model to offer more precise information and predictions for improved policy implications, as shown in Table 5. The findings indicate that at the 1% level, t-stats values are higher than Bai & Perron's critical values. This means that between 1988 and 2004, Pakistan experienced various internal and external issues that impacted its economic sectors and posed a significant threat to its stability. Pakistan successfully transitioned to parliamentary democratic rule over nearly a decade (1988–1999). The floods in India and Pakistan in 1992 were the worst storm in history, destroying the agricultural sector (Shafqat, 1999). They were brought on by monsoon rains and severe weather (Saeed et al., 2006).
In contrast, in 1992, the Pakistani government launched Operation Clean-up in Karachi, the country's economic engine; therefore, the shock manifested in the projected breakpoint (Shah, 2015). Political instability, law and order issues, and the Ind-Pak Kargil conflict were the main problems of the 1990s. As a result, over 1000 people were killed by both parties (BBC, 2019). We might suggest that, in the past, Pakistan has faced many difficulties, which have been a significant impediment to Pakistan's economic development and should not be replicated. When it comes to developing a long-term, sustainable policy for Pakistan, the result should be considered.
ARDL bounds estimationFollowing the completion of the requirements, the next stage is to verify the relationships between variables, as previously stated. Regardless of short-run interruptions that may cause a series inconsistency, the disparity is balanced when the series recovers to a stable long-run connection. It is necessary to validate the accuracy of cointegration among the parameters before continuing. Table 6 shows the ARDL bounds test with suitable CV and calculated p-values proposed by Kripfganz and Schneider, (2019). The predicted model's F- and T-statistics values surpass the upper critical limit, as demonstrated by the hypothesis that generated p-values are substantially positive, as determined by the ARDL bounds test. As a result, H0 is rejected, confirming the variables' cointegration.
Dynamic ARDL simulations estimationThe outcomes are reported in Table 7. Further, technological innovation (TI) is significant and optimizes electricity consumption in the long term. A 1% increment in TI results in a 0.05% escalation in energy usage. The results corroborate (L. Jin et al., 2018) findings that technical innovation increases energy consumption; in contrast, (Murad et al., 2019) explored higher technological innovation decreases energy consumption. The outcome determined that TI can play a crucial role alleviates energy-related problems in Pakistan. Also, we investigate the effect of IQ on EC. The coefficients show a positively significant trend in the short and long-run, implying a 1% increase in IQ increases EC by 0.19% and 0.11%, respectively. It indicates that in growing economies like Pakistan, IQ increases EC. The findings support the notion that a high degree of institutional quality influences the country's ability to utilize alternative energy sources such as renewables and avoid dependence on oil and fossil, which is expensive. The outcomes align with (Azam et al., 2021) reported that IQ stimulates EC, and despite improvements in institutions, emerging nations continue to depend heavily on oil-based energy. Additionally, PPP is revealed as insignificant in both the short and long run.
Dynamic ARDLS assessment.
Note: (abc) symbolize 10%, 5%, and 1%.
The short and long-run GDP coefficients show a statistically significant effect on energy usage. A 1% rise in GDP upsurges EC by 0.10 percent to 0.64 percent on average. The findings are similar to those (Adams et al., 2018; Ben-Salha et al., 2018; Shahbaz et al., 2018) concluded that EG has a considerable impact on the country's EC. The R-squared result indicates that the regressors employed in this study account for 64% of the variations in regressand. The p-value obtained using F-statistics suggests that the model is appropriate. The results confirm our GDP, IQ, and TI hypotheses, while PPP was noticed insignificantly.
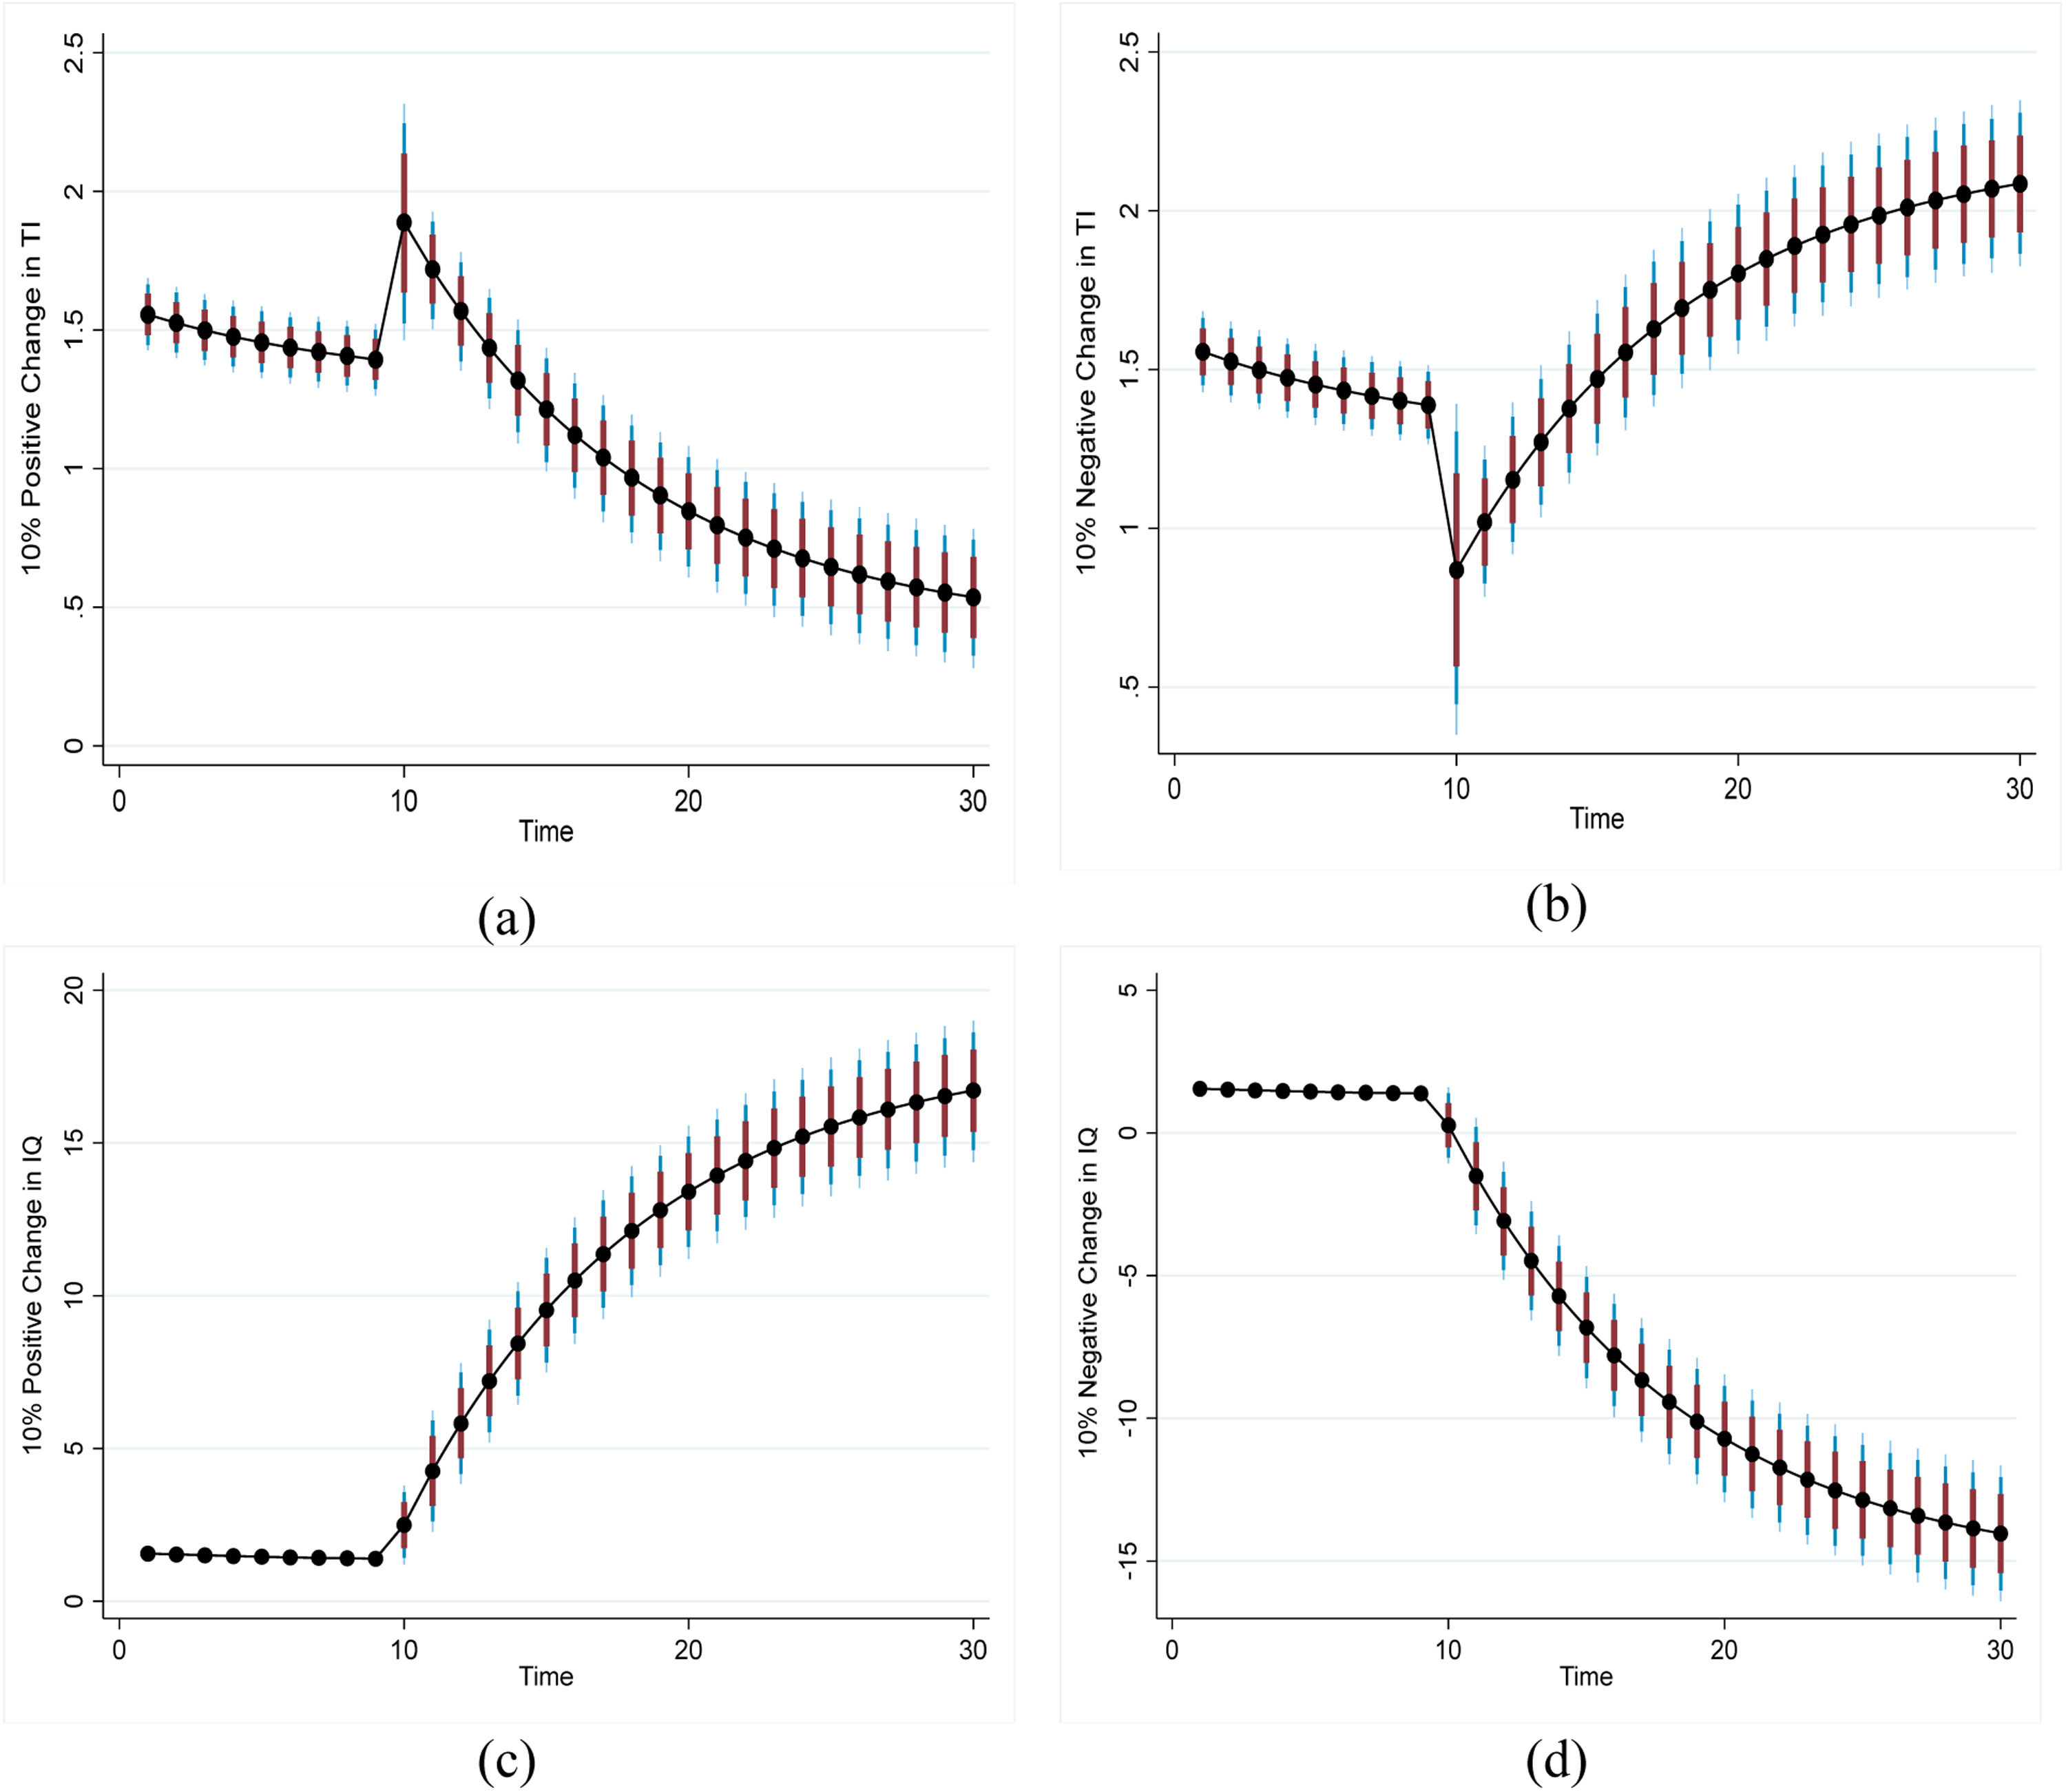
Fig. 3 (a-d) forecasts TI and IQ's positive and negative effects on EC. A 10% rise in TI reflects the short- and long-run reductions in EC. A 10% reduction in TI increases EC and vice versa. As a result, infer that TI shifts consumers away from fossil fuels and encourages them to use renewable energy. However, decreasing TI eventually increases fossil fuel energy use. Suggesting that technical innovation is possible since Pakistan is rich in natural resources, including wind, solar, and hydro; all required is to facilitate consumers. Besides, Fig. 3 (c-d) shows a Positive change in IQ shows an increase in energy consumption, but an adverse change in IQ slightly decreased. It states that improvements in institutional quality led to extended energy efficiency, which is necessary for the country's long-term development.

Fig. 4 (a-d) depicts positive and negative changes in PPP and GDP. Figure (a-b) shows declines in response to rising and falls in public-private partnerships. In the short and long term, positive and negative changes in PPP are unfavorable for Pakistan. However, it is well established that public-private partnerships have a major effect on infrastructure development and assist in achieving the country's short and long-term goals. But, in the case of Pakistan, there is a need to reassess and carefully consider the public-private partnerships' pros and cons. Moreover, a 10% growth in GDP grows EC in the short and long term, whereas a 10% decrease in GDP has the opposite impact. The findings confirm the hypothesis that economic development leads to increased energy use.
Causality test GDP for EC.' title='The Prediction Plot for PPP and
 Table 8 discloses the outcome of CFFDC. Initially, EC and TI reveal a bidirectional causality. It implies that technical advancements enhance energy efficiency since they reduce the amount of energy a product consumes by operating at the same level of performance. Heating and cooling systems may be used more efficiently due to this reduction in energy consumption. Even though there are many unlike energies available, the most efficient RE sources are hydro, wind, and solar. Solar energy is the most efficient and effective RE source for every sector's usage. The outcomes backing the (Handayani et al., 2019; Wang & Wang, 2020) findings revealed that technological awareness might benefit from reaching energy efficiency goals. Further, institutional quality (IQ) and energy consumption (EC) show a unidirectional relationship confirming that IQ causes EC. Implying that the quality of institutions is critical for the overall management of energy demand and supply across all economic sectors in the nation. However, PPP found no causality evidence.
Cumulative Fourier-frequency Granger Causality Test.
Notes: (abc) represent 10%, 5%, and 1%.
The bidirectional causality between GDP-EC and EC-GDP. The GDP is shown to substantially impact EC in the energy usage model. This implies that energy production and consumption are linked to economic prosperity, supply and demand, and GDP and EC. As a result, we may conclude that Pakistan's economy is energy-dependent, thereby increasing energy consumption is necessary to promote economic development. The outcomes are aligned with (Ameyaw et al., 2017; Saidi & Hammami, 2014; Shahbaz et al., 2018; Zaman et al., 2015) found a favorable relationship between economic development and energy usage.
Diagnostic inspectionAs shown in Table 9, the findings of the diagnostic analysis were obtained for all sectors. Breusch-Godfrey LM tests reveal no indication of serial correlation, which is supported by our findings. The heteroscedasticity concern is investigated using the Breusch-Pagan-Godfrey, and it is discovered that there is no heteroscedasticity; also, the Ramsey RESET test specified that the model had been appropriately defined. The findings show that the model residuals are normally distributed during the JB test.
Further, we use the OLS cumulative sum of recursive residuals (CUSUM) to assess the models' structural stability and the robustness of each sector and aggregate model. Fig. 5 illustrates OLS CUSUM visually. Standard, model parameters are stable over time if plots remain under a crucial limit of 5%. The model trend indicates that, throughout time, the OLS CUSUM graph is significant since the residuals are inside the 5% level bounds.
Discussion of outcome
The outcome reveals that technological innovation (TI), institutional quality (IQ), and GDP significantly relate to energy consumption. Primarily, technological innovation (TI) contributes to developing Pakistan's energy consumption (EC) by expanding its efficiency. The findings indicate that, over the long term, TI contributes to an increment in energy usage. In contrast, (Murad et al., 2019) showed that technological innovation negatively and substantially impacted energy usage in Denmark. The outcomes distinguish from prior studies in the energy literature in which we emphasize the nexus between TI, IQ, PPP, and GDP with energy consumption in Pakistan.
However, Pakistan's energy usage improves as institutional quality improves. Enhancing institutional services may help to alleviate overall energy demand and supply concerns. The findings support (Azam et al., 2021) contention that institutional quality benefits energy usage based on oil and fossil fuel resources. Further, our findings in Pakistan (Ilyas, 2021) show that institutional quality substantially affects energy usage. The findings support the notion that a high degree of institutional quality leads to less efficiency when using alternative energy sources such as oil and fossil fuels in Pakistan.
Also, energy consumption is critical to the economy regarding supply and demand. If energy usage intensifies GDP, it indicates that economies are energy reliant and that energy usage is necessary to promote growth (G et al., 2020). Our results indicate that GDP positively impacts EC, implying that energy efficiency is a robust tool for Pakistan to pursue prosperous and sustainable growth while securing its energy future. The results are consistent (Zhang & Xu, 2012), indicating that economic development increases power usage in China. While (Abbasi et al., 2021) stated that energy plays a significant role in economic development in Pakistan. On the other hand, the results contradict (Tursoy & Resatoglu, 2016), reported that Russia's energy sector does not affect economic development
Conclusion and policy implicationsThe relevance of energy consumption has been thoroughly explored in this research. The study aims to determine the centrality of electricity consumption and the existing electricity consumption competence and suggest applicable and appropriate initiatives for sustainable development in Pakistan. This study explores the relationship between electricity consumption and its determinants in Pakistan from 1980 - 2019. The explanatory factors are technological innovation, institutional quality, public-private partnership, and gross domestic product to analyze the impact on electricity consumption. The research utilizes a new methodological framework and created five models based on sectoral usefulness to accomplish the goal. The study uses a novel ARDL simulation method developed (Jordan & Philips, 2018, 2019). In addition, the Cumulative Fourier Frequency Domain Causality (CFFDC) test used recently proposed by Nazlioglu et al. (2019). Though, multivariate time series data often encounter stationary difficulties. Therefore, ADF, PP, KPSS, and Narayan and Pop (2010) unit root tests were used, which verified that all the series are integrated at I(1) and I(0); none of the series discovered I(2). Additionally, (Ditzen et al., 2021) established a technique for estimating structural breaks in the model, which is helpful for more precise information forecasting and policy implications. Hence, a structural break estimate was utilized in the research for each sector model. The results show that GDP and institutional quality both have a favorable short- and long-run effect on total energy consumption at the aggregate level. Whereas technological innovation has a long-term beneficial effect on aggregate electricity consumption. Infers that, GDP, institutional quality, and technological innovation may contribute significantly to Pakistan's aggregate energy consumption.
Policy recommendationIn light of empirical findings, the policy suggestions are as follows:
The results demonstrate that Pakistan is an energy-dependent country whose economic development has been triggered by sufficient energy supplies. According to the National Electric Power Regulatory Authority's (NEPRA) 2019 yearly report, Pakistan's total installed power generation capacity is 39,000 MW, with thermal (fossil fuels) accounting for 66% of energy, hydro accounting for 24%, renewable (wind, solar, and bagasse accounting for 6%), and nuclear accounting for 4%. The viability of indigenous resources is debatable in the context of high dependence on fossil fuels in the overall energy mix (ITA, 2021). An adequate energy supply is needed to sustain economic activity in Pakistan for the economy to reach its optimum level of economic development. To alleviate the issue of energy scarcity, the government of Pakistan should take significant measures to guarantee the effective use of current energy resources and the macro-level upgrade of conventional energy production capability. Investment in renewable energies would encourage access to low-cost energy for carrying out sectoral operations, which financial institutions and the government might help with. The findings from Pakistan's institutional quality indicate favorable energy consumption. Given the findings, it is advocated that the democratic and legal systems' institutional frameworks be enhanced. Pakistan's major motto should be a stabilizing act of economic and energy countermeasures. Also, it is necessary to enhance the quality of institutions, particularly government competence, to develop better plans and policies for efficient energy. It is also critical to enact measures that improve institutional quality regarding political rights and civil freedoms.
Given the impact of technological innovation on energy consumption, various scientific experts are deemed to be at the core of technological innovation. Authorities in Pakistan's provinces should develop unique, effective human resource policies based on the technical demands of the energy sector to achieve professional talent recruitment techniques that match the structural development. Staffing must be adjusted to promote technical efficiency. The results also indicate that governments should prioritize technical innovation since breakthroughs in clean energy are helpful for efficient and low-cost energy sources. Government should improve its energy strategy and policy direction to address institutional obstacles that impede energy demand and supply implementation. These obstacles are linked to appropriate energy market regulation, renewables installed capacity, research and development (R&D) investment execution, and public knowledge and awareness of renewables usage. Energy regulatory agencies may seek changes to strengthen RE rather than non-RE generation in an energy market with a level playing field. Furthermore, institutions should convey the social component of embracing renewables via an educational perspective to ensure Pakistan's long-term development.
Study limitations and future directionBecause of the limits of our study, future scholars may use a variety of indicators for technological innovation by using new methods, including new related variables to the energy and climate change studies and focusing on several different sample groups. Future studies may introduce panel methods since we focused only on variables directly affecting sectoral energy rather than broader environmental effects. Research could be conducted for each industrialized and developing country to validate the findings over decades.
FundingThis research was supported by Humanities and Social Sciences Research Project of the Ministry of Education of China (Grant No. 20YJC630137); Natural Science Foundation of Hunan Province (Grant No. 20221130232).
CRediT authorship contribution statementLeilei Zhang: Conceptualization, Formal analysis, Software, Data curation, Writing – original draft. Kashif Raza Abbasi: Conceptualization, Formal analysis, Software, Data curation, Writing – original draft. Khadim Hussain: Conceptualization, Writing – review & editing, Methodology, Visualization, Data curation. Mohammed Awad Abuhussain: Conceptualization, Writing – review & editing, Methodology, Visualization, Data curation. Ali Aldersoni: Writing – original draft, Formal analysis, Writing – review & editing. Rafael Alvarado: Writing – review & editing.
Thank you, ILMA University in Karachi, Pakistan, for your appropriate support.