


Multiple studies have examined the effects of financial development on renewable energy consumption, but little is known about its impact on renewable energy innovation. The validity of the Porter Hypothesis (PH) in renewable energy industries—that is, whether stricter environmental policies promote innovation—remains unclear. This study explores the effects of financial market development and environmental policy stringency on renewable energy innovation, as well as whether renewable innovation differs with levels of stringency of environmental policy and levels of development of the financial market. We apply a nonlinear panel threshold model to the 37 member countries of the organization for Economic Co-operation and Development (OECD) from 1990 to 2019. The results show that as financial development increases, its impact gradually declines, and that as environmental policy becomes more stringent, its impact rapidly increases. This finding implies that financial development is associated with greater increases in renewable innovation in countries with a medium level of financial development, and that stricter environmental policies can be used by OECD countries to increase innovation. This study therefore confirms the validity of the PH as well as the financial development effect on renewable innovation in OECD countries. It also finds that international oil prices and the level of research and development expenditure have significantly positive effects on renewable innovation. Policy suggestions for developing financial markets and increasing policy stringency are proposed.
Financial support and policy instruments are effective tools for promoting renewable energy innovation worldwide (Hille & Oelker, 2023). Numerous studies have suggested that financial market development can be used to expand the renewable energy industries (e.g., Anton & Afloarei Nucu, 2020; Lahiani, Mefteh-Wali, Shahbaz, & Vo, 2021; Romero-Castro, Piñeiro-Chousa, & Pérez-Pico, 2021). However, the expansion of financial markets does not necessarily lead to more active innovation (Zhu, Asimakopoulos, & Kim, 2020). Technological and institutional innovation are critical factors in optimizing the energy structure and fulfilling the 1.5 °C Paris Agreement goal (Li & Shao, 2022; Obobisa, 2022). Due to the rapid rebound in the use of non-renewables after the COVID-19 pandemic, the ratio of renewable to total final energy consumption in the 27 European Union (EU) countries in 2021 was 22%, the same as in 2020 (EEA, 2022). Long-term prospects may therefore fall short of the 32% renewable energy target set for 2030 (Nies, 2022). Given the positive effect of innovation in the renewable energy industries on renewable energy consumption (Awijen, Belaïd, Ben Zaied, Hussain, & Ben Lahouel, 2022), research and development (R&D) on renewable innovation should be promoted to meet the 2030 targets and achieve carbon neutrality in the post-pandemic era (Li & Shao, 2021).
Not only can environmental policy curb industrial emissions (Romero-Castro, López-Cabarcos, & Piñeiro-Chousa, 2022), it is also the driving force of renewable innovation (Lian, Xu, & Zhu, 2022). Previous studies focused on whether implementation of a given environmental policy, such as the Clean Development Mechanism (CDM) or the EU Emissions Trading Scheme (ETS), affects renewable innovation (e.g., Cui, Liu, Sun, & Yu, 2020; Chen, Zhang, & Chen, 2021), neglecting the issue of the effects of different policy intensities. The latter topic deserves greater attention, given that renewable innovation often fails in the market, requiring governmental involvement in innovation (Samant, Thakur-Wernz, & Hatfield, 2020). Nevertheless, even if an environmental policy is sound, ineffective enforcement limits its impact (Martínez-Zarzoso, Bengochea-Morancho, & Morales-Lage, 2019).
Accordingly, this study explores the impact of policy stringency on renewable innovation—that is, the validity of the Porter Hypothesis (PH) (Porter & Van Der Linde, 1995) in the renewable energy industries in OECD countries. As the share of renewables in the global power mix reached 28.1% in 2020–2021 (Enerdata, 2022), and as renewables play an essential role in improving energy security and reducing emissions (IEA, 2022), such exploration is essential, and we reveal whether well-designed and stringent environmental policies stimulate innovation in the renewable energy industries. The validity of the PH in that context remains unclear, since it has mostly been applied to high-polluting manufacturing industries, where strict environmental policies are needed to achieve climate mitigation targets (He, Chen, & Liu, 2022; Wang, Zhang, Nathwani, Yang, & Shao, 2022).
We identify three research gaps in the literature on renewable innovation literature. First, few studies investigate the effect of financial development on renewable energy innovation. Second, most studies focus on the implementation of environmental policy, not its stringency. Third, few studies apply the PH to the renewable energy industries. Therefore, this study examines the effects of financial development and environmental policy stringency on renewable energy innovation to determine whether the innovation response differs with varying degrees of environmental policy and varying levels of financial development. We use a panel threshold model to measure the nonlinear effects on the 37 member countries of the organization for Economic Co-operation and Development (OECD) during 1990–2019. We include other potential influencing factors, such as oil prices (Shah, Hiles, & Morley, 2018) and levels of R&D investment (Lin & Zhu, 2019).
This study makes three main contributions. First, we shift the research focus to the renewable energy industries, examining the validity of the PH using a cross-border sample of OECD countries. Second, whereas prior studies used linear models to explore the influencing factors of innovation in renewable energy industries, we use a nonlinear model to explore those relationships in different development phases. Third, we enrich the literature by identifying the role of financial development on renewable innovation, and the stringency—rather than the implementation—of environmental policy is employed to test its impact on renewable innovation.
The rest of this article is organized as follows. Section 2 reviews the literature and proposes the hypotheses. Section 3 presents the nonlinear panel threshold model and explains the variable selection and data sources. Section 4 presents the empirical results and Section 5 discusses the findings. Section 6 concludes and suggests policy implications.
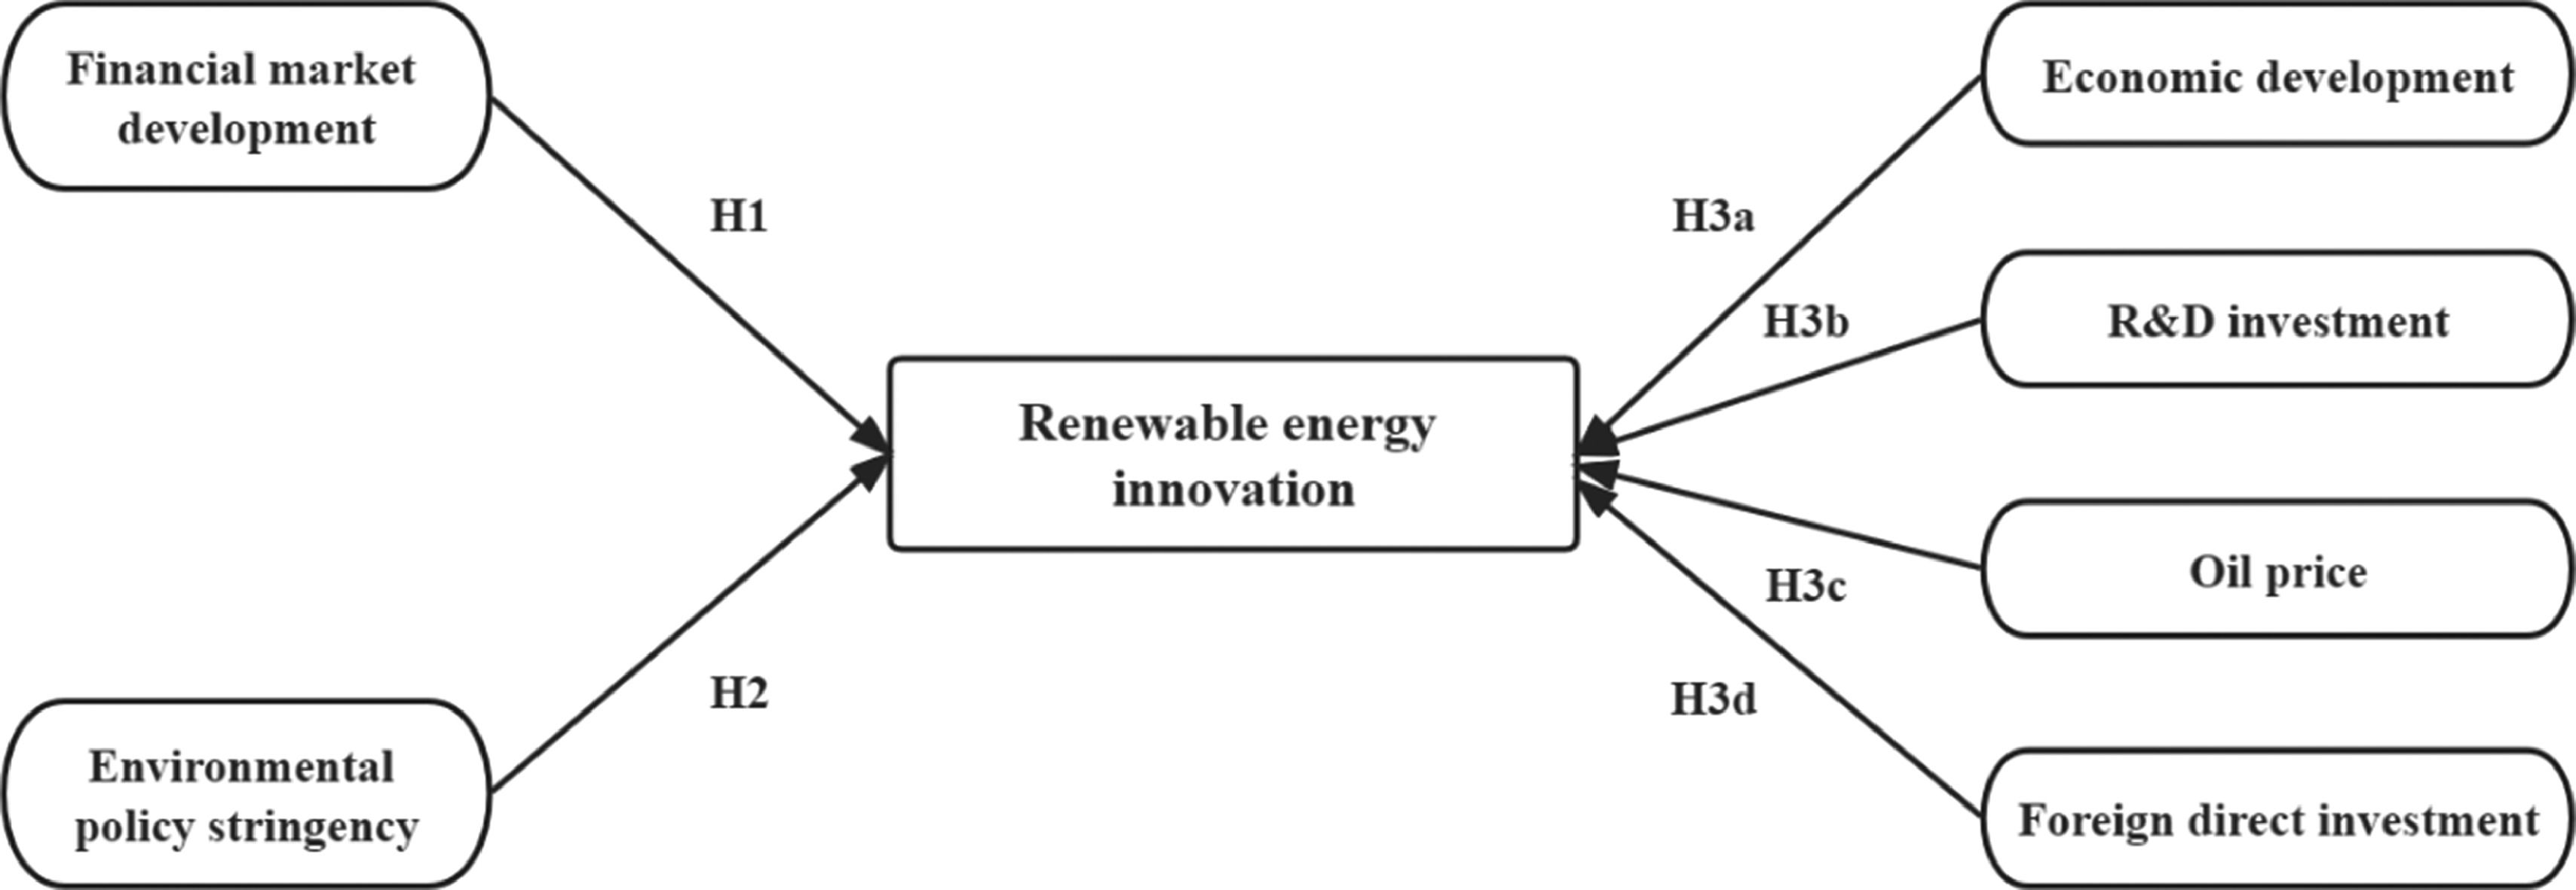
Conceptual frameworkThis section reviews the literature on the driving forces of renewable energy innovation, including financial market development and environmental policy stringency, as well as determinants such as economic development, R&D investment, oil prices, and foreign direct investment (FDI). In particularly, we aim to discuss whether the strict environmental regulation is able to stimulate renewable energy innovation, i.e., the application and verification of the PH in the renewable energy industries.
Effect of financial market development on renewable energy innovationFinancial development plays a vital role in technological progress by optimizing resource allocation and providing loans with low rates and low risk (Acheampong, Amponsah, & Boateng, 2020). Thus, empirical evidence shows a positive relationship between financial market development and renewable energy innovation (Aghaei, Rezagholizadeh, & Abdi, 2019), especially in developed countries with mature financial systems. Using the advanced OECD group as a case study, Pham (2019) confirmed the positive and significant impact of financial development on renewable energy technologies, notably in countries with high carbon intensity and high levels of innovation. In addition, the ETS and CDM—both effective tools in reducing CO2 emissions and combating climate change—have played a financing role by compensating enterprises for the explicit economic costs of the low-carbon transition (Ellis, Winkler, Corfee-Morlot, & Gagnon-Lebrun, 2007; Michaelowa, 2007; Schmidt, Schneider, Rogge, Schuetz, & Hoffmann, 2012).
The impact of carbon finance on renewable energy innovation varies across sectors, and its effects on innovation are mainly seen in energy-intensive industries such as power generation, petrochemicals, and iron & steel milling. This may be because these industries, given their high-pollution and carbon-intensive characteristics, are covered by the ETS. Qi and Zhang (2019) showed that in EU countries, carbon finance, a visible driver of high-quality renewable innovation, has had a significant positive impact on technological innovation in the solar photovoltaic sector, but not in the wind and hydroelectric energy sectors.
Given the likelihood of failure, the public sector should play the primary role in driving financial policies to support renewable innovation (Samant et al., 2020; Zhang, Zheng, Feng, & Chang, 2022). This is because the public sector has the ability to address financial shortfalls and support enterprise innovation at different stages, not least for startups (Owen, Brennan, & Lyon, 2018). More importantly, the public sector can create a demonstration effect, increasing awareness of renewable energy markets and encouraging other investors to support innovation. Noteworthy, the global renewable energy venture capital industry has witnessed a boom and bust cycle over the last two decades; as a result, global climate change agreements have a key role to play in maintaining investors’ confidence in renewable technologies (Gaddy, Sivaram, & O'Sullivan, 2016). However, the finance–innovation nexus is rarely addressed in the literature and deeper analysis is needed. We therefore propose Hypothesis 1:
H1: Financial market development is positively associated with renewable energy innovation.
Effect of environmental policy stringency on renewable energy innovationPrevious studies confirm the validity of the PH in advanced economies. For OECD countries, stricter environmental policies significantly increase the number of patent applications (Martínez-Zarzoso et al., 2019), and greater environmental policy stringency accelerates technological innovation (Hassan & Rousselière, 2022). Despite the increasing costs of controlling environmental pollution and developing clean energy technologies, an optimized energy structure and high energy efficiency are achieved over time.
In a worldwide sample, three clusters of environmental policy, namely development targets for renewable energy, R&D expenditures, and fiscal spending, had the strongest policy effects on solar and wind power-related technologies (Hille, Althammer, & Diederich, 2020). By contrast, in a 33-country sample, Zhang et al. (2022) found that innovation in hydro, geothermal, and marine energies, but not wind and solar energies, was improved with strict environmental policies. With regard to the solar Photovoltaics (PV) and wind power sectors, environmental taxes induce competition regardless of their inhibitory effects on immature technologies; price-based policies such as tariffs are effective in stimulating innovation and are an effective tool for long-term sustainable development (Kim, Heo, & Kim, 2017). In Germany, the feed-in tariff scheme has had positive effects on renewable energy innovation (Böhringer, Cuntz, Harhoff, & Asane-Otoo, 2017). Environmental policy also has various impacts on different types of renewable energies: wind, hydro, PV, and solar energy innovation are significantly affected by environmental policies, whereas geothermal energy is not (Yang, Zheng, & Chang, 2022).
Environmental policy may affect foreign as well as domestic renewable innovation. Herman and Xiang (2019) confirmed the existence of a “policy spillover” effect (Li, Zhu, & Sun, 2021) that depends on the so-called “first mover advantage”: countries that adopt strict environmental regulations will attract foreign capital, technologies and talent through their institutional advantages, then export them to countries that adopt such regulations after developing new clean energy technologies. As such, strict environmental regulation and renewable energy innovation create a virtuous circle in innovative countries. Nevertheless, this effect is usually subject to a lag period, and foreign environmental policies may impact domestic renewable energy innovation before domestic environmental policies (Li et al., 2021). We therefore propose Hypothesis 2:
H2: Environmental policy stringency is positively associated with renewable energy innovation.
Effects of economic development, R&D investment, oil prices, and FDI on renewable energy innovation
Economic development, which provides a favorable environment for renewable energy-related innovation and R&D, is the source of green innovation (Galeotti, Salini, & Verdolini, 2020). Studies have revealed the strongly significant effect of GDP per capita on green innovation in developed OECD countries (e.g., Feng & Zheng, 2022; Zhang et al., 2022). Worldwide, the policy effects of R&D expenditure on solar and wind power innovation are remarkable (Hille et al., 2020), and direct R&D investment promotes renewable innovation in OECD countries (Martínez-Zarzoso et al., 2019). The same effect is found in German renewable energy industries (Plank & Doblinger, 2018).
Owing to the so-called “substitutive effect” (Chang & Su, 2010), enterprises tend to invest more in renewable energies as oil prices increase. Cheon and Urpelainen (2012) confirmed the role of oil prices in boosting energy innovation, and Hu, Wang, Su, and Umar (2022) verified their positive effect on clean technology innovation. We therefore test the positive effect of oil prices on renewable innovation in OECD countries. We expect that FDI has no significant effect on green innovation (Zhang et al., 2022), given that, according to the Pollution Haven Hypothesis (Shao, Wang, Zhou, & Balogh, 2019), cross-border investment flows are primarily motivated by the wish to avoid strict domestic environmental regulations and are therefore unlikely to lead to green innovation. Accordingly, we propose Hypotheses 3a–3d:
H3a: GDP per capita is positively associated with renewable energy innovation.
H3b: R&D investment is positively associated with renewable energy innovation.
H3c: Oil prices are positively associated with renewable energy innovation.
H3d: FDI has no significant association with renewable energy innovation.
Fig. 1 presents the conceptual framework in which this study examines the impact of financial market development level and environmental policy stringency on renewable energy innovation in advanced OECD countries, taking into account economic development, R&D investment, oil prices, and FDI.
MethodSample and data
This study takes as its sample the 37 OECD countries during 1990–2019 because the OECD comprises the vast majority of representative developed countries. The countries in the sample have well-performing financial markets and mature environmental policies, which ensures the reliability and representativeness of the results (Yang et al., 2022).
Dependent variableThe dependent variable is renewable energy innovation (rene), represented by the number of patents granted for renewable energy generation. The data are sourced from the OECD Statistical Database (OECD, 2022), which includes the numbers of renewable energy generation patents for the 37 OECD countries. Our empirical analysis compares the driving factors of varying levels of innovation.
Independent variablesThe independent variables are financial development (finance) and environmental policy stringency (policy).
Following Svirydzenka (2016), we represent financial market development using the Financial Market Index developed by the International Monetary Fund (IMF, 2020). The index value ranges from zero to one. This index has advantages over the World Bank stock market development indicators in terms of multidimensional measurement and broad coverage (Acheampong et al., 2020). We expect financial development to be an important driving factor in renewable innovation.
As the PH indicates, institutional factors have a positive impact on innovation, and strong institutions can stimulate innovation activities and improve efficiency (Park & Ginarte, 1997; Guo, Qu, & Tseng, 2017; Wang & Shao, 2019). Accordingly, we use environmental policy stringency to examine whether and to what extent the policy factor affects renewable energy innovation. Following Ouyang et al. (2019), we use the Environmental Policy Stringency Index from the OECD Statistical Database, which defines stringency as “the degree to which environmental policies put an explicit or implicit price on polluting or other environmentally harmful behaviors” (OECD, 2022). The index ranges from zero to six.
Control variablesThe control variables are GDP per capita (GDP_pc), R&D expenditure (R&D), oil prices (price), and foreign direct investment (FDI).
For consistency with the dependent variable and to avoid bias error, we choose GDP per capita 1990–2019 (OECD, 2022). For convenient international comparison, this indicator is denominated in USD constant prices (2015 purchasing power parity).
To represent R&D, we use the percentage of R&D (including both the private and public sectors) in GDP. Data are sourced from the World Development Indicators Database (WB, 2022). We expect that a larger share of R&D expenditure in an economy will enhance renewable innovation.
As an indicator of oil prices, we use average oil price per barrel. Data are extracted from BP Statistical Review of World Energy 2020 (BP, 2020) and denominated in US dollars per barrel. The values are deflated using the Consumer Price Index for the US, with 2019 as the base year.
To examine the impact of foreign investment renewable innovation, we use the percentage of FDI net inflows in GDP (WB, 2022).
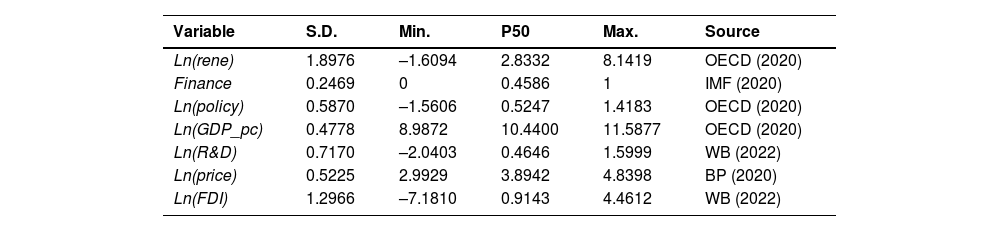
Table 1 displays the summary statistics. All values are logged except for Finance, for which values range between zero and one, following Acheampong et al. (2020).
Summary statistics.
| Variable | S.D. | Min. | P50 | Max. | Source |
|---|---|---|---|---|---|
| Ln(rene) | 1.8976 | –1.6094 | 2.8332 | 8.1419 | OECD (2020) |
| Finance | 0.2469 | 0 | 0.4586 | 1 | IMF (2020) |
| Ln(policy) | 0.5870 | –1.5606 | 0.5247 | 1.4183 | OECD (2020) |
| Ln(GDP_pc) | 0.4778 | 8.9872 | 10.4400 | 11.5877 | OECD (2020) |
| Ln(R&D) | 0.7170 | –2.0403 | 0.4646 | 1.5999 | WB (2022) |
| Ln(price) | 0.5225 | 2.9929 | 3.8942 | 4.8398 | BP (2020) |
| Ln(FDI) | 1.2966 | –7.1810 | 0.9143 | 4.4612 | WB (2022) |
Note: All variables except Finance are logged.
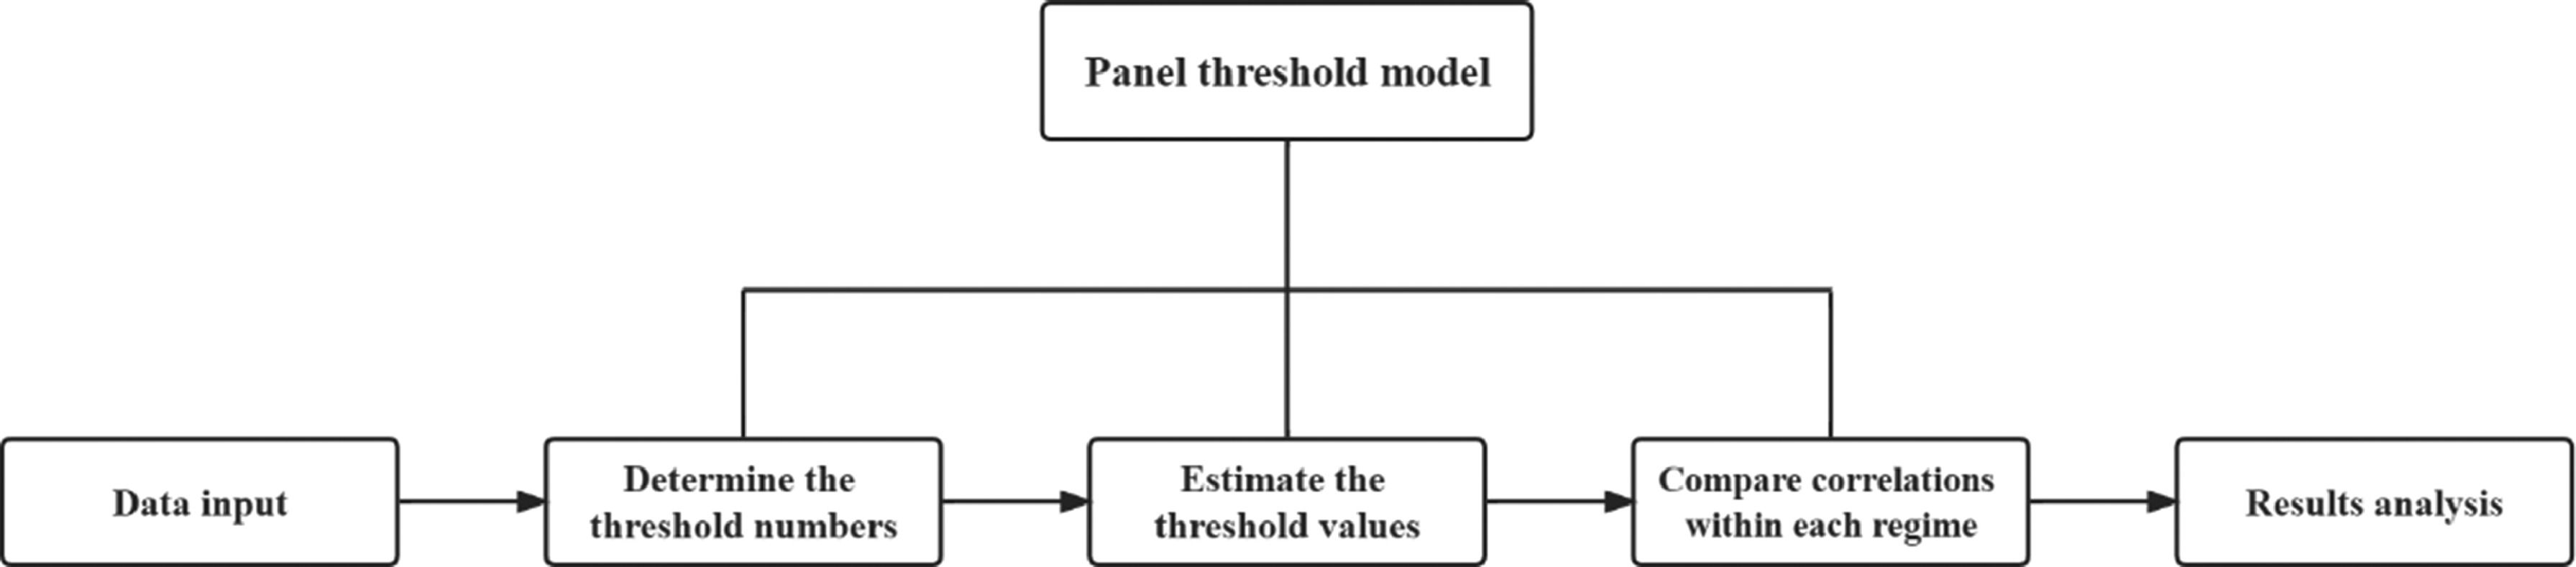
We employ a nonlinear panel threshold model in line with the technique pioneered by Hansen (1999), which examines nonlinear relations in three steps: a) determine endogenously the number of thresholds for the given threshold variable, to prevent imposing an arbitrary classification scheme and thus enhances the credibility; b) estimate the threshold values for each threshold variable; c) compare the correlations between the explanatory and outcome variables within each regime (Fig. 2). If n thresholds are generated for a given threshold variable, then there are (n + 1) regimes and (n + 1) estimation results for the variable. It is not difficult to find that the biggest advantage of the threshold model over other approaches is accuracy; to avoid potential errors originating in arbitrary determination of segmentation points, it generates several regimes endogenously. Therefore, threshold model is a more proper choice over other approaches. Given the significant heterogeneities among the 37 OECD countries in renewable energy innovation levels and potential impact factors, the model is well suited to the study context.

The common forms of panel threshold model are the one-threshold model and the two-threshold model. A one-threshold model implies that there is only one threshold in a given threshold variable, and it splits the variable data into two regimes. Thus, the one-threshold model corresponds to the two-regime threshold model. Similarly, the two-threshold model implies that there are two thresholds in a given threshold variable (one high and one low), and it splits the variable data into three regimes. Thus, the two-threshold model corresponds to the three-regime threshold model. Using the threshold variables of financial development and environmental policy stringency, we extend the original one-threshold model to make it a two-threshold model. Following Xie, Yuan, and Huang (2017), Wang and Shao (2019), and Shao (2020), we construct a three-regime panel threshold model as follows:
where LnRenewablei,t is the dependent variable representing the logged value of renewable innovation; Lnxi,tis the logged independent variable (financial market development and environmental policy stringency, respectively); I(.) is an indicator function that takes the value zero or one; qi,t are the two threshold variables; and γ is the assumed threshold value. The unknown coefficients β1 and β2 represent the impact of the independent variable xi,t on the dependent variable Renewablei,t for qi,t≤γ and qi,t>γ, respectively. Xi,t denotes the control variables (economic development, R&D investment, oil prices, and FDI), and subscripts i and t denote country and year, respectively.Results
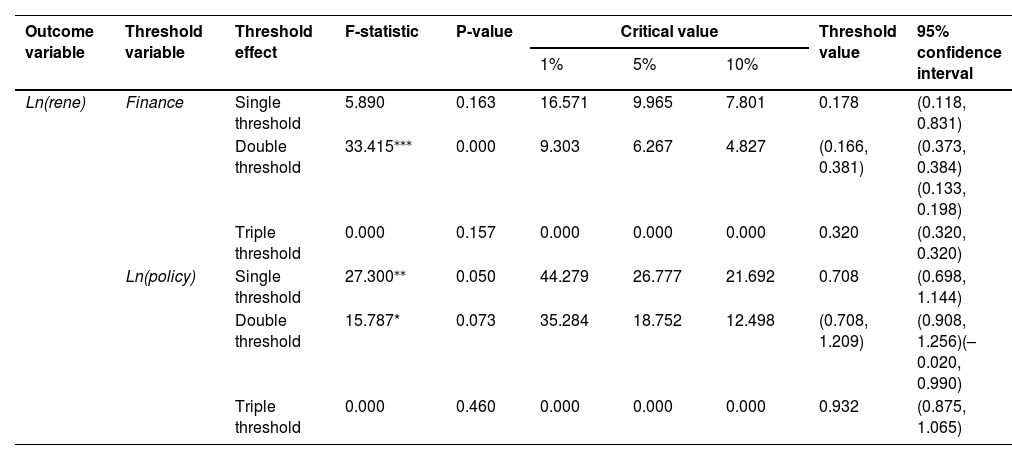
We test the panel threshold effects by employing two threshold variables (i.e., Finance and Ln(policy)) on renewable energy innovation (i.e., Ln(rene)) in an effort to determine the nonlinear relationships between financial development, environmental policy stringency, and renewable innovation. Table 2 shows the number of thresholds for each threshold variable and the estimated threshold values. Two models are presented: “single threshold” denotes that one threshold exists in a given threshold variable, while “double threshold” and “triple threshold” denote the existence of two and three thresholds, respectively.
The threshold effects of financial development and environmental policy on OECD countries’ renewable energy innovation.
| Outcome variable | Threshold variable | Threshold effect | F-statistic | P-value | Critical value | Threshold value | 95% confidence interval | ||
|---|---|---|---|---|---|---|---|---|---|
| 1% | 5% | 10% | |||||||
| Ln(rene) | Finance | Single threshold | 5.890 | 0.163 | 16.571 | 9.965 | 7.801 | 0.178 | (0.118, 0.831) |
| Double threshold | 33.415⁎⁎⁎ | 0.000 | 9.303 | 6.267 | 4.827 | (0.166, 0.381) | (0.373, 0.384)(0.133, 0.198) | ||
| Triple threshold | 0.000 | 0.157 | 0.000 | 0.000 | 0.000 | 0.320 | (0.320, 0.320) | ||
| Ln(policy) | Single threshold | 27.300⁎⁎ | 0.050 | 44.279 | 26.777 | 21.692 | 0.708 | (0.698, 1.144) | |
| Double threshold | 15.787* | 0.073 | 35.284 | 18.752 | 12.498 | (0.708, 1.209) | (0.908, 1.256)(–0.020, 0.990) | ||
| Triple threshold | 0.000 | 0.460 | 0.000 | 0.000 | 0.000 | 0.932 | (0.875, 1.065) | ||
Notes: (1) 300 replications were performed for each of the three bootstrap tests. (2).
Two thresholds at the 1% significance level are found for Finance, and two thresholds at the 10% significance level are found for Ln(policy). Three thresholds for both the two threshold variables are insignificant. Therefore, we choose the two thresholds for Finance and Ln(policy). As the results show, when Finance is the threshold variable, the threshold values are 0.166 and 0.381 for renewable innovation; when Ln(policy) is the threshold variable, the threshold values are 0.708 and 1.209, respectively.
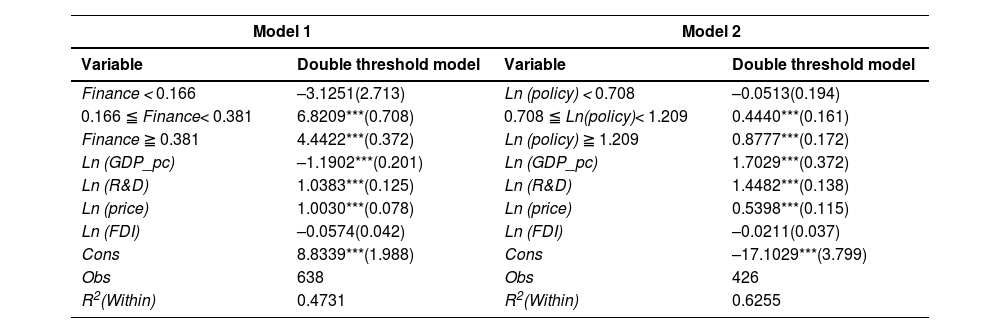
Drawing on these results from Tables 2, 3 displays two models that examine the effects of financial development and environmental policy stringency on OECD countries’ renewable innovation using a two-threshold model. In Model 1, two thresholds split Finance into three regimes: high-level financial development (above 0.381), mid-level financial development (between 0.166 and 0.381), and low-level financial development (below 0.166). In the mid- and high-level regimes, financial development is strongly and positively associated with renewable innovation at the 1% significance level; no significant relationship is found in the low-level regime. Moreover, the coefficient decreases from 6.8209 in the mid-level regime to 4.4422 in the high-level regime in response to an increase in the financial market development level. Thus, H1 is supported.
Effects of financial market development and environmental policy stringency on OECD countries’ renewable energy innovation, as estimated by two-thresholds panel threshold regressions.
Notes: The Model 1 threshold variable is Finance and the Model 2 threshold variable is Ln (policy).
In Model 2, three asymmetric regimes are divided according to two thresholds: high-level environmental policy stringency (above 1.209), mid-level environmental policy stringency (between 0.708 and 1.209), and low-level environmental policy stringency (below 0.708). As in Model 1, no significant correlation is found in the low-level regime, whereas in the mid- and high-level regimes environmental policy shows a significantly positive effect on renewable innovation at the 1% significance level. However, the coefficient doubles from 0.4440 in the mid-level regime to 0.8777 in the high-level regime, which is the opposite phenomenon to the declining coefficients in Model 1. Thus, H2 is supported.
With regard to the control variables, GDP per capita shows strongly significant positive and negative impacts on the dependent variable in Models 1 and 2, respectively. Considering this finding, H3a is therefore not supported. In line with our expectation, R&D positively affects the dependent variable at the 1% significance level in both models, which implies that a one-point increase in the share of R&D expenditures in aggregate GDP leads to an increase of more than one point in renewable energy innovation. This result, which is consistent with the findings of Martínez-Zarzoso et al. (2019) and Wen, Okolo, Ugwuoke, and Kolani (2022), supports H3b. In addition, oil prices show a positive effect on renewable innovation at the 1% significance level, which is in line with the findings of Hu, Wang, Su, and Umar (2022) and supports H3c. Moreover, our results show that FDI shows no significant impact on innovation in the domestic renewable energy industries, which is in line with the results of Zhang et al. (2022) and supports H3d.
DiscussionThis study examines the nonlinear positive effects of financial market development and environmental policy stringency on renewable energy innovation in the advanced OECD countries at different development phases. The results support the H1 and reveal significantly positive correlations between financial market development and renewable energy innovation, which is in line with prior studies (Aghaei et al., 2019; Pham, 2019). The coefficients are significant and show a declining trend in the mid- and high-level threshold regimes, which implies that an immature financial market cannot foster renewable energy innovation. Although financial development is confirmed as the main driving force in renewable innovation in the mid- and high-level regimes, the decreasing degree of impact (i.e., the decreasing coefficients shown in Table 3) indicates that the development of one country's financial market does not necessarily lead to renewable innovation. We might even expect a turning point beyond which finance cannot support innovation if the current trend continues. Therefore, an appropriate level of financial development (neither too low nor too high) is more conducive to fostering renewable energy innovation. This result is consistent with the conclusion of Zhu et al. (2020) that the expansion of financial markets inhibits innovation. Whether renewable innovation is classified into biomass and non-biomass (Pham, 2019) or biomass, hydropower, wind, and solar (Aghaei et al., 2019), the promoting effect of financial development on the subcategories of renewable innovation is significant. Pham (2019) further revealed that financial development tends to play a more important role in countries with higher innovation growth rate. In this light, the mid-level regime can be regarded as the appropriate range, and OECD member countries with financial market indices in this regime have greater potential to improve their renewable innovation.
Unlike financial development, environmental policy stringency shows a significantly positive correlation with renewable energy innovation, with increasing coefficients in the mid- and high-level regimes. This implies that an increasing intensity of environmental policy stringency benefits renewable innovation. Our results are consistent with the finding of Martínez-Zarzoso et al. (2019) that more stringent environmental policy is always associated with greater numbers of renewable energy patent applications. Zhang et al. (2022) observed this effect and noted that it is more pronounced in OECD and other high-income countries, which is consistent with our results. Except for renewables, all other types of environmental innovation can be improved by increasing environmental policy stringency, and in OECD countries government-initiated policy instruments are found to be more effective than their market-oriented counterparts (Hassan & Rousselière, 2022). Our results imply that renewable energy innovation increases rapidly with an increase in environmental policy intensity, and thus we recommend stricter environmental policies to encourage renewable innovation.
The PH proposes that environmental regulation does not simply raise costs but also stimulates innovation in both the public and private sectors. Our findings contribute to existing literatures and indicate the validity of the PH for the renewable energy industries in advanced OECD countries. Prior studies confirmed the positive effect of environmental regulation on green output (Wang, Sun, & Guo, 2019) and renewable innovation (Wang et al., 2022). In the renewable energy industries, push policies have helped to produce novel technologies in developing countries (Samant et al., 2020). Moreover, among the environmental policy tools employed in the market, feed-in tariffs have a consistently positive impact on renewable innovation (Hille et al., 2020). The PH stands even in cross-border scenarios and thus foreign environmental policy stringency is confirmed to induce domestic renewable technology innovation (Herman & Xiang, 2019).
In addition, GDP per capita shows significantly positive and negative correlations with renewable innovation, which suggests that, although GDP is a determinant of renewable innovation, its effects vary in different countries. Thus, a higher level of economic development does not imply a higher level of renewable innovation. This is consistent with reality: Sweden's GDP per capita is higher than that of Spain, but with a much lower number of patents in the renewable energy industries (WB, 2022). Both the share of R&D expenditures in GDP and oil prices can strongly stimulate renewable innovation. This result is in line with the finding of Plank and Doblinger (2018) that public funding in Germany's renewable energy industries increased the number of patent applications. This result also illustrates the existence of the “substitutive effect” by which rising oil prices tend to raise the costs of living and enterprise output, thereby spurring—and making crude oil an essential driving factor in—renewable innovation (Guillouzouic-Le Corff, 2018; Shah et al., 2018). In this connection, Nunes and Catalão-Lopes (2019) further reveal that the reduction in innovation in response to decreasing prices is more pronounced than the increase in innovation in response to increasing prices.
Conclusions, policy implications, limitations, and future research directionsConclusionsThis study used a nonlinear panel threshold model to explore the nonlinear effects of financial development and environmental policy stringency on renewable innovation in 37 OECD member countries from 1990 to 2019. The results reveal three main conclusions. (a) Financial development has a significantly positive effect in the mid- and high-level regimes, but its impact gradually declines, which indicates that maintaining a certain range of financial development is best for promoting renewable energy innovation. (b) Environmental policy stringency also has a significantly positive effect in the mid- and high-level regimes but with an increasing trend, which implies that a stricter environmental policy is better for stimulating renewable innovation, thus confirming the PH in the renewable energy industries. (c) GDP per capita can either promote or inhibit innovation in different conditions, while both oil prices and the proportion of R&D expenditure in aggregate GDP have significantly positive effects on renewable innovation.
Policy implicationsOur empirical results have two main policy implications
First, financial markets should be further developed, particularly the carbon financial market, which has a direct impact on renewable energy innovation. Our results show that financial development significantly and positively affects innovation in the renewable energy industries. To supplement the role of private financial agents (such as venture capital and angel investors) play in promoting renewable innovation, governments should take steps to reduce financial risk and ensure returns. The carbon market is such a case in point, as it is usually operated by the government and regarded as an effective policy tool for optimizing the energy structure and combatting climate change. It can be used to stimulate renewable innovation through two pathways. On the one hand, its financing function helps enterprises to hedge against the risk of price volatility in the carbon market and thus improves returns on renewable energy technology innovation, which motivates firms to embrace the green transition. On the other hand, the development of carbon finance instruments increases market liquidity and enhances cooperation between financial institutions and renewable energy enterprises, which in turn promotes R&D in clean technologies (Polzin, Migendt, Täube, & von Flotow, 2015). The carbon finance market also triggers technological innovation in renewable energy by providing financial compensation for emissions reduction to regions with lower carbon intensities (Qi & Zhang, 2019).
The second implication is that environmental policy tools should be enhanced and their stringency should be increased. Our results indicate that, in the current situation, stricter policies lead to greater renewable innovation. However, empirical studies show that command-and-control policies are more effective than price mechanisms in inducing green innovation (e.g., Samant et al., 2020; Hassan & Rousselière, 2022), and government-oriented policy instruments should therefore be emphasized. Policy-makers must design and implement scientific environmental policies, clarify environmental policy objectives, and establish a phased monitoring mechanism for renewable innovation. Governments can incentivize regional partnerships between large corporations, startups, and incubators and offer favorable technology transfer terms from national laboratories. They can set strict emissions thresholds and energy tax standards to constrain polluting behaviors. Economic instruments such as renewable energy subsidies can also be used to provide flexible regulation and create multiple incentives for enterprises to innovate through policy synergies.
Limitations and future research directionsCertain limitations of this study should be noted. Like most previous studies, this study uses OECD or other developed countries as a sample due to data availability, but it is also necessary to consider developing economies because they face more challenging environmental issues. Compared to financial development, green finance may have a more direct impact on renewable innovation (Yu, Wu, Zhang, Chen, & Zhao, 2021). In addition, this study does not open the “black box” (i.e., the mediating effects) of financial development and environmental policy stringency on renewable innovation.
Based on above limitations, we propose three possible future research directions. First, since previous studies have focused on OECD or other developed countries, it is necessary to check whether the effects identified in our analysis still stand in less mature financial markets and countries with underdeveloped environmental regulations. Second, irrespective of the level of financial development, green finance is theoretically more directly correlated with renewable innovation and thus a green financial development index can be constructed to explore its impact on renewable innovation. Third, it is important to further clarify the influencing mechanisms of how financial development and environmental policy stringency affect renewable innovation.
Data availability statementData available on request from the authors.
FundingThe authors thanks for the support of the National Social Science Fund of China (18CGL008) and the Alexander von Humboldt Foundation (CHN 1194898 HFST-P). We acknowledge support by the Open Access Publication Fund of Freie Universität Berlin.
CRediT authorship contribution statementSongran Li: Data curation, Funding acquisition, Methodology, Investigation, Writing – original draft, Writing – review & editing, Software. Qinglong Shao: Conceptualization, Methodology, Funding acquisition, Resources, Investigation, Project administration, Writing – original draft, Writing – review & editing, Supervision, Validation.