


To analyze the effect of the type of malnutrition, sex, age and the presence of edema upon all-cause mortality in children under 5 years of age.
Material and methodsA cross-sectional study was conducted during 2010 and 2011 in Swaziland. Sex, age, weight and height were taken to classify nutritional status according to the 2006 WHO growth standards: stunting (low height for age), wasting (low weight for height or low body mass index for age) and underweight (low weight for age). The sample (309 boys and 244 girls under 5 years of age) was analyzed by sex and age groups (under and equal/over 12 months). The association between variables was evaluated using the χ2 test. Cox regression analysis (HR, 95% CI) was used to assess the likelihood of mortality.
ResultsThe mortality risk in malnourished children under one year of age was lower among females and increased in the presence of severe edema. Wasting combined with underweight increased the mortality risk in children under 12 months of age 5-fold, versus 11-fold in older children. The combination of stunting, wasting and underweight was closely associated to mortality. Stunting alone (not combined with wasting) did not significantly increase the mortality risk.
ConclusionsSex, severe edema and wasting are predictors of mortality in malnourished children. Regardless of these factors, children with deficiencies referred to weight for height and weight for age present a greater mortality risk in comparison with children who present stunting only.
Analizar el efecto del tipo de malnutrición, de la edad, el sexo y la presencia de edema sobre la mortalidad en menores de cinco años.
Material y métodosEstudio transversal llevado a cabo durante 2010 y 2011 en Suazilandia. Se tomaron el sexo, la edad en meses, la talla y el peso y se clasificó el estado nutricional de los menores considerando: desnutrición crónica (stunting o baja talla para la edad), aguda (wasting o bajo peso para la talla o bajo índice de masa corporal para la edad) y bajo peso para la edad (underweight) de acuerdo a los estándares de crecimiento de la OMS del 2006. La muestra (309 niños, 244 niñas, menores de 5 años) se analizó por sexo y edad considerando separadamente los menores y mayores de 12 meses. La asociación entre variables se evaluó utilizando el test de χ2 y la regresión de Cox (HR 95% CI) fue utilizada para determinar la probabilidad de muerte.
ResultadosEl riesgo de muerte en los menores malnutridos menores de un año es menor en las niñas y aumenta significativamente con la presencia de edema severo. La desnutrición aguda combinada con el bajo peso multiplica por cinco el riesgo de mortalidad en los menores de 12 meses y por once en los mayores de un año. La combinación de desnutrición crónica, aguda y bajo peso está estrechamente asociada a la mortalidad. La malnutrición crónica por sí sola no incrementa significativamente el riesgo de muerte.
ConclusionesEl sexo, la severidad del edema y la desnutrición aguda son predictores de mortalidad. Con independencia de estos factores, los menores con déficit de peso para la talla o de peso para la edad presentan mayor riesgo de mortalidad que los menores que padecen únicamente desnutrición crónica.
The synergistic effect of malnutrition and infectious diseases on children mortality has been widely described.1–3 The assessment of nutritional status by anthropometric indicators highlights the influence of each different type of malnutrition on the probability of death.4 Authors such as Black et al.5 estimated this probability at 14.4% for children with low weight forage (underweight), at 14.7% for children with low height for age (stunting) and at 20.0% for low weight for height (wasting). Other studies have found an stronger risk of mortality associated with underweight6,7 respect other anthropometric index. In addition, the mortality risk can be increased with the joint presence of various types of malnutrition.8
In cases of the severe acute malnutrition, known as kwashiorkor,9 edema occurs as a result of interstitial fluid retention. This nutritional edema, affects the children weight masking both weight deficiency for height (wasting) and for age (underweight). Therefore, it is essential to consider this situation for anthropometric diagnosis. Moreover, biological variables such as sex and age have a differential effect on the risk of malnutrition and mortality,10,11 although with different results depending on the country of study. For example, in Ethiopia, male sex has been identified as one of the risk factors of malnutrition12 but in countries like India, girls are often disadvantaged compared to boys.10–13
Data about broad global regions clarify the relationships between anthropometric indicators and associated mortality, but do not allow knowing the specific situation of each country.14 It is therefore necessary to analyze each particular context, in order to prioritize nutrition interventions and to improve the design of the programs. With the goal of improving the management of malnutrition, the aim of this study is to determine the influence of each type of malnutrition on all-cause mortality among an under five years sample from Swaziland, as well as the effect of sex, age and the presence of nutritional edema.
Material and methodsSampleData came from a prospective cohort belonging the 2010–2011 campaign carried out by the non-governmental organization (NGO) Action Against Hunger (ACF-International) in the four regions of Swaziland (Shiselweni, Hhohho, Lubombo and Manzini). The study was carried out with anonymous data from children admitted to health-care and nutritional recovery centers linked to the NGO. Children are brought to the center by their own families or staff of the organization with the parental authorization, in where they are diagnosed by local health staff and, depending on their status, they could be discharged, admitted or transferred to special centers. In order to analyze mortality pattern, the children were followed from their arrival to the center, until their death. The duration of the mean stay was 119.08±4.5 days.
The number of records in the database was 1016 individuals. Among them, the under-five year children were selected (n=991), eliminating the cases which have incomplete or erroneous information (n=8). Only those children whose admission result was healing or death were included in the study, discarding those that were transferred to another facility (n=430). The final sample analyzed consists of 553 children (309 boys and 244 girls) and this sample was analyzed by sex and age, considering two groups: under one year (from 1 to 11 months) and one year or more (between 12 and 59 months).
Nutritional assessmentNutritional status of sample has been classified trough the anthropometric variables height (cm) and weight (kg). Malnutrition has been defined as stunting or chronic malnutrition (low height for age); wasting or acute malnutrition (low weight for height or low body mass index (weight/height2) for age and underweight or global malnutrition (low weight for age). The Z scores values less than −2SD of the 2006 World Health Organization Child Growth Standards15 have been used as reference for define chronic, acute and global malnutrition.
Children have been classified as: (a) “Normal nourished” those without stunting, wasting nor underweight; (b) “Stunted only” when they presented low height for age, but had no weight deficit; (c) “Wasting only” when they had weight deficit for height, but not a low height for their age; (d) “Underweight only” when they had low weight for their age, but not stunting; (e) “Stunting and wasting”, when they were deficient in height for age and weight for height; (f) “Stunting and underweight”, with deficiency of height and weight for age; (g) “Wasting and underweight”, deficient weight for age and height; (h) “Stunting, wasting and underweight” those with deficient height for age, weight for height and weight for age together. Only 51 minors (9.22% of the sample) presented moderate malnutrition (between −2SD and −3DE for one or several anthropometric indicators). The rest were severely malnourished (values below −3DE). It should be added that all subjects with edema are considered to be severely malnourished.
Presence of nutritional edema has been assessed in four levels of severity according to the record on admission center: (1) Without edema; (2) Level 1 or mild, present in feet and ankles; (3) Level 2 or moderate, present in feet, legs, hands and/or forearms; (4) Level 3 or severe, widespread in limbs and face.16
Statistical analysesTo evaluate the association between age (estimated as less than or equal/greater than 12 months) and mortality, χ2 test has been used. Cox regression analysis (HR 95% CI) has been used to assess the association between exposure variable (death) and each category of malnutrition. The risk of all-cause mortality of malnourished children has been contrasted with the risk of no malnourished and, on the other hand, considering only the children who were undernourished, it was compared the risk of death between those children with and without chronic malnutrition. All analyses were performed using SPSS 21.0 software.
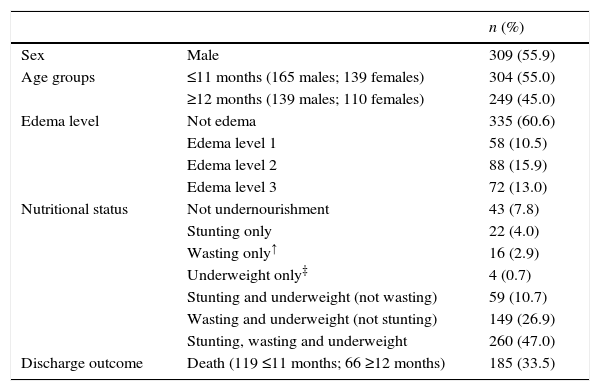
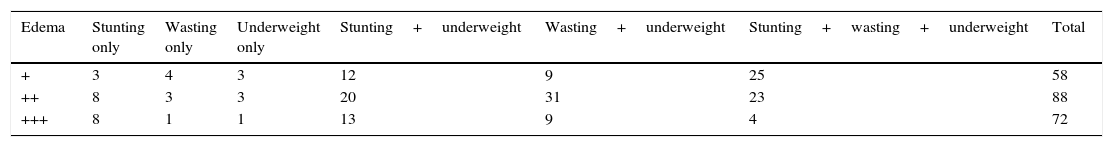
ResultsBaseline characteristicsThe characteristics of the sample are showed in Table 1. The percentage of males was 56% at admission in the health center, proportion of children under/equal eleven months was slightly higher than those equal/over one year, and 39.4% of children presented edema. The presence of edema in relation to the type of malnutrition evaluated by anthropometry is detailed in Table 2. Most of the children had some kind of undernourishment and most of them presented the three kinds of undernutrition together (47%). Four children had only underweight, therefore it was not possible studied the effect of this category. The death event happened in 33.5% of all children.
Baseline characteristics at the time of the first assessment in the health center (except discharge outcome).
| n (%) | ||
|---|---|---|
| Sex | Male | 309 (55.9) |
| Age groups | ≤11 months (165 males; 139 females) | 304 (55.0) |
| ≥12 months (139 males; 110 females) | 249 (45.0) | |
| Edema level | Not edema | 335 (60.6) |
| Edema level 1 | 58 (10.5) | |
| Edema level 2 | 88 (15.9) | |
| Edema level 3 | 72 (13.0) | |
| Nutritional status | Not undernourishment | 43 (7.8) |
| Stunting only | 22 (4.0) | |
| Wasting only↑ | 16 (2.9) | |
| Underweight only‡ | 4 (0.7) | |
| Stunting and underweight (not wasting) | 59 (10.7) | |
| Wasting and underweight (not stunting) | 149 (26.9) | |
| Stunting, wasting and underweight | 260 (47.0) | |
| Discharge outcome | Death (119 ≤11 months; 66 ≥12 months) | 185 (33.5) |
There were no child stunting and wasting at the same time without the presence of underweight. The results showed higher all-causes mortality in younger children, with significant differences between age groups for both normally and malnourished children (p<0.001).
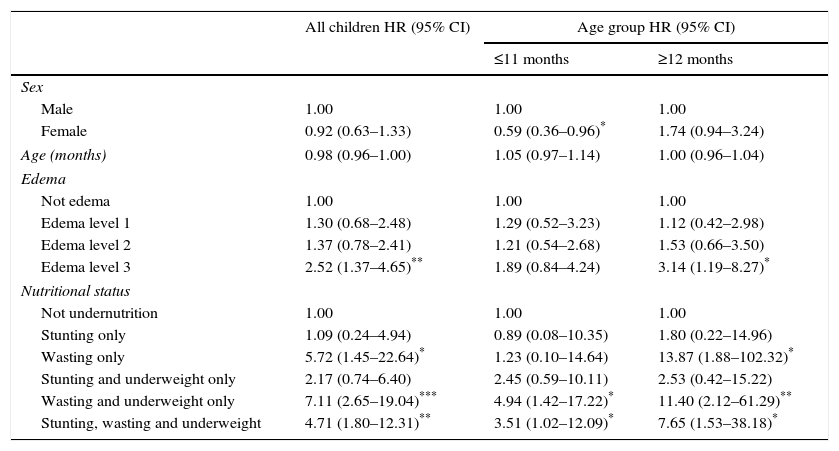
Risk of all-cause mortalityThe results showed higher all-causes mortality in younger children (≤11 months), for all kind of malnourished statuses (p<0.001). Table 3 shows that female sex has a significantly lower mortality in children less than 12 months. In the whole sample and among those children of 12 months or more, the risk of death is twice as high among children with type 3 edema that among those without edema. Wasting combined with underweight is always the nutritional status with higher risk of all-cause mortality. This fact increases by five times the risk in children under one year and eleven times in older one year. The combination of stunting, wasting and underweight also have close association with mortality, and wasting exclusively in those over one year. By contrast, stunting, by itself, does not significantly increase the risk of death.
All-cause mortality cox regression study [HR (95% CI)] for sex, age, presence of edema and nutritional status in all sample and by age-groups.
| All children HR (95% CI) | Age group HR (95% CI) | ||
|---|---|---|---|
| ≤11 months | ≥12 months | ||
| Sex | |||
| Male | 1.00 | 1.00 | 1.00 |
| Female | 0.92 (0.63–1.33) | 0.59 (0.36–0.96)* | 1.74 (0.94–3.24) |
| Age (months) | 0.98 (0.96–1.00) | 1.05 (0.97–1.14) | 1.00 (0.96–1.04) |
| Edema | |||
| Not edema | 1.00 | 1.00 | 1.00 |
| Edema level 1 | 1.30 (0.68–2.48) | 1.29 (0.52–3.23) | 1.12 (0.42–2.98) |
| Edema level 2 | 1.37 (0.78–2.41) | 1.21 (0.54–2.68) | 1.53 (0.66–3.50) |
| Edema level 3 | 2.52 (1.37–4.65)** | 1.89 (0.84–4.24) | 3.14 (1.19–8.27)* |
| Nutritional status | |||
| Not undernutrition | 1.00 | 1.00 | 1.00 |
| Stunting only | 1.09 (0.24–4.94) | 0.89 (0.08–10.35) | 1.80 (0.22–14.96) |
| Wasting only | 5.72 (1.45–22.64)* | 1.23 (0.10–14.64) | 13.87 (1.88–102.32)* |
| Stunting and underweight only | 2.17 (0.74–6.40) | 2.45 (0.59–10.11) | 2.53 (0.42–15.22) |
| Wasting and underweight only | 7.11 (2.65–19.04)*** | 4.94 (1.42–17.22)* | 11.40 (2.12–61.29)** |
| Stunting, wasting and underweight | 4.71 (1.80–12.31)** | 3.51 (1.02–12.09)* | 7.65 (1.53–38.18)* |
Hazard Ratio (HR).
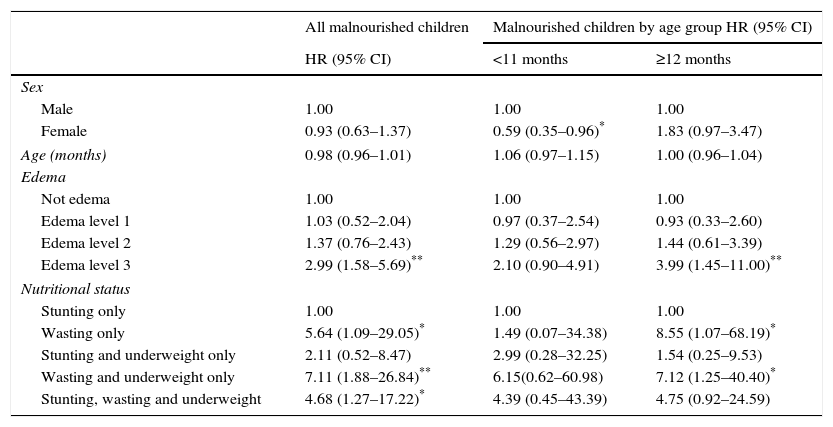
All-cause mortality cox regression study [HR (95% CI)] for sex, age, presence of edema and nutritional status in malnourished sample and by age-groups.
| All malnourished children | Malnourished children by age group HR (95% CI) | ||
|---|---|---|---|
| HR (95% CI) | <11 months | ≥12 months | |
| Sex | |||
| Male | 1.00 | 1.00 | 1.00 |
| Female | 0.93 (0.63–1.37) | 0.59 (0.35–0.96)* | 1.83 (0.97–3.47) |
| Age (months) | 0.98 (0.96–1.01) | 1.06 (0.97–1.15) | 1.00 (0.96–1.04) |
| Edema | |||
| Not edema | 1.00 | 1.00 | 1.00 |
| Edema level 1 | 1.03 (0.52–2.04) | 0.97 (0.37–2.54) | 0.93 (0.33–2.60) |
| Edema level 2 | 1.37 (0.76–2.43) | 1.29 (0.56–2.97) | 1.44 (0.61–3.39) |
| Edema level 3 | 2.99 (1.58–5.69)** | 2.10 (0.90–4.91) | 3.99 (1.45–11.00)** |
| Nutritional status | |||
| Stunting only | 1.00 | 1.00 | 1.00 |
| Wasting only | 5.64 (1.09–29.05)* | 1.49 (0.07–34.38) | 8.55 (1.07–68.19)* |
| Stunting and underweight only | 2.11 (0.52–8.47) | 2.99 (0.28–32.25) | 1.54 (0.25–9.53) |
| Wasting and underweight only | 7.11 (1.88–26.84)** | 6.15(0.62–60.98) | 7.12 (1.25–40.40)* |
| Stunting, wasting and underweight | 4.68 (1.27–17.22)* | 4.39 (0.45–43.39) | 4.75 (0.92–24.59) |
Hazard Ratio (HR).
In order to study in depth the effect of different types of malnutrition on all-causes mortality in children under five years, the same analysis has been made considering only the children with some kind of malnutrition (Table 3). The results are similar to those found in Table 2, for the whole sample and for children who have completed the first year of life. Female sex is a protective factor against death in children under 12 months and among malnourished children, the risk of death of those with edema level 3 triples those without edema. Acute malnutrition only or accompanied by underweight significantly increases mortality in comparison with chronic malnutrition.
DiscussionThis study evaluates anthropometric indicators of malnutrition and the presence of nutritional edema, in order to determine their influence on the risk of all-cause mortality in Swaziland children under five years. The results show that severe edema, wasting alone, wasting combined with underweight as well as the combined presence of stunting, wasting and underweight are risk factors for mortality. The presence of edema is in itself a sign of severe malnutrition. Considering sex and age, only in children under 12 months, be female is an advantage or protective factor against death when considering all the sample or just malnourished children.
These data from a health primary care center show a high percentage of children with some types of malnutrition. In Swaziland there are 31% of children under five chronically malnourished, 1% with acute malnutrition and 6% with underweight.7,17,18 The mortality rate of children under five is 102 deaths per 1000 live births, far away from the Millennium Development Goal that established a maximum of 32 deaths per 1000 live births for 2015.18,19 The complex relationship among the causes of this situation, are the same as described in other low-income countries.5 Most important are immediate causes such as inadequate intake and the presence of infectious diseases as a result of lack of access to food, insufficient health care and an unhealthy environment, and structural causes, such as low maternal educational level and lack of economic resources at domestic and national level.18
Weight and height deficiencies in children not occur in isolation, due in part to the accumulation of causes that determine an unfavorable environment. In this study, the most prevalent nutritional status has been the simultaneous diagnosis of stunting, wasting and underweight. Considering that data are related to children in a health center, that is, in pathological situation, the joint presence of the three categories may cause a greater vulnerability to infectious processes or other medical problems. McDonald et al.8 found that mortality risk increases five times with the addition of anthropometric indicators of malnutrition (HR varies from 1.5–2.5 to 12.3 depending of consider only one indicator or the three deficits at the same time).
Age influences the relationship established between malnutrition and mortality. According to our results, there is no difference in mortality on the basis of age when well-nourished children are included, while among the undernourished, the prevalence of deaths is higher in children under one year. According to Kantz et al.,11 children under two years with low height for age are at greater risk of dying than children of this age without malnutrition; this risk disappears in the elderly.
In this study, sex has been shown as a factor related with of mortality from all causes in children under one year, with an decreased risk of death in females. These results are consistent with data observed in most countries,5 and with analysis shown in literature. The influence of sex in mortality at early age, is explained by the increased vulnerability of male in the perinatal period.20 The girls would have a genetic advantage in which immunoregulatory X-linked genes appear to contribute to greater female resistance to infections, unrelated to a behavior of risk or protection. This trend changes over the period of 1–4 years when children’ care is more important than genetic factors in determining the risk of mortality, and authors suggest the importance of “gender factor” opposite to “sex factor”.21 This might explain that in children over 12 months, the sex is not a significant variable of mortality. Differential mortality by sex, has been explained as a mechanism of natural selection in human strategy to maximize reproductive success,22 extending from conception to weaning. Differential mortality by sex would be related to environmental stress, malnutrition and their interaction with infections.23 The model proposed by Wells23 suggests that no health improvement will reverse the severe effect that produce the environmental stress in the early stages of life mostly in boys.
Severe nutritional edema is an independent predictor of all-causes mortality. These results were observed in the studies of Schofield and Ashworth24 and Weisstaubet al.25 where kwashiorkor was associated with higher mortality than other undernourishments. Edema is an increase in the body volume produced by abnormal accumulation of fluid infiltrated from cellular tissue. It is not yet well known the mechanism that triggers fluid retention, since they have not found nutritional difference between children with kwashiorkor and children with marasmus (severe malnutrition with no edema).26 However, it is known that nutritional deprivation of protein in kwashiorkor is associated with visceral protein loss that damage vital organs, unlike in marasmus, that the protein loss is somatic.27
Regardless of gender, age and the presence of edema, it has been identified increased risk of mortality in children with weight deficiency for height and with weight deficiency for age, compared with non-malnourished children and those who have only stunting. Acute malnutrition has been described as the strongest determinant of mortality compared with chronic and global28 and in this study wasting is also the most important predictor of mortality in children over 12 months. According with our results, O’Neill et al.29 also report that although all indicators of malnutrition below −3SD Z scores carry significant increase of mortality, wasting is significantly associated below −2SD Z scores.30
Moreover, in this study there is no evidence that chronic malnutrition by itself be a significant predictor of mortality, which contrasts with other studies such as meta-analysis of McDonald et al.8 that was made over 10 cohort studies or randomized trials in low- and middle-income countries in Africa, Asia, and Latin America.
Limitations of this study are that isolated nutritional deficits, those that do not appear in combination, are not represented by a high volume of data. The difficulties of data recording in the field result in the loss of records. A larger pool could let us establish the associative relationships with greater statistical power.
ConclusionsFemale sex has a significantly lower mortality in malnourished children less than 12 months. Wasting combined with underweight is the nutritional status with higher risk of all-cause mortality, especially in children over 12 months. Stunting, by itself, does not significantly increase the risk of death. Regardless nutritional status, the presence of edema increases the risk of mortality.
AuthorshipP. Acevedo is primarily responsible for conceptualizing and designing the study, data analysis and writing the manuscript. M.T. García Esteban has contributed writing the text with a critical vision about content. N. López-Ejeda has contributed to writing the text with a critical vision about content. A. Gómez has contributed to data acquisition. MD. Marrodán has contributed to study design and final approval of the version to be published.
Financial supportThis research received no specific grant from any funding agency, commercial or not-for-profit sectors.
Conflict of interestNone.
Ethical standards disclosureThis study was conducted according to the guidelines laid down in the Declaration of Helsinki. Verbal informed consent was witnessed and formally recorded from all participants relatives.
