


Insulin resistance (IR) is a condition favored by metabolic and endocrine changes experienced by adipose tissue in the context of obesity. The prevalence and the presentation of both IR and obesity vary among the populations, and may be affected by ancestral genetic composition among other factors. The aim of this study was to compare the presence of IR and obesity in Amerindians of the Embera-Chamí ethnicity and Colombian mestizo population.
Patients and methodsA sample of 630 individuals, 471 mestizos and 159 Amerindians of the Embera-Chamí ethnicity, from the general population of Colombia were studied. For each participant, anthropometric and biochemical measurements, as well as blood pressure and the Homeostatic Model Assessment (HOMA) of IR and β-cell function (%B) were recorded. These values were compared between the two populations.
ResultsWhile prevalence of central obesity was similar in both populations (48.7% and 42.6% in the mestizo and Embera groups respectively; p=0.148), body mass index (BMI) values suggested a higher prevalence of overweight in the Embera than in mestizo population (43.4% Embera, 31.8% mestizo; p=0.027). Despite the similarities in the prevalence of HOMA-IR and HOMA-%B status between both populations, the Embera population had a significantly greater pancreatic β-cell function, higher insulin levels, and better glucose control, across BMI and central obesity categories, than the mestizo population.
ConclusionThere are differences in aspects related to energy metabolism between the samples of the mestizo and Amerindian populations analyzed.
La resistencia a la insulina (RI) es una condición favorecida por las alteraciones metabólicas y endocrinológicas experimentadas por el tejido adiposo en el contexto de obesidad. Tanto la prevalencia como la presentación de RI y obesidad varían entre las poblaciones y puede ser afectada, entre otros factores, por la composición genética ancestral. El objetivo de este estudio fue comparar la presentación tanto de RI como de obesidad entre amerindios de la etnia embera-chamí y población mestiza colombiana.
Pacientes y métodosSe estudió una muestra de 630 individuos de la población general mestiza colombiana (471 individuos) y de amerindios de la etnia embera-chamí (159 individuos). Para todos los participantes se registraron tanto medidas antropométricas, bioquímicas así como de presión arterial y el índice homeostatic model assessment (HOMA) para la RI y función de la célula β, valores que fueron comparados entre las poblaciones.
ResultadosMientras que ambas poblaciones mostraron una prevalencia de obesidad central similar (48,7% en mestizos, 42,6% en embera; p=0,148), los embera presentaron mayor exceso de peso de acuerdo al índice de masa corporal que los mestizos (43,4% en embera, 31,8% en mestizos; p=0,027). A pesar de las similitudes en la prevalencia de HOMA2-RI y HOMA2- %B entre ambas poblaciones, los embera presentan una función significativamente mayor de las células β del páncreas, niveles de insulina comparativamente mayores y un mejor control glucémico que los mestizos.
ConclusiónExisten diferencias en aspectos del metabolismo energético entre las muestras de población mestiza y amerindia analizadas.
Insulin is a hormone that regulates diverse physiological processes including those related to metabolism. The effect of this hormone on target tissues is mediated by the binding to its receptor and the cascade of intracellular events triggered by this interaction. Altered secretion of adipokines like Tumor Necrosis Factor α (TNF-α) and interleukin 6 (IL-6), as well as the metabolic changes that accompany obesity, such as increased levels of circulating free fatty acids and diacylglycerols, might interfere with insulin signaling pathways contributing to the onset of insulin resistance (IR), the inability of target tissues to respond to this hormone signaling.1 As a consequence, IR has been considered as a sine qua non condition of obesity and the trigger of many of the health problems that arise with it.
Results of studies conducted on multi-ethnic populations,2,3 or genetically related populations exposed to different environmental conditions4 suggest that the manifestation and prevalence of IR and obesity vary between populations, and those differences rely on lifestyle and genetic factors. In the case of populations resulting from genetic admixture, like Latin America, differences in the ancestral genetic composition that might exist among populations and individuals represent an additional source of variability.
In this study we compared, at the population level, the status of IR, and some related measurements, in two Colombian population samples with different ancestral genetic composition5,6 – Amerindians of Embera-Chami ethnicity and mestizos-, assessing the effect of the presence of central and general obesity on these measurements.
Patients and methodsStudy populationIn this cross-sectional observational study, 471 Colombian mestizo residing in the provinces of Antioquia, Bolívar and Nariño, and 159 Amerindians of Embera-Chamí ethnicity residing in the Karmata Rua indigenous reservation in the municipality of Jardin, southwest of the province of Antioquia, were enrolled independent of their health status. For the IR analyses and β-cell function assessment, individuals who had fasting insulin levels out of the range allowed by the HOMA Calculator software (under 2.9 or higher than 57.6μU/mL),7 or who were missing any of the measurements required to perform those calculations were excluded (54 mestizos and 69 Amerindians). A questionnaire was applied to each one of the participants recording their personal and family background of diseases, social demographic aspects and lifestyle. All individuals agreed to participate in the study and signed an informed consent. This study was approved by the Ethics Committee of the Universidad de Antioquia in accordance with the Helsinki declaration guidelines.
Anthropometric measurements and blood pressureBody mass index (BMI) was estimated based on the participants’ weight and height. Waist and hip circumference were measured using a metric tape at the midpoint between the coastal ridge and the iliac crest at the height of the greater trochanters, respectively. Individuals with a BMI ranging from 18.5 to 24.9kg/m2 were considered normal weight; 25.0–29.9kg/m2 overweight and >30kg/m2 obese. The presence of central obesity was determined in accordance with the cut-off points suggested for Latin Americans.8 Blood pressure was measured twice in the right arm during the interview.
Biochemical analysis and estimation of insulin resistance and β-cell functionGlucose, total cholesterol (TC), HDL and triacylglycerol (TAG) plasmatic levels, as well as insulinemia, were determined, as single measures, after a 12h fasting. LDL cholesterol was calculated using Friedewald's formula. Insulin resistance index (HOMA-IR) and β-cell function (HOMA-%B) were estimated indirectly based on the fasting insulin and glucose levels under the Homeostatic Model Assessment (HOMA) model using the HOMA Calculator v2.2.2 software (http://www.dtu.ox.ac.uk/homacalculator/, University of Oxford), an updated version of the original model proposed by Matthews et al. in 1985 which offers non-linear exact solutions for the model.7
Based on these measurements, and in agreement with Buccini and Wolfthal,9 insulin resistant individuals were identified as those with HOMA-IR values above the 75th percentile of the distribution of that measurement within a reference subgroup defined for each population; this subgroup only included individuals with a BMI ranging from 18.5 to 30kg/m2, fasting glucose levels lower than 100mg/dL, without a diabetes mellitus type 2 diagnostic (T2D), hypertension (HTA) or thyroid disease. In the case of HOMA-%B, the value corresponding to 25th percentile of the respective distribution9 was taken as a reference, and in this case, HOMA-%B values below this cut-off were taken as indicative of secretory deficit.
Statistical analysisAll statistical analyses were conducted in the R-2.14.110 package (http://www.r-project.org/). Variables were represented as the median accompanied by the interquartile range or as percentages according to their nature. Statistical differences between groups were calculated using the Mann–Whitney U test or the χ2 test depending on the distribution.
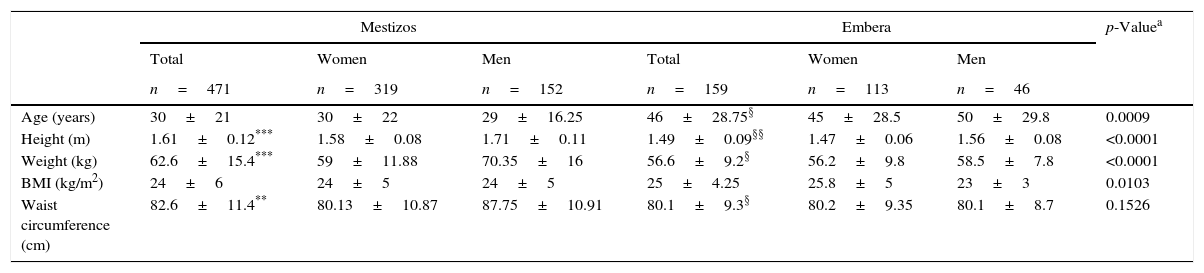
ResultsClinical characteristics of the study populationBoth, mestizo and Embera populations showed statistically significant differences between genders in some anthropometric and biochemical variables (Tables 1 and S1). Besides the anthropometric differences observed for both populations, distinct metabolic features were also observed, particularly higher TAG levels (p=0.0167) and β-cell function among Embera (p=0.003) and higher fasting glucose levels in mestizos (p=0.0021).
Anthropometric, clinical and metabolic characteristics of the study population.
| Mestizos | Embera | p-Valuea | |||||
|---|---|---|---|---|---|---|---|
| Total | Women | Men | Total | Women | Men | ||
| n=471 | n=319 | n=152 | n=159 | n=113 | n=46 | ||
| Age (years) | 30±21 | 30±22 | 29±16.25 | 46±28.75§ | 45±28.5 | 50±29.8 | 0.0009 |
| Height (m) | 1.61±0.12*** | 1.58±0.08 | 1.71±0.11 | 1.49±0.09§§ | 1.47±0.06 | 1.56±0.08 | <0.0001 |
| Weight (kg) | 62.6±15.4*** | 59±11.88 | 70.35±16 | 56.6±9.2§ | 56.2±9.8 | 58.5±7.8 | <0.0001 |
| BMI (kg/m2) | 24±6 | 24±5 | 24±5 | 25±4.25 | 25.8±5 | 23±3 | 0.0103 |
| Waist circumference (cm) | 82.6±11.4** | 80.13±10.87 | 87.75±10.91 | 80.1±9.3§ | 80.2±9.35 | 80.1±8.7 | 0.1526 |
| n=417 | n=285 | n=132 | n=90 | n=74 | n=16 | p-Valuea | |
|---|---|---|---|---|---|---|---|
| Blood glucose (mg/dL) | 82±11 | 81±10.5 | 83±10 | 79±12§ | 79±11.25 | 81±14.1 | 0.0021 |
| Insulin (μU/mL) | 6.7±5.5 | 7±5.4 | 6.2±5.65 | 7±5.2 | 7.6±5.95 | 5.9±6.25 | 0.1913 |
| HOMA-IR | 0.9±0.7 | 1±0.6 | 0.8±0.7 | 1±0.7 | 1±0.08 | 0.95±0.45 | 0.2691 |
| HOMA-%B | 108±47.7 | 111.9±51.2 | 105.6±43 | 126.45±71.1 | 129.05±67.95 | 98.2±44.3 | 0.0030 |
aBilateral significance of the Mann–Whitney U test to compare totals between the populations.
*p<0.05, **p<0.001, ***p<0.0001, and §p<0.05; §§p<0.001 bilateral significance level of the Mann–Whitney U test to compare genders for mestizo and Embera populations, respectively.
WHI, Waist Hip Index; SP, systolic pressure; DP, diastolic pressure; C, cholesterol; TAG, triacylglycerols; HDL, high-density lipoprotein; LDL, low-density lipoprotein.
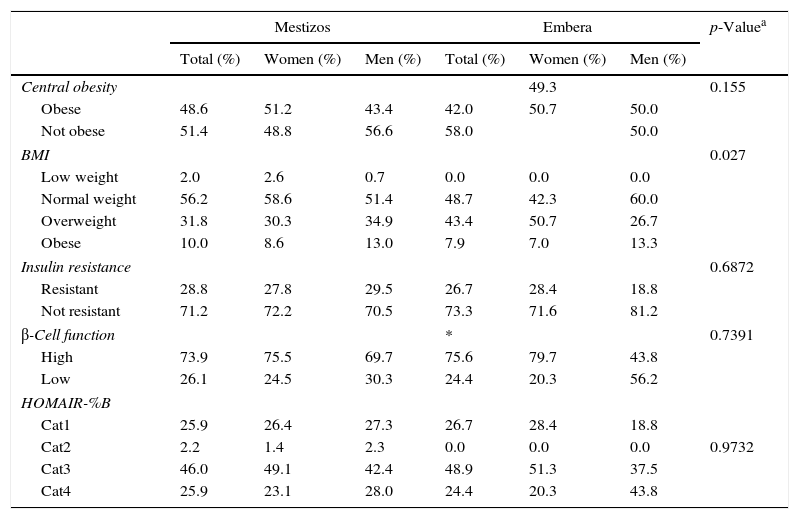
For both populations, central obesity was a highly prevalent trait, and it was present in almost 50% of the mestizo population sample (Table 2). This high central obesity frequency contrasts with the low percentage (10%) of obese individuals observed according to BMI data for the same population (Table 2).
Distribution of the percentages of central and general obesity, insulin resistance and related measurements based on gender and population.
| Mestizos | Embera | p-Valuea | |||||
|---|---|---|---|---|---|---|---|
| Total (%) | Women (%) | Men (%) | Total (%) | Women (%) | Men (%) | ||
| Central obesity | 49.3 | 0.155 | |||||
| Obese | 48.6 | 51.2 | 43.4 | 42.0 | 50.7 | 50.0 | |
| Not obese | 51.4 | 48.8 | 56.6 | 58.0 | 50.0 | ||
| BMI | 0.027 | ||||||
| Low weight | 2.0 | 2.6 | 0.7 | 0.0 | 0.0 | 0.0 | |
| Normal weight | 56.2 | 58.6 | 51.4 | 48.7 | 42.3 | 60.0 | |
| Overweight | 31.8 | 30.3 | 34.9 | 43.4 | 50.7 | 26.7 | |
| Obese | 10.0 | 8.6 | 13.0 | 7.9 | 7.0 | 13.3 | |
| Insulin resistance | 0.6872 | ||||||
| Resistant | 28.8 | 27.8 | 29.5 | 26.7 | 28.4 | 18.8 | |
| Not resistant | 71.2 | 72.2 | 70.5 | 73.3 | 71.6 | 81.2 | |
| β-Cell function | * | 0.7391 | |||||
| High | 73.9 | 75.5 | 69.7 | 75.6 | 79.7 | 43.8 | |
| Low | 26.1 | 24.5 | 30.3 | 24.4 | 20.3 | 56.2 | |
| HOMAIR-%B | |||||||
| Cat1 | 25.9 | 26.4 | 27.3 | 26.7 | 28.4 | 18.8 | |
| Cat2 | 2.2 | 1.4 | 2.3 | 0.0 | 0.0 | 0.0 | 0.9732 |
| Cat3 | 46.0 | 49.1 | 42.4 | 48.9 | 51.3 | 37.5 | |
| Cat4 | 25.9 | 23.1 | 28.0 | 24.4 | 20.3 | 43.8 | |
a Significance of the χ2 test among populations.
*p<0.05 significance level of the χ2 test between genders for the Embera population.
Among the Embera, we did not observe underweight individuals (BMI below 18.5kg/m2), furthermore the proportion of overweight individuals is higher in this population than in mestizos. This finding could be partially explained by the high ratio of Embera women in this category (Table 2).
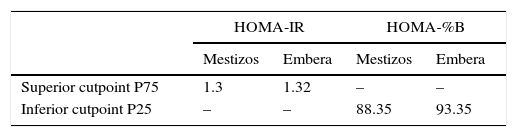
RI frequency and β-cell function defectsFor both populations, the percentage of insulin resistant individuals and those with low β-cell function according to their respective cut-off points (Table 3) does not differ significantly between the populations (Table 2). Between genders, we only observed marked differences in HOMA-%B among the Embera (Table 2).
When considered independently, HOMA-IR and HOMA-%B may not be very informative measurements given that a 50% HOMA-%B may correspond both to an individual with low IR or an insulin resistant individual with a defect in β-cell function,7 thus we proposed four categories depending on the combinations of the presence/absence of IR and the presence/absence of low β-cell function9 as follows: high HOMA-IR-high HOMA-%B (Cat1), high HOMA-IR-low HOMA-%B (Cat2), lowHOMA-IR-high HOMA-%B (Cat3) and low HOMA-IR-low HOMA-%B (Cat4), high HOMA-IR-high HOMA-%B (Cat1), high HOMA-IR-low HOMA-%B (Cat2), low HOMA-IR-high HOMA-%B (Cat3) and low HOMA-IR-low HOMA-%B (Cat4). Interestingly, among Embera we did not observe individuals who comply with the characteristic traits of T2D, IR and low β-cell function, represented by Cat2 in this classification (Table 2). Besides this finding, no other substantial differences between both populations where observed in the distribution of individuals in each of these categories.
The distribution of the variation of glucose and insulin levels are presented in Fig. 1A and B, respectively, according to each one of the HOMAIR-%B categories comparable between the two populations. In general, the highest glucose levels were found in individuals in categories Cat1 and Cat4 (Fig. 1A). Furthermore, it was evident that, despite their IR, Cat1 individuals among the Embera had better glucose control than mestizos (Fig. 1A). Additionally, it was in this category (Cat1) where we observed the highest insulin levels for both populations (Fig. 1B).
 Beanplot for the distribution of fasting blood glucose values for each HOMAIR-%B category based on population. (B) Beanplot for the distribution of fasting insulin levels for each HOMAIR-%B category based on population. In A and B the discontinuous line indicates the mean value for all the groups while the dark line in each distribution indicates the median of the measurement for that population.")
Fasting insulin and blood glucose levels based on population in accordance with HOMAIR-%B categories. (A) Beanplot for the distribution of fasting blood glucose values for each HOMAIR-%B category based on population. (B) Beanplot for the distribution of fasting insulin levels for each HOMAIR-%B category based on population. In A and B the discontinuous line indicates the mean value for all the groups while the dark line in each distribution indicates the median of the measurement for that population.
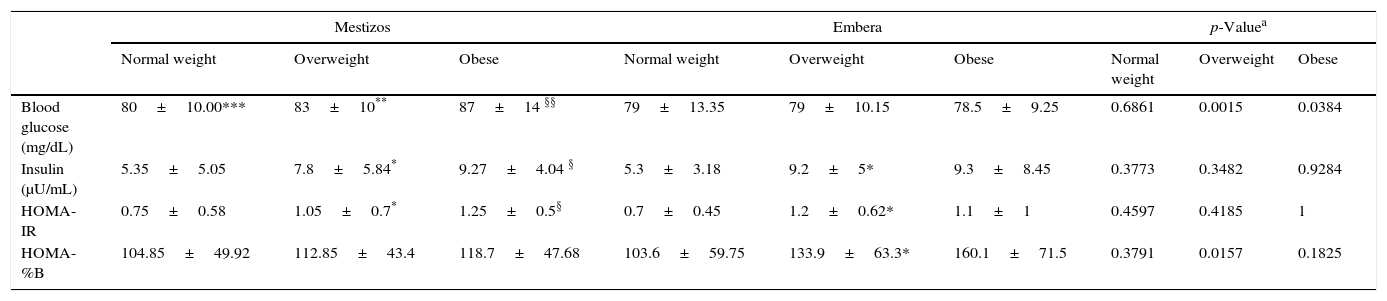
It was noteworthy that for both populations either general or central obesity results in deterioration of glucose control and insulin action. This effect was more clearly seen among mestizos than among Embera, since for the latter glucose levels were lower and approximately constant across BMI categories (Tables 4 and S2).
Metabolic characteristics based on BMI categories and population.
| Mestizos | Embera | p-Valuea | |||||||
|---|---|---|---|---|---|---|---|---|---|
| Normal weight | Overweight | Obese | Normal weight | Overweight | Obese | Normal weight | Overweight | Obese | |
| Blood glucose (mg/dL) | 80±10.00*** | 83±10** | 87±14 §§ | 79±13.35 | 79±10.15 | 78.5±9.25 | 0.6861 | 0.0015 | 0.0384 |
| Insulin (μU/mL) | 5.35±5.05 | 7.8±5.84* | 9.27±4.04 § | 5.3±3.18 | 9.2±5* | 9.3±8.45 | 0.3773 | 0.3482 | 0.9284 |
| HOMA-IR | 0.75±0.58 | 1.05±0.7* | 1.25±0.5§ | 0.7±0.45 | 1.2±0.62* | 1.1±1 | 0.4597 | 0.4185 | 1 |
| HOMA-%B | 104.85±49.92 | 112.85±43.4 | 118.7±47.68 | 103.6±59.75 | 133.9±63.3* | 160.1±71.5 | 0.3791 | 0.0157 | 0.1825 |
a Bilateral significance of the Mann–Whitney U test to compare totals between populations based on BMI category.
*p<0.05, **p<0.001 and §p<0.05, §§p<0.001 bilateral significance level of the Mann–Whitney U test to compare the normal weight vs overweight and normal weight vs obese, respectively
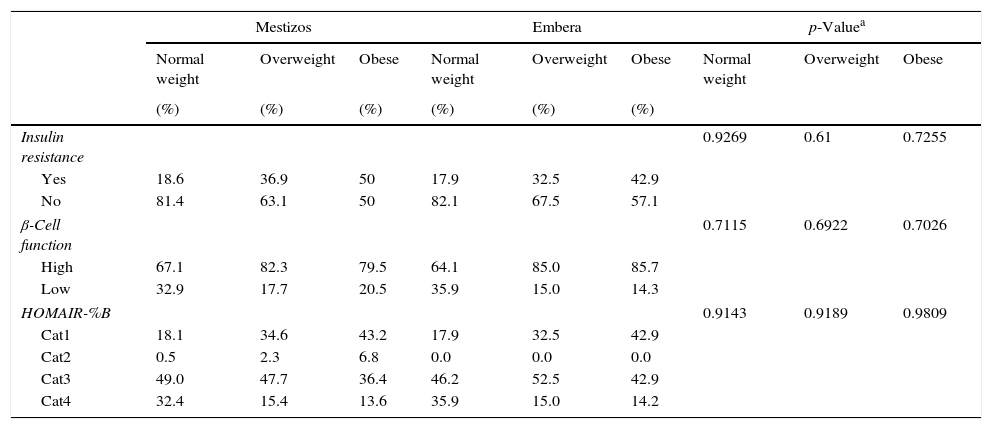
In accordance with what we observed for the continuous variables among mestizos and Embera, the percentage of individuals with IR was higher among overweight and obese people than among individuals with normal weight or without central obesity, yet, the IR frequency among the obese according to BMI did not surpass 50% (Tables 5 and S3). For both populations, the ratio of individuals with low β-cell function according to HOMA-%B decreases when adiposity increases (Tables 5 and S3).
Distribution of the percentages of insulin resistance and related measurements based on population in accordance with BMI category.
| Mestizos | Embera | p-Valuea | |||||||
|---|---|---|---|---|---|---|---|---|---|
| Normal weight | Overweight | Obese | Normal weight | Overweight | Obese | Normal weight | Overweight | Obese | |
| (%) | (%) | (%) | (%) | (%) | (%) | ||||
| Insulin resistance | 0.9269 | 0.61 | 0.7255 | ||||||
| Yes | 18.6 | 36.9 | 50 | 17.9 | 32.5 | 42.9 | |||
| No | 81.4 | 63.1 | 50 | 82.1 | 67.5 | 57.1 | |||
| β-Cell function | 0.7115 | 0.6922 | 0.7026 | ||||||
| High | 67.1 | 82.3 | 79.5 | 64.1 | 85.0 | 85.7 | |||
| Low | 32.9 | 17.7 | 20.5 | 35.9 | 15.0 | 14.3 | |||
| HOMAIR-%B | 0.9143 | 0.9189 | 0.9809 | ||||||
| Cat1 | 18.1 | 34.6 | 43.2 | 17.9 | 32.5 | 42.9 | |||
| Cat2 | 0.5 | 2.3 | 6.8 | 0.0 | 0.0 | 0.0 | |||
| Cat3 | 49.0 | 47.7 | 36.4 | 46.2 | 52.5 | 42.9 | |||
| Cat4 | 32.4 | 15.4 | 13.6 | 35.9 | 15.0 | 14.2 | |||
aSignificance of the χ2 test between populations based on BMI category.
*p<0.05, ***p<0.0001 significance level of the χ2 test for comparisons between BMI categories for the mestizo population.
We did not observe statistically significant differences in the distribution of individuals among the HOMAIR-%B categories for each BMI level between populations. In general, for both populations, an adiposity increase was accompanied by an increase in the ratio of individuals in Cat1 (Table 5).
DiscussionOverweight and particularly obesity represent an important public health problem with an increasing prevalence. It is expected that by 2030, if trends continue as they are, 1.12×10⁹ million people in the world will be obese, – 191.8 million people in Latin America11 – a trend from which Colombia is not exempt.
In this study, 41.8% of the mestizo population had weight excess (overweight and obesity) (Table 2), and 48.6% presented central obesity (Table 2). These values are comparable with those obtained in the National Survey on the Nutritional Situation of Colombia 2010 (ENSIN 2010) where 34.6% of people surveyed were overweight and 16.5% where obese.12 Similarly, our estimate of the prevalence of central obesity agrees with previous reports.12,13 According to several studies performed in Latin Americans, BMI-based obesity results for Colombia are among the lowest in the continent.14 Despite this observation, in Colombia, there is a clear trend toward increasing these values represented by a raise of more than 5 percentage points in the prevalence of general and central obesity reported on the 2010 ENSIN regarding the survey implemented in 2005.12 This trend is seen reflected both in the mestizo and the Amerindian population in this study.
In the present study the percentage of individuals with weight excess among Embera (51.3%) is similar to the 49.9% reported in this category for the Amerindians included in the ENSIN 2010,12 and in the trend of previous reports for the Embera population from Frontino, Antioquia (43.4% overweight and 1% obese)15 and from Cañamomo-Lomaprieta Reservation in the province of Caldas (35.1% overweight and 22.5% obese).16 In the latter community, the prevalence of obesity almost triples the prevalence reported for our Embera sample residing in the municipality of Jardin (Table 2). In line with observations reported for indigenous populations in South and North America,4,17 these and our study suggest an increasing prevalence of obesity in some of our Amerindian communities in Colombia; nevertheless, they do not necessarily reflect the situation of all indigenous groups in the country, as some communities are subjected to under and malnutrition.18
Among the Embera, the ratio of overweight individuals was close to 10 percentage points higher than the percentage of overweight individuals among mestizos (Table 2). The observation of a higher ratio of overweight individuals among the Embera could be the result of the intrinsic anthropometric differences between the mestizo and Amerindian populations which could affect BMI estimations. This observation, added to the application of cut-off points for BMI derived from European populations could lead to a distorted perception of the prevalence of general obesity among Embera.
Similar considerations should be taken into account when interpreting the results of the prevalence of central obesity for both populations (Table 2). In this study we applied the cut-off points suggested for Asians,8 which supposedly reflects the differences regarding this population body built compared to Europeans. Even though some advances toward the identification of suitable cut-off points for Latin American populations have been made,19 still there is no consensus regarding the criteria that must be applied to estimate the actual prevalence of central obesity in Latin America, particularly in Colombia.
IR is a relatively common condition and affects, depending on the methods and criteria chosen to define it, from 20 to 40% of the general population.20,21 In this study, we applied similar analytical methods and identical cut-off points in both populations to make the corresponding measurements. This approach revealed that the percentage of insulin resistance and low β-cell function was similar between samples of the mestizo and the Embera population (Table 2).
In the case of insulin resistance, not only its ratio but also the distribution of HOMA-IR values, as well as the 75th percentile cut-off point for this measurement, were similar between the Embera and the mestizo populations (Tables 2 and 3). Different studies have suggested that there are differences in HOMA-IR ranges7 and IR extent22 between populations, thus the lack of remarkable differences for this aspect between the two populations was unexpected, especially, if we considered the reports of high T2D prevalence in populations with a high Amerindian genetic contribution.23
This behavior differs from what we observed for HOMA-%B. At a glance, the similarity in the ratio of individuals with high β-cell function for both populations (73.9% vs 75.6, for the Embera and mestizo population, respectively (Table 2)) would suggest a comparable function level between the two populations. Nevertheless, the differences in the distribution of this variable, and consequently in the cut-off point for establishing β-cell function level (Table 3), as well as in fasting glucose suggest another possible interpretation. Cut-off point differences suggest that almost 75% of Embera, have a secretory β-cell function greater than 93.35%, compared to 88.35% in the mestizo population even when IR is similar for both populations. These differences seem to lead to higher insulin levels and an overall better control of glucose homeostasis in the Embera population (Fig. 1 and Tables 4 and S2).
For both populations, differences among gender in measurements such as HOMA-%B, general and central obesity were recorded (Tables 1 and 2). Many factors including lifestyle and sex hormones differential effects could be behind this observation.
Obesity represents a state of metabolic deregulation which favors the onset of a variety of metabolic and physiological abnormalities including IR.1 In agreement with this relation, in this study, we observed an increase in the IR ratio along with the presence of obesity in the two studied populations (Tables 5 and S3). For both populations the raise in IR was accompanied by increased insulin levels and HOMA-%B, and in the case of the mestizo population also by increased glycaemia (Tables 4 and S2). Hyperinsulinemia represents the first response to the IR phenomenon and is aimed to keep circulating glucose levels within normal ranges. The success of this measure depends on the degree of IR in target tissues and on the capability of β-cells to maintain a growing production of insulin. Consequently, a better glucose control among Embera could partly be a result of a higher β-cell secretory capability in this population
Despite the fact that IR has been considered a common and almost characteristic trait of obesity, in this study, only about half of the obese individuals were insulin resistant (Tables 5 and S3). Additionally, we observed a relative constancy in the ratio of Cat3 individuals for all BMI and central obesity categories (Tables 5 and S3), as well as comparable ratios of overweight individuals in Cat 3 and Cat1, together these observations highlight that although the presence of obesity is important, yet it is not determining on the onset of IR in our sample of mestizo and Embera populations. The relation between obesity and IR is complex. The physiological mechanisms that lie beneath this relation have been validated, and several studies recognize that IR is a factor that increases the risk of developing pathologies associated to the metabolic syndrome with a possible differential effect between the ethnic/racial groups24 also being discussed. Despite these evidences, it has been proposed the existence of “healthy obese”, individuals who have a BMI over 30kg/m2 and show no signs of IR or dyslipidemia.25 In addition to a higher insulin sensitivity, these individuals also have a lower ratio of abdominal fat and less signs of inflammation and oxidative stress, that well might contribute to differentiate between these two obese subsets,25 and which should be explored in future studies regarding the sample analyzed here.
In this study, despite the broad discussion regarding the usefulness of measurements like BMI or waist circumference as a substitute measurement for body adiposity, we observed, as mentioned above, a comparable behavior of IR regarding general and central obesity (Tables 4, 5, S2 and S3). Some meta-analyses have shown that both measurements are closely correlated,26 and that their relation with insulin and HOMA-IR20 levels is comparable, thus despite the fact that both measurements have constraints, they continue being simple and valid choices to describe trends for this characteristic at a population level.
Similar appraisal apply to the use of the HOMA model, widely used as subrogate to estimate IR and pancreatic β-cell function.27 Since this model is based on measurements taken under fasting basal conditions, the IR estimated in accordance with this model mainly reflects the hepatic IR rather than the whole body's resistance.27 Considering that hepatic IR reflects a later stage in the IR development,28 when using this measurement, there is a risk of underestimating the real ratio of individuals with IR.28 Likewise, HOMA-IR does not reflect the effects of incretin hormones, or glucose levels on insulin secretion and glucose homeostasis. On the other hand, it should be considered that opposed to HOMA-IR, HOMA-%B has not been validated as an insulin secretion measurement; therefore, the results of analysis involving this measurement must be interpreted cautiously. Despite these constraints the measurement of IR in accordance with the HOMA model still being one of the first choices in population studies given its methodological and analyses simplicity compared to other methods such as the euglycaemic-hyperinsulinemic clamp technique, the IR gold standard, or indirect methods, such as those based on the oral glucose tolerance test, which are more invasive and time demanding.27
Besides the limitations associated to the measurement of adiposity, IR or β-cell function, some characteristics of our sample, such as the low proportion of men among Embera or the differences on age composition between Embera and mestizo, prevent us from making more definite and general conclusions.
Both indigenous communities and the mestizo population in Colombia and in Latin America are going through an economic transition that leads to cultural and lifestyle changes.11,29,30 At an epidemiological level, this transition is reflected by the replacement of infectious diseases for chronic non-communicable diseases such as obesity, hypertension, diabetes and cancer, as the main causes of morbidity and mortality.11,30 Higher overweight prevalence among older women which gradually extends to other population groups is one of the facts that support this transition,31 an observation that we also did for both mestizos and Embera in this study.
Indigenous communities experience the effects of these transitions more rapidly.29 The reduction of their territories and the growing pressure to have them join the Western economic system has introduced modifications in their physical activity patterns and other aspects of their lifestyles and diet. As our results showed, the population from the Karmata Rúa reservation has not been impervious to these changes, emphasizing the need to start measures aimed at preserving the health of indigenous communities to prevent both the obesity and T2D epidemics that other indigenous communities on the continent are currently experiencing.
In summary, the results of this study suggest that there are differences in the β-cell function between mestizos and Embera which, added to lifestyle differences, could have a positive effect on the regulation of glucose homeostasis in the Embera population compared to mestizos. Although for both populations, general and central obesity represent an important IR trigger, as the results of this study suggest, other factors including genetic and environmental factors also would be involved since IR is present in only 50% of the obese individuals, and it is a frequent finding among normal weight individuals (18.6%). Considering the relation between excess adiposity and IR, the increased prevalence of obesity in the Colombian population poses an important Public Health challenge, in particular for those indigenous communities who are exposed to the effects of nutritional and epidemiological transitions because of their proximity to mestizo populations.
Ethical disclosuresProtection of human and animal subjectsThe authors declare that the procedures followed were in accordance with the regulations of the responsible Clinical Research Ethics Committee and in accordance with those of the World Medical Association and the Helsinki Declaration.
Confidentiality of dataThe authors declare that they have followed the protocols of their work center on the publication of patient data and that all the patients included in the study have received sufficient information and have given their informed consent in writing to participate in that study.
Right to privacy and informed consentThe authors have obtained the informed consent of the patients and/or subjects mentioned in the article. The author for correspondence is in possession of this document.
FundingThis work was financed using resources from Colciencias grants 115-459-21587 and 115-459-21593; Universidad de Antioquia CODI/sostenibilidad 2013–2014 (GENMOL and MASO groups); Vascular Surgery and Angiology Association from Antioquia (Asociación Antioqueña de Cirugía Vascular y Angiología); Thrombosis group; Gabriel Peláez Montoya Hospital from Jardín, Antioquia. The funders had no role in study design, data collection and analysis, decision to publish, or preparation of the manuscript.
Author contributionsMACG participated in the conception and design of the study, acquisition of data and analysis and interpretation of data. ANG, MVPM, NGL, EGA and JDB participated in the conception, design of the study and acquisition of data. DMV, DCRM, JRG, AFGP, LFGI and NDPR participated in the acquisition of data. AVP and GBB participated in the conception and design of the study. All authors read and approved the final manuscript and contributed to the analysis and writing of the article.
Conflict of interestThe authors have declared that no competing interests exist.
The authors are very grateful to the volunteers that contributed samples for this project. The authors also want to thank Dr. Erika Caro-Gómez for the review of the English version of this paper.
The following is the supplementary data to this article:
