


This study seeks to assess the influence of type 2 diabetes mellitus (T2DM) and its complications on the deterioration of muscle mass and function in patients with disease-related malnutrition (DRM).
MethodsWe conducted a descriptive cross-sectional study in a sample of 206 patients (57.6% women) with DRM. Patients were compared based on the presence or absence of diabetes mellitus (DM). Differences were also observed based on the duration of DM and the presence of complications. Age, gender, body mass index (BMI), bioimpedanciometry (BIA) parameters, ultrasonography parameters and the diagnosis of dynapenia or sarcopenia were recorded.
ResultsA total of 46 (22.33%) patients had DM, which was associated with higher values of skeletal muscle index (SMI) (DM, 7.73 (1.98)kg/m2 vs NoDM, 6.75 (1.34)kg/m2, p<0.01) in BIA analysis. Furthermore, it was associated with lower values of rectus femoris muscle thickness (RFMT) (DM, 0.85 (0.25) vs NoDM, 0.94 (0.29), p<0.05). Long-standing DM was associated with lower values of SMI (DM>10 years: 7.25 (1.46)kg/m2 vs DM<10 years: 8.18 (2.30)kg/m2, p<0.01) and with complicated DM (complicated DM, 7.57 (2.40)kg/m2 vs non-complicated DM, 7.90 (1.48)kg/m2, p<0.01). Moreover, these conditions were associated with lower values of RFMT (DM>10 years: 0.76 (0.18)cm vs DM<10 years: 0.93 (0.29) cm, p<0.05; Complicated DM, 0.77 (0.17) cm vs Non-complicated DM, 0.94 (0.29)cm, p<0.05). DM was a risk factor for the development for dynapenia (OR, 3.56, 95%CI, 1.52–8.29, p<0.01) and sarcopenia (OR, 3.08, 95%CI, 1.35–7.02, p<0.05) adjusted for age, gender, BMI and inflammatory status (determined by CRP). The presence of diabetic complications was a risk factor for dynapenia (OR, 2.08, 95%CI, 1.18–3.66; p=0.01) and sarcopenia (OR, 1.92, 95%CI, 1.12–3.28; p=0.02), after adjusting for gender, age, oncologic condition, BMI and CRP levels.
ConclusionsIn patients with DRM, poorly controlled T2DM was associated with worse muscle quantity and quality in muscle ultrasound. Long-standing DM and complicated DM were risk factors of dynapenia and sarcopenia. For clinical practice, multidisciplinary management to prevent these events is essential.
Este estudio tiene como objetivo evaluar la influencia de la diabetes mellitus tipo 2 (DM2) y sus complicaciones en el deterioro de la masa y función muscular en los pacientes con desnutrición relacionada con la enfermedad (DRE).
MétodosSe realizó un estudio descriptivo transversal en una muestra de 206 pacientes (57,6% mujeres) con DRE. Los pacientes se compararon según la presencia o ausencia de diabetes mellitus (DM), y se observaron diferencias en función de la duración de la DM y la presencia de complicaciones. Se registraron la edad, el género, el índice de masa corporal (IMC), los parámetros de bioimpedanciometría (BIA), los parámetros de ecografía y el diagnóstico de baja fuerza muscular o sarcopenia.
ResultadosCuarenta y seis (22,33%) pacientes presentaban DM, que se asoció con valores superiores del índice de masa muscular esquelética (IMME) (DM: 7,73 [1,98] kg/m2 vs. sin DM: 6,75 [1,34] kg/m2; p<0,01) en el análisis de BIA. Además, se asoció con valores inferiores del grosor del músculo recto femoral (GMRF) (DM: 0,85 [0,25] vs. sin DM: 0,94 [0,29]; p<0,05). La DM de larga duración se vinculó a valores inferiores de IMME (DM>10 años: 7,25 [1,46] kg/m2 vs. DM<10 años: 8,18 [2,30] kg/m2; p<0,01), así como con DM complicada (DM complicada: 7,57 [2,40] kg/m2 vs. DM no complicada: 7,90 [1,48] kg/m2; p<0,01). Además, estas condiciones se relacionaron con valores inferiores de GMRF (DM>10 años: 0,76 [0,18] cm vs. DM<10 años: 0,93 [0,29] cm; p<0,05). La DM se asoció con un mayor riesgo de dinapenia (OR: 3,56, IC 95%: 1,52-8,29; p<0,01) y de sarcopenia (OR: 3,08, IC 95%: 1,35-7,02; p<0,05), tras el ajuste por género, edad, IMC y estado inflamatorio (determinado por PCR). La presencia de complicaciones de la diabetes fue factor de riesgo de dinapenia (OR: 2,08, IC 95%: 1,18-3,66; p=0,01) y sarcopenia (OR: 1,92, IC 95%: 1,12-3,28; p=0,02), tras el ajuste por edad, género, enfermedad oncológica, IMC y estado inflamatorio.
ConclusionesEn los pacientes con DRE, la DM2 mal controlada se asoció con una peor cantidad y calidad muscular, en la ecografía muscular. La DM de larga duración y la DM con complicaciones crónicas resultaron ser factores de riesgo para la dinapenia y la sarcopenia. Para la práctica clínica, es esencial un manejo multidisciplinar que prevenga estos eventos.
Diabetes mellitus (DM) is a disease that, according to 2024 data, affects 589million adults worldwide, which amounts to 11.1% of this population. Its prevalence is lower among young adults (1.9% in those aged 20–24 years) and increases with age, reaching up to 24.8% in individuals aged 75–79 years. Type 2 diabetes mellitus (T2DM) is the most common form of DM, accounting for more than 90% of cases.1 In Spain, DM affects 7.51% of the population, with a higher prevalence among older individuals (23.25% of those older than 75 years of age).1–3
A condition associated with DM is disease-related malnutrition (DRM),4 which has a prevalence of 20–50% among hospitalized patients. In Spain, 23.7% of hospitalized patients have been reported to experience DRM, with regional variations and a higher prevalence among older individuals. One-third of patients with DRM also have DM.5 Patients with DM show a higher predisposition to nutritional risk and malnutrition.6 A prevalence of 39.1% for nutritional risk and 21.2% for malnutrition has been observed in hospitalized elderly patients with T2DM using the Mini Nutritional Assessment (MNA) tool.7 Similarly, using the Global Leadership Initiative on Malnutrition (GLIM) criteria, the prevalence of moderate and severe malnutrition in this population stood as 35.8% and 16.3%, respectively.7 On the other hand, according to the SeDREno study, 29.7% of hospitalized patients had DRM according to the GLIM criteria (12.5% severe, 17.2% moderate), rising to 34.8% in patients aged 70 or older. DRM was present in 34.8% of patients with DM, and DRM was an independent factor associated with DRM.8
The pathophysiological link between DM and DRM lies in the low-grade inflammation present in DM patients. This inflammation contributes to the onset and perpetuation of DRM,4 as well as muscle mass loss.9,10 In addition to DM, other chronic diseases, such as heart failure, chronic obstructive pulmonary disease (COPD), chronic kidney disease, and cancer, are associated with a higher prevalence of malnutrition due to their inflammatory components.11 Proinflammatory cytokines (e.g., TNF-a; IL-1b; IL-6) are involved in mechanisms such as muscle catabolism, inhibition of gastric emptying, and disruption of appetite-regulating hormones, ultimately leading to anorexia.11 Conversely, DRM can worsen insulin resistance, disturb adipokine balance, and interfere with protective cytokines.7
Sarcopenia is another condition associated with DM and DRM, with a prevalence from 10% to 40%12 and up to 50% in individuals older than 80 years.13 Thus, this prevalence was 18% in patients with DM (ranging from 6.3% to 47.1% in patients with T2DM.14 Sarcopenia involves the loss of muscle mass and function, leading to reduced mobility, diminished quality of life, increased risk of falls, loss of independence, and heightened cardiac, respiratory, and cognitive morbidity, as well as hospitalizations and mortality.10 Muscle strength declines more rapidly than muscle mass, making the loss of strength a crucial factor in functional impairment.15 Research has shown that DM exacerbates age-related declines in muscle mass and strength, particularly in patients with poor glycaemic control, as indicated by higher blood glucose and HbA1c levels and the presence of complications.16 Recently, sarcopenia has been proposed as a potential complication of T2DM, even in its early stages.13
Several pathophysiological mechanisms in DM contribute to the development of sarcopenia, irrespective of age, including insulin resistance, low-grade inflammation,13 mitochondrial dysfunction, lipid metabolism alterations, fatty muscle infiltration, telomere shortening, oxidative stress, and advanced glycation end-products.6,13 Additionally, muscle atrophy and reduced physical activity associated with sarcopenia further exacerbate DM through decreased glucose utilization (since striated muscle accounts for 80–90% of glucose use) and diminished production of myokines, which have anti-inflammatory and metabolic benefits.14
Moreover, the interrelation between DM, DRM, and sarcopenia has been studied highlighting body weight loss, increased frailty,15 and reduced muscle and functionality. Malnutrition, particularly reduced protein intake, is a significant contributor to sarcopenia,13 with higher rates observed in malnourished T2DM patients.13
The primary endpoint of the study was to investigate the differences in skeletal muscle mass and strength between patients with and without DM among individuals diagnosed with DRM, whereas the secondary endpoints were to characterized the influence of the time of evolution of DM and the presence of DM-related complications as contributing factors to these variations.
Materials and methodsAims and research questionThe PICO model was used to formulate the research question: P (Population): patients with DRM; I (Intervention): presence of DM and, secondarily, long-term DM and complications derived from DM; C (Comparison): absence of these conditions; O (Outcomes): appearance of differences in body composition and, more specifically, sarcopenia and/or dynapenia.
Study designWe conducted a cross-sectional study on a sample of 206 patients with disease-related malnutrition, as defined by the GLIM criteria.9 Patients were from the catchment area of a tertiary referral center and were evaluated in the Endocrinology and Nutrition Department. All participants were ambulatory outpatients referred by primary care physicians or hospital specialists for the assessment and management of malnutrition. They were consecutively recruited at the time of presentation.
Inclusion criteria required participants to be older than 18 years, have a body mass index (BMI)<25kg/m2, and meet the GLIM criteria for disease-related malnutrition. Patients with stage IV or higher chronic kidney disease, decompensated chronic liver disease, or decompensated heart failure were excluded. These exclusions were based on the potential impact of altered body composition on study outcomes, which would have needed sample stratification and a larger sample size. For the same reason, patients with a BMI>25kg/m2 were excluded due to the confounding effect of sarcopenic obesity. Among patients with DM, only those with T2DM were included. Patients with T1DM, monogenic diabetes, or type 3C diabetes were excluded. Recruitment took place from January 2021 to December 2024.
A formal sample size calculation was not performed; instead, a consecutive sampling method was applied, and statistical analyses were conducted once a sufficiently large number of participants had been enrolled.
Patients underwent evaluation through nutritional history, anthropometric measurements, electrical bioimpedance analysis, quadriceps rectus femoris muscle ultrasonography, muscle function with handgrip strength, and biochemical tests, including inflammatory and nutritional biomarkers.
The comparison across patients was made based on the diagnosis of diabetes according to the American Diabetes Association (ADA) criteria.17 Data was collected on the date of diagnosis, duration of diabetes, type of diabetes, treatment for this condition, and the presence of macrovascular and microvascular complications.
The study fully complied with the guidelines outlined in the Declaration of Helsinki. All procedures performed on the patients were approved by the ethics and drug research committees (DREC). The study was registered under the code PI 22-2907 and was approved on October 13th, 2022.
Study variablesClinical variablesAge (in years), gender (male/female), and the presence of conditions causing malnutrition (based on previous health records) were taken into consideration. Malnutrition was defined using the GLIM criteria, requiring the presence of at least 1 phenotypic criterion (weight loss>5% in the past 6 months or >10% in the last year; BMI<20kg/m2 for individuals under 70 years of age or <22kg/m2 for those older than 70 years; or decreased muscle mass) and 1 etiological criterion (reduced food intake or assimilation, or an inflammatory burden due to acute or an inflammatory burden due to acute or chronic illness).9
Sarcopenia was defined using the European Working Group on Sarcopenia on Older People (EWGSOP2) criteria: the presence of low muscle strength, low muscle quantity or quality, and low physical performance. The presence of the first criterion indicates probable sarcopenia, with the diagnosis confirmed when both the 1st and 2nd criteria are met. Sarcopenia is categorized as severe when all three criteria are present,8 while dynapenia is characterized by a loss of muscle strength maintaining a normal skeletal muscle mass.18
Diabetes was diagnosed following the ADA criteria. The diagnostic methods included measurement of glycated hemoglobin (A1c), with a threshold of ≥6.5%, fasting plasma glucose (FPG) levels of ≥126mg/dL after at least 8h of fasting, or a 2-h plasma glucose level of ≥200mg/dL during an oral glucose tolerance test (OGTT) with a 75-g glucose load. Additionally, a random plasma glucose level of ≥200mg/dL, accompanied by symptoms of hyperglycemia, was also considered diagnostic. In cases of uncertain hyperglycemia, a 2nd confirmatory test was performed to ensure diagnostic accuracy.13 Information was gathered regarding the date of diagnosis, the duration of DM, the type of DM, the treatment approaches employed for this condition, and the presence of both macro-vascular and microvascular complications. Furthermore, in addition to DM, the patients had other chronic illnesses that led to the development of DRM.
AnthropometryAnthropometric variables such as height (m), body weight (kg), and BMI (kg/m2) were recorded. Body Weight was measured using a scale with an accuracy of 100g (0.1kg; Seca, Birmingham, United Kingdom), with patients unclothed. Height was determined using a stadiometer (Seca, Birmingham, United Kingdom), with patients measured in a standing position. BMI was calculated using the formula:
The percentage of body weight loss was calculated using the formula:
Upper arm circumference (AC, cm) and calf circumference (CC, cm) were assessed. A measuring tape with a precision of 0.001m was used for these measurements.
Body composition- •
Bioimpedanciometry: bioelectrical impedance analysis (BIA) was performed in the patients using the NUTRILAB device (EFG, Akern, Milan, Italy). The device consisted of a signal generator that produced an alternating current of 0.8mA at a frequency of 50kHz, with electrodes placed on the back of the right hand and foot. Specific parameters, including phase angle (PA), reactance (Xc) and resistance (Rz), were assessed after a fasting period of at least 5h. The appendicular skeletal muscle index (ASMI), estimated using Sergi's formula,19 was used to assess low muscle mass and diagnose malnutrition and sarcopenia (ASMI < 7 kg/m2 in men and < 5.5 kg/m2 in women).9,10
- •
Muscle ultrasonography: muscle ultrasonography of the quadriceps rectus femoris (QRF) was performed on the dominant lower limb using a 10–12MHz probe with a multifrequency linear matrix (Mindray Z60, Shenzhen, Guangdong, China). Ultrasonographic measurements were obtained with the patient in a supine position. The probe was placed perpendicular to the transverse axis of the dominant leg, at the lower third of the distance between the iliac crest and the upper border of the patella.20 All images were obtained by the same operator. This operator adhered to a standardized imaging protocol to ensure uniformity in data acquisition. Each participant involved in the process underwent specialized training in muscle ultrasound techniques, covering key aspects such as probe placement, image enhancement, and strategies to minimize tissue compression and avoid structural distortion. During scanning, only light pressure was applied to the limb, sufficient to obtain a clear image without altering the appearance of subcutaneous fat or muscle architecture. This method was designed to maintain anatomical fidelity and ensure consistent imaging across subjects.
Ultrasound images were processed using an AI-based imaging system (PIIXMEDTM; DAWAKO MedTech; Valencia, Spain). This system enabled 2D feature extraction for conventional B-Mode ultrasound imaging and calculated single values per feature within a region of interest (ROI). Various algorithms were applied to extract biomarkers from the identified features, analysing the morphological structure, echogenicity-based muscle quality, and texture-related biomarkers within the ROI.21 Muscle mass parameters included the rectus femoris muscle area (RFMA, cm2) and rectus femoris muscle thickness (RFMT, cm), representing the cross-sectional muscle area and muscle belly thickness. Subcutaneous fat thickness (SFT) was measured in the longitudinal section to determine the thickness of the subcutaneous adipose tissue. Muscle quality was evaluated through the pennation angle (degrees), defined as the angle between the muscle fibers and the lower aponeurosis. Muscle quality indexes were determined using the multithresholding (multi-Otsu) algorithm, which categorized gray intensity levels within the image into different classes. This algorithm calculated thresholds for three categories in the transverse ROI: the muscle index (MiT), representing the percentage of muscular tissue; the fat index (FATiT), indicating the percentage of fat; and the no muscle no fat index (NMNFiT), corresponding to the percentage of other structures such as collagen, connective tissue, or fibrosis. These indices were expressed as percentage within the ROI.22 The segmentation method used in this study has been previously validated by García-Herreros et al., demonstrating excellent agreement with manual assessments. Reported intraclass correlation coefficients were 0.912 for subcutaneous fat, 0.96 for muscle thickness, and 0.99 for muscle area.21
Muscle functionHandgrip Strength was performed using the JAMAR™ hand dynamometer on the dominant hand, with the arm positioned at a right angle to the forearm, while the patient remained seated. The arithmetic mean of three measurements was calculated and used as the final value. The lower values were defined as those below the cut-off points established for sarcopenia in EWSOP2 criteria (Low muscle strength was defined as <27kg in men and <16kg in women).10
Biochemical biomarkersBiochemical blood parameters were established in the usual control analysis (Cobas c-711 autoanalyzer (Roche Diagnostics, Basel, Switzerland)). Blood biomarkers measured were C-reactive protein (CRP) (mg/L); albumin (g/dL); prealbumin (mg/dL). We evaluated new indexes that combine inflammatory markers such as C-reactive protein (CRP) and serum proteins; these indexes included CRP–albumin and CRP–prealbumin ratios.23
Data analysisThe data was analyzed using the SPSS 15.0 statistical package (SPSS Inc., IL, United States), which was officially licensed for use by Universidad de Valladolid (Valladolid, Spain). For continuous variables, normality was assessed using the Kolmogorov–Smirnov test. These variables were expressed as mean (standard deviation). Nonparametric variables as median (p25–p75). Differences in parametric variables were analyzed using unpaired Student's t-tests, while non-parametric variables were analyzed using the Friedman, Wilcoxon, Kruskal–Wallis, and Mann–Whitney U tests. Qualitative variables were expressed as percentages (%) and their differences were evaluated using the Chi-square test, with Fisher's and Yates’ corrections applied when necessary. A p-value<0.05 was considered statistically significant, while a p-value<0.01 indicated high statistical significance.
A multivariate analysis was conducted using binary logistic regression to evaluate the influence of diabetes mellitus, its complications, and disease duration. Each of these 3 models was adjusted for sex, age, BMI, inflammatory status, and presence or absence of cancer.
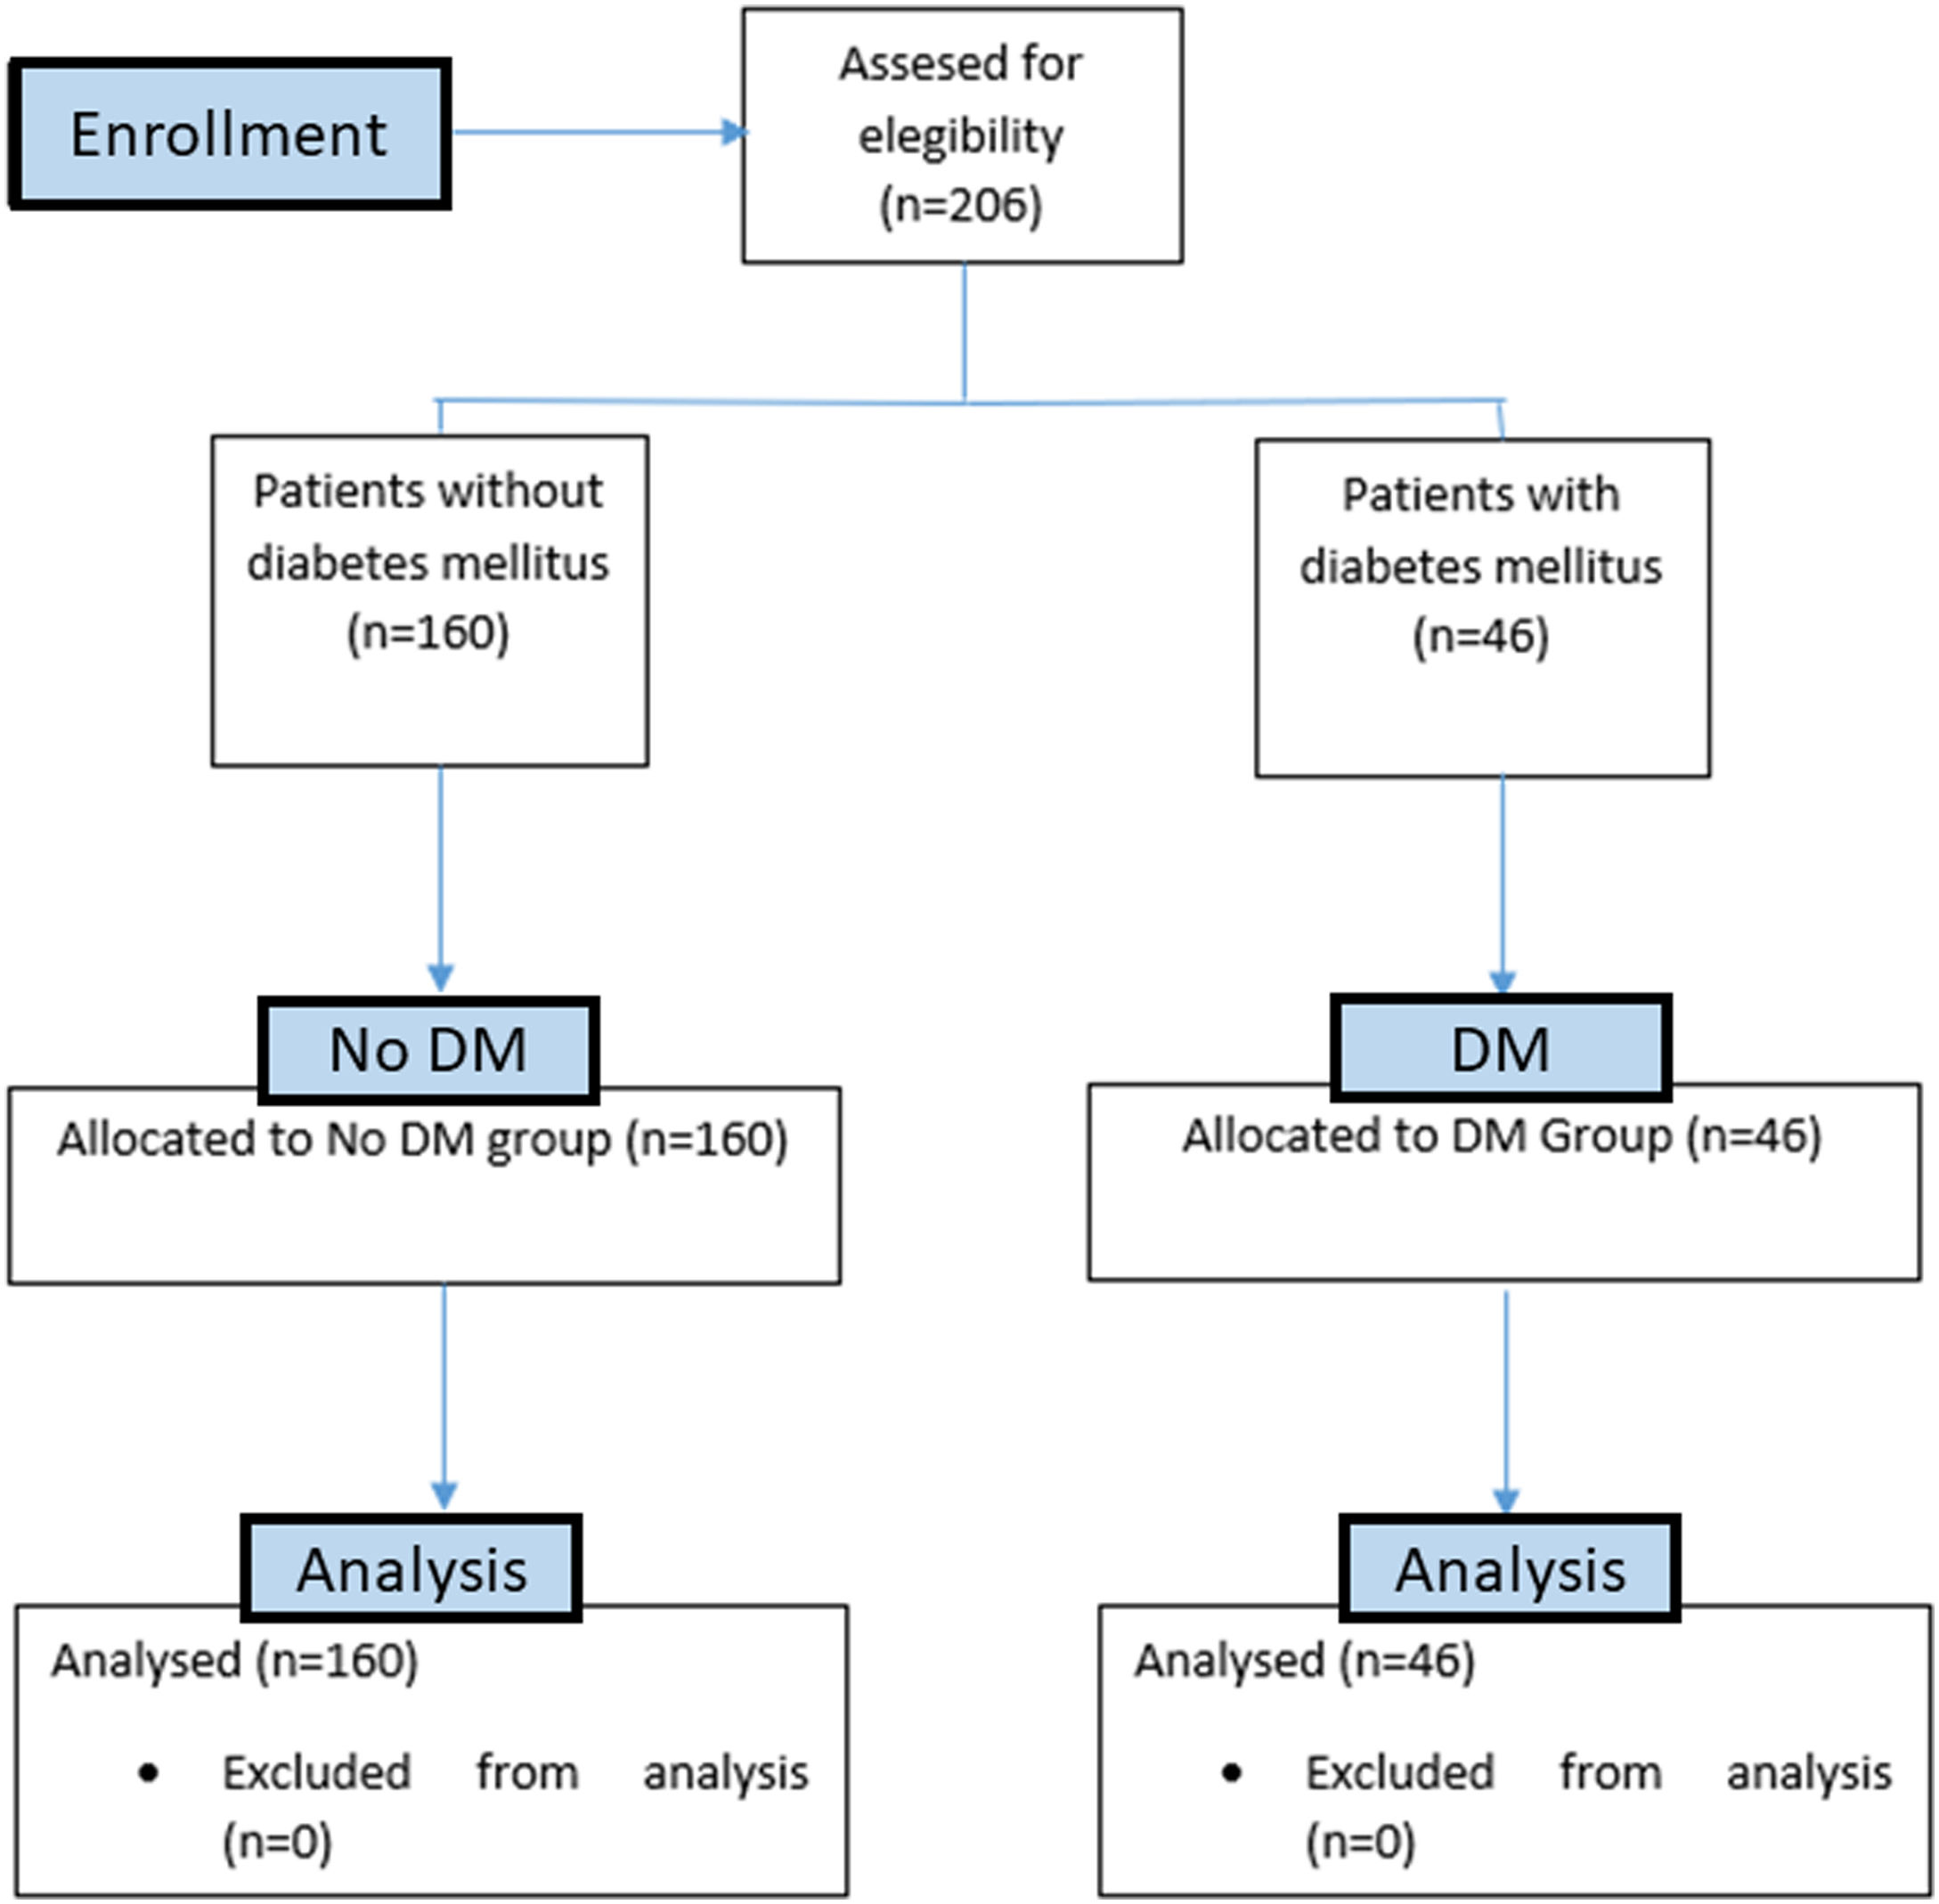
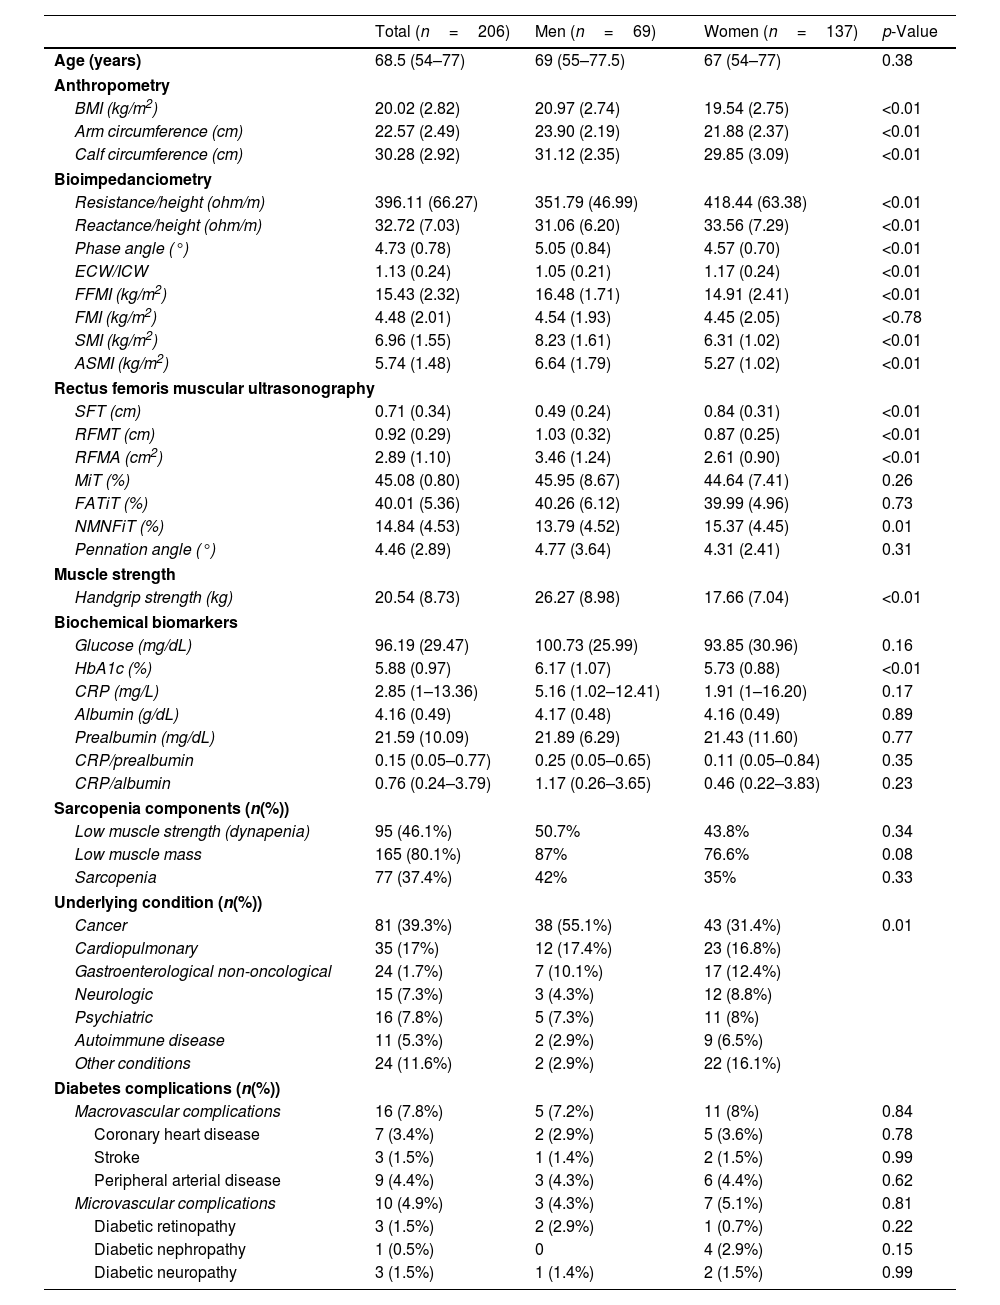
ResultsSample descriptionA total of 206 patients with malnutrition were recruited for this study (Fig. 1). The mean age of patients were 63.72 (15.95) years. A total of 112 of these patients (54.6% of the sample) were older than 65 years. Most were women, accounting for 137 individuals (66.5%). Most patients had cancer, followed by cardiopulmonary and gastroenterological non-oncological conditions (Table 1).
Differences in nutritional assessment variables between genders.
| Total (n=206) | Men (n=69) | Women (n=137) | p-Value | |
|---|---|---|---|---|
| Age (years) | 68.5 (54–77) | 69 (55–77.5) | 67 (54–77) | 0.38 |
| Anthropometry | ||||
| BMI (kg/m2) | 20.02 (2.82) | 20.97 (2.74) | 19.54 (2.75) | <0.01 |
| Arm circumference (cm) | 22.57 (2.49) | 23.90 (2.19) | 21.88 (2.37) | <0.01 |
| Calf circumference (cm) | 30.28 (2.92) | 31.12 (2.35) | 29.85 (3.09) | <0.01 |
| Bioimpedanciometry | ||||
| Resistance/height (ohm/m) | 396.11 (66.27) | 351.79 (46.99) | 418.44 (63.38) | <0.01 |
| Reactance/height (ohm/m) | 32.72 (7.03) | 31.06 (6.20) | 33.56 (7.29) | <0.01 |
| Phase angle (°) | 4.73 (0.78) | 5.05 (0.84) | 4.57 (0.70) | <0.01 |
| ECW/ICW | 1.13 (0.24) | 1.05 (0.21) | 1.17 (0.24) | <0.01 |
| FFMI (kg/m2) | 15.43 (2.32) | 16.48 (1.71) | 14.91 (2.41) | <0.01 |
| FMI (kg/m2) | 4.48 (2.01) | 4.54 (1.93) | 4.45 (2.05) | <0.78 |
| SMI (kg/m2) | 6.96 (1.55) | 8.23 (1.61) | 6.31 (1.02) | <0.01 |
| ASMI (kg/m2) | 5.74 (1.48) | 6.64 (1.79) | 5.27 (1.02) | <0.01 |
| Rectus femoris muscular ultrasonography | ||||
| SFT (cm) | 0.71 (0.34) | 0.49 (0.24) | 0.84 (0.31) | <0.01 |
| RFMT (cm) | 0.92 (0.29) | 1.03 (0.32) | 0.87 (0.25) | <0.01 |
| RFMA (cm2) | 2.89 (1.10) | 3.46 (1.24) | 2.61 (0.90) | <0.01 |
| MiT (%) | 45.08 (0.80) | 45.95 (8.67) | 44.64 (7.41) | 0.26 |
| FATiT (%) | 40.01 (5.36) | 40.26 (6.12) | 39.99 (4.96) | 0.73 |
| NMNFiT (%) | 14.84 (4.53) | 13.79 (4.52) | 15.37 (4.45) | 0.01 |
| Pennation angle (°) | 4.46 (2.89) | 4.77 (3.64) | 4.31 (2.41) | 0.31 |
| Muscle strength | ||||
| Handgrip strength (kg) | 20.54 (8.73) | 26.27 (8.98) | 17.66 (7.04) | <0.01 |
| Biochemical biomarkers | ||||
| Glucose (mg/dL) | 96.19 (29.47) | 100.73 (25.99) | 93.85 (30.96) | 0.16 |
| HbA1c (%) | 5.88 (0.97) | 6.17 (1.07) | 5.73 (0.88) | <0.01 |
| CRP (mg/L) | 2.85 (1–13.36) | 5.16 (1.02–12.41) | 1.91 (1–16.20) | 0.17 |
| Albumin (g/dL) | 4.16 (0.49) | 4.17 (0.48) | 4.16 (0.49) | 0.89 |
| Prealbumin (mg/dL) | 21.59 (10.09) | 21.89 (6.29) | 21.43 (11.60) | 0.77 |
| CRP/prealbumin | 0.15 (0.05–0.77) | 0.25 (0.05–0.65) | 0.11 (0.05–0.84) | 0.35 |
| CRP/albumin | 0.76 (0.24–3.79) | 1.17 (0.26–3.65) | 0.46 (0.22–3.83) | 0.23 |
| Sarcopenia components (n(%)) | ||||
| Low muscle strength (dynapenia) | 95 (46.1%) | 50.7% | 43.8% | 0.34 |
| Low muscle mass | 165 (80.1%) | 87% | 76.6% | 0.08 |
| Sarcopenia | 77 (37.4%) | 42% | 35% | 0.33 |
| Underlying condition (n(%)) | ||||
| Cancer | 81 (39.3%) | 38 (55.1%) | 43 (31.4%) | 0.01 |
| Cardiopulmonary | 35 (17%) | 12 (17.4%) | 23 (16.8%) | |
| Gastroenterological non-oncological | 24 (1.7%) | 7 (10.1%) | 17 (12.4%) | |
| Neurologic | 15 (7.3%) | 3 (4.3%) | 12 (8.8%) | |
| Psychiatric | 16 (7.8%) | 5 (7.3%) | 11 (8%) | |
| Autoimmune disease | 11 (5.3%) | 2 (2.9%) | 9 (6.5%) | |
| Other conditions | 24 (11.6%) | 2 (2.9%) | 22 (16.1%) | |
| Diabetes complications (n(%)) | ||||
| Macrovascular complications | 16 (7.8%) | 5 (7.2%) | 11 (8%) | 0.84 |
| Coronary heart disease | 7 (3.4%) | 2 (2.9%) | 5 (3.6%) | 0.78 |
| Stroke | 3 (1.5%) | 1 (1.4%) | 2 (1.5%) | 0.99 |
| Peripheral arterial disease | 9 (4.4%) | 3 (4.3%) | 6 (4.4%) | 0.62 |
| Microvascular complications | 10 (4.9%) | 3 (4.3%) | 7 (5.1%) | 0.81 |
| Diabetic retinopathy | 3 (1.5%) | 2 (2.9%) | 1 (0.7%) | 0.22 |
| Diabetic nephropathy | 1 (0.5%) | 0 | 4 (2.9%) | 0.15 |
| Diabetic neuropathy | 3 (1.5%) | 1 (1.4%) | 2 (1.5%) | 0.99 |
BMI: body mass index; ECW/ICW: extracellular water–intracellular water index; FFMI: fat-free mass index; FMI: fat mass index; SMI: skeletal muscle index; ASMI: appendicular skeletal muscle index; SFT: subcutaneous fat thickness; RFMT: rectus femoris muscle thickness; RFMA: rectus femoris muscle area; MiT: muscle index; FATiT: fat index; NMNFiT: no muscle no fat index; HbA1c (%): glycated hemoglobin; CRP: c-reactive protein. Sarcopenia components: low muscle mass (ASMI<7kg/m2 in men and ASMI<5.5kg/m2 in women); dynapenia (low muscle strength defined as <27kg in men and <16kg in women).
Among patients with DM, 12.6% were receiving metformin, 8.3% were treated with dipeptidyl peptidase 4 (DPP-4) inhibitors, 1.9% with sodium–glucose cotransporter 2 (SGLT-2) inhibitors, 1.9% with glinides, and 1.0% with sulfonylureas. Insulin therapy was used in 7.8% of patients with DM.
Sarcopenia was present in 77 patients (37.4%). Low muscle mass, assessed by BIA, was observed in 165 patients (80.1%), while 95 patients (46.1%) had low muscle strength, as measured by handgrip strength.
DM was present in 22.3% of patients, of whom 58.7% were women (p>0.05). The mean duration of diabetes was 10.53 (6.87) years, and 25 patients had at least one diabetes-related complication.
Gender-based differences in anthropometric measurements, impedanciometry, muscular ultrasonography, and biochemical variables are presented in Table 1. Regarding glycemic control, men exhibited higher HbA1c levels than women, although no significant differences were found in basal glucose levels. Furthermore, no differences in HbA1c levels were observed between patients with and without DM; however, patients without diabetes had higher basal glucose levels. This finding may be attributed to the pharmacological treatment received by patients with diabetes (Table 1).
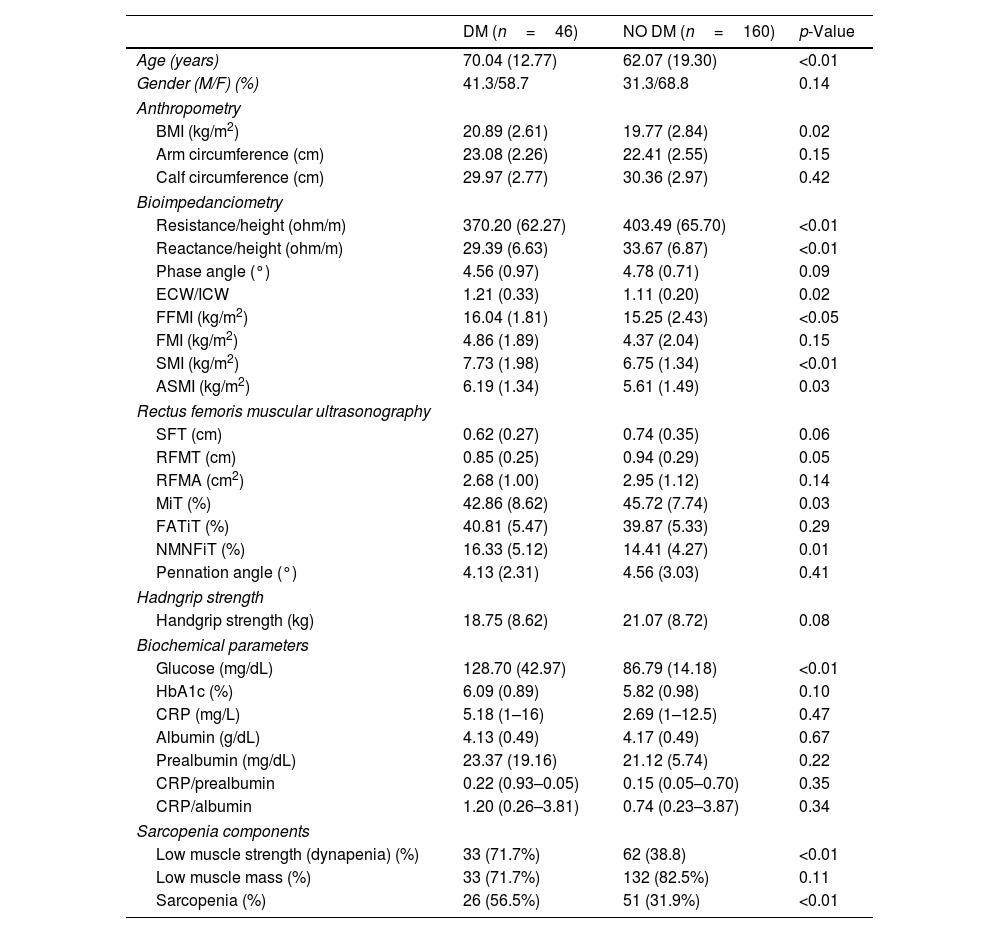
Relationship between DM and nutritional assessmentTable 2 illustrates the differences in anthropometric measurements, bioelectrical impedance analysis (BIA), nutritional ultrasound, biochemical parameters, and the prevalence of dynapenia and sarcopenia according to the presence of DM.
Differences in nutritional assessment variables in relation to the presence of diabetes.
| DM (n=46) | NO DM (n=160) | p-Value | |
|---|---|---|---|
| Age (years) | 70.04 (12.77) | 62.07 (19.30) | <0.01 |
| Gender (M/F) (%) | 41.3/58.7 | 31.3/68.8 | 0.14 |
| Anthropometry | |||
| BMI (kg/m2) | 20.89 (2.61) | 19.77 (2.84) | 0.02 |
| Arm circumference (cm) | 23.08 (2.26) | 22.41 (2.55) | 0.15 |
| Calf circumference (cm) | 29.97 (2.77) | 30.36 (2.97) | 0.42 |
| Bioimpedanciometry | |||
| Resistance/height (ohm/m) | 370.20 (62.27) | 403.49 (65.70) | <0.01 |
| Reactance/height (ohm/m) | 29.39 (6.63) | 33.67 (6.87) | <0.01 |
| Phase angle (°) | 4.56 (0.97) | 4.78 (0.71) | 0.09 |
| ECW/ICW | 1.21 (0.33) | 1.11 (0.20) | 0.02 |
| FFMI (kg/m2) | 16.04 (1.81) | 15.25 (2.43) | <0.05 |
| FMI (kg/m2) | 4.86 (1.89) | 4.37 (2.04) | 0.15 |
| SMI (kg/m2) | 7.73 (1.98) | 6.75 (1.34) | <0.01 |
| ASMI (kg/m2) | 6.19 (1.34) | 5.61 (1.49) | 0.03 |
| Rectus femoris muscular ultrasonography | |||
| SFT (cm) | 0.62 (0.27) | 0.74 (0.35) | 0.06 |
| RFMT (cm) | 0.85 (0.25) | 0.94 (0.29) | 0.05 |
| RFMA (cm2) | 2.68 (1.00) | 2.95 (1.12) | 0.14 |
| MiT (%) | 42.86 (8.62) | 45.72 (7.74) | 0.03 |
| FATiT (%) | 40.81 (5.47) | 39.87 (5.33) | 0.29 |
| NMNFiT (%) | 16.33 (5.12) | 14.41 (4.27) | 0.01 |
| Pennation angle (°) | 4.13 (2.31) | 4.56 (3.03) | 0.41 |
| Hadngrip strength | |||
| Handgrip strength (kg) | 18.75 (8.62) | 21.07 (8.72) | 0.08 |
| Biochemical parameters | |||
| Glucose (mg/dL) | 128.70 (42.97) | 86.79 (14.18) | <0.01 |
| HbA1c (%) | 6.09 (0.89) | 5.82 (0.98) | 0.10 |
| CRP (mg/L) | 5.18 (1–16) | 2.69 (1–12.5) | 0.47 |
| Albumin (g/dL) | 4.13 (0.49) | 4.17 (0.49) | 0.67 |
| Prealbumin (mg/dL) | 23.37 (19.16) | 21.12 (5.74) | 0.22 |
| CRP/prealbumin | 0.22 (0.93–0.05) | 0.15 (0.05–0.70) | 0.35 |
| CRP/albumin | 1.20 (0.26–3.81) | 0.74 (0.23–3.87) | 0.34 |
| Sarcopenia components | |||
| Low muscle strength (dynapenia) (%) | 33 (71.7%) | 62 (38.8) | <0.01 |
| Low muscle mass (%) | 33 (71.7%) | 132 (82.5%) | 0.11 |
| Sarcopenia (%) | 26 (56.5%) | 51 (31.9%) | <0.01 |
M: male; F: female; BMI: body mass index; ECW/ICW: extracellular water–intracellular water index; FFMI: fat-free mass index; FMI: fat mass index; SMI: skeletal muscle index; ASMI: appendicular skeletal muscle index; SFT: subcutaneous fat thickness; RFMT: rectus femoris muscle thickness; RFMA: rectus femoris muscle area; MiT: muscle index; FATiT: fat index; NMNFiT: no muscle no fat index; CRP: c-reactive protein. Sarcopenia components: low muscle mass (ASMI<7kg/m2 in men and ASMI<5.5kg/m2 in women); dynapenia (low muscle strength defined as <27kg in men and <16kg in women).
Patients with DM were older than those without the condition, and their BMI was significantly higher. DM was associated with lower Rz/height and Xc/height values, as well as higher fat-free mass index (FFMI), skeletal muscle index (SMI), and ASMI on BIA. Ultrasound of the rectus femoris revealed reduced muscle thickness, lower muscle index (MiT), and higher non-muscle/non-fat infiltration index (NMNFiT in patients with DM.
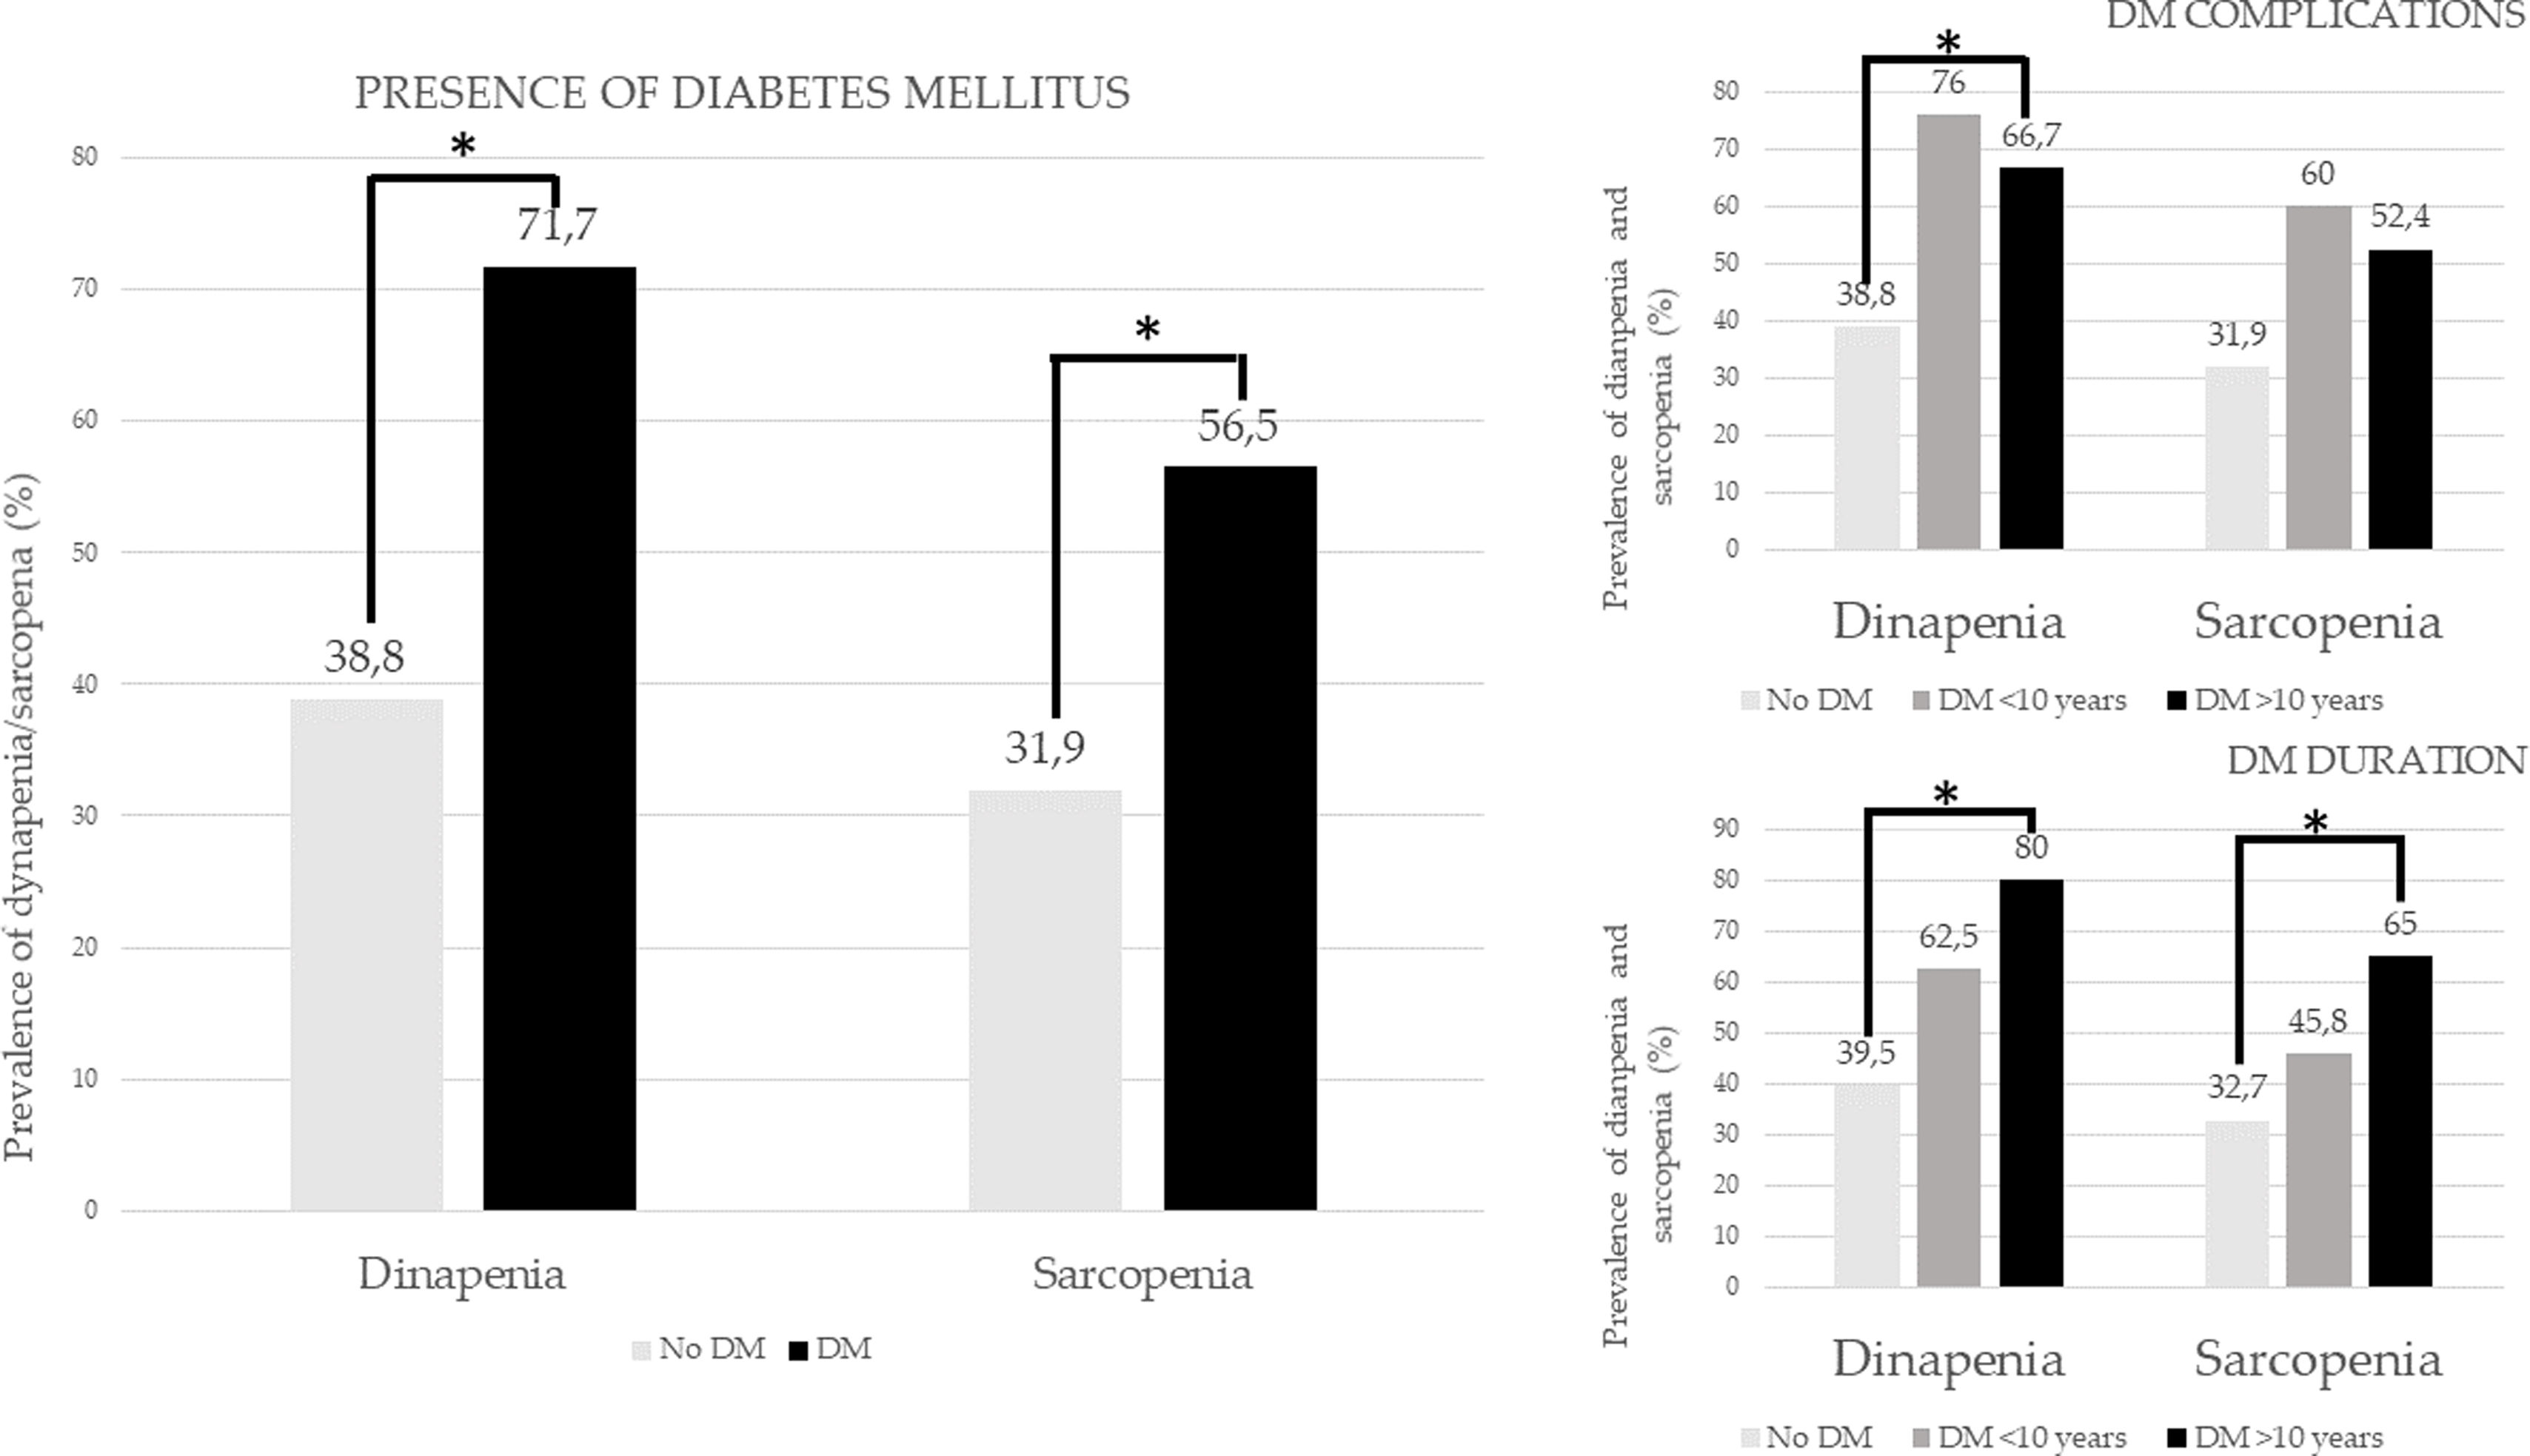
Dynapenia and sarcopenia were significantly more prevalent among patients with DM (Fig. 2). Furthermore, a multivariate analysis adjusted for age, gender, BMI and inflammatory status (determined by CRP) showed that DM was a risk factor for the development for dynapenia (OR, 3.56, 95%CI, 1.52–8.29, p<0.01) and sarcopenia (OR, 3.08, 95%CI, 1.35–7.02, p<0.05). BMI was identified as a protective factor against sarcopenia (OR, 0.39, 95%CI, 0.72–0.97), but not against dynapenia.
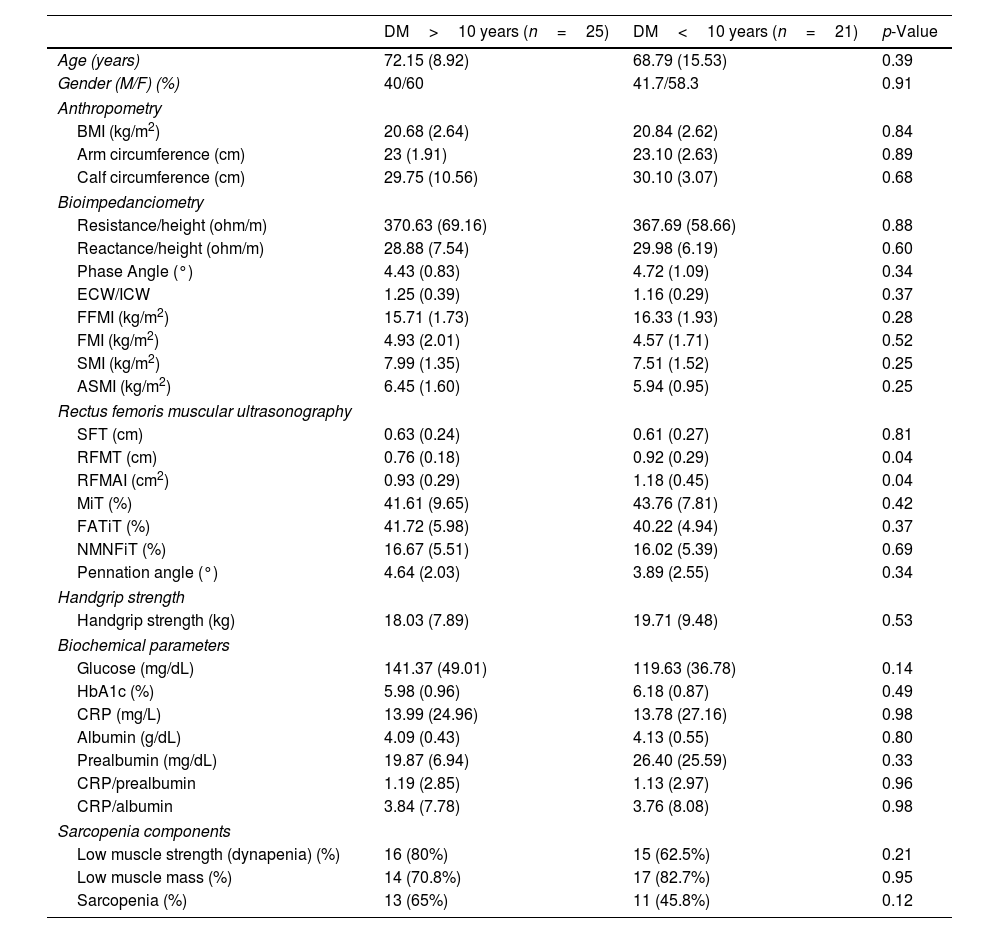
Relationship between duration of the DM and nutritional assessmentTable 3 shows differences in anthropometric, impedance, muscle ultrasound, and biochemical parameters based on DM duration: long-term DM (>10 years) vs short-term DM (<10 years).
Differences in nutritional assessment variables in relation to the duration of diabetes (in patients with diabetes).
| DM>10 years (n=25) | DM<10 years (n=21) | p-Value | |
|---|---|---|---|
| Age (years) | 72.15 (8.92) | 68.79 (15.53) | 0.39 |
| Gender (M/F) (%) | 40/60 | 41.7/58.3 | 0.91 |
| Anthropometry | |||
| BMI (kg/m2) | 20.68 (2.64) | 20.84 (2.62) | 0.84 |
| Arm circumference (cm) | 23 (1.91) | 23.10 (2.63) | 0.89 |
| Calf circumference (cm) | 29.75 (10.56) | 30.10 (3.07) | 0.68 |
| Bioimpedanciometry | |||
| Resistance/height (ohm/m) | 370.63 (69.16) | 367.69 (58.66) | 0.88 |
| Reactance/height (ohm/m) | 28.88 (7.54) | 29.98 (6.19) | 0.60 |
| Phase Angle (°) | 4.43 (0.83) | 4.72 (1.09) | 0.34 |
| ECW/ICW | 1.25 (0.39) | 1.16 (0.29) | 0.37 |
| FFMI (kg/m2) | 15.71 (1.73) | 16.33 (1.93) | 0.28 |
| FMI (kg/m2) | 4.93 (2.01) | 4.57 (1.71) | 0.52 |
| SMI (kg/m2) | 7.99 (1.35) | 7.51 (1.52) | 0.25 |
| ASMI (kg/m2) | 6.45 (1.60) | 5.94 (0.95) | 0.25 |
| Rectus femoris muscular ultrasonography | |||
| SFT (cm) | 0.63 (0.24) | 0.61 (0.27) | 0.81 |
| RFMT (cm) | 0.76 (0.18) | 0.92 (0.29) | 0.04 |
| RFMAI (cm2) | 0.93 (0.29) | 1.18 (0.45) | 0.04 |
| MiT (%) | 41.61 (9.65) | 43.76 (7.81) | 0.42 |
| FATiT (%) | 41.72 (5.98) | 40.22 (4.94) | 0.37 |
| NMNFiT (%) | 16.67 (5.51) | 16.02 (5.39) | 0.69 |
| Pennation angle (°) | 4.64 (2.03) | 3.89 (2.55) | 0.34 |
| Handgrip strength | |||
| Handgrip strength (kg) | 18.03 (7.89) | 19.71 (9.48) | 0.53 |
| Biochemical parameters | |||
| Glucose (mg/dL) | 141.37 (49.01) | 119.63 (36.78) | 0.14 |
| HbA1c (%) | 5.98 (0.96) | 6.18 (0.87) | 0.49 |
| CRP (mg/L) | 13.99 (24.96) | 13.78 (27.16) | 0.98 |
| Albumin (g/dL) | 4.09 (0.43) | 4.13 (0.55) | 0.80 |
| Prealbumin (mg/dL) | 19.87 (6.94) | 26.40 (25.59) | 0.33 |
| CRP/prealbumin | 1.19 (2.85) | 1.13 (2.97) | 0.96 |
| CRP/albumin | 3.84 (7.78) | 3.76 (8.08) | 0.98 |
| Sarcopenia components | |||
| Low muscle strength (dynapenia) (%) | 16 (80%) | 15 (62.5%) | 0.21 |
| Low muscle mass (%) | 14 (70.8%) | 17 (82.7%) | 0.95 |
| Sarcopenia (%) | 13 (65%) | 11 (45.8%) | 0.12 |
M: male; F: female; BMI: body mass index; ECW/ICW: extracellular water–intracellular water index; FFMI: fat-free mass index; FMI: fat mass index; SMI: skeletal muscle index; ASMI: appendicular skeletal muscle index; SFT: subcutaneous fat thickness; RFMT: rectus femoris muscle thickness; RFMAI: rectus femoris muscle area index; MiT: muscle index; FATiT: fat index; NMNFiT: no muscle no fat index; CRP: c-reactive protein. Sarcopenia components: low muscle mass (ASMI<7kg/m2 in men and ASMI<5.5kg/m2 in women); dynapenia (low muscle strength defined as <27kg in men and <16kg in women).
Patients with long-term DM were older than those with short-term DM. Longer DM duration was associated with lower RFMT and a reduced rectus femoris area index (RFMAI). Dynapenia and sarcopenia were more common in patients with long-standing DM vs those with DM of <10 years. Patients without DM had the lowest prevalence of both conditions (Fig. 2).
In a multivariate analysis adjusted for gender, age, BMI, and CRP levels, a >10-year history of DM was a significant risk factor for both dynapenia (OR, 2.26, 95%CI, 1.27–4.03, p<0.01) and sarcopenia (OR, 1.99, 95%CI, 1.18–3.41, p=0.01).
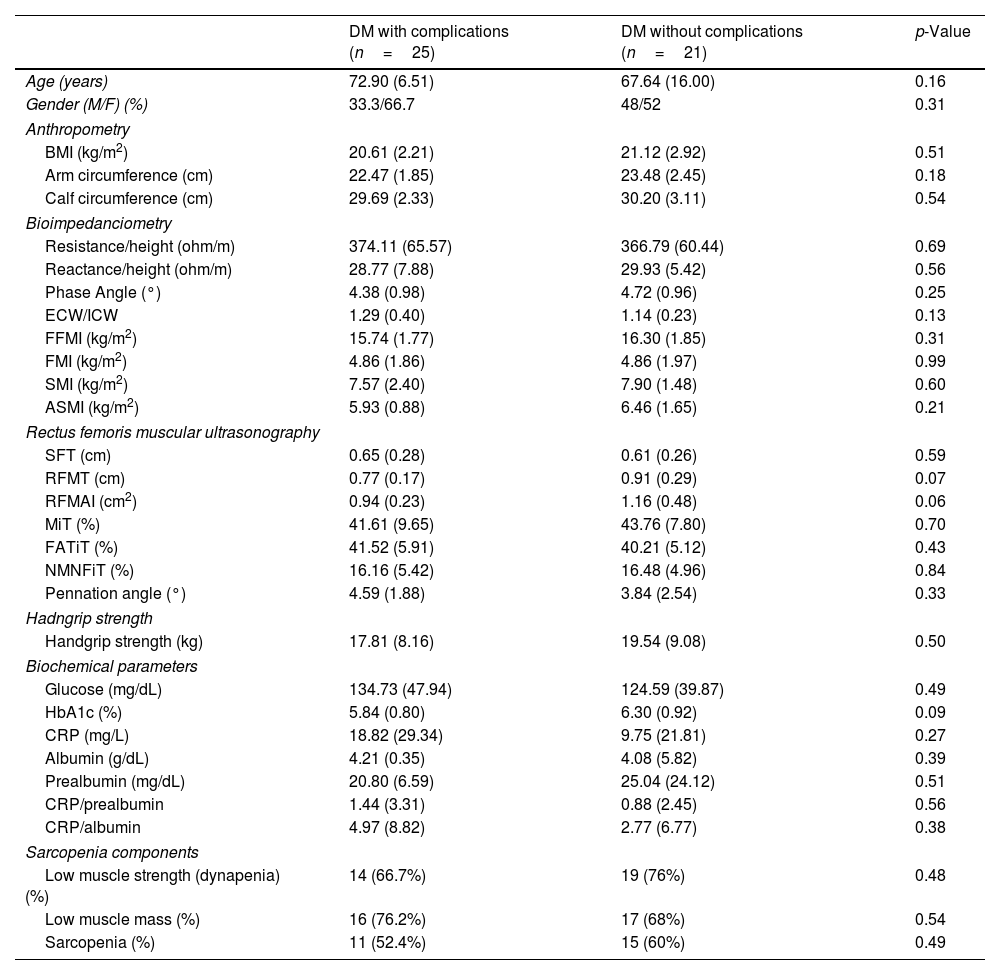
Relationship between DM complication and nutritional assessmentA total of 25 patients (54.35% of those with DM) had complications, including microvascular (diabetic nephropathy, retinopathy, and neuropathy) and macrovascular conditions (stroke, coronary heart disease and peripheral artery disease) (Fig. 2). Table 4 compares nutritional assessment outcomes among patients with DM-related complications and those without DM-related complications.
Differences in nutritional assessment variables in relation to the presence of diabetes complications (in patients with diabetes): diabetic retinopathy, diabetic nephropathy, and diabetic neuropathy as microvascular complications; stroke, coronary artery disease, peripheral artery disease, and diabetic foot as macrovascular complications.
| DM with complications (n=25) | DM without complications (n=21) | p-Value | |
|---|---|---|---|
| Age (years) | 72.90 (6.51) | 67.64 (16.00) | 0.16 |
| Gender (M/F) (%) | 33.3/66.7 | 48/52 | 0.31 |
| Anthropometry | |||
| BMI (kg/m2) | 20.61 (2.21) | 21.12 (2.92) | 0.51 |
| Arm circumference (cm) | 22.47 (1.85) | 23.48 (2.45) | 0.18 |
| Calf circumference (cm) | 29.69 (2.33) | 30.20 (3.11) | 0.54 |
| Bioimpedanciometry | |||
| Resistance/height (ohm/m) | 374.11 (65.57) | 366.79 (60.44) | 0.69 |
| Reactance/height (ohm/m) | 28.77 (7.88) | 29.93 (5.42) | 0.56 |
| Phase Angle (°) | 4.38 (0.98) | 4.72 (0.96) | 0.25 |
| ECW/ICW | 1.29 (0.40) | 1.14 (0.23) | 0.13 |
| FFMI (kg/m2) | 15.74 (1.77) | 16.30 (1.85) | 0.31 |
| FMI (kg/m2) | 4.86 (1.86) | 4.86 (1.97) | 0.99 |
| SMI (kg/m2) | 7.57 (2.40) | 7.90 (1.48) | 0.60 |
| ASMI (kg/m2) | 5.93 (0.88) | 6.46 (1.65) | 0.21 |
| Rectus femoris muscular ultrasonography | |||
| SFT (cm) | 0.65 (0.28) | 0.61 (0.26) | 0.59 |
| RFMT (cm) | 0.77 (0.17) | 0.91 (0.29) | 0.07 |
| RFMAI (cm2) | 0.94 (0.23) | 1.16 (0.48) | 0.06 |
| MiT (%) | 41.61 (9.65) | 43.76 (7.80) | 0.70 |
| FATiT (%) | 41.52 (5.91) | 40.21 (5.12) | 0.43 |
| NMNFiT (%) | 16.16 (5.42) | 16.48 (4.96) | 0.84 |
| Pennation angle (°) | 4.59 (1.88) | 3.84 (2.54) | 0.33 |
| Hadngrip strength | |||
| Handgrip strength (kg) | 17.81 (8.16) | 19.54 (9.08) | 0.50 |
| Biochemical parameters | |||
| Glucose (mg/dL) | 134.73 (47.94) | 124.59 (39.87) | 0.49 |
| HbA1c (%) | 5.84 (0.80) | 6.30 (0.92) | 0.09 |
| CRP (mg/L) | 18.82 (29.34) | 9.75 (21.81) | 0.27 |
| Albumin (g/dL) | 4.21 (0.35) | 4.08 (5.82) | 0.39 |
| Prealbumin (mg/dL) | 20.80 (6.59) | 25.04 (24.12) | 0.51 |
| CRP/prealbumin | 1.44 (3.31) | 0.88 (2.45) | 0.56 |
| CRP/albumin | 4.97 (8.82) | 2.77 (6.77) | 0.38 |
| Sarcopenia components | |||
| Low muscle strength (dynapenia) (%) | 14 (66.7%) | 19 (76%) | 0.48 |
| Low muscle mass (%) | 16 (76.2%) | 17 (68%) | 0.54 |
| Sarcopenia (%) | 11 (52.4%) | 15 (60%) | 0.49 |
M: male; F: female; BMI: body mass index; ECW/ICW: extracellular water–intracellular water index; FFMI: fat-free mass index; FMI: fat mass index; SMI: skeletal muscle index; ASMI: appendicular skeletal muscle index; SFT: subcutaneous fat thickness; RFMT: rectus femoris muscle thickness; RFMAI: rectus femoris muscle area index; MiT: muscle index; FATiT: fat index; NMNFiT: no muscle no fat index; CRP: c-reactive protein. Sarcopenia components: low muscle mass (ASMI<7kg/m2 in men and ASMI<5.5kg/m2 in women); dynapenia (low muscle strength defined as <27kg in men and <16kg in women).
No significant differences in nutritional parameters were observed between patients with and without complications among those with DM (Table 4). However, patients with uncomplicated DM had a higher prevalence of sarcopenia and dynapenia vs those with complications. In turn, patients with complications showed a higher prevalence of both conditions than those without DM (Fig. 2).
Multivariate analysis revealed that the presence of DM-related complications was a significant risk factor for dynapenia (OR, 2.08, 95%CI, 1.18–3.66; p=0.01) and sarcopenia (OR, 1.92, 95%CI, 1.12–3.28; p=0.02), after adjusting for gender, age, oncologic condition, BMI and CRP levels.
DiscussionThe present study has identified a relationship between the presence of diabetes and its complications with various body composition parameters, as well as with the occurrence of sarcopenia. This study found differences in key nutritional assessment parameters based on the presence of T2DM, its duration, and complications. In this regard, muscle mass was decreased in patients with T2DM, both in quality and quantity in muscle ultrasonography. Of note, in our study, SMI, ASMI and FFMI values, were higher in patients with DM; it is a known phenomenom that BIA often overestimates muscle mass in DM due to increased total body water, but a more comprehensive muscle assessment with US showed lower muscle mass in DM patients (MiT was significantly lower in patients with DM). The presence of complications and a more rapid progression of DM were associated with a higher prevalence of muscle disorders (dynapenia and sarcopenia). Moreover, the presence of T2DM, its longer duration and complications were found to be risk factors for the development of dynapenia and sarcopenia.
Patients with DM exhibited higher values of BMI. The main explanation is that BMI serve as indicators of adiposity. Obesity, along with the associated increase in adiposity, is a known risk factor for DM due to pathogenic mechanisms such as increased insulin resistance, which is prevalent in individuals with high body fat content.24 These findings have been previously reported, as demonstrated in the meta-analysis by Jayedi et al.24
Moreover, the older age observed in the group of patients with DM is consistent with findings reported in the literature.1 Cellular senescence, macromolecular dysfunction, inflammation, fibrosis, and progenitor cell dysfunction have been identified as aging associated factors contributing to the development of DM.25 Mechanisms such as insulin resistance, mitochondrial dysfunction, chronic inflammation, telomere shortening, and oxidative stress commonly occur in older individuals and lead to the loss of muscle mass.6 Since muscle is primarily responsible for glucose utilization and produces myokines (which play a beneficial role in glucose and fat metabolism), its loss is also associated with the development of DM.23 BIA analysis revealed that Xc values were lower in patients with DM. Reactance represents body cell mass, including metabolically active cells such as muscle,26 and decreases in DM due to muscle loss.
Patients with DM-related complications were older than those without complications. These findings align with other studies, which have concluded that advanced age is a risk factor for developing DM-related complications.26 Although most of these studies do not explain the nature of this association, it could be attributed to the fact that older individuals may experience a longer duration of DM progression25 and a higher likelihood of developing complications.
Sarcopenia and dynapenia were more prevalent in patients with DM. These results can be explained by factors commonly observed in DM patients, including low-grade inflammation, insulin resistance, mitochondrial dysfunction, fatty infiltration of muscles, oxidative stress, and the presence of advanced glycosylation products, all of which contribute to muscle mass loss.6,13,14 Furthermore, DRM, which has been linked to type 2 DM,4 particularly those with complications or longer DM duration, was also associated with lower protein intake and sarcopenia.25 The meta-analysis by Qiao et al. yielded similar findings, concluding that individuals with DM are at a higher risk of developing sarcopenia.16
Patients with DM-related complications showed a higher prevalence of sarcopenia and dynapenia vs those without DM-related complications. In addition, a relationship was observed between the presence of complications and the development of dynapenia and sarcopenia adjusted for age, gender and inflammatory status. Both the studies by Qiao et Purnamasari indicate an association between poor glycemic control, as assessed by HbA1c levels, and sarcopenia.16 The latter study also links a longer duration of DM with sarcopenia.16 Qiao et al. concluded that sarcopenia was positively associated with DM-related complications, although their results were not statistically significant.16 Purnamasari et al. also reported a statistically significant association between DM-related complications and sarcopenia.27
The reasons behind this association are discussed in these studies. One explanation involves reduced circulatory flow and episodes of ischemia–reperfusion, leading to muscle loss, pain, physical inactivity, albuminuria, motoneuron loss, and an imbalance between muscle denervation and reinnervation, highlighting DM-related complications as a risk factor for sarcopenia. Other contributing factors mentioned include insulin resistance, inflammation, oxidative stress, and changes in the myokine profile, which collectively explain how sarcopenia contributes to the development of DM-related complications.16,27 Furthermore, the study by Al-Sofiani et al. indicates that, in patients with DM, the presence of hyperglycemia (higher plasma glucose or HbA1c levels) is associated with a more rapid loss of muscle mass and function, beyond the age-related muscle deterioration itself (It should be noted that long-term DM is associated with older age). It also suggests the role of peripheral neuropathy in these differences in body composition.26
The SMI and the ASMI obtained through BIA were higher, but not significant in patients with DM-related complications vs those without DM-related complications. There are few studies correlating SMI with the presence of DM, but they conclude that both a low baseline SMI and a decrease in SMI, indicative of muscle mass loss, are positively associated with an increased risk of developing DM in individuals with impaired glucose regulation.28 The findings of the abovementioned study by Al-Sofiani et al., on poor glycemic control (hyperglycemia, elevated HbA1c) and the consequent appearance of DM-related complications such as neuropathy, contribute to this muscle loss and, therefore, to a decrease in SMI and ASMI.26 Nevertheless, no studies specifically correlate DM-related complications with SMI or ASMI. The observed results could potentially be explained by greater muscle mass providing the ability to manage the mechanical load imposed by higher adiposity. However, in patients with long-standing complications, muscle mass may decrease due to the onset of cachexia, driven by the abovementioned pathophysiological mechanisms. Another possible explanation is the higher proportion of men (with greater muscle mass) in the DM group with shorter duration of onset and in the DM group without complications.
Rz/height and Xc/height were lower in patients with DM. The study by Silva et al. concludes that these results are caused by alterations in body composition due to factors such as the onset of sarcopenia (due to lower cellularity, Xc decreases) and fluid retention (leading to a lower Rz).29
Muscular ultrasound results revealed lower RFMT values in patients with complicated DM. Additionally, patients with long-standing DM or complications exhibited lower RFMT values vs those with short-term or DM-related complications. While no studies specifically link DM or DM-related complications to muscular ultrasonography, existing research has found positive association between RFMT measured by ultrasonography and the ASMI.30 The same study has shown that there were an association between RFMT and T2DM, with lower values of RFMT in those patients with T2DM.30
Regarding muscle quality parameters, lower MiT was observed in patients with DM, with complicated DM, and in long-term DM, although significant differences were only found in the first case. In all three cases, there was an increase in NMNFiT. These findings correspond to poorer muscle quality in patients with DM. The study by Vogele et al. previously used AI to assess muscle quality through muscle image analysis, linking poorer muscle quality with sarcopenia and highlighting DM as an entity that favors the onset of sarcopenia.31 Kim et al. also reaches a similar conclusion by associating the higher prevalence of DM with poor muscle quality.32
Strengths and limitationsA notable strength of this study lies in its novelty, as it is among the first to explore the association between DM-related complications and parameters of body composition, including muscle ultrasonography and BIA. While previous research has addressed the interconnections among DM, sarcopenia, and DRM, such investigations remain limited. An-other key strength is the study's ability to stratify patients based on both the duration of DM (short- vs long-term) and the presence or absence of complications, thereby offering a more nuanced understanding of how these variables influence sarcopenia and body composition.
Nonetheless, several limitations must be acknowledged. One of the most important one is the fact that BIA analysis may introduce bias by overestimating muscle mass in the presence of overhydration. Furthermore, in our sample, total body water was higher among patients with DM, which could affect the accuracy of BIA measurements. Another limitation is that the study did not differentiate between macro- and microvascular complications when analyzing their associations with body composition, BIA, and muscle ultrasound findings. Moreover, specific complications—such as diabetic nephropathy, neuropathy, retinopathy, diabetic foot, coronary artery disease, peripheral arterial disease, or stroke—were not individually assessed, which may have impacted the interpretation of results. Additionally, the study population had a mean age older than 60 years, which introduces a potential confounding factor, given that sarcopenia is strongly age-related and may occur independently of DM or DRM. The likelihood of longer DM duration in older patients may further complicate these associations. On the other hand, given the sample studied, it is not possible to generalize the results to the entire population, but only to those with DRM.
Perspective for clinical practice and future researchSarcopenia and dynapenia, which affect patients’ quality of life and contribute to the development of complications and increased mortality, could be avoided through the efforts of professionals. This is based on the premise that by achieving a healthy lifestyle for patients, both the onset of T2DM and the development of vascular complications derived from diabetes would be avoided. Furthermore, a multidisciplinary approach to the 3 entities of DRM, T2DM, and sarcopenia is key to the application in clinical practice of processes for the screening, diagnosis, and staging of diabetic sarcopenia, such as that proposed by De Luis et al.,15 or to the development and standardization of techniques, always with the aim of avoiding the final consequences of these diseases.
Future research could explore the relationships between sarcopenia, DRM, and T1DM. Another area of interest could be investigating the effects of various types of DM-related complications on sarcopenia and DRM. Additionally, the influence of antidiabetic drugs on these patients warrants further study since, in addition to better glycemic control, insulin and most non-insulin antidiabetics have beneficial effects on muscle metabolism, with a reduction in the risk of sarcopenia observed with the use of insulin, a neutral muscular effect with the use of iDPP-IV and a loss of muscle mass with the use of iSGLT2.33
ConclusionsAmong individuals diagnosed with DRM, the presence of T2DM was significantly associated with reduced values of Rz and Xc normalized for height, as measured by BIA. Additionally, AI-assisted muscle ultrasound imaging revealed a decline in muscle quality in these patients. Of note, the diagnosis of T2DM, the existence of diabetes-related complications, and prolonged disease duration emerged as independent risk factors for the development of both dynapenia and sarcopenia, suggesting a multifactorial interplay between metabolic dysfunction, malnutrition, and musculoskeletal deterioration.
Author contributionsConceptualization: Juan López-Gómez and Daniel Román; Data curation: Jaime González-Gutiérrez and Juan López-Gómez; Formal analysis: Juan López-Gómez; Funding acquisition: Daniel Román; Investigation: Jaime González-Gutiérrez: Juan López-Gómez: Paloma Pérez-López: Olatz Izaola-Jauregui: Lucía Estévez-Asensio: David Primo-Martín and Daniel Román; Methodology: Juan López-Gómez and Daniel Román; Project administration: Juan López-Gómez and Daniel Román; Resources: Juan López-Gómez and Daniel Román; Software: Ángela Cebriá and Eduardo Godoy; Supervision: Juan López-Gómez and Daniel Román; Validation: Jaime González-Gutiérrez: Juan López-Gómez and Daniel Román; Visualization: Jaime González-Gutiérrez: Juan López-Gómez and Daniel Román; Writing – original draft: Jaime González-Gutiérrez and Juan López-Gómez; Writing – review & editing: Jaime González-Gutiérrez: Juan López-Gómez and Daniel Román.
Institutional review board statementThe study was conducted in full compliance with the principles outlined in the Declaration of Helsinki and approved by the Ethics Committee (protocol code PI 22-907 and 13 October 2022).
Informed consent statementInformed consent was obtained from all subjects involved in the study.
FundingNone declared.
Conflicts of interestNone declared.
Data availability statementData is unavailable due to privacy or ethical restrictions.
The authors wish to express their gratitude to DAWAKO MEDTECH for providing access to their advanced AI software for image analysis. This tool was instrumental in enabling detailed examination and achieving the outcomes presented in this study. We sincerely appreciate their support and collaboration.