


Diabetes is a worldwide problem with a greater impact in developing countries, where many people are unaware of their risk. In Mexico, women show the greatest risk for T2D. Current risk scores have been developed and validated in predominantly older European cohorts. They are not the best option in Mexican women. The development of a risk model/score in this population would be useful.
ObjectiveTo develop and validate a risk model and score that incorporates the most relevant risk factors for T2D in Mexican women of reproductive age.
MethodsThe study was carried out in two phases, with the first phase being the development of the predictive model and the second phase the validation of the model in a separate independent population. A cohort of Mexican patients of reproductive age (“Derivation Cohort”) was used to create the predictive model. It included data on 3161 women. Risk factors for identification were assessed using Cox proportional hazards regression. Finally a score with a range of 0 to 19 points was developed to identify the 2.4 year probability of developing DM2 in Mexican women of reproductive age.
Results147 new cases of T2D (4.6%) were identified in the Derivation Cohort model, 97 of 925 participants (10.48%) in the validation cohort. The risk factor predictors of T2D were: history of gestational diabetes (HR 2.69, 95% CI 1.10–6.58), BMI (HR 1.03, 95% CI 1.01–1.06), hypertriglyceridemia (HR 1.54, 95% CI 1.11–2.14) and fasting blood glucose (HR 1.06, 95% CI 1.05–1.08), with an AUC of 0.75. The AUC in the validation cohort was 0.91 (95% CI 0.87–0.94). The score had a sensitivity of 73% and specificity of 67% at a cutoff of ≥15.
ConclusionsA predictive model and risk score was developed to detect cases at risk for incident T2D. It was generated using the characteristics of Mexican women of reproductive age. This risk score is a step forward in attempting to address the generational legacy that diabetes in pregnancy could have on women and their children.
La diabetes es un problema mundial con mayor impacto en los países en desarrollo, donde muchas personas desconocen su riesgo. En México las mujeres muestran un mayor riesgo de diabetes tipo 2 (DT2). Las escalas de riesgo actuales se han desarrollado y validado principalmente en cohortes europeas de edad avanzada y no representan la mejor opción para las mujeres mexicanas. El desarrollo de un modelo/puntaje de riesgo en esta población sería útil.
ObjetivoDesarrollar y validar un modelo y escala de riesgo que incorpore los factores de riesgo de la DT2 más relevantes en las mujeres mexicanas en edad reproductiva.
MétodosEl estudio se realizó en 2 fases, en la primera se desarrolló el modelo predictivo en una cohorte de 3.161 mujeres mexicanas en edad reproductiva (cohorte de derivación) y en la segunda se validó en una población independiente. Se utilizó una regresión de riesgos proporcionales de Cox. Finalmente se desarrolló una escala de riesgo de 0 a 19, para identificar la probabilidad de desarrollar DT2 en 2,4 años en las mujeres mexicanas en edad reproductiva. El punto de corte fue ≥15, con una sensibilidad del 73% y una especificidad del 67%.
ResultadosSe identificaron 147 (4,6%) casos nuevos de DT2 en la cohorte de derivación del modelo y 97 de 925 (10,48%) en la cohorte de validación. Los factores de riesgo predictivos de DT2 fueron: historia de diabetes gestacional (HR: 2,69; IC 95%: 1,10-6,58), IMC (HR: 1,03; IC 95%: 1,01-1,06), hipertrigliceridemia (HR: 1,54; IC 95%: 1,11-2,14) y glucosa de ayuno (HR: 1,06; IC 95%: 1,05-1,08), con AUC de 0,75 y 0,91 (IC 95%: 0,87-0,95) en la cohorte de validación.
ConclusionesSe desarrolló un modelo y score de riesgo para detectar casos en riesgo de diabetes incidente. Esta herramienta fue generada empleando las características de las mujeres mexicanas en edad reproductiva. El score de riesgo es un paso adelante al tratar de abordar el legado generacional que la diabetes en el embarazo podría tener sobre las mujeres y sus hijos.
Diabetes is a global problem with a greater impact in developing countries, where many people are unaware of their risk.1,2 In Mexico, national survey results have shown the prevalence of type 2 diabetes (T2D) growing steadily approximately 25% every six years since 2000.3 In the most recent nationwide survey, 9.4% of Mexican adults reported a formal diagnosis of T2D (10.3% women vs 8.4% men). However, the current prevalence is thought to be an underestimation.4 Obesity, the intrauterine environment, history of gestational diabetes, glucose intolerance and polycystic ovary syndrome are among the principle risk factors for T2D in women.5
In Mexico; unhealthy lifestyle habits and the mestizo phenotype of this population contributes to the susceptibility for early onset disease (<40 years). The 2016 national survey, reported a high prevalence of overweight (BMI>25kg/m2) and obesity (BMI>30kg/m2) in adults, 39.2% and 33.3% respectively. Those at highest risk appear to be women, showing the greatest increase in obesity since the last survey, six years earlier (38.6% (IC 95% 35.1–41.2) 2016 vs. 37.5%% (IC 95% 36.5–38.6) 2012).4,6
Furthermore, the percentage of Mexican women between the ages of 20 and 49 reporting a previous diagnosis of T2D, this was higher than that of men in the same age group (10.5% vs 8.3%).6 Differences in health service usage between genders may account in part for this finding; women are more likely to seek health care compared to men. Another explanation for the higher prevalence in T2D includes excess weight gain during pregnancy, contributing to the risk for pregnancy related complications, including gestational diabetes.7,8
The gestational diabetes (GDM) is a major risk factor for the future development of T2D in both mothers and children.9 Over the past 30 years, the prevalence of GDM has increased in Mexico: the most recent estimates report GDM in 23.7% of pregnancies.10
GDM is thought to be a key contributor to the prevalence of T2D worldwide.11,12 Women with a history of GDM have a seven-times higher risk of developing T2D in the future, compared to women who remain normoglycemic during their pregnancies (relative risk 7.43 (IC 95% 4.79–11.51)).13 Women with both GDM and obesity, (BMI>30kg/m2), have a ten-times greater risk of developing T2D (RR (10.24 CI 95% 0.25–433.97)).14,15
Internationally, researchers have created instruments to better classify those at a greater risk of developing T2D. However, such risk scores have been created (EPIC, DESIR, QD Score, KORA S4/F4, FINDRISC) and tested in predominantly older European participants.16–19 They are clearly able to distinguish cases of high and low risk but are unable to predict incidence with adequate precision.20,21 In addition the diagnostic capacity (measured using the area under the ROC curve) of such instruments is moderate (between 0.65 and 0.80).18 One of the most popular models to identify at risk cases is the Finnish Diabetes Risk Score (FINDRISC). This incorporates age, BMI, waist circumference (WC), physical activity, diet, antihypertensive medication use, high blood glucose history, and family history of diabetes. It can successfully be implemented in European populations; however, it may not be suitable for all ethnic groups.19 Studies in Hispanic populations suggest that the FINDRISC tool is most adequate for identifying diabetes risk in persons over the age of fifty.22
The development of a risk model/score that incorporates the most relevant risk factors for T2D in Mexican women would have epidemiological utility. It would allow us to identify more accurately those women at highest risk, permitting the development of a more personalized management plan. The present report describes the creation and validation of a diabetes risk score for Mexican women of reproductive age.
Materials and methodsDerivation cohortThe “derivation cohort” was obtained from a previous research initiative entitled “Consolidation of a cohort of adult residents in central Mexico designed to measure the incidence of diabetes and components of the metabolic syndrome”.
This observational cohort study included 6144 healthy Mexican adults living in large urban settings in Central Mexico. This included residents of Mexico City and the cities of Cuernavaca, Leon, Toluca, and Aguascalientes. The study sample consisted of mestizo (mixed Hispanic and Indigenous ancestry) Mexicans, all of whom had Mexican mestizo grandparents. All adults between the ages of 20 and 75 years old with a BMI≥20kg/m2 were eligible for this study.
The exclusion criteria were extensive and included any of the following: any severe chronic illness, alcoholism (defined by consumption of 10 or more standard alcoholic drinks per week), pregnancy, use of systemic corticosteroids, intermittent medication (intravenous, oral or injectable, including injections into joints), active liver disease, renal dysfunction or nephrotic syndrome, history of neoplasia except skin cancer, depression or psychosis not currently under treatment, a previous history of cardiovascular disease, or life expectancy under three years. Any subjects with a diagnosis of T2D with baseline fasting blood glucose levels were eliminated.
The study consisted of a baseline visit followed by a final visit during which the presence of T2D was evaluated. Cases with T2D fulfilled at least one of the following criteria at follow up: (1) Self-reported (previous physician T2D diagnosis); (2) use of hypoglycemic medications, or (3) fasting (>8h) serum glucose of ≥126mg/dL.
Arterial hypertension was defined as a blood pressure measurement≥140/90mmHg or current prescription of blood pressure-lowering treatment. All participants were still alive at the time of the follow-up visits. All assessments were performed in the morning, after a 9–12h fasting period. Anthropometric measures, evaluation of physical activity and diet, vital signs, and fasting blood samples were obtained by trained personnel. Demographic information and a medical history (including personal and family history of the most common chronic diseases) was obtained using standardized questionnaires. Diet was evaluated using 24-h diet recall and an 11-item validated food frequency questionnaire.23 To evaluate physical activity, the validated Spanish-language version of the IPAQ questionnaire was used. Recruitment took place between September 2006 and July 2009 and the second evaluation was carried out between January 2009 and February 2014.
Women of reproductive age cohort (WRA cohort)In order to develop the predictive model in Mexican women of reproductive age (20–49 years old), the data from 3161 of the women from the Derivation Cohort was obtained, thus forming the Women of Reproductive Age Cohort (WRA Cohort). All of the selected women completed both evaluations and fulfilled all of the inclusion and exclusion criteria. The median follow-up for this population was 2.4 years.
Validation Cohort: National Institute of Perinatology – Mexican Institute of Social Security (INPer – IMSS)To validate the model obtained from the “Derivation Cohort”, the research team assembled a similar cohort from the National Institute of Perinatology Isidro Espinosa De Los Reyes (INPer) in Mexico City and the public health system in Durango (Mexican Institute of Social Security, or IMSS-Durango). The INPer population included 85 healthy women between the ages of 20 and 47. The IMSS-Durango population included 921 healthy women between the ages of 18 and 48. The median follow-up for this population was 2.8 years.
In the Validation Cohort, a case was defined as mentioned above and the inclusion and exclusion criteria were the same. There was no significant socio-demographic difference between the INPer and IMSS-Durango populations. The only evident difference between them was the geographical location. Hence, the two populations were combined into Validation Cohort and analyzed together for the model validation.
Clinical chemistry parameters and the lipid profile were measured using commercially available reagents (Synchron CX5 delta, Beckman Coulter). Weight and height were both measured with light clothing and no shoes using calibrated scales and a wall-mounted stadiometer, respectively. Waist circumference was measured midway between the lowest rib and the iliac crest using anthropometric tape; blood pressure was measured using a calibrated digital sphygmomanometer (OMRON HEM 775). All measurements were taken twice with a 3-min interval between each measurement and the mean of these values was recorded. BMI was calculated dividing the weight (kg) by the height squared (m2). Diet was evaluated with 24-h diet recall and an 11-item validated food frequency questionnaire.
Ethics committeeFor the Validation Cohort, the “Instituto Nacional de Ciencias Medicas y Nutrición Salvador Zubirán” Committee for Biomedical Research in Humans approved the study protocol. All participants in the Derivation Cohort provided their written informed consent. With respect to the INPer and IMSS projects, the appropriate ethics committees approved each study and all participants of provided their written informed consent.
Statistical analysesResults were analyzed according to incident T2D status. The characteristics of participants are described using mean±SD or median and interquartile range. The Student's t test and Mann–Whitney U test were used where appropriate. Chi2 test was used to compare categorical variables. For prediction analyses, unadjusted Cox proportional hazard regression models were generated with incident T2D as the outcome. Firstly, a Cox proportional hazard regression model, including all of variables that were significantly (p<0.05) correlated with incident diabetes or that showed well-known biological plausibility were used to estimate the risk for incident diabetes. Stepwise methodology was applied, initially only non-invasive variables to begin with and subsequently, biochemical variables were added to build the model. Based on the Cox regressions model, β-coefficients were used to assign a score value for each variable.
The sensitivity (probability that the test is positive for women who will be diagnosed with T2D in the future) and the specificity (the probability that the test is negative for women who will not be diagnosed with T2D in the future) with 95% CIs were calculated for each diabetes risk score level. Then, receiver-operating characteristic (ROC) curves were plotted for the diabetes risk model and score for women. The AUC of the FINDRISC model and score were compared with the proposed model and score using a non-parametric ROC test to evaluate differences in predictive performance.
The Diabetes Risk Score value was generated using the same mathematical scheme developed by Sullivan et al. for the Framingham heart study.24 First, the continuous variables were organized into meaningful categories and reference values were determined for each variable. Then the performance of the proposed prediction model was compared with two other prediction models FINDRISC and Cambrigde which were derived from different populations. The new proposed score ranges from 0 to 19 points.
A two-tailed p-value<0.05 was considered statistically significant. All analyses were conducted using STATA version 13 (STATA Texas 77845 USA) and Statistical Package for Social Sciences (SPSS) software version 21.
ResultsClinical data and blood samples were obtained from 3920 women at baseline. Among them, individuals had either undiagnosed T2D or declined permission to be included in the follow-up (n=759). Consequently, our study sample considered for the primary end-point of this report 3161 participants. This loss of follow-up had no significant differences between those who did not have complete follow-up compared to those who did. Of the 3161 women without diabetes at baseline in the derivation cohort, 147 (4.6%) new cases were identified over a follow up period of 2.4 years. However, the incidence of diabetes was higher in the validation Cohort, with 97 out of 925 (10.5%) women developing incident T2D at the similar follow up period. This difference may be related to a greater prevalence of obesity in the validation cohort compared to the derivation cohort (BMI 31.3kg/m2 vs 28.7kg/m2).
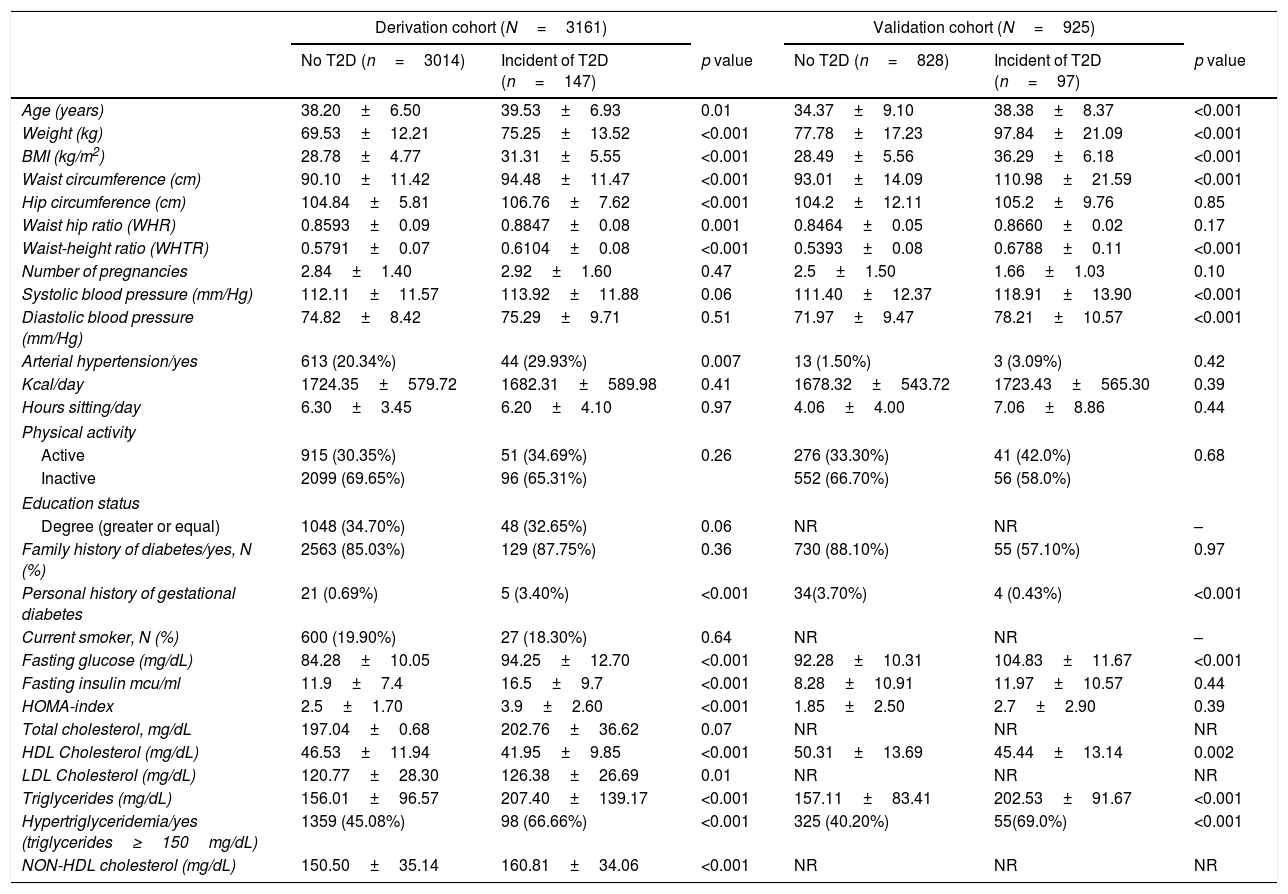
In both cohorts, women with incident diabetes were slightly older, had a personal history of gestational diabetes, higher blood pressure, obesity, higher abdominal obesity and higher waist-height ratio (WHtR) compared to those who did not develop diabetes. There were noticeable differences in biochemical parameters: women with incident diabetes had higher glucose, decreased insulin sensitivity (measured by the HOMA index), and a greater prevalence of metabolic abnormalities, such as hypertriglyceridemia (triglycerides ≥150mg/dL). No significant differences were found in any of the socio-demographic variables, dietary parameters, or intensity of physical activity. The baseline characteristics of both cohorts are shown in Table 1.
Baseline characteristics of derivation and validation cohort.
| Derivation cohort (N=3161) | Validation cohort (N=925) | |||||
|---|---|---|---|---|---|---|
| No T2D (n=3014) | Incident of T2D (n=147) | p value | No T2D (n=828) | Incident of T2D (n=97) | p value | |
| Age (years) | 38.20±6.50 | 39.53±6.93 | 0.01 | 34.37±9.10 | 38.38±8.37 | <0.001 |
| Weight (kg) | 69.53±12.21 | 75.25±13.52 | <0.001 | 77.78±17.23 | 97.84±21.09 | <0.001 |
| BMI (kg/m2) | 28.78±4.77 | 31.31±5.55 | <0.001 | 28.49±5.56 | 36.29±6.18 | <0.001 |
| Waist circumference (cm) | 90.10±11.42 | 94.48±11.47 | <0.001 | 93.01±14.09 | 110.98±21.59 | <0.001 |
| Hip circumference (cm) | 104.84±5.81 | 106.76±7.62 | <0.001 | 104.2±12.11 | 105.2±9.76 | 0.85 |
| Waist hip ratio (WHR) | 0.8593±0.09 | 0.8847±0.08 | 0.001 | 0.8464±0.05 | 0.8660±0.02 | 0.17 |
| Waist-height ratio (WHTR) | 0.5791±0.07 | 0.6104±0.08 | <0.001 | 0.5393±0.08 | 0.6788±0.11 | <0.001 |
| Number of pregnancies | 2.84±1.40 | 2.92±1.60 | 0.47 | 2.5±1.50 | 1.66±1.03 | 0.10 |
| Systolic blood pressure (mm/Hg) | 112.11±11.57 | 113.92±11.88 | 0.06 | 111.40±12.37 | 118.91±13.90 | <0.001 |
| Diastolic blood pressure (mm/Hg) | 74.82±8.42 | 75.29±9.71 | 0.51 | 71.97±9.47 | 78.21±10.57 | <0.001 |
| Arterial hypertension/yes | 613 (20.34%) | 44 (29.93%) | 0.007 | 13 (1.50%) | 3 (3.09%) | 0.42 |
| Kcal/day | 1724.35±579.72 | 1682.31±589.98 | 0.41 | 1678.32±543.72 | 1723.43±565.30 | 0.39 |
| Hours sitting/day | 6.30±3.45 | 6.20±4.10 | 0.97 | 4.06±4.00 | 7.06±8.86 | 0.44 |
| Physical activity | ||||||
| Active | 915 (30.35%) | 51 (34.69%) | 0.26 | 276 (33.30%) | 41 (42.0%) | 0.68 |
| Inactive | 2099 (69.65%) | 96 (65.31%) | 552 (66.70%) | 56 (58.0%) | ||
| Education status | ||||||
| Degree (greater or equal) | 1048 (34.70%) | 48 (32.65%) | 0.06 | NR | NR | – |
| Family history of diabetes/yes, N (%) | 2563 (85.03%) | 129 (87.75%) | 0.36 | 730 (88.10%) | 55 (57.10%) | 0.97 |
| Personal history of gestational diabetes | 21 (0.69%) | 5 (3.40%) | <0.001 | 34(3.70%) | 4 (0.43%) | <0.001 |
| Current smoker, N (%) | 600 (19.90%) | 27 (18.30%) | 0.64 | NR | NR | – |
| Fasting glucose (mg/dL) | 84.28±10.05 | 94.25±12.70 | <0.001 | 92.28±10.31 | 104.83±11.67 | <0.001 |
| Fasting insulin mcu/ml | 11.9±7.4 | 16.5±9.7 | <0.001 | 8.28±10.91 | 11.97±10.57 | 0.44 |
| HOMA-index | 2.5±1.70 | 3.9±2.60 | <0.001 | 1.85±2.50 | 2.7±2.90 | 0.39 |
| Total cholesterol, mg/dL | 197.04±0.68 | 202.76±36.62 | 0.07 | NR | NR | NR |
| HDL Cholesterol (mg/dL) | 46.53±11.94 | 41.95±9.85 | <0.001 | 50.31±13.69 | 45.44±13.14 | 0.002 |
| LDL Cholesterol (mg/dL) | 120.77±28.30 | 126.38±26.69 | 0.01 | NR | NR | NR |
| Triglycerides (mg/dL) | 156.01±96.57 | 207.40±139.17 | <0.001 | 157.11±83.41 | 202.53±91.67 | <0.001 |
| Hypertriglyceridemia/yes (triglycerides≥150mg/dL) | 1359 (45.08%) | 98 (66.66%) | <0.001 | 325 (40.20%) | 55(69.0%) | <0.001 |
| NON-HDL cholesterol (mg/dL) | 150.50±35.14 | 160.81±34.06 | <0.001 | NR | NR | NR |
NR: not registered.
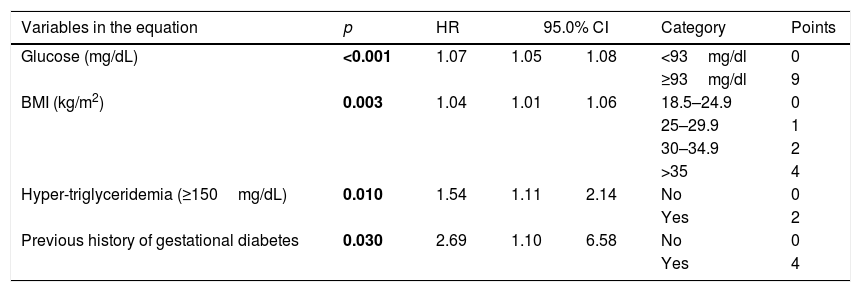
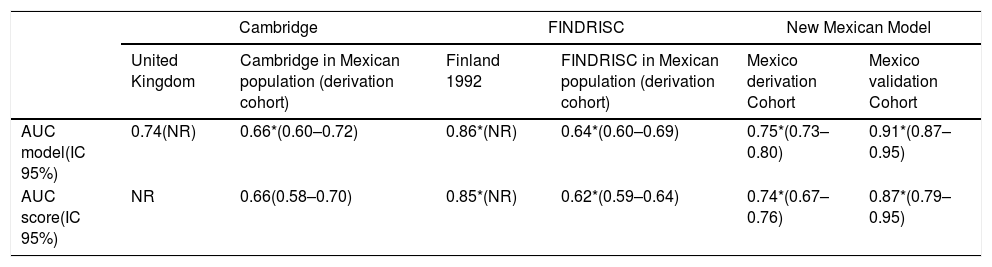
A Cox proportional hazard regression model for incident T2D risk was generated, including all variables significantly (p<0.05) associated with incident diabetes or that show biological plausibility for diabetes risk. The final model is shown in Table 2. The independent predictors of future type 2 diabetes were BMI (HR 1.03, CI 95% 1.01–1.06), history of gestational diabetes (HR 2.69, CI 95% 1.10–6.58), hypertriglyceridemia (HR 1.54, CI 95% 1.11–2.14) and fasting blood glucose (HR 1.06, CI 95% 1.05–1.08). The AUC of this model was 0.75 (CI 95% 0.73–0.80), the value of Hosmer Lemeshow was 1.66 (p=0.79), and C Harell statistic was 0.74. The FINDRISC and Cambridge models were also applied to these patients; the AUC was 0.64 (CI 95% 0.60–0.69) and 0.66 (CI 95% 0.60–0.72) respectively. The predictive capability of the new model was tested with the Validation Cohort. The AUC=0.91 (IC 95% 0.87–0.95) indicated good performance of the newly model. The AUC for the ability to discriminate incident T2D of the proposed score was 0.74. (CI 95% 0.72–0.76) The FINDRISC's and the Cambridge AUC for the same task were 0.62 (CI 95% 0.59–0.64) and 0.66 (CI 95% 0.60–0.72). See Table 3.
Results of COX regression model predicting incident diabetes.
| Variables in the equation | p | HR | 95.0% CI | Category | Points | |
|---|---|---|---|---|---|---|
| Glucose (mg/dL) | <0.001 | 1.07 | 1.05 | 1.08 | <93mg/dl | 0 |
| ≥93mg/dl | 9 | |||||
| BMI (kg/m2) | 0.003 | 1.04 | 1.01 | 1.06 | 18.5–24.9 | 0 |
| 25–29.9 | 1 | |||||
| 30–34.9 | 2 | |||||
| >35 | 4 | |||||
| Hyper-triglyceridemia (≥150mg/dL) | 0.010 | 1.54 | 1.11 | 2.14 | No | 0 |
| Yes | 2 | |||||
| Previous history of gestational diabetes | 0.030 | 2.69 | 1.10 | 6.58 | No | 0 |
| Yes | 4 | |||||
Comparison between models and scores.
| Cambridge | FINDRISC | New Mexican Model | ||||
|---|---|---|---|---|---|---|
| United Kingdom | Cambridge in Mexican population (derivation cohort) | Finland 1992 | FINDRISC in Mexican population (derivation cohort) | Mexico derivation Cohort | Mexico validation Cohort | |
| AUC model(IC 95%) | 0.74(NR) | 0.66*(0.60–0.72) | 0.86*(NR) | 0.64*(0.60–0.69) | 0.75*(0.73–0.80) | 0.91*(0.87–0.95) |
| AUC score(IC 95%) | NR | 0.66(0.58–0.70) | 0.85*(NR) | 0.62*(0.59–0.64) | 0.74*(0.67–0.76) | 0.87*(0.79–0.95) |
NR: not reported, ND: not done.
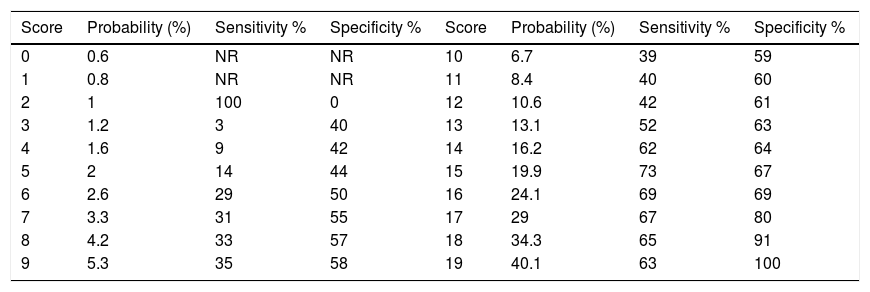
Both the latter scores showed a lower AUC than the new score (p<0.001). In the subset of the Derivation Cohort, the score with a cut-off point≥15 chosen by Youden index had a sensitivity of 73% and a specificity of 67% (Table 4).
Estimated probability of T2D in 2.4 years.
| Score | Probability (%) | Sensitivity % | Specificity % | Score | Probability (%) | Sensitivity % | Specificity % |
|---|---|---|---|---|---|---|---|
| 0 | 0.6 | NR | NR | 10 | 6.7 | 39 | 59 |
| 1 | 0.8 | NR | NR | 11 | 8.4 | 40 | 60 |
| 2 | 1 | 100 | 0 | 12 | 10.6 | 42 | 61 |
| 3 | 1.2 | 3 | 40 | 13 | 13.1 | 52 | 63 |
| 4 | 1.6 | 9 | 42 | 14 | 16.2 | 62 | 64 |
| 5 | 2 | 14 | 44 | 15 | 19.9 | 73 | 67 |
| 6 | 2.6 | 29 | 50 | 16 | 24.1 | 69 | 69 |
| 7 | 3.3 | 31 | 55 | 17 | 29 | 67 | 80 |
| 8 | 4.2 | 33 | 57 | 18 | 34.3 | 65 | 91 |
| 9 | 5.3 | 35 | 58 | 19 | 40.1 | 63 | 100 |
In the present study, a practical score was developed to predict incident T2D in Mexican women of reproductive age. A model was developed using data from the Derivation Cohort and were validated using the INPer and IMSS-Durango database. This risk score can be implemented to identify Mexican women at incident T2D risk. No such instrument exists at present. This risk score can estimate the two-and-a-half-year risk for T2D, based only on BMI, history of gestational diabetes, fasting blood glucose and hypertriglyceridemia. These variables can easily be obtained in routine clinical practice.
Current T2D risk estimation is based on predictive models obtained from prospective cohorts, such as FINDRISC, CAMBRIDGE, ARIC, AUSDRIK, or DESIR. The majority of these studies include demographic, dietary, anthropometric, biochemical, and patient history variables.17–19 The majority of these models were developed in European populations with older adults and have not been validated in Mexico. This study compared the new AUC scores to the FINDRISC, and the Cambridge model. These models showed lower discrimination ability when compared to the new score. The purpose of the new risk score is the early detection of women at-risk, especially considering that T2D is present at a younger age in Mexico.25
Apart from a 2014 study reporting an incidence of T2D of 13.7% over an 18-year period, no other data is available for Mexican women.25 The prevention of incident T2D is important in this group as this will impact the future health of both women and their children.26
Our variables most significantly related to risk in the Mexican population were a previous history of gestational diabetes, high BMI, hypertriglyceridemia, and high fasting plasma glucose. Most European models report that age is a significant predictor of T2D incidence, we did not find this association (p=0.73). This could be due to the fact that the age range of our study was more limited and homogeneous than in other studies. In addition, certain variables that are significant in other populations—physical activity, waist circumference, and diet—were not significant in this population. Participants found it more difficult to answer questions related to physical activity and diet; this may be due to cultural ideas surrounding these aspects of life and social desirability bias. Therefore, future risk scores for Mexican women of reproductive age should consider the use of non subjective variables that are not that can more easily be standardized.
The availability of a simple clinical instrument to predict future disease risk will contribute to improve prevention strategies for this group. These prevention strategies should focus on preventing gestational diabetes, avoiding weight gain, and diets to prevent hypertriglyceridemia, and hyperglycemia. Women of reproductive age have different characteristics than other populations and these characteristics should be taken into account when elevated risk.
This study had some strengths. First, we evaluated two large populations that have not been evaluated previously for incident T2D. The risk score shows adequate internal validation. The loss to follow-up of the Derivation cohort was low (19.6%), with no significant differences between those who did not have complete follow-up compared to those who did. This allowed for an adequate estimate of diabetes incidence with enough statistical power to develop a predictive model and validate metabolic measures. Finally, we evaluated the new risk score with competing models constructed with similar variables, and we observed a superior predictive performance. This does not mean that this study does not have any limitations. The main limitation is the lack of external validation. As this model is highly specific to Mexican women of reproductive age, it may be difficult to apply these findings to other populations. Another limitation is that T2D was not diagnosed using the gold standard—the glucose tolerance test. The fasting plasma glucose minimizes the number of cases, meaning that there may have been undiagnosed cases. However, the fasting blood glucose test is the most common test for T2D in epidemiological studies in Mexico, due to the scarcity of resources. Therefore, this risk score is in line with clinical practice in this region.
ConclusionsIn summary, a predictive model and risk score was developed to detect cases at risk for incident T2D. It was generated using the characteristics of Mexican women of reproductive age. This risk score is a step forward in attempting to address the generational legacy that diabetes in pregnancy could have on women and their children. As advancements in new statistical methods occur, new strategies such as machine learning or artificial intelligence may be used to improve risk scores in the future. However, as the development of risk scores advances, indigenous women and other typically “neglected” populations should also be included in risk estimation. Validated risk scores in marginalized populations and regions are essential for the global fight against chronic disease, especially in less-developed regions.
Authors’ contributionAll authors were involved in the redaction of the paper, and all authors read and approved the final manuscript.
FundingThis study has received financing from Instituto Nacional de Ciencias Médicas y Nutrición Salvador Zubirán and Consejo Nacional de Ciencia y tecnología (CONACyT).
Conflict of interestThe authors declare no potential conflicts of interest with respect to the research, authorship and/or publication of this article.
Ana Carolina Guerrero-Serrano, and Daniel Benjamín Elías-López.
