


Excessive screen time (ST) and lower physical activity (PA) patterns have been reported to have an impact on cardiometabolic risk (CMR); however, their impact on physical fitness needs in-depth study.
ObjectiveTo determine the association between lifestyle (i.e. ST and PA after school) with physical fitness related to health and CMR (i.e. abdominal obesity and hypertension) in Chilean schoolchildren.
MethodsThe sample for this cross-sectional study comprised 263 girls (11.87±0.83 years) and 319 boys (12.02±0.88 years). The body mass index (BMI), waist circumference (WC), waist to height ratio (WtHR), CMR (WtHR≥0.5), body fat (BF), systolic (SBP) and diastolic blood pressure (DBP), physical fitness, ST (h/day), and PA after school (h/week) were evaluated.
ResultsSchoolchildren with good lifestyle had a lower BMI, WC, and WtHR (P<0.001) as well as a better VO2max (P<0.001) and standing long jump test (SLJ) (P=0.002). The schoolchildren with bad lifestyle had the highest proportion of students with abdominal obesity (WtHR≥0.5) (30.6%, P=0.009) and hypertension. (40.9%, P<0.001). Likewise, PA after school (β; −0.02, P=0.002) and cardiorespiratory fitness (β; −0.02, P=0.002) adjusted by age and sex reported inverse associations with abdominal obesity (WtHR≥0.5). Likewise, ST presented a positive association with SBP (β; 0.14, P=0.030). Moreover, handgrip strength (β; −0.17, P=0.010) and SLJ (β; −0.05, P=0.023) reported inverse associations with SBP.
ConclusionIn schoolchildren, a bad lifestyle was associated with low physical fitness related to health and CMR (i.e. abdominal obesity and hypertension).
Se ha informado que el tiempo de pantalla (TP) excesivo y los patrones de actividad física (AF) más bajos tienen un impacto en el riesgo cardiometabólico (RCM); sin embargo, su impacto en la aptitud física necesita un estudio en profundidad.
ObjetivoDeterminar la asociación entre el estilo de vida (es decir, TP y AF después de la escuela) con la condición física relacionada con la salud y el RCM (es decir, obesidad abdominal e hipertensión) en escolares chilenos.
MétodosLa muestra para este estudio transversal comprendió 263 niñas (11,87± 0,83 años) y 319 niños (12,02±0,88 años). Se evaluó el índice de masa corporal (IMC), la circunferencia de la cintura (CC), la relación cintura/altura (RCE), el RCM (RCE≥0,5), la grasa corporal (GC), la presión arterial sistólica (PAS) y la diastólica (PAD), la condición física, el TP (h/día) y la AF después de la escuela (h/semana).
ResultadosLos escolares con hábitos saludables de vida tenían un IMC, una CC y una RCE más bajos (p<0,001), así como un mejor VO2 máx (p<0,001) y prueba de salto de longitud (SLJ) (p=0,002). Los escolares con malos hábitos de vida tenían la mayor proporción de estudiantes con obesidad abdominal (RCE≥0,5) (30,6%, p=0,009) e hipertensión (40,9%, p<0,001). Asimismo, la AF después de la escuela (β; −0,02, p=0,002) y el CRF (β; −0,02, p=0,002) ajustados por edad y sexo se asociaron de forma inversa con la obesidad abdominal (RCE≥0,5). Asimismo, el TP presentó una asociación positiva con la PAS (β; 0,14, p=0,030). Además, la fuerza de prensión (β; −0,17, p=0,010) y SLJ (β; −0,05, p=0,023) mostró una relación inversa con la PAS.
ConclusiónEn los escolares, el estilo de vida malo se asoció con una baja aptitud física relacionada con la salud y la RCM (es decir, obesidad abdominal e hipertensión).
The prevalence of childhood obesity is reaching epidemic proportions worldwide and has been declared a global public health problem, since its increase has been associated with a greater presence of cardiometabolic risk (CMR).1 Several factors influence the development of obesity, one of which is the decrease in physical activity (PA) and the increase in sedentary behaviours. A part of sedentary behaviour is determined by screen time (ST), which refers to the access and use of electronic devices, such as televisions, computers, cell phones, and video games, where the evidence has shown that children spend excess time in front of a screen.2 High ST has been associated with a cluster of behavioural risk factors in children.3 Additionally, PA has been indicated as an important factor to prevent CMR,4 and PA is a modifiable factor that is inversely associated with obesity.5,6 The relevance of this is that, if carried out since childhood, it can influence the adoption of an active lifestyle.7
Good physical fitness during childhood presents health benefits, especially cardiorespiratory fitness (CRF), due to it being a basic component of a healthy lifestyle in children and adolescents.8 High CRF is related to lower CMR, especially when associated with body mass reduction.9 It has also been shown that overweight children with high CRF have a healthier cardiovascular profile.10 Moreover, higher levels of CRF substantially reduce CMR in adulthood, even among those with abdominal obesity in childhood.11
Likewise, good muscular strength is inversely related to CMR and has proved to be a powerful protector of mortality and life expectancy.12,13 Developing assessments of children's health-related physical fitness at an early stage is a priority,14 since improving physical fitness provides protection against CMR15 and is an important biomarker of health.13,16 Moreover, good muscle fitness changes during childhood are associated with improvements in CMR.17 Therefore, the study of the variables that help to improve this capacity are a priority.
The evidence has reported associations between lifestyle, obesity and CMR factors in children.17 However, the relationship between lifestyle (i.e. PA and sedentary behaviour) and physical fitness related to health (i.e. CRF, handgrip strength and explosive strength) need to be studied in-depth. For all of the above, the objective of this study was to determine the association between lifestyle (i.e. ST and PA after school) and physical fitness and its relationship with CMR factors (i.e. hypertension and abdominal obesity) in Chilean schoolchildren.
Material and methodsSubjectsThis cross-sectional study included girls (n = 263, 11.87 ± 0.83 years) and boys (n = 319, 12.02 ± 0.88 years) selected by convenience and voluntary from primary public school in Chile (Araucanía Region). The students evaluated were from middle socio-economic status according School Vulnerability Index (SVI or IVE in Chile).18
The inclusion criteria included informed consent by the parents and the assent of the participant, be enrolled in an education centre, and be aged between 10 and 13 years. Due to the character of the volunteers, the students who did not comply with the request were excluded from the investigation.
The exclusion criteria were: presenting musculoskeletal disorders, hypertension, diabetes or any other known medical condition that could alter the performance and health of the participants during physical evaluations. Schoolchildren with physical, sensory, and intellectual disabilities were excluded.
The research respected the agreements of the Declaration of Helsinki (2013) and was approved by the Bioethics Committee of the Universidad de La Frontera, Chile. All participants received explanations regarding the tests before the study was started and were asked to refrain from intense exercise 48h before the study.
MaterialLifestyleLifestyle was evaluated with the Krece Plus test.19 The Krece Plus test is a quick questionnaire that classifies lifestyle according to the daily average of hours spent watching television or playing video games (h/day) and hours of PA after school per week (h/week). The classification is made according to the number of hours used for each point. The total points are added, and the person is classified as:
- i)
Good lifestyle (men: ≥9, women ≥8)
- ii)
Regular lifestyle (men: 6–8, women: 5–7)
- iii)
Bad lifestyle (men: ≤5, women: ≤4).
To evaluate body mass (kg), we used a TANITA scale, model Scale Plus UM – 028 (Tokyo, Japan); the students were evaluated with bare feet and in underwear. Size (m) was estimated with a Seca® model 214 stadiometer (Hamburg, Germany) in mm. Body mass index (BMI), understood as the relationship between body weight divided by height in metres squared (kg/m2), was used to estimate the degree of obesity.20 The BMI is represented in the growth table of the Centres for Disease Control and Prevention (CDC), Overweight and Obesity, verifying the corresponding age and percentile related to sex. Childhood obesity is defined as a BMI equal to or greater than the 95th percentile, and overweight is defined as a BMI greater than the 85th percentile for children of the same age and sex.20,21
Body compositionTo measure the percentage of body fat (BF), the triceps fold and the subscapular fold (Lange Skinfold Calliper, 102-602L, Minneapolis, USA) were used, applying the Slaughter formula,22 in Girls: % BF=1.33 (tricipital+subscapular) −0.013 (tricipital+subscapular) 2–2.5 and in Boys: % BF=1.21 (tricipital+subscapular) −0.008 (tricipital+subscapular) 2–1.7.
Cardiometabolic riskThe waist circumference (WC) was measured using a Seca® model 201 metric tape (Hamburg, Germany) at the height of the umbilical scar.23 The waist to height ratio (WtHR) was obtained by dividing the WC by the height, and it was used as a tool to estimate the accumulation of fat in the central area, determining a higher CMR (WtHR≥0.5) according to international standards.24
Blood pressureSystolic (SBP) and diastolic blood pressure (DBP) were measured twice after resting for 15min, according to international standards,25 through an OMRON® digital electronic monitor, model HEM 7114, (Illinois, USA). For the classification of hypertension, the “Fourth report on diagnosis, evaluation, and treatment of hypertension in children and adolescents” was used. Pre-hypertension was defined as a blood pressure ≥90th percentile and <95th percentile, and hypertension was defined as blood pressure ≥95th percentile according sex, age, and height.25 Besides of, the blood pressure in children with hypertension was measure in three occasions.
Physical fitness related to healthFor the evaluation of physical fitness related to health in children and adolescents, the ALPHA-Fitness Battery was used26; leg strength was evaluated through the standing long jump test (SLJ), which consists of jumping a distance with both feet at the same time. For this, the student stands behind the jump line, and with a foot separation equal to the width of their shoulders, the knees are then bent with the arms in front of the body and parallel to the ground. From this position, they swing their arms, push hard, and jump as far as possible, making contact with the ground with both feet simultaneously and in a vertical position. This is done twice, and the best result is recorded.
Handgrip strength through a hand dynamometer (TKK 5101 Grip D; Takei, Tokyo, Japan) was used to measure upper body strength. The test consists of holding a dynamometer in one hand and squeezing as tightly as possible without allowing the dynamometer to touch the body; force is applied gradually and continuously for a maximum of 3–5s.26 The test was performed twice, and the maximum score for each hand was recorded in kilograms. The average of the scores achieved by the left and right hands was used in the analysis. Higher scores indicate better performance.
The CRF was evaluated through the Léger test, and the VO2max formulas of the participants were estimated.27 The test aims to measure the maximum aerobic resistance. The student must travel 20m, progressively increasing the speed and intensity of their movement. At the beginning, they must walk, then jog, and at the end, run. This movement is carried out for 15min at the rhythm of a sonic pulse that accelerates progressively.
ProcedureAnthropometric assessments were conducted in a favourable space facilitated by the school, with optimum temperature and reliable privacy. Surveys were completed in classrooms on different days than the anthropometric evaluations. The physical fitness evaluations took place during physical education classes (i.e., in the gym) and in the morning.
Statistical analysisThe statistical analysis was performed with SPSS 23.0 software (IBM, SPSS, statistics). Normal distribution of the data and the equality of variances were verified by Kolmogorov–Smirnov and Levene contrast tests, respectively. The variables are expressed as means±standard deviation. The differences between groups were determined by one-way analysis of variance (ANOVA) and post hoc analysis by the Bonferroni method. To establish the relationship between variables, Pearson correlation (r) were executed. To compare proportions in the different categories, the chi-square test (X2) was performed. Finally, to determine the association between CMR, anthropometric parameters, physical fitness, PA and ST, a multivariable regression was used adjust by age and sex (Model 1). P-value<0.05 was considered statistically significant.
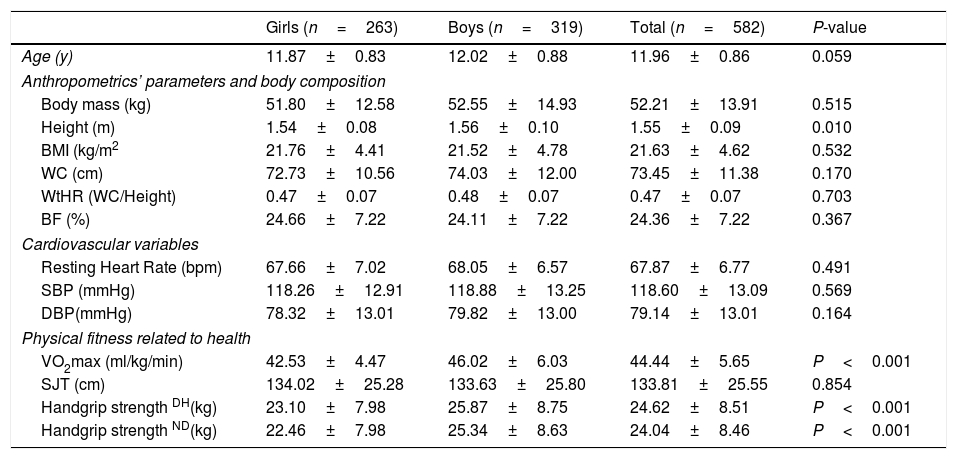
ResultsTable 1 presents the characteristics of the study sample according to sex. Boys presented higher CRF and handgrip strength as compared with girls (P<0.001).
Characteristics of the sample according to sex.
| Girls (n=263) | Boys (n=319) | Total (n=582) | P-value | |
|---|---|---|---|---|
| Age (y) | 11.87±0.83 | 12.02±0.88 | 11.96±0.86 | 0.059 |
| Anthropometrics’ parameters and body composition | ||||
| Body mass (kg) | 51.80±12.58 | 52.55±14.93 | 52.21±13.91 | 0.515 |
| Height (m) | 1.54±0.08 | 1.56±0.10 | 1.55±0.09 | 0.010 |
| BMI (kg/m2 | 21.76±4.41 | 21.52±4.78 | 21.63±4.62 | 0.532 |
| WC (cm) | 72.73±10.56 | 74.03±12.00 | 73.45±11.38 | 0.170 |
| WtHR (WC/Height) | 0.47±0.07 | 0.48±0.07 | 0.47±0.07 | 0.703 |
| BF (%) | 24.66±7.22 | 24.11±7.22 | 24.36±7.22 | 0.367 |
| Cardiovascular variables | ||||
| Resting Heart Rate (bpm) | 67.66±7.02 | 68.05±6.57 | 67.87±6.77 | 0.491 |
| SBP (mmHg) | 118.26±12.91 | 118.88±13.25 | 118.60±13.09 | 0.569 |
| DBP(mmHg) | 78.32±13.01 | 79.82±13.00 | 79.14±13.01 | 0.164 |
| Physical fitness related to health | ||||
| VO2max (ml/kg/min) | 42.53±4.47 | 46.02±6.03 | 44.44±5.65 | P<0.001 |
| SJT (cm) | 134.02±25.28 | 133.63±25.80 | 133.81±25.55 | 0.854 |
| Handgrip strength DH(kg) | 23.10±7.98 | 25.87±8.75 | 24.62±8.51 | P<0.001 |
| Handgrip strength ND(kg) | 22.46±7.98 | 25.34±8.63 | 24.04±8.46 | P<0.001 |
The data shown represent the mean±SD. Values of P<0.05 were considered statistically significant. BMI=body mass index, WC=waist circumference, WtHR=waist to height ratio, BF=body fat, SBP=systolic blood pressure, DBP=diastolic blood pressure, VO2max=maximal oxygen consumption, SJL=standing long jump test, DH=dominant hand, ND=non-dominant hand.
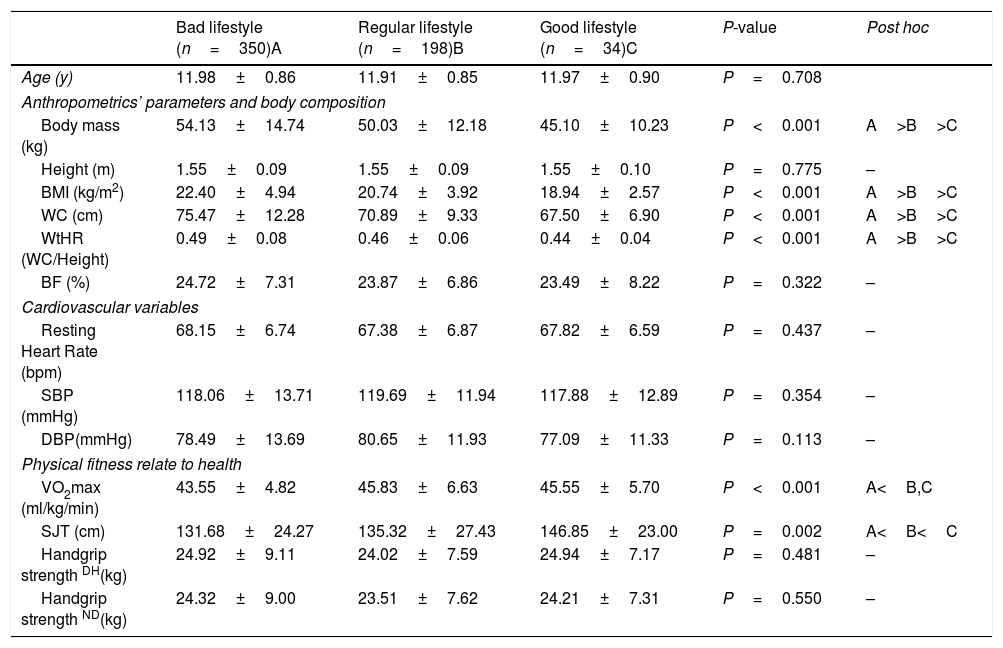
Schoolchildren with a good lifestyle that includes less ST and higher PA after school had lower BMI, WC, and WtHR (P<0.001) as compared to their peers with a bad and regular lifestyle. VO2max (P<0.001) and SLJ (P=0.002) were higher in schoolchildren with a good lifestyle (Table 2).
Comparison according to lifestyle (screen time and physical activity after school).
| Bad lifestyle (n=350)A | Regular lifestyle (n=198)B | Good lifestyle (n=34)C | P-value | Post hoc | |
|---|---|---|---|---|---|
| Age (y) | 11.98±0.86 | 11.91±0.85 | 11.97±0.90 | P=0.708 | |
| Anthropometrics’ parameters and body composition | |||||
| Body mass (kg) | 54.13±14.74 | 50.03±12.18 | 45.10±10.23 | P<0.001 | A>B>C |
| Height (m) | 1.55±0.09 | 1.55±0.09 | 1.55±0.10 | P=0.775 | – |
| BMI (kg/m2) | 22.40±4.94 | 20.74±3.92 | 18.94±2.57 | P<0.001 | A>B>C |
| WC (cm) | 75.47±12.28 | 70.89±9.33 | 67.50±6.90 | P<0.001 | A>B>C |
| WtHR (WC/Height) | 0.49±0.08 | 0.46±0.06 | 0.44±0.04 | P<0.001 | A>B>C |
| BF (%) | 24.72±7.31 | 23.87±6.86 | 23.49±8.22 | P=0.322 | – |
| Cardiovascular variables | |||||
| Resting Heart Rate (bpm) | 68.15±6.74 | 67.38±6.87 | 67.82±6.59 | P=0.437 | – |
| SBP (mmHg) | 118.06±13.71 | 119.69±11.94 | 117.88±12.89 | P=0.354 | – |
| DBP(mmHg) | 78.49±13.69 | 80.65±11.93 | 77.09±11.33 | P=0.113 | – |
| Physical fitness relate to health | |||||
| VO2max (ml/kg/min) | 43.55±4.82 | 45.83±6.63 | 45.55±5.70 | P<0.001 | A<B,C |
| SJT (cm) | 131.68±24.27 | 135.32±27.43 | 146.85±23.00 | P=0.002 | A<B<C |
| Handgrip strength DH(kg) | 24.92±9.11 | 24.02±7.59 | 24.94±7.17 | P=0.481 | – |
| Handgrip strength ND(kg) | 24.32±9.00 | 23.51±7.62 | 24.21±7.31 | P=0.550 | – |
The data shown represent the mean±SD. Values of P<0.05 were considered statistically significant. BMI=body mass index, WC=waist circumference, WtHR=waist to height ratio, BF=body fat, SBP=systolic blood pressure, DBP=diastolic blood pressure, VO2max=maximal oxygen consumption, SJL=standing long jump test, DH=dominant hand, ND=no dominant hand.
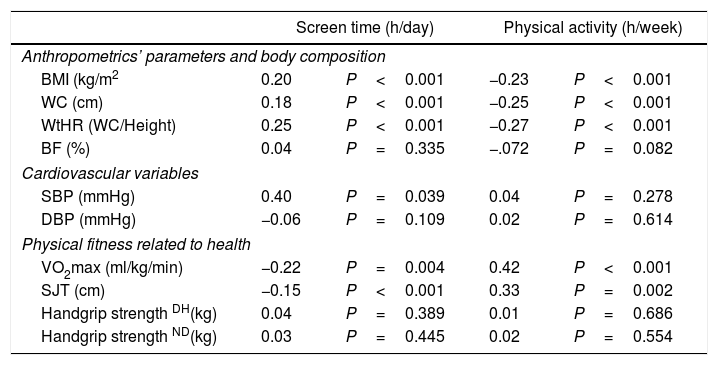
Table 3 shows the correlations between variables. ST presented a positive correlation with BMI (r=0.20, P<0.001), WC (r=0.18, P<0.001), and WtHR (r=0.15, P<0.001) and presented a negative relationship with both VO2max (r=−0.12, P=0.004) and SLJ (r=−0.15, P<0.001). Additionally, PA after school presented a negative correlation with BMI (r=−0.23, P<0.001), WC (r=−0.25, P<0.001), and WtHR (r=−0.27, P<0.001) and a positive correlation with both VO2max (r=0.42, P<0.001) and SLJ (r=0.33, P=0.002).
Relationship between anthropometrics parameters and physical fitness with lifestyle.
| Screen time (h/day) | Physical activity (h/week) | |||
|---|---|---|---|---|
| Anthropometrics’ parameters and body composition | ||||
| BMI (kg/m2 | 0.20 | P<0.001 | −0.23 | P<0.001 |
| WC (cm) | 0.18 | P<0.001 | −0.25 | P<0.001 |
| WtHR (WC/Height) | 0.25 | P<0.001 | −0.27 | P<0.001 |
| BF (%) | 0.04 | P=0.335 | −.072 | P=0.082 |
| Cardiovascular variables | ||||
| SBP (mmHg) | 0.40 | P=0.039 | 0.04 | P=0.278 |
| DBP (mmHg) | −0.06 | P=0.109 | 0.02 | P=0.614 |
| Physical fitness related to health | ||||
| VO2max (ml/kg/min) | −0.22 | P=0.004 | 0.42 | P<0.001 |
| SJT (cm) | −0.15 | P<0.001 | 0.33 | P=0.002 |
| Handgrip strength DH(kg) | 0.04 | P=0.389 | 0.01 | P=0.686 |
| Handgrip strength ND(kg) | 0.03 | P=0.445 | 0.02 | P=0.554 |
The data shown represent r (P-value). P<0.05 were considered statistically significant. BMI=body mass index, WC=waist circumference, WtHR=waist to height ratio, BF=body fat, SBP=systolic blood pressure, DBP=diastolic blood pressure, VO2max=maximal oxygen consumption, SJL=standing long jump test, DH=dominant hand, ND=non-dominant hand.
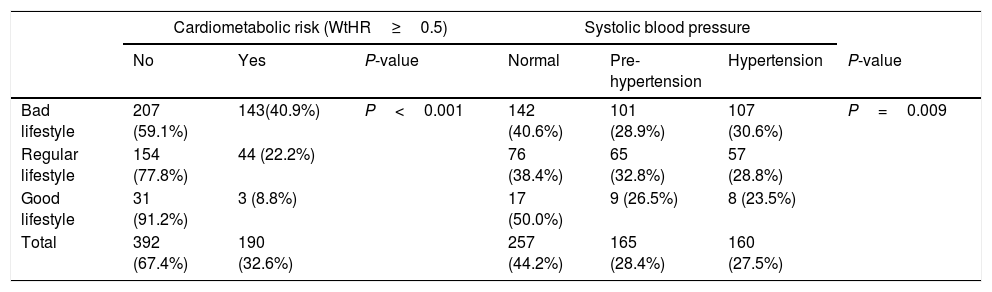
Table 4 shows the proportion of schoolchildren according to lifestyle. Schoolchildren with a bad lifestyle, more ST, and lower PA levels, had the highest proportion of abdominal obesity (WtHR≥0.5) (40.9%, P<0.001), that is higher i.e. CMR, while schoolchildren with good lifestyle presented the lowest proportion of abdominal obesity with (8.8%, P<0.001). Besides, the schoolchildren with bad lifestyle reported a higher prevalence of hypertension (30.6%, P=0.009) in comparison with schoolchildren with good lifestyle (23.5%).
Relationship between lifestyle with CMR in schoolchildren.
| Cardiometabolic risk (WtHR≥0.5) | Systolic blood pressure | ||||||
|---|---|---|---|---|---|---|---|
| No | Yes | P-value | Normal | Pre-hypertension | Hypertension | P-value | |
| Bad lifestyle | 207 (59.1%) | 143(40.9%) | P<0.001 | 142 (40.6%) | 101 (28.9%) | 107 (30.6%) | P=0.009 |
| Regular lifestyle | 154 (77.8%) | 44 (22.2%) | 76 (38.4%) | 65 (32.8%) | 57 (28.8%) | ||
| Good lifestyle | 31 (91.2%) | 3 (8.8%) | 17 (50.0%) | 9 (26.5%) | 8 (23.5%) | ||
| Total | 392 (67.4%) | 190 (32.6%) | 257 (44.2%) | 165 (28.4%) | 160 (27.5%) | ||
Data shown are presented as n (proportion). P value<0.05 are considered statistically significant. Lifestyle=screen time and physical activity after school (Test Krece Plus).
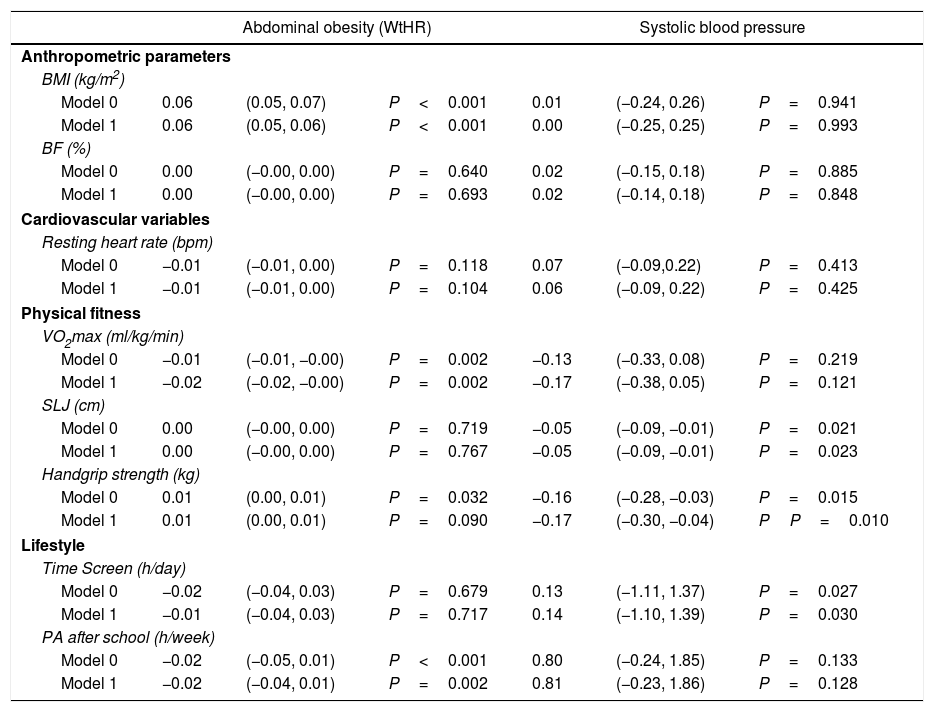
PA after school (β; −0.02, 95%IC; −0.04, 0.01, P=0.002) and CRF (β; −0.02, 95%IC; −0.02, −0.00, P=0.002) adjusted by age and sex reported inverse associations with abdominal obesity (WtHR≥0.5). Likewise, ST presented a positive association with SBP (β; 0.14, 95%IC; −1.10, 1.39, P=0.030). Moreover, handgrip strength (β; −0.17, 95%IC; −0.30, −0.04, P=0.010) and SLJ (β; −0.05, 95%IC; −0.09, −0.01, P=0.023) reported inverse associations with SBP (Table 5).
Association between cardiometabolic risk factors with anthropometrics’ parameters, physical fitness and lifestyle.
| Abdominal obesity (WtHR) | Systolic blood pressure | |||||
|---|---|---|---|---|---|---|
| Anthropometric parameters | ||||||
| BMI (kg/m2) | ||||||
| Model 0 | 0.06 | (0.05, 0.07) | P<0.001 | 0.01 | (−0.24, 0.26) | P=0.941 |
| Model 1 | 0.06 | (0.05, 0.06) | P<0.001 | 0.00 | (−0.25, 0.25) | P=0.993 |
| BF (%) | ||||||
| Model 0 | 0.00 | (−0.00, 0.00) | P=0.640 | 0.02 | (−0.15, 0.18) | P=0.885 |
| Model 1 | 0.00 | (−0.00, 0.00) | P=0.693 | 0.02 | (−0.14, 0.18) | P=0.848 |
| Cardiovascular variables | ||||||
| Resting heart rate (bpm) | ||||||
| Model 0 | −0.01 | (−0.01, 0.00) | P=0.118 | 0.07 | (−0.09,0.22) | P=0.413 |
| Model 1 | −0.01 | (−0.01, 0.00) | P=0.104 | 0.06 | (−0.09, 0.22) | P=0.425 |
| Physical fitness | ||||||
| VO2max (ml/kg/min) | ||||||
| Model 0 | −0.01 | (−0.01, −0.00) | P=0.002 | −0.13 | (−0.33, 0.08) | P=0.219 |
| Model 1 | −0.02 | (−0.02, −0.00) | P=0.002 | −0.17 | (−0.38, 0.05) | P=0.121 |
| SLJ (cm) | ||||||
| Model 0 | 0.00 | (−0.00, 0.00) | P=0.719 | −0.05 | (−0.09, −0.01) | P=0.021 |
| Model 1 | 0.00 | (−0.00, 0.00) | P=0.767 | −0.05 | (−0.09, −0.01) | P=0.023 |
| Handgrip strength (kg) | ||||||
| Model 0 | 0.01 | (0.00, 0.01) | P=0.032 | −0.16 | (−0.28, −0.03) | P=0.015 |
| Model 1 | 0.01 | (0.00, 0.01) | P=0.090 | −0.17 | (−0.30, −0.04) | PP=0.010 |
| Lifestyle | ||||||
| Time Screen (h/day) | ||||||
| Model 0 | −0.02 | (−0.04, 0.03) | P=0.679 | 0.13 | (−1.11, 1.37) | P=0.027 |
| Model 1 | −0.01 | (−0.04, 0.03) | P=0.717 | 0.14 | (−1.10, 1.39) | P=0.030 |
| PA after school (h/week) | ||||||
| Model 0 | −0.02 | (−0.05, 0.01) | P<0.001 | 0.80 | (−0.24, 1.85) | P=0.133 |
| Model 1 | −0.02 | (−0.04, 0.01) | P=0.002 | 0.81 | (−0.23, 1.86) | P=0.128 |
The data shown represent Beta (95% CI), P value. P<0.05 were considered statistically significant. BMI=body max index, BF=body fat, VO2max=maximal oxygen consumption, SLJT=standing log jump test, PA=physical activity. Model 0: Not adjust. Model 1: adjust by age and sex.
The objective of this study was to determine the relationship between lifestyle (i.e. ST and PA after school) with physical fitness related to health and CMR factors (i.e. hypertension and abdominal obesity) in Chilean schoolchildren. The mains findings of the study were: (i) schoolchildren with a bad lifestyle had a higher proportion of CMR (i.e. hypertension and abdominal obesity), while schoolchildren with good lifestyles had a lower proportion of CMR; (ii) ST showed a negative relationship with physical fitness; and (iii) PA after school was positively related to physical fitness related to health.
In the present study, a bad lifestyle (i.e. higher ST and lower PA after school) was associated with a higher prevalence of abdominal obesity (WtHR≥0.5) and hypertension in schoolchildren, both CMR factors. In this sense, an investigation carried out with Canadian children showed that higher levels of moderate- to vigorous-intensity PA were associated with lower WC, fasting triglycerides and diastolic blood pressure, and higher high-density lipoprotein (HDL) cholesterol, irrespective of sedentary time.28 Likewise, lower PA has been shown to lead to increased adiposity.29 Lack of PA is a very important CMR factor and works together with other factors associated with a sedentary lifestyle (i.e. lack of sleep and ST).30 An investigation reported that there is a greater risk of hypertension in people with low levels of PA who are also overweight or obese.31 Furthermore, these factors also increase the risk of developing diabetes, with higher levels of insulin resistance.32
In the same way, an investigation carried out in the south of Chile, in similar sample reported that physically-inactive ethnicity schoolchildren show higher levels of SBP than their peers. Likewise, under similar conditions of physical inactivity, schoolchildren with ethnicity (i.e., Amerindian schoolchildren) have a more adverse CMR than their counterparts without ethnicity.33 Therefore, ethnicity it is an important variable that need to be considered.
Along the same line, the results of this work indicate that schoolchildren with a good lifestyle (i.e., less ST and high PA after school) had lower anthropometric parameters than their peers with a bad lifestyle. In this sense, a study reported an inverse relationships between the PA levels and anthropometric parameters in Chilean schoolchildren.34 In contrast, a study with Spanish schoolchildren showed that high levels of PA was not associated to differences in BMI and WC.35 In this sense, ST is a stronger factor than PA in predicting weight status in children.36
The present study reported that CRF and SLJ (explosive strength) were higher in schoolchildren with a good lifestyle; these variables are important biomarkers of health.13,16 However, another important finding of this study was that ST presented a negative relationship with both CRF and SLJ, which also agrees with a study carried out in English children that showed a negative association between ST and physical fitness.37 Additionally, a study of Colombian children concluded that, regardless of CRF, a total screen time>3h per day was positively associated with WC and BMI. Likewise, sedentary behaviour in girls was not associated with adiposity, but CRF did negatively associate with BMI.38
In this research, PA after school was positively associated with physical fitness related to health as CRF and SLJ. In the same line, a study conducted in schoolchildren aged 8–12 years using the ALPHA-Fitness battery and PA through a questionnaire reported a positive and bidirectional relationship between PA and CRF where the students with a high level of PA presented better physical fitness than their peers with a low level of physical fitness.39 Also, another study found direct correlations between PA and physical fitness, especially with CRF.36
LimitationsThe limitations of the present study include those inherent to its transversal character. Another limitation would be the self-reporting in relation to the PA level of the students, which could mean that these data are underestimated or overestimated. The use of accelerometers could provide objective measures for future studies.
ConclusionIn conclusion, the lifestyles of schoolchildren are related to CMR (i.e. abdominal obesity and hypertension) and physical fitness related to health, generating the need to promote policies and interventions aimed at encouraging an active lifestyle that includes more PA per week and less time in front of screens during the day. This has the overall aim of improving health in schoolchildren through an increase in physical fitness and thus prevent the development of CMR in the future.
Authors’ contributionsPDF and RBB conceived, organised and oversaw the study, drafted the analysis plan, drafted the manuscript and provided final approval of the version to be published. CMS critically revised the manuscript and provided final approval of the version to be published.
Conflict of interestThe authors declare that they have no conflict of interest or any financial relationship with the organisation that sponsored the research.
The authors gratefully acknowledge the team from the Department of Physical Education of the Universidad de La Frontera who worked on the study.
