


Understanding expectations of the patients towards the quality of services that hospitals providing is very important in quality in healthcare. With every health care organization claiming its services to be the best, benchmarking and comparing them to ascertain the real best is very difficult but much required in this competitive world. Patients have a varied need depending upon the resources and criticality of disease. The aim of the study was to identify the factors linked with patient's expectations contributing to the quality of the service delivered by the hospital.
Materials and methodsMulti-speciality hospitals were visited to survey indoor and outdoor patients of different age groups. Omega coefficient and Cronbach α test were used to test the questionnaire's validity and reliability. The factor analysis technique was used to identify factors determining patient expectations. The SERVQUAL framework was used to categorize evaluation criteria.
ResultsThe resultant factors show variations in prioritizing service demands by the patients. Such a system would enable the patients to select a hospital capable of delivering best quality services.
ConclusionThis study identifies the factors that contribute in delivering high quality service by the hospital. It gives a futuristic view to design a framework for evaluating the quality of the service delivered by a hospital.
Comprender las expectativas de los pacientes sobre la calidad de los servicios prestados por los hospitales es muy importante para la calidad de la atención sanitaria. Como cada organización de atención sanitaria defiende que sus servicios son los mejores, la evaluación comparativa para comprobar que esta afirmación es cierta es muy difícil, pero es a la vez muy necesaria en este mundo competitivo. Los pacientes tienen diferentes necesidades, dependiendo de los recursos y de la gravedad de la enfermedad. El objetivo de este estudio fue identificar los factores vinculados a las expectativas de los pacientes, que contribuyen a la calidad del servicio prestado por el hospital.
Materiales y métodosSe realizaron visitas a hospitales de múltiples especialidades, para entrevistar a los pacientes internos y externos de diferentes grupos de edad. Se utilizaron el coeficiente omega y la prueba α de Cronbach para probar la validez y fiabilidad del cuestionario. Se utilizó la técnica de análisis factorial para identificar los factores determinantes de las expectativas de los pacientes, y el marco SERVQUAL para categorizar los criterios de evaluación.
ResultadosLos factores resultantes muestran variaciones a la hora de priorizar las demandas de servicio por parte de los pacientes. Dicho sistema permitiría que los pacientes seleccionaran un hospital capaz de prestar servicios de la mejor calidad.
ConclusiónEl presente estudio identifica los factores que contribuyen a la prestación de servicios de alta calidad por parte del hospital, y aporta una visión futurista para diseñar un marco de evaluación de la calidad del servicio prestado por el hospital.
The biggest challenge for any service industry is to deliver the best service so as to maximize customer's satisfaction. “Service quality” is an indicator of how much an organization successfully satisfies the needs of its customers. The service-quality of an organization is best judged by how often a customer acquires services of that organization. In concern with the healthcare industry, quality of service is a critical factor for benchmarking it amidst its competitors. Though hospitals provide nearly similar type of services but the quality of service delivered, varies significantly. The two major causes of such variation are, ‘poor quality services delivered by a hospital’ or ‘uncertainty in patient's satisfaction for similar services delivered by the hospital’. Casual or improper care of patient may lead to permanent physical damage or even death.
‘Expectation’ and ‘Satisfaction’ are highly variable, and vary from person to person. Today, people are quite aware about health plans, services and legal rights. With, increased literacy rate and readily accessible information on the internet, patient demand transparency in the treatment provided by the respective health care unit. It is a big challenge for hospital administrators to satisfy the patient's queries. Thus, it becomes important to identify the factors influencing service quality in hospitals and investigate intra-relationships between these factors. The objective of the study is to understand the key factors1 that patient find critical in providing quality health services. The two types of quality possessed by a hospital are: technical and functional quality. Technical quality is the extent to which diagnoses and procedures are accurate whereas functional quality means the form in which the services are provided.
Various generic tools and frameworks are available to measure organization's service quality. One of the most famous framework2 and standard and reliable tool is Service Quality Measurement Scale (SERVQUAL). SERVQUAL model presented by3 determines gap between perception and expectation of the consumers. A ten-dimensional concept of the service quality was initially proposed. Later, a five-dimensional tool-RATER (Reliability, Assurance, Tangibility, Empathy and Responsiveness), was proposed using exploratory factor analysis from a questionnaire of 97 items. It has been identified as a valid indicator that determines patient satisfaction4 with the quality of healthcare services provided. Meeting patient's expectation requires identification of most crucial service quality dimensions. Hence, a method is sought for detecting the most critical service quality factors5 that would enable the hospitals to dynamically assess and modify the service parameters as per the patient's need.
The study objective was to identify the most important factors for patients to evaluate the quality of services provided by hospital. Some common features that patients look for, were collected through literature review and pilot survey. Based on the expert opinion and result of pilot survey a questionnaire was designed to find the stakeholder opinions. The opinions were mapped to SERVQUAL framework using the factor analysis. As there can be large number of facility and features that patients look for in health services, the factor analysis proved helpful for dimension reduction.
SERVQUAL has been exhaustively utilized to measure quality of hospital services in the past researches. This work extends the SERVQUAL analysis to identify the dependency and variations of demographic data such as ‘Age’ and ‘Frequency of visit’. A micro-level study done for each factor and variation in their likings is evaluated. The study shows the variations obtained on analysing the resultant under various sub categories of these parameters. The analysis reveals that within each factor the priority of the people changes.
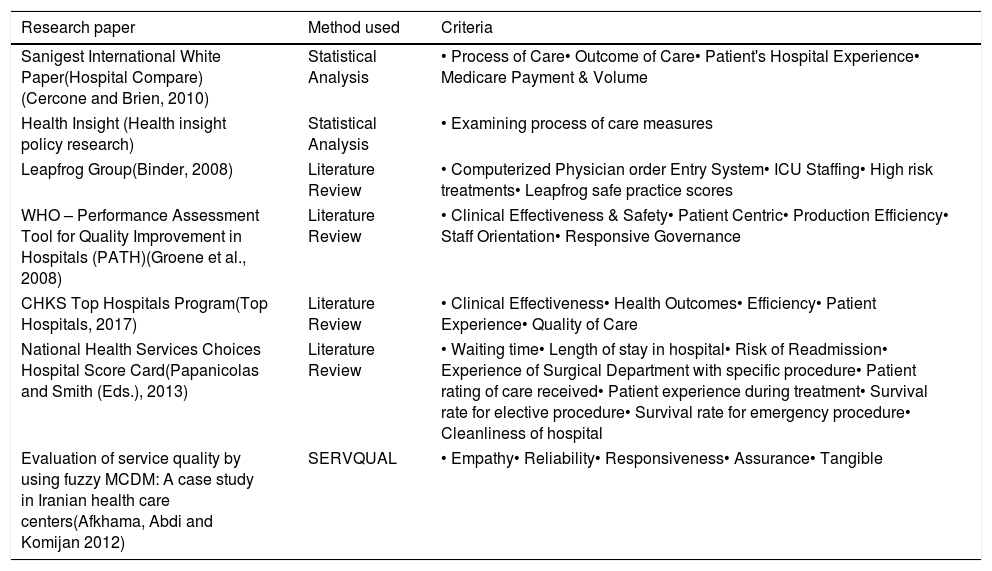
Literature reviewThe literature study revealed various approaches to assess the quality of service provided by the hospitals. It focused on two important aspects. Firstly, we tried to understand the features and facilities of the healthcare services. Specialization-based assessment6 of service quality indicates ‘very low’ satisfaction of the patients and illustrates the need for a robust quality assessment tool. Another research7 stresses on the need to devise a solution for outpatients as lengthy waiting time reduces their satisfaction level in availing the services of the hospital. A hypothetical study8 assessed the quality of health services using partial-least square structural equation method. But, the study was limited to only one hospital. Patient's behavioural intentions and satisfaction with the service quality were tested9 on three dimensions – process, interaction and environment. Exploratory factor analysis10 was applied on a cross-sectional data collected from patients using surgery, obstetrics and medical services. Service quality and determinants of customer satisfaction in Turkey's hospitals were investigated through logistic regression analysis (Table 1).11
Features and facilities of healthcare services.
| Research paper | Method used | Criteria |
|---|---|---|
| Sanigest International White Paper(Hospital Compare) (Cercone and Brien, 2010) | Statistical Analysis | • Process of Care• Outcome of Care• Patient's Hospital Experience• Medicare Payment & Volume |
| Health Insight (Health insight policy research) | Statistical Analysis | • Examining process of care measures |
| Leapfrog Group(Binder, 2008) | Literature Review | • Computerized Physician order Entry System• ICU Staffing• High risk treatments• Leapfrog safe practice scores |
| WHO – Performance Assessment Tool for Quality Improvement in Hospitals (PATH)(Groene et al., 2008) | Literature Review | • Clinical Effectiveness & Safety• Patient Centric• Production Efficiency• Staff Orientation• Responsive Governance |
| CHKS Top Hospitals Program(Top Hospitals, 2017) | Literature Review | • Clinical Effectiveness• Health Outcomes• Efficiency• Patient Experience• Quality of Care |
| National Health Services Choices Hospital Score Card(Papanicolas and Smith (Eds.), 2013) | Literature Review | • Waiting time• Length of stay in hospital• Risk of Readmission• Experience of Surgical Department with specific procedure• Patient rating of care received• Patient experience during treatment• Survival rate for elective procedure• Survival rate for emergency procedure• Cleanliness of hospital |
| Evaluation of service quality by using fuzzy MCDM: A case study in Iranian health care centers(Afkhama, Abdi and Komijan 2012) | SERVQUAL | • Empathy• Reliability• Responsiveness• Assurance• Tangible |
Secondly, the SERVQUAL framework applied in healthcare environment. Evaluation of Hospital Service Quality based on Fuzzy Multiple Index approach12 presents 22 performance criteria through a 5-factor system. It involves hospital's whole situation, the security and condition of therapy service, hospital's outfit service measure and affiliated service establishment. SERVQUAL13–15 has been extensively utilized to evaluate and analyze patient's perceptions with the actual delivery of treatment services. These studies were used to design the questionnaire for gathering patient's opinions and analysing overall quality services of hospitals. Service quality gaps in hospitals were analyzed and validated17 by a total unweighted SERVQUAL score. Research18 found that hospital's physical environment, service cost and information shared with the patients play significant role in determining patient satisfaction.
A strong relationship between patient's expectations and service quality was identified through rigorous literature study. Hospitals’ maintaining the quality of services as per the patient's expectations has been a topic of research and debate. Making the patient aware about the technical and medical complexities is sometimes difficult for the hospital administrators. This leads to a communication gap and affects the expectation and satisfaction level of the patient. Moreover, the patient, categorized into various dimensions based on age, frequency of visit, societal status, location, etc., may have varied expectations. Hence, it becomes important to identify the factors meeting patient's expectations and contributing to the high quality service delivery by the hospital.
MethodsIt was important to understand the environment and the expectations of the people living in that environment. Every country has different environment, hence the people have different need and expectations from the services, the study considered the Indian perspective and economy.
QuestionnaireThe questionnaire included 50 questions initially and was reduced to 23 viable questions. Expert opinions were considered to refine the questions in terms of words, vocabulary and meaning. The questionnaire was divided into two parts. The first part collected demographic details of the patient, whereas the second part included questions related to different quality service dimensions in a hospital. Pilot study through 50 respondents selected randomly. It enabled to identify the gaps in conveying the meaning that the researchers wanted their respondents to interpret. The language was edited accordingly before distributing the questionnaire to the patients. The feedback of 349 patients was collected on a rating of 5 point Likert scale. The scale ranges from 1 to 5, indicating, “Strongly disagree”, “Disagree”, “Neutral”, “Agree” and “Strongly agree”.
Each question needed to be interpreted and assigned to the SERVQUAL factor. Patients, while filling the questionnaire were not aware of the categorization of factors. There had been no verticals shown to the patients and no grouping of questions was done at the initial level. It is only after the factor analysis that patient's opinions could be categorized based on highest loadings in each factor. Using these questionnaires, the criteria and sub-criteria (Table 5) that can significantly contribute in ranking of hospitals based on their services, were identified.
Surveyed hospitals and study variablesThe hospitals undertaken for this study are the multi-speciality hospitals located in National Capital Region of India. Medium sized hospitals having the Admission, OTs, Laboratory, OPD and Emergency services were considered to collect the opinion of patients.
Patients at various locations were interviewed. Patients were categorized according to indoor and outdoor patient; gender; age-range; and frequency of visit to the hospital. The questionnaire was dispensed and collected from various patients in OPDs, IPDs and Laboratory waiting queues.
Statistical analysisFactor reduction technique using a statistical tool, SPSS19 maps 23 factors into the 5 standard broad factors of SERVQUAL model i.e. Tangibility, Reliability, Responsiveness, Assurance and Empathy. The factor analysis identifies inter-dependence of various factors that determine the quality of healthcare services. This study combines multiple factors to produce a reduced component matrix arranging each criterion in one of the five factors identified in SERVQUAL framework.
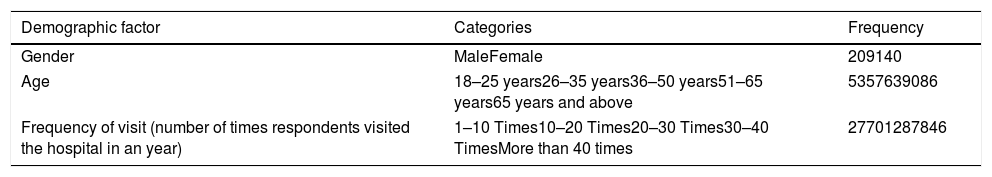
Table 2 lists the distribution of data obtained from the population considered in this study. The demographic data is divided into 4 major categories, ‘Gender’, ‘Age’, ‘Frequency of visit (number of times respondents visited the hospital in an year)’ and ‘Patient type (i.e. indoor or outdoor)’. The factors considered hugely affect the opinions of the respondents while selecting the hospital of their choice. Many other implicit factors are associated in their decisions, i.e., speciality of the hospital, social status of self, to name a few.
Demographic details of the respondents (number of respondents=349).
| Demographic factor | Categories | Frequency |
|---|---|---|
| Gender | MaleFemale | 209140 |
| Age | 18–25 years26–35 years36–50 years51–65 years65 years and above | 5357639086 |
| Frequency of visit (number of times respondents visited the hospital in an year) | 1–10 Times10–20 Times20–30 Times30–40 TimesMore than 40 times | 27701287846 |
As this questionnaire is based on multiple Likert questions that form a scale, the reliability of scale must definitely be ascertained. Cronbach alpha (α).20 Alpha limits the reliability analysis to identify the internal consistencies at the factor level. Hence, a better tool, Omega (ω)16 resolves the limitations of alpha by calculating a more precise measure of internal consistencies for the scales. Reliability test, in this study, was conducted using both the methods and a comparative result is shown in Table 2. Alpha (α) value of 0.816 obtained on the input data set signifies it to be reliable for further analysis. Limitations of alpha were overcome through Omega analysis that came out to be 0.827 at 95% confidence level. It proves more realistic estimate of true reliability of scale.
Before performing factor analysis, it is important to find the suitability of data used for the process of factor extraction. Kaiser-Meyer-Olkin (KMO) measure21,22 and Bartlett's Test of Sphericity23 are applied for sampling adequacy. The KMO measure is based on the idea of partial correlation. The KMO index can range from 0 to 1, but a value >0.50 is considered suitable for factor analysis.24,25 In Bartlett's Test of Sphericity the value of ‘p’ (Pearson's coefficient) less than 0.05 is considered significant for factor analysis. A significant value of Bartlett test indicates that the correlation matrix is not an identity matrix. There exist some relationships between the variables included in the analysis. The approximate of Chi-square is 3164.048 with 253 degrees of freedom, which is significant <0.001 level of significance. The KMO statistic of 0.726 is also large (greater than 0.50). KMO index and Bartlett's Test of Sphericity obtained thus signifies the suitability of data for factor analysis.
The aim of factor reduction is to reduce the number of variables into limited number of factors. The purpose is to handle the challenges of computation time and managing the huge amount of data collected for the analysis. This will help in simplified study by removing redundant variables and give a hierarchical model of the variables by grouping them under certain factors. There are a number of methods to obtain the factors like Principal Axis Factoring (PAF), Principal Component Analysis (PCA), and maximum likelihood, canonical, image factoring and alpha factoring.25,26
ResultsPCA is applied for factor reduction due to its simplicity and intuitiveness. PCA reduces the dimensionality of the problem to provide easy interpretation. It is applied to summarize each related factor with unique characteristics. However, by SERVQUAL framework, it is required to extract n factors that would summarize the given factors based on relativity. PCA enables to visualize variables especially when in higher dimensions by reducing the plotting space and increasing clarity of observation in the obtained factors.
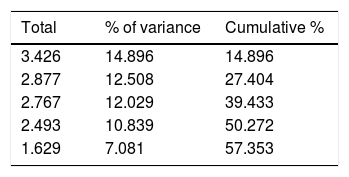
Factor analysis needs selection of rotation method. As the purpose is to minimize the number of variables to produce independent factors that best fit the data, Varimax method is selected. The Varimax rotation tries to maximize the variance of each factor. In concern with the missing values, data set for this study has no missing value. The Eigen values are the variance of the factors. With these five factors, cumulative variance is explained. The cumulative variance represents the cumulative percentage between present and preceding factors. Initial number of factors were equal to the total number of factors (i.e. 23) considered for this study. Only those factors, having Eigen value >1(Kaiser's criteria i.e. eigenvalue >1 rule)20,27 were considered, therefore, reducing them to 5. The result obtained was divided into 3 columns. The first column (Total) explains the Eigen value such that the first factor always account for the highest Eigen value reducing with each successive factor. Column 2 (% of variance) contains the percent of total variance accounted for by each factor. Third column (Cumulative %) explains the cumulative percentage of variance accounted for by all preceding and current factors, that in this case is 57.353% (Table 3).
Scree plot represents the Eigen value against the factor number. It helps in determining the optimum number of principal components. Eigen value of each principal component is divided by all the Eigen values to obtain the proportion of variance. As visible in Fig. 1, there is significant difference in the amount of total variance in first four columns. Thereafter, from column 5, the graph is almost flat which specifies that each successive factor accounts for much smaller amount of total variance. It concludes that the last huge fall occurs at fifth component, hence using the first five components to be taken as ultimate solution.

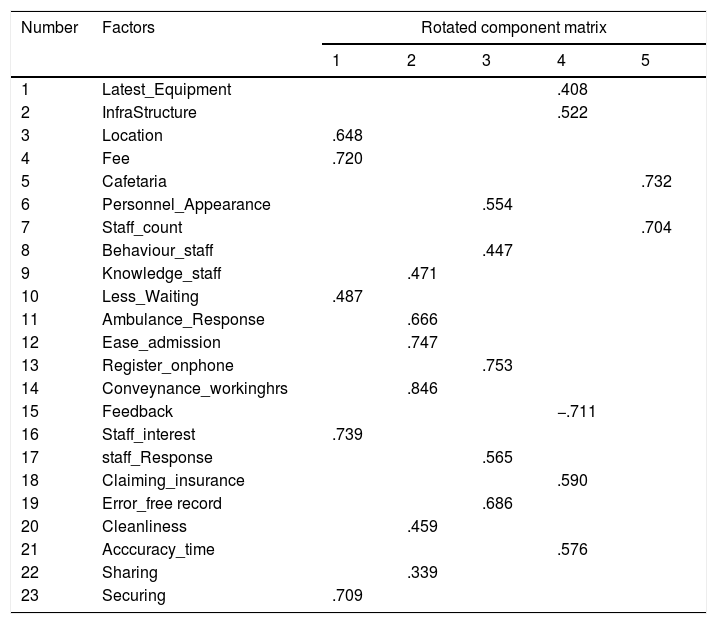
Rotation component matrix represents rotated factor loadings that are the correlation between variables and the factors. The matrix categorizes the variables in one or the other rotated factors that have been extracted through factor analysis. Table 4 showcase the core factors that highly correlated with utmost one rotated factor and less correlated on other rotated factors. The factor loadings <0.3 have not been displayed for the sake of better readability. The results in the table are post-rotation. The pre-rotation failed to give concrete results as the variables were loaded highly onto first factor leaving all other factors weakly visible.
Rotation component matrix categorizing variables into five factors.
| Number | Factors | Rotated component matrix | ||||
|---|---|---|---|---|---|---|
| 1 | 2 | 3 | 4 | 5 | ||
| 1 | Latest_Equipment | .408 | ||||
| 2 | InfraStructure | .522 | ||||
| 3 | Location | .648 | ||||
| 4 | Fee | .720 | ||||
| 5 | Cafetaria | .732 | ||||
| 6 | Personnel_Appearance | .554 | ||||
| 7 | Staff_count | .704 | ||||
| 8 | Behaviour_staff | .447 | ||||
| 9 | Knowledge_staff | .471 | ||||
| 10 | Less_Waiting | .487 | ||||
| 11 | Ambulance_Response | .666 | ||||
| 12 | Ease_admission | .747 | ||||
| 13 | Register_onphone | .753 | ||||
| 14 | Conveynance_workinghrs | .846 | ||||
| 15 | Feedback | −.711 | ||||
| 16 | Staff_interest | .739 | ||||
| 17 | staff_Response | .565 | ||||
| 18 | Claiming_insurance | .590 | ||||
| 19 | Error_free record | .686 | ||||
| 20 | Cleanliness | .459 | ||||
| 21 | Acccuracy_time | .576 | ||||
| 22 | Sharing | .339 | ||||
| 23 | Securing | .709 | ||||
After rotation, the variance of each factor was identified. Factor 1 accounts for 14.896% of the variance; Factor 2 accounts for 12.508% of the variance; Factor 3 accounts for 12.029% of the variance; Factor 4 accounts for 10.839% of the variance and Factor 5 accounts for 7.081% of the variance. In total, all the 5 factors account for 57.353% of the variance in measuring the service quality of hospitals.
DiscussionThe factors obtained after dimension reduction were mapped to five broad categories of the SERVQUAL model. Table 5 lists the categorization obtained from factor analysis. The variables that load high on factor 1 relate to ‘EMPATHY’ which means the “Ability of Healthcare Provider to understand the feelings and need of the patient”. ‘EMPATHY’ holds highest share of total variance and plays a major role in achieving patient's satisfaction. Patient assesses a hospital on the availability of various facilities, equipment and easiness of their accessibility. Factor 2 has been labelled ‘RELIABILITY’. The variables falling under factor 2 are concerned with ‘Reliability of Healthcare Services’ extended by the hospitals. The variables loading high on factor 3 are related to ‘RESPONSIVENESS’ that indicates ‘behaviour skills of the hospital staff’. Factor 4, labelled as ‘ASSURANCE’ loads the variables that can ‘enhance trust and confidence’ of patient in obtaining services from the hospital. Finally, the variables that load high on factor 5 labelled as ‘TANGIBILITY’ relate to ‘Physical and Visible Aspects’ affecting the decisions made by patients while selecting the hospitals. ‘TANGIBILITY’ gets a low weightage in total share of the variance because if all the above expectations are met, its weightage in measuring the quality of services reduces significantly.
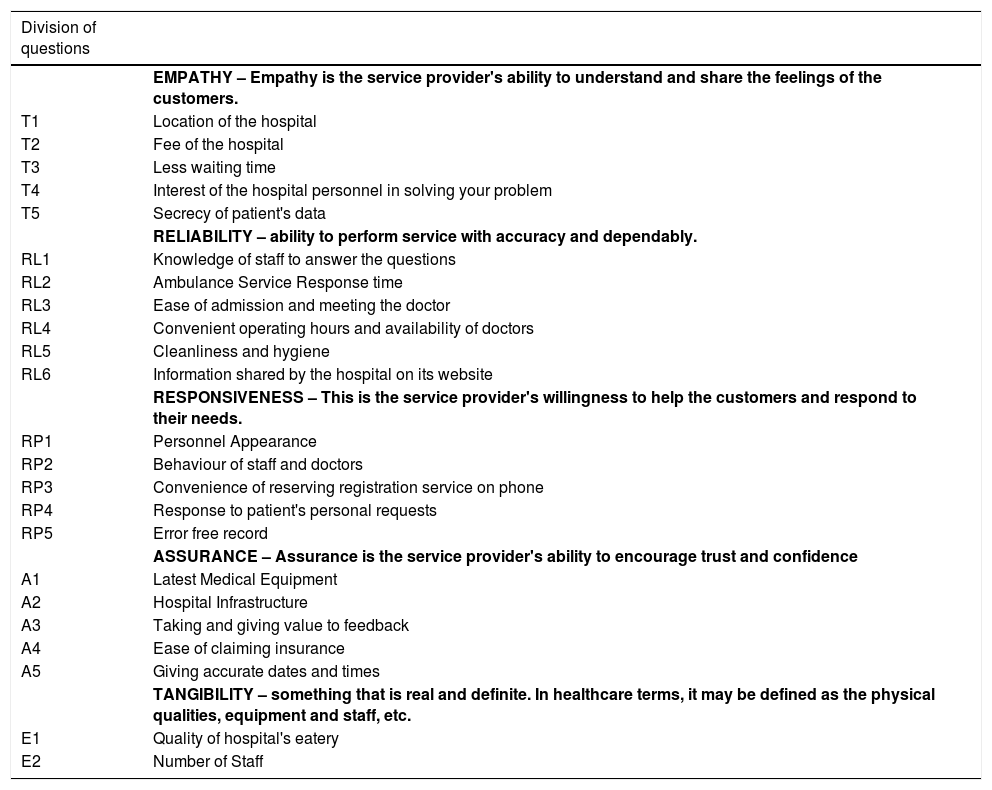
Criteria and sub-criteria finalized for the ranking of hospitals.
| Division of questions | |
|---|---|
| EMPATHY – Empathy is the service provider's ability to understand and share the feelings of the customers. | |
| T1 | Location of the hospital |
| T2 | Fee of the hospital |
| T3 | Less waiting time |
| T4 | Interest of the hospital personnel in solving your problem |
| T5 | Secrecy of patient's data |
| RELIABILITY – ability to perform service with accuracy and dependably. | |
| RL1 | Knowledge of staff to answer the questions |
| RL2 | Ambulance Service Response time |
| RL3 | Ease of admission and meeting the doctor |
| RL4 | Convenient operating hours and availability of doctors |
| RL5 | Cleanliness and hygiene |
| RL6 | Information shared by the hospital on its website |
| RESPONSIVENESS – This is the service provider's willingness to help the customers and respond to their needs. | |
| RP1 | Personnel Appearance |
| RP2 | Behaviour of staff and doctors |
| RP3 | Convenience of reserving registration service on phone |
| RP4 | Response to patient's personal requests |
| RP5 | Error free record |
| ASSURANCE – Assurance is the service provider's ability to encourage trust and confidence | |
| A1 | Latest Medical Equipment |
| A2 | Hospital Infrastructure |
| A3 | Taking and giving value to feedback |
| A4 | Ease of claiming insurance |
| A5 | Giving accurate dates and times |
| TANGIBILITY – something that is real and definite. In healthcare terms, it may be defined as the physical qualities, equipment and staff, etc. | |
| E1 | Quality of hospital's eatery |
| E2 | Number of Staff |
The crux of this study reveals that correlations among the variables fit into five common factors whose reliability has already been proven in SERVQUAL framework. The coefficients between the variables and principal components are simply the ‘weights’28 assigned to variables to indicate their importance. The findings can be utilized to rank the hospitals by assigning weights to each factor as per the user's perception and satisfaction. Ranking would ensure the quality of services provided by the hospitals. It would be beneficial not only to patients but also the health professionals. The trust and confidence of the stakeholders would further help in brand building.
Factor analysis resulted in distribution of 23 variables into five major factors with each variable contributing highly to utmost one factor. The study is further extended to observe a change in decision based on the categorization of patients, namely, gender, in-door/out-door, age, and frequency of visit. The analysis found a significant variation in patient's opinion depending on their age and the number of times they require visiting any hospital. The other two factors, gender and in-door/out-door patient, did not show significant variation in the opinion. Mean of variables in each factor calculated for ‘Age’ and ‘Frequency of visit’ to obtain the cumulative average scores. Data set was classified on the basis of ‘Age’ and ‘Frequency of visit’ into different groups.
Age-wise observation classifies respondent's age into five categories (Table 2). The data set divided into five sub-sets where each sub-set corresponds to one age-category. Further, variables were arranged as per the loadings obtained through factor analysis. Means of each variable was then calculated and added to the overall average of each age range. Graph in Fig. 2 clearly states that the patients in the category – ‘middle-aged’ and ‘senior citizens’, ranked ‘RELIABILITY’ higher than any other factor. They have ranked ‘EMPATHY’ and ‘ASSURANCE’ at second and third place respectively. Conversely, young patients gave higher weightage to ‘RESPONSIVENESS’ and ‘TANGIBILITY’. This indicates difference in needs and satisfaction of patients corresponding to a specific age group. At micro level, coefficient of variation identifies significant variation of the factors influenced by the factor ‘Age’, i.e., as age grows, their expectations also change.

Variation of opinion within each age group of respondents was observed using trend analysis. The purpose was to identify any change in patient's opinion with the advancement of age. Trend chart (Fig. 3) represents the opinions of the patients on five questions that are highly influenced with age. ‘Location of hospital’, ‘Ambulatory Services’, ‘Fee’, ‘Claiming Insurance Easily’ and ‘Accuracy of Time and Date of Next Visit’, were those five questions. The result shows that senior patients gave priority to ‘Location of hospital’, ‘Ambulatory Services’, ‘Accuracy of Time and Date of Next Visit’ over ‘Claiming Insurance Easily’. The younger patients on the other hand find ‘Claiming Insurance Easily’ as an important service over others.

Visit-wise observation classifies the data set into five categories based on ‘Frequency of Visit’ during a year with each sub-set corresponding to one category. Further, variables were arranged as per the loadings obtained through factor analysis. Mean of each variable was calculated and added to the overall average for each subset of ‘Frequency of Visit’. Fig. 4 observes that the patients with larger number of visits to the hospital rank ‘RELIABILITY’ higher than any other factor. ‘EMPATHY’ and ‘ASSURANCE’ were ranked at second and third place respectively. Conversely, patients with lesser need of healthcare services consider ‘RESPONSIVENESS’ and ‘TANGIBILITY’ much important over other factors.

The trend chart (Fig. 5) shows the variation in opinions of patients that are frequent visitors to the hospitals over the ones who visit less often. The important questions considered for this analysis include, ‘Location of hospital’, ‘Ambulatory Services’, ‘Fee’, ‘Hospital Infrastructure’, ‘Accuracy of Time and Date of Next Visit’ and ‘Quality of Hospital Cafeteria’. The chart shows that apart from ‘Ambulatory Services’ all other questions were differently prioritized by the patients. The ones who visit the hospital less often are more considerate towards ‘Hospital Infrastructure’ whereas the frequent visitors gave higher priority to ‘Location of hospital’, ‘Fee’ and ‘Quality of Hospital Cafeteria’.

Skewness in Figs. 3 and 5 is a clear indication of dynamic changes in patient's expectations in correspondence to increasing/decreasing needs of hospital services. Patients, for instance, with frequent needs to visit hospitals expect higher ‘EMPATHY’ (i.e., Location, Fee, Less_waiting, Staff_interest and Secrecy). The facilities vary in hospitals of different locations. In fact, multiple branches of same hospital vary in the quality of services delivered. Patient is more empathetic on the availability and reputation of services delivered by a hospital, wherever located it may be. ‘TANGIBILITY’ (i.e., staff_count and Cafeteria) are highly important for patients who have lesser needs of visiting the hospitals.
The facts clarify that patients view and assess hospital services differently even when the quality of services delivered remain same over time. A comparison with the PCA result is its best indicator. The PCA emphasizes ‘EMPATHY’ as the highest loading factor having highest weight over other loadings. Whereas, the analysis obtained on ‘Frequency of Visits’ and ‘Age-wise distribution of patients’ emphasize ‘RELIABILITY’ having highest correlation over other loadings. Therefore, a framework or a model that could consider the variation of weights obtained in a given variables and provide a dynamic measurement to assess the service quality can be developed.
The factor analysis widely used in multivariable analysis helps to reduce variable into a smaller set by finding latent relations between them. It helps to makes the interpretation easy and computation simpler for complex systems. The analysis is based on patient expectations from the hospital administration and health providers while undergoing treatments.
FundingThis work is not funded by any organization.
Conflicts of interestThe authors confirm that this paper has no conflicts of interest.