
Physicians’ health is a key element for quality healthcare. Medical professionals have difficulty accepting their role as patients and it might be different among sexes. The aim was to describe behaviours and attitudes of doctors towards their own illness.
Materials and methodsAn online survey was launched through the General Council of Medical Associations webpage for all Spanish registered doctors. A bivariate analysis by sex was performed for all the questionnaire variables using parametric and non-parametric tests. The significance level was p<0.05 (95% confidence interval).
ResultsA total of 4,308 registered doctors (1,858 men and 2,450 women) answered. Women were younger, single, and worked mainly in non-surgical specialities in the public sector. Men were older, married, and worked more frequently in public-private practice. Women had less chronic conditions, except for anxiety disorders (11.52% vs 15.18%). Both sexes, especially women, primarily self-treated (94.29% vs 95.02%), went to work while ill (88.16% vs 90.29%), visited their GP (56% vs 70%), and half of them underwent annual occupational health checks (40% vs 48%). Women self-prescribed more analgesics (93.43% vs 95.63%), more presenteeism (88% vs 90%) and felt more insecure when treating sick fellows (9.96% vs 20.12%) and requested training for it. More women agreed to make deontological recommendations about doctors’ health (91.55% vs 96.16%) and considered revalidation may contribute to improve doctors’ health (65.29% vs 66.16%).
ConclusionsMale and female doctors show illness-health behaviours and attitudes at work to improve. There are differences among male and female doctors. Regarding, medical feminization, ethical recommendations may be of benefit regarding doctors’ health-illness issues and considering gender perspective.
La salud de los médicos es un elemento clave de la calidad asistencial. Sin embargo, tienen dificultad para aceptar su rol de paciente y esta puede ser diferente entre mujeres y hombres. El objetivo fue describir comportamientos y actitudes de los médicos hacia su propia enfermedad por sexo.
Material y métodosDiseño y despliegue de una encuesta en línea en la web del Consejo General de Colegios de Médicos para médicos colegiados españoles. Se realizó análisis bivariante por sexo para todas las variables mediante pruebas paramétricas y no paramétricas. El nivel de significación se fijó en p<0,05.
ResultadosRespondieron 4.308 médicos colegiados (1.858 hombres y 2.450 mujeres). Las mujeres eran más jóvenes y trabajaban con más frecuencia en especialidades médicas del sector público. Los hombres eran mayores, casados y trabajaban con más frecuencia combinando la atención pública-privada. Las mujeres presentaban menos enfermedades crónicas, salvo trastorno de ansiedad (11,52 vs. 15,18%). Ambos sexos, especialmente las mujeres, se autotraban (94,29 vs. 95,02%), acudieron más al trabajo mientras estaban enfermas (88,16 vs. 90,29%), visitaron más a su médico de familia (56 vs. 70%) y la mitad acudieron a controles de salud laboral (40 vs. 48%). Las mujeres se autoprescribieron más analgésicos (93,43 vs. 95,63%), tuvieron más presentismo (88 vs. 90%), se sintieron más inseguras al tratar a sus compañeros enfermos (9,96 vs. 20,12%) y solicitaron formación para ello. Ellas están más de acuerdo en hacer recomendaciones deontológicas sobre la salud de los médicos (91,55 vs. 96,16%) y consideran que la revalidación puede contribuir a mejorar su salud (65,29 vs. 66,16%).
ConclusionesLos médicos muestran comportamientos mejorables ante su proceso de enfermar. Existen diferencias entre varones y mujeres. Considerando la progresiva feminización de la sanidad, se deberían valorar recomendaciones éticas en relación con los problemas de salud-enfermedad de los médicos en función de la perspectiva de género.
The importance of the health of the medical workforce has been increasingly recognised1 as studies show poor health can compromise performance and adversely affect standards of care.2 This topic has become even more relevant during COVID-19 pandemic3 specially because health workers have been at a higher risk of acquiring the disease.4 On a large scale, the pandemic is exposing medical professionals to a known role conflict situation, being patients when they have only been prepared to care for.5 To become the patient when you are trained to be the doctor is not a learned experience.6 The peculiarity of the doctors’ process of becoming ill is influenced by their knowledge, which allows them to primarily self-manage their illness,6 seeking informal help or a lack of adequate follow-up for recovery.7 Furthermore, doctors who treat sick colleagues recognise difficulties in reconciling the diagnosis and treatment made by sick doctors and what they could do as professionals.7
Regarding the doctors’ health, medical associations investigate on how to improve the care of medical professionals. One objective is transferring initiatives such as the World Medical Associations’ initiative on doctors’ health into their codes of medical ethics8 or encouraging revalidation.9
Currently, in almost all medical fields and specialties, most medical professionals are women.10 The feminisation of the medical profession is a growing reality. Some studies have shown differences in the behaviours exhibited by women and men in terms of accepting responsibilities, developing professionally and reconciling work with their personal life.11,12 These differences may have an impact in coping with their own illness. To our knowledge, there are few national studies comparing gender differences in the perception of falling ill among physicians in Europe.13–17 This study aimed to describe female and male doctors’ behaviours and attitudes towards their process of falling ill among Spanish registered doctors.
Material and methodsFor the design of the survey, a literature review was carried out using PubMed and Google Scholar in relation to the sick doctor. Subsequently, semi-structured interviews were conducted with residents, practising and retired doctors of both sexes, on their experience of illness, treatment received, impact on their work, reinsertion into the labour market or academia, learning, the role of professional associations and proposals for improvement with questions adapted to the professional's stage of life (resident, active, retired). In addition, focus groups were held with professionals from occupational medicine services, tutors of doctors in training, representatives of medical associations and doctors of sick doctors to gather other relevant aspects of the process of falling ill. A debriefing with experts was carried out with a first questionnaire and finally a psychometric validation was performed. The questionnaire construct validity was determined using exploratory and confirmatory factor analysis. We obtained a five-factor model that had a satisfactory model fit and explained 78.08% of the model variance.18
An online self-report questionnaire was designed to obtain information regarding doctors’ behaviours and attitudes toward their own process of falling ill. The questionnaire contained 56 items grouped into the following sections: (1) socio-demographic aspects, speciality, employment status, public/private/combined practice, and professional satisfaction; (2) health-related aspects (chronic illness, flu vaccination, smoking, alcohol use, and impact of work on health); (3) items related to falling ill: self-diagnosis and self-treatment; (4) impact of the illness on work: sick leave and presenteeism; (5) items pertaining to the doctors of the sick doctors, confidentiality, and ethical considerations with respect to periodic revalidation; and (6) a final open item to allow for doctors to propose ways to improve the provision of care to sick doctors.
The questions were rated by binary answers (Yes or No) or Likert-type scale. There were only 5 open questions. The questionnaire was approved by the Regional Ethics in Research Committee of Aragon (Spain), Research Project number: PI16/0236 (full questionnaire as supplementary material).
The Spanish health care system is mainly publicly provided, both hospitals and primary care. Doctors work mainly as salaried employees. To practice, Spanish doctors must register with the medical association of their province. In Spain, there are 270,000 registered doctors.19 We calculated a sample with a confidence level (1−α): 99%; precision 3%; p-ratio=0.5 which maximised the sample size, with an expected proportion of losses of 50%. The sample size needed was of 3662 professionals. The questionnaire was available on The Spanish Medical Colleges Organization website (http://www.cgcom.es/) from June 2017 to June 2018. Each of the 51 provincial medical colleges in Spain sent a message to their registered doctors inviting them to fill in the survey. Participants provided informed consent to participate when sending the questionnaire answers. We made an informative video to introduce the research project and 3 reminders were issued to increase the response rate. A convenience sampling, those who happened to answers, was used in each province to guarantee the anonymity of the questionnaire.
A descriptive analysis of socio-demographic variables was made, presenting qualitative variables in percentage and continuous variables described using median and inter-quartile interval. A bivariate analysis by sex was performed for all the questionnaire variables using Pearson Chi Square test and Mann–Whitney–Wilcoxon test. The significance level was set at p<0.05 (95% confidence interval). All analysis were performed using statistical software (IBM SPSS for Windows, v.22.0). Participants who did not provide responses to specific questions were excluded from the subsequent analysis of the variable of interest.
In “Results” section, the data comparison presentation is made introducing male percentage followed by female percentage in each item, to make it easier for the reader to understand the results.
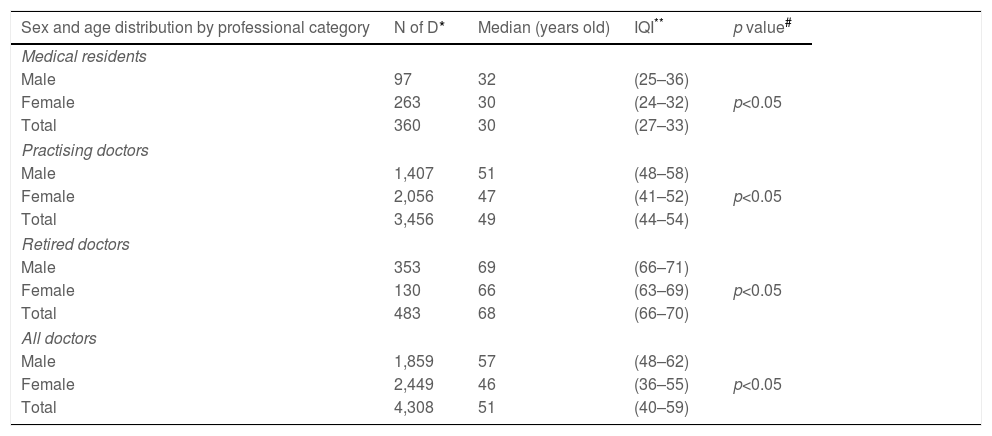
ResultsA total of 4,308 doctors answered the survey. Of these, 1,859 were men and 2,449 were women (43.15% and 56.84%). The median age for men was 57 years, while for women was 46 years. The median number of working years for men were 30 years and for women 19 years. Women and men worked a median of 40h per week. All differences found in these comparisons were statistically significant. There were no significant differences noted in relation to the number of weeks of sick leave taken, excluding maternity leave (Table 1).
Distribution of quantitative items regarding sex, age, professional category and work.
| Sex and age distribution by professional category | N of D* | Median (years old) | IQI** | p value# |
|---|---|---|---|---|
| Medical residents | ||||
| Male | 97 | 32 | (25–36) | p<0.05 |
| Female | 263 | 30 | (24–32) | |
| Total | 360 | 30 | (27–33) | |
| Practising doctors | ||||
| Male | 1,407 | 51 | (48–58) | p<0.05 |
| Female | 2,056 | 47 | (41–52) | |
| Total | 3,456 | 49 | (44–54) | |
| Retired doctors | ||||
| Male | 353 | 69 | (66–71) | p<0.05 |
| Female | 130 | 66 | (63–69) | |
| Total | 483 | 68 | (66–70) | |
| All doctors | ||||
| Male | 1,859 | 57 | (48–62) | p<0.05 |
| Female | 2,449 | 46 | (36–55) | |
| Total | 4,308 | 51 | (40–59) | |
| Working professional years | N of D* | Median(years) | IQI** | p value |
|---|---|---|---|---|
| Medical residents | ||||
| Male | 95 | 6 | (2–10) | p<0.05 |
| Female | 255 | 4 | (2.5–6.5) | |
| Total | 350 | 4 | (1–7) | |
| Practising doctors | ||||
| Male | 1,364 | 26 | (21–31) | p<0.05 |
| Female | 2,007 | 20 | (16.5–24.5) | |
| Total | 3,371 | 23 | (18–28) | |
| Retired doctors | ||||
| Male | 336 | 40 | (37.5–42.5) | p<0.05 |
| Female | 128 | 38 | (35–41) | |
| Total | 464 | 40 | (37–43) | |
| All doctors | ||||
| Male | 1,795 | 30 | (20–37) | p<0.05 |
| Female | 2,390 | 19 | (10–27) | |
| Total | 4,185 | 24 | (13–33) | |
| Hours worked during the last working week | N of D* | Median(h/week) | IQI** | p value |
|---|---|---|---|---|
| Medical residents | ||||
| Male | 90 | 56 | (50–62) | p>0.05 |
| Female | 360 | 55 | (44–64) | |
| Total | 355 | 55 | (46–64) | |
| Practising doctors | ||||
| Male | 1,344 | 45 | (38–52) | p<0.05 |
| Female | 1,946 | 43 | (35–51) | |
| Total | 3,290 | 44 | (36–50) | |
| Retired doctors | ||||
| Male | 350 | 9 | (2–15) | p>0.05 |
| Female | 130 | 4 | (0–10) | |
| Total | 480 | 8 | (1–15) | |
| All doctors | ||||
| Male | 1,789 | 39 | (29–49) | p<0.05 |
| Female | 2,336 | 42 | (32–52) | |
| Total | 4,125 | 40 | (30–50) | |
| Indicate approximately how many weeks you have missed work due to health problems (with or without sick leave) throughout your professional life | N of D* | Median(weeks) | IQI** | p value |
|---|---|---|---|---|
| Medical residents | ||||
| Male | 41 | 15 | (0–36) | p>0.05 |
| Female | 87 | 8 | (1–15) | |
| Total | 128 | 10 | (0–24) | |
| Practising doctors | ||||
| Male | 1,111 | 14 | (0–28) | p<0.05 |
| Female | 1,585 | 17 | (0–34) | |
| Total | 2,696 | 16 | (1–31) | |
| Retired doctors | ||||
| Male | 310 | 21 | (7–36) | p<0.05 |
| Female | 122 | 25 | (9–41) | |
| Total | 432 | 22 | (5–39) | |
| All doctors | ||||
| Male | 1,462 | 15 | 28.65 | p>0.05 |
| Female | 1,794 | 17 | 34.85 | |
| Total | 3,256 | 17 | 32.222 | |
In bold: non statistical difference.
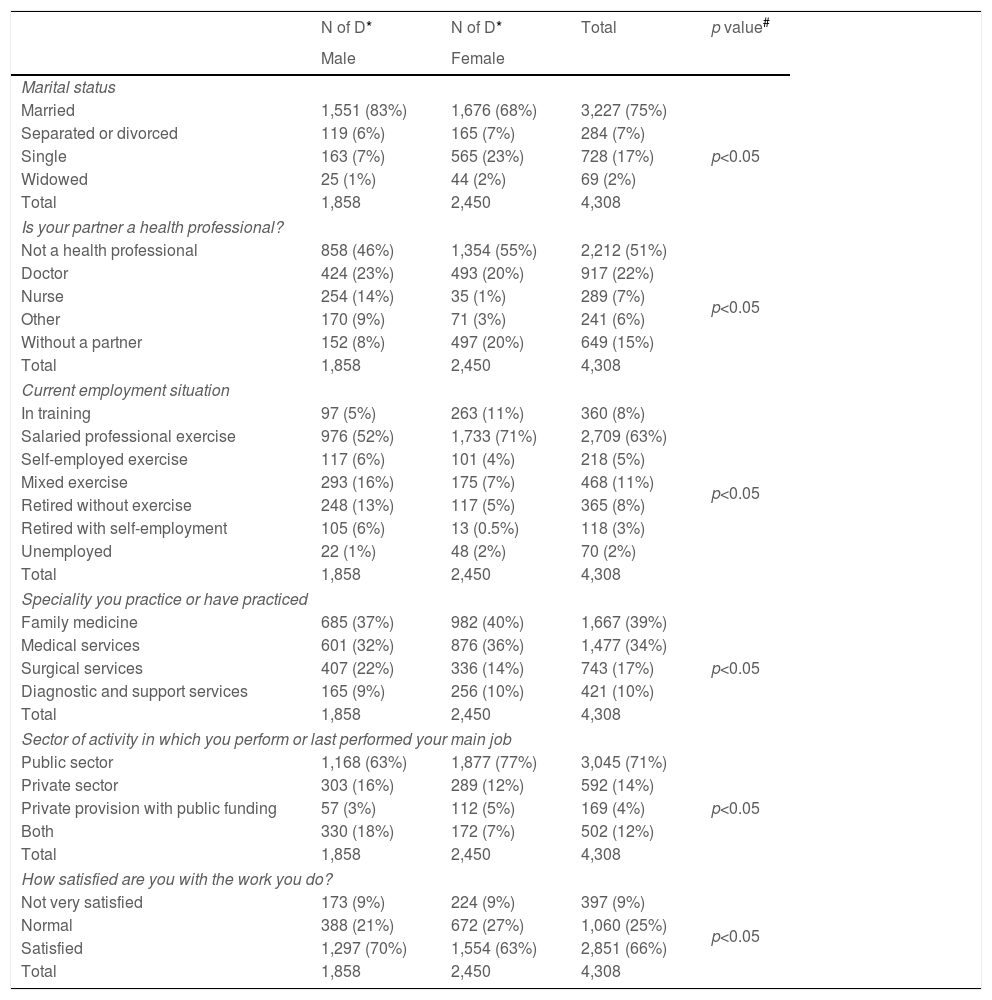
Table 2 describes the participants’ socio-demographic information. More women declared not to have a partner (7% vs 23%). Contrastingly, more men were married (83% vs 68%) and, mainly with a health professional (46% vs 24%). Many doctors practiced in the public sector (71%). Male physicians were involved in both private and public practice (dual practice) more frequently than female physicians (16% vs 7%, p<0.05). A greater proportion of women worked within medical specialities including family medicine (69% vs 76%, p<0.05); however, there were more men in surgical specialties (22% vs 14%). In general, doctors were satisfied with their work (70% vs 63%, p<0.05). Nevertheless, men were more satisfied than women.
Sex distribution regarding socio-demographic variables.
| N of D* | N of D* | Total | p value# | |
|---|---|---|---|---|
| Male | Female | |||
| Marital status | ||||
| Married | 1,551 (83%) | 1,676 (68%) | 3,227 (75%) | p<0.05 |
| Separated or divorced | 119 (6%) | 165 (7%) | 284 (7%) | |
| Single | 163 (7%) | 565 (23%) | 728 (17%) | |
| Widowed | 25 (1%) | 44 (2%) | 69 (2%) | |
| Total | 1,858 | 2,450 | 4,308 | |
| Is your partner a health professional? | ||||
| Not a health professional | 858 (46%) | 1,354 (55%) | 2,212 (51%) | p<0.05 |
| Doctor | 424 (23%) | 493 (20%) | 917 (22%) | |
| Nurse | 254 (14%) | 35 (1%) | 289 (7%) | |
| Other | 170 (9%) | 71 (3%) | 241 (6%) | |
| Without a partner | 152 (8%) | 497 (20%) | 649 (15%) | |
| Total | 1,858 | 2,450 | 4,308 | |
| Current employment situation | ||||
| In training | 97 (5%) | 263 (11%) | 360 (8%) | p<0.05 |
| Salaried professional exercise | 976 (52%) | 1,733 (71%) | 2,709 (63%) | |
| Self-employed exercise | 117 (6%) | 101 (4%) | 218 (5%) | |
| Mixed exercise | 293 (16%) | 175 (7%) | 468 (11%) | |
| Retired without exercise | 248 (13%) | 117 (5%) | 365 (8%) | |
| Retired with self-employment | 105 (6%) | 13 (0.5%) | 118 (3%) | |
| Unemployed | 22 (1%) | 48 (2%) | 70 (2%) | |
| Total | 1,858 | 2,450 | 4,308 | |
| Speciality you practice or have practiced | ||||
| Family medicine | 685 (37%) | 982 (40%) | 1,667 (39%) | p<0.05 |
| Medical services | 601 (32%) | 876 (36%) | 1,477 (34%) | |
| Surgical services | 407 (22%) | 336 (14%) | 743 (17%) | |
| Diagnostic and support services | 165 (9%) | 256 (10%) | 421 (10%) | |
| Total | 1,858 | 2,450 | 4,308 | |
| Sector of activity in which you perform or last performed your main job | ||||
| Public sector | 1,168 (63%) | 1,877 (77%) | 3,045 (71%) | p<0.05 |
| Private sector | 303 (16%) | 289 (12%) | 592 (14%) | |
| Private provision with public funding | 57 (3%) | 112 (5%) | 169 (4%) | |
| Both | 330 (18%) | 172 (7%) | 502 (12%) | |
| Total | 1,858 | 2,450 | 4,308 | |
| How satisfied are you with the work you do? | ||||
| Not very satisfied | 173 (9%) | 224 (9%) | 397 (9%) | p<0.05 |
| Normal | 388 (21%) | 672 (27%) | 1,060 (25%) | |
| Satisfied | 1,297 (70%) | 1,554 (63%) | 2,851 (66%) | |
| Total | 1,858 | 2,450 | 4,308 | |
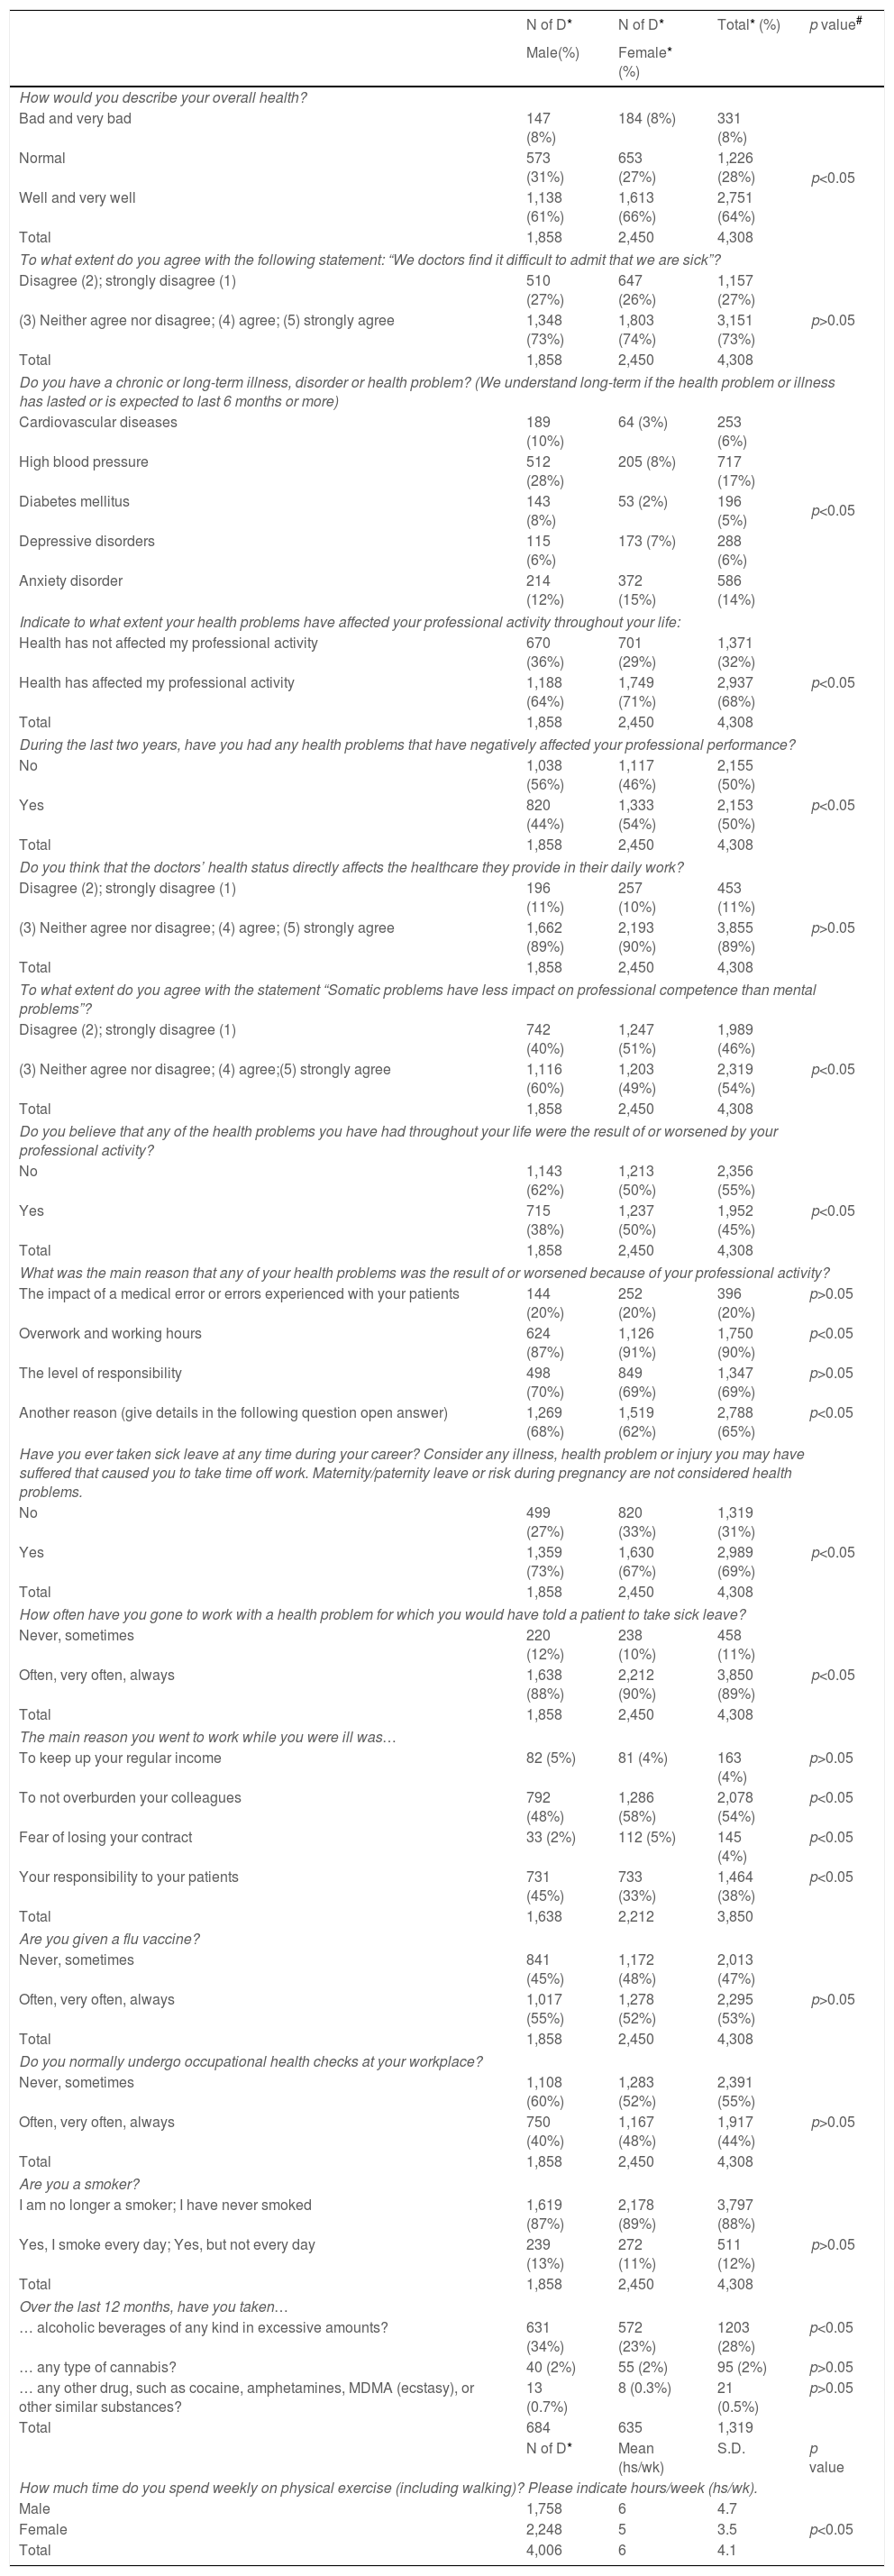
Regarding the health status and its impact on work (Table 3), women reported better health status than men (61% vs 66%, p<0.05). Both groups felt that they would experience difficulties in recognising when they were ill (73% vs 74%, p>0.05). A greater proportion of men experienced chronic health problems; however, women reported a higher incidence of anxiety (12% vs 15%, p<0.05). Women recognised that their health problems had affected their professional activities in the last 2 years more often than their male counterparts (64% vs 71%, p<0.05), even in a negative way (44% vs 54%, p<0.05). However, both sexes agreed that their health status directly affected the healthcare they provided daily (89% vs 89%, p>0.05). Compared to women, men felt that somatic problems had less impact on their work than mental problems (60% vs 49%, p<0.05). A greater proportion of women stated that some of their health problems had been aggravated by their work (38% vs 50%, p<0.05) and that the main reason for this was ‘overworking and working hours’ (87% vs 91%, p<0.05). Women reported more presenteeism, i.e. attending work when they should have taken a sick leave (88% vs 90%, p<0.05). The main reason for female doctors was the desire to not overburden their colleagues (48% vs 58%, p<0.05). More than half of the doctors received a flu vaccine, with no differences noted (55% vs 52%, p>0.05). Most doctors were not smokers and declared that they had never taken cannabis or other drugs, with no differences noted between sexes. Regarding alcohol intake, a significantly higher proportion of men stated excessive alcohol consumption than women (34% vs 23%, p<0.05). Women exercised slightly less frequently than men (6±5h/week vs 5±4h/week, p<0.05).
Distribution of health status of doctors and work impact variables by sex.
| N of D* | N of D* | Total* (%) | p value# | |
|---|---|---|---|---|
| Male(%) | Female* (%) | |||
| How would you describe your overall health? | ||||
| Bad and very bad | 147 (8%) | 184 (8%) | 331 (8%) | p<0.05 |
| Normal | 573 (31%) | 653 (27%) | 1,226 (28%) | |
| Well and very well | 1,138 (61%) | 1,613 (66%) | 2,751 (64%) | |
| Total | 1,858 | 2,450 | 4,308 | |
| To what extent do you agree with the following statement: “We doctors find it difficult to admit that we are sick”? | ||||
| Disagree (2); strongly disagree (1) | 510 (27%) | 647 (26%) | 1,157 (27%) | p>0.05 |
| (3) Neither agree nor disagree; (4) agree; (5) strongly agree | 1,348 (73%) | 1,803 (74%) | 3,151 (73%) | |
| Total | 1,858 | 2,450 | 4,308 | |
| Do you have a chronic or long-term illness, disorder or health problem? (We understand long-term if the health problem or illness has lasted or is expected to last 6 months or more) | ||||
| Cardiovascular diseases | 189 (10%) | 64 (3%) | 253 (6%) | p<0.05 |
| High blood pressure | 512 (28%) | 205 (8%) | 717 (17%) | |
| Diabetes mellitus | 143 (8%) | 53 (2%) | 196 (5%) | |
| Depressive disorders | 115 (6%) | 173 (7%) | 288 (6%) | |
| Anxiety disorder | 214 (12%) | 372 (15%) | 586 (14%) | |
| Indicate to what extent your health problems have affected your professional activity throughout your life: | ||||
| Health has not affected my professional activity | 670 (36%) | 701 (29%) | 1,371 (32%) | p<0.05 |
| Health has affected my professional activity | 1,188 (64%) | 1,749 (71%) | 2,937 (68%) | |
| Total | 1,858 | 2,450 | 4,308 | |
| During the last two years, have you had any health problems that have negatively affected your professional performance? | ||||
| No | 1,038 (56%) | 1,117 (46%) | 2,155 (50%) | p<0.05 |
| Yes | 820 (44%) | 1,333 (54%) | 2,153 (50%) | |
| Total | 1,858 | 2,450 | 4,308 | |
| Do you think that the doctors’ health status directly affects the healthcare they provide in their daily work? | ||||
| Disagree (2); strongly disagree (1) | 196 (11%) | 257 (10%) | 453 (11%) | p>0.05 |
| (3) Neither agree nor disagree; (4) agree; (5) strongly agree | 1,662 (89%) | 2,193 (90%) | 3,855 (89%) | |
| Total | 1,858 | 2,450 | 4,308 | |
| To what extent do you agree with the statement “Somatic problems have less impact on professional competence than mental problems”? | ||||
| Disagree (2); strongly disagree (1) | 742 (40%) | 1,247 (51%) | 1,989 (46%) | p<0.05 |
| (3) Neither agree nor disagree; (4) agree;(5) strongly agree | 1,116 (60%) | 1,203 (49%) | 2,319 (54%) | |
| Total | 1,858 | 2,450 | 4,308 | |
| Do you believe that any of the health problems you have had throughout your life were the result of or worsened by your professional activity? | ||||
| No | 1,143 (62%) | 1,213 (50%) | 2,356 (55%) | p<0.05 |
| Yes | 715 (38%) | 1,237 (50%) | 1,952 (45%) | |
| Total | 1,858 | 2,450 | 4,308 | |
| What was the main reason that any of your health problems was the result of or worsened because of your professional activity? | ||||
| The impact of a medical error or errors experienced with your patients | 144 (20%) | 252 (20%) | 396 (20%) | p>0.05 |
| Overwork and working hours | 624 (87%) | 1,126 (91%) | 1,750 (90%) | p<0.05 |
| The level of responsibility | 498 (70%) | 849 (69%) | 1,347 (69%) | p>0.05 |
| Another reason (give details in the following question open answer) | 1,269 (68%) | 1,519 (62%) | 2,788 (65%) | p<0.05 |
| Have you ever taken sick leave at any time during your career? Consider any illness, health problem or injury you may have suffered that caused you to take time off work. Maternity/paternity leave or risk during pregnancy are not considered health problems. | ||||
| No | 499 (27%) | 820 (33%) | 1,319 (31%) | p<0.05 |
| Yes | 1,359 (73%) | 1,630 (67%) | 2,989 (69%) | |
| Total | 1,858 | 2,450 | 4,308 | |
| How often have you gone to work with a health problem for which you would have told a patient to take sick leave? | ||||
| Never, sometimes | 220 (12%) | 238 (10%) | 458 (11%) | p<0.05 |
| Often, very often, always | 1,638 (88%) | 2,212 (90%) | 3,850 (89%) | |
| Total | 1,858 | 2,450 | 4,308 | |
| The main reason you went to work while you were ill was… | ||||
| To keep up your regular income | 82 (5%) | 81 (4%) | 163 (4%) | p>0.05 |
| To not overburden your colleagues | 792 (48%) | 1,286 (58%) | 2,078 (54%) | p<0.05 |
| Fear of losing your contract | 33 (2%) | 112 (5%) | 145 (4%) | p<0.05 |
| Your responsibility to your patients | 731 (45%) | 733 (33%) | 1,464 (38%) | p<0.05 |
| Total | 1,638 | 2,212 | 3,850 | |
| Are you given a flu vaccine? | ||||
| Never, sometimes | 841 (45%) | 1,172 (48%) | 2,013 (47%) | p>0.05 |
| Often, very often, always | 1,017 (55%) | 1,278 (52%) | 2,295 (53%) | |
| Total | 1,858 | 2,450 | 4,308 | |
| Do you normally undergo occupational health checks at your workplace? | ||||
| Never, sometimes | 1,108 (60%) | 1,283 (52%) | 2,391 (55%) | p>0.05 |
| Often, very often, always | 750 (40%) | 1,167 (48%) | 1,917 (44%) | |
| Total | 1,858 | 2,450 | 4,308 | |
| Are you a smoker? | ||||
| I am no longer a smoker; I have never smoked | 1,619 (87%) | 2,178 (89%) | 3,797 (88%) | p>0.05 |
| Yes, I smoke every day; Yes, but not every day | 239 (13%) | 272 (11%) | 511 (12%) | |
| Total | 1,858 | 2,450 | 4,308 | |
| Over the last 12 months, have you taken… | ||||
| … alcoholic beverages of any kind in excessive amounts? | 631 (34%) | 572 (23%) | 1203 (28%) | p<0.05 |
| … any type of cannabis? | 40 (2%) | 55 (2%) | 95 (2%) | p>0.05 |
| … any other drug, such as cocaine, amphetamines, MDMA (ecstasy), or other similar substances? | 13 (0.7%) | 8 (0.3%) | 21 (0.5%) | p>0.05 |
| Total | 684 | 635 | 1,319 | |
| N of D* | Mean (hs/wk) | S.D. | p value | |
| How much time do you spend weekly on physical exercise (including walking)? Please indicate hours/week (hs/wk). | ||||
| Male | 1,758 | 6 | 4.7 | |
| Female | 2,248 | 5 | 3.5 | p<0.05 |
| Total | 4,006 | 6 | 4.1 | |
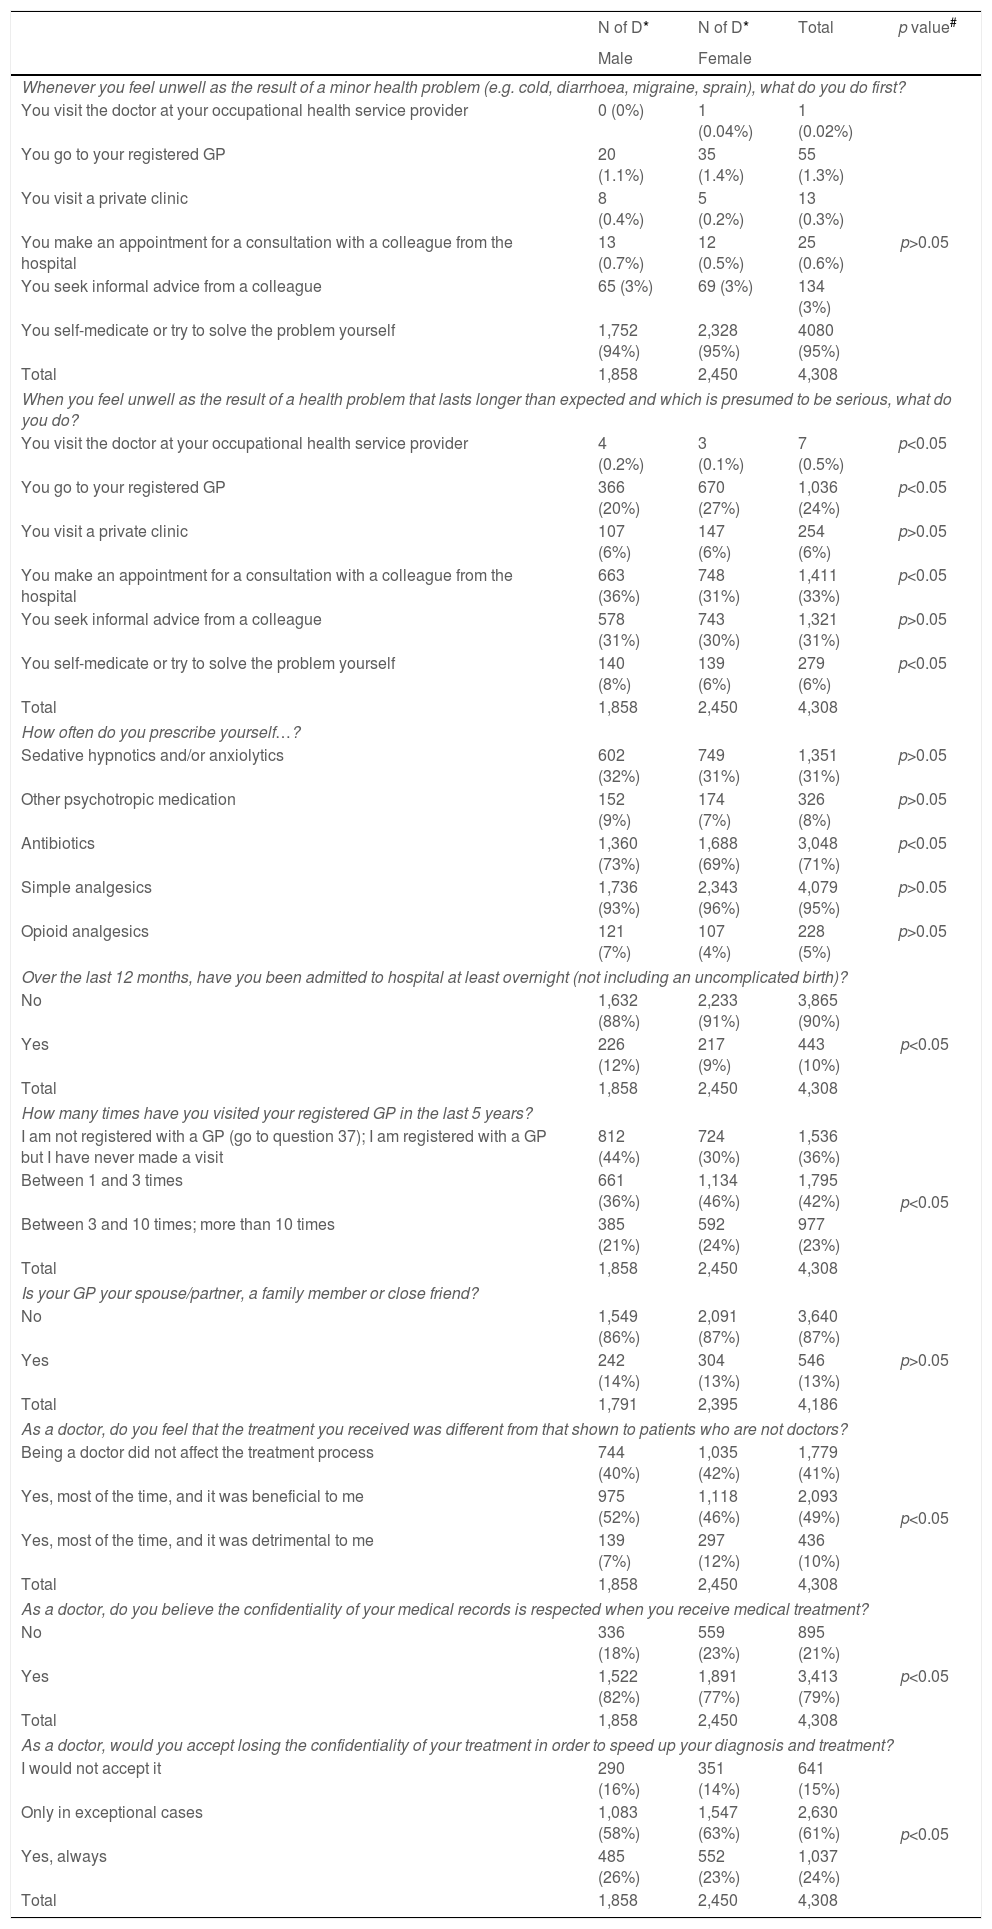
When asked about self-management when ill (Table 4), doctors stated that they preferred to self-medicate and to try to solve the problem themselves (94% vs 95%, p>0.05) as a first option when dealing with a minor problem. However, if they felt that the illness was progressing, men were more inclined towards requesting a consultation with a colleague at the hospital (36% vs 31%, p<0.05), while women were more inclined towards seeking consultations from their general practitioners (GP) (20% vs 27%, p<0.05). With regards to doctors self-prescribed medications, significant differences were noted between both sexes regarding the use of antibiotics, simple analgesics, and opioid analgesics (73% vs 69%, 93% vs 96%, 7% vs 4%, respectively; p<0.05 for all). A greater number of male doctors had at least one overnight admission to hospital (excluded admissions for uncomplicated labour, 12% vs 9%, p<0.05). Women tended to be registered with a GP and visited their GPs more often than men (56% vs 70%, p<0.05). Half of the doctors felt that being a doctor was beneficial for their treatment pathway (52% vs 46%, p<0.05) and that confidentiality was respected (82% vs 77%, p<0.05). A greater proportion of female doctors would only accept losing confidentiality in exceptional circumstances (58% vs 63%, p<0.05).
Distribution of self-management and seeking for help items by sex.
| N of D* | N of D* | Total | p value# | |
|---|---|---|---|---|
| Male | Female | |||
| Whenever you feel unwell as the result of a minor health problem (e.g. cold, diarrhoea, migraine, sprain), what do you do first? | ||||
| You visit the doctor at your occupational health service provider | 0 (0%) | 1 (0.04%) | 1 (0.02%) | p>0.05 |
| You go to your registered GP | 20 (1.1%) | 35 (1.4%) | 55 (1.3%) | |
| You visit a private clinic | 8 (0.4%) | 5 (0.2%) | 13 (0.3%) | |
| You make an appointment for a consultation with a colleague from the hospital | 13 (0.7%) | 12 (0.5%) | 25 (0.6%) | |
| You seek informal advice from a colleague | 65 (3%) | 69 (3%) | 134 (3%) | |
| You self-medicate or try to solve the problem yourself | 1,752 (94%) | 2,328 (95%) | 4080 (95%) | |
| Total | 1,858 | 2,450 | 4,308 | |
| When you feel unwell as the result of a health problem that lasts longer than expected and which is presumed to be serious, what do you do? | ||||
| You visit the doctor at your occupational health service provider | 4 (0.2%) | 3 (0.1%) | 7 (0.5%) | p<0.05 |
| You go to your registered GP | 366 (20%) | 670 (27%) | 1,036 (24%) | p<0.05 |
| You visit a private clinic | 107 (6%) | 147 (6%) | 254 (6%) | p>0.05 |
| You make an appointment for a consultation with a colleague from the hospital | 663 (36%) | 748 (31%) | 1,411 (33%) | p<0.05 |
| You seek informal advice from a colleague | 578 (31%) | 743 (30%) | 1,321 (31%) | p>0.05 |
| You self-medicate or try to solve the problem yourself | 140 (8%) | 139 (6%) | 279 (6%) | p<0.05 |
| Total | 1,858 | 2,450 | 4,308 | |
| How often do you prescribe yourself…? | ||||
| Sedative hypnotics and/or anxiolytics | 602 (32%) | 749 (31%) | 1,351 (31%) | p>0.05 |
| Other psychotropic medication | 152 (9%) | 174 (7%) | 326 (8%) | p>0.05 |
| Antibiotics | 1,360 (73%) | 1,688 (69%) | 3,048 (71%) | p<0.05 |
| Simple analgesics | 1,736 (93%) | 2,343 (96%) | 4,079 (95%) | p>0.05 |
| Opioid analgesics | 121 (7%) | 107 (4%) | 228 (5%) | p>0.05 |
| Over the last 12 months, have you been admitted to hospital at least overnight (not including an uncomplicated birth)? | ||||
| No | 1,632 (88%) | 2,233 (91%) | 3,865 (90%) | p<0.05 |
| Yes | 226 (12%) | 217 (9%) | 443 (10%) | |
| Total | 1,858 | 2,450 | 4,308 | |
| How many times have you visited your registered GP in the last 5 years? | ||||
| I am not registered with a GP (go to question 37); I am registered with a GP but I have never made a visit | 812 (44%) | 724 (30%) | 1,536 (36%) | p<0.05 |
| Between 1 and 3 times | 661 (36%) | 1,134 (46%) | 1,795 (42%) | |
| Between 3 and 10 times; more than 10 times | 385 (21%) | 592 (24%) | 977 (23%) | |
| Total | 1,858 | 2,450 | 4,308 | |
| Is your GP your spouse/partner, a family member or close friend? | ||||
| No | 1,549 (86%) | 2,091 (87%) | 3,640 (87%) | p>0.05 |
| Yes | 242 (14%) | 304 (13%) | 546 (13%) | |
| Total | 1,791 | 2,395 | 4,186 | |
| As a doctor, do you feel that the treatment you received was different from that shown to patients who are not doctors? | ||||
| Being a doctor did not affect the treatment process | 744 (40%) | 1,035 (42%) | 1,779 (41%) | p<0.05 |
| Yes, most of the time, and it was beneficial to me | 975 (52%) | 1,118 (46%) | 2,093 (49%) | |
| Yes, most of the time, and it was detrimental to me | 139 (7%) | 297 (12%) | 436 (10%) | |
| Total | 1,858 | 2,450 | 4,308 | |
| As a doctor, do you believe the confidentiality of your medical records is respected when you receive medical treatment? | ||||
| No | 336 (18%) | 559 (23%) | 895 (21%) | p<0.05 |
| Yes | 1,522 (82%) | 1,891 (77%) | 3,413 (79%) | |
| Total | 1,858 | 2,450 | 4,308 | |
| As a doctor, would you accept losing the confidentiality of your treatment in order to speed up your diagnosis and treatment? | ||||
| I would not accept it | 290 (16%) | 351 (14%) | 641 (15%) | p<0.05 |
| Only in exceptional cases | 1,083 (58%) | 1,547 (63%) | 2,630 (61%) | |
| Yes, always | 485 (26%) | 552 (23%) | 1,037 (24%) | |
| Total | 1,858 | 2,450 | 4,308 | |
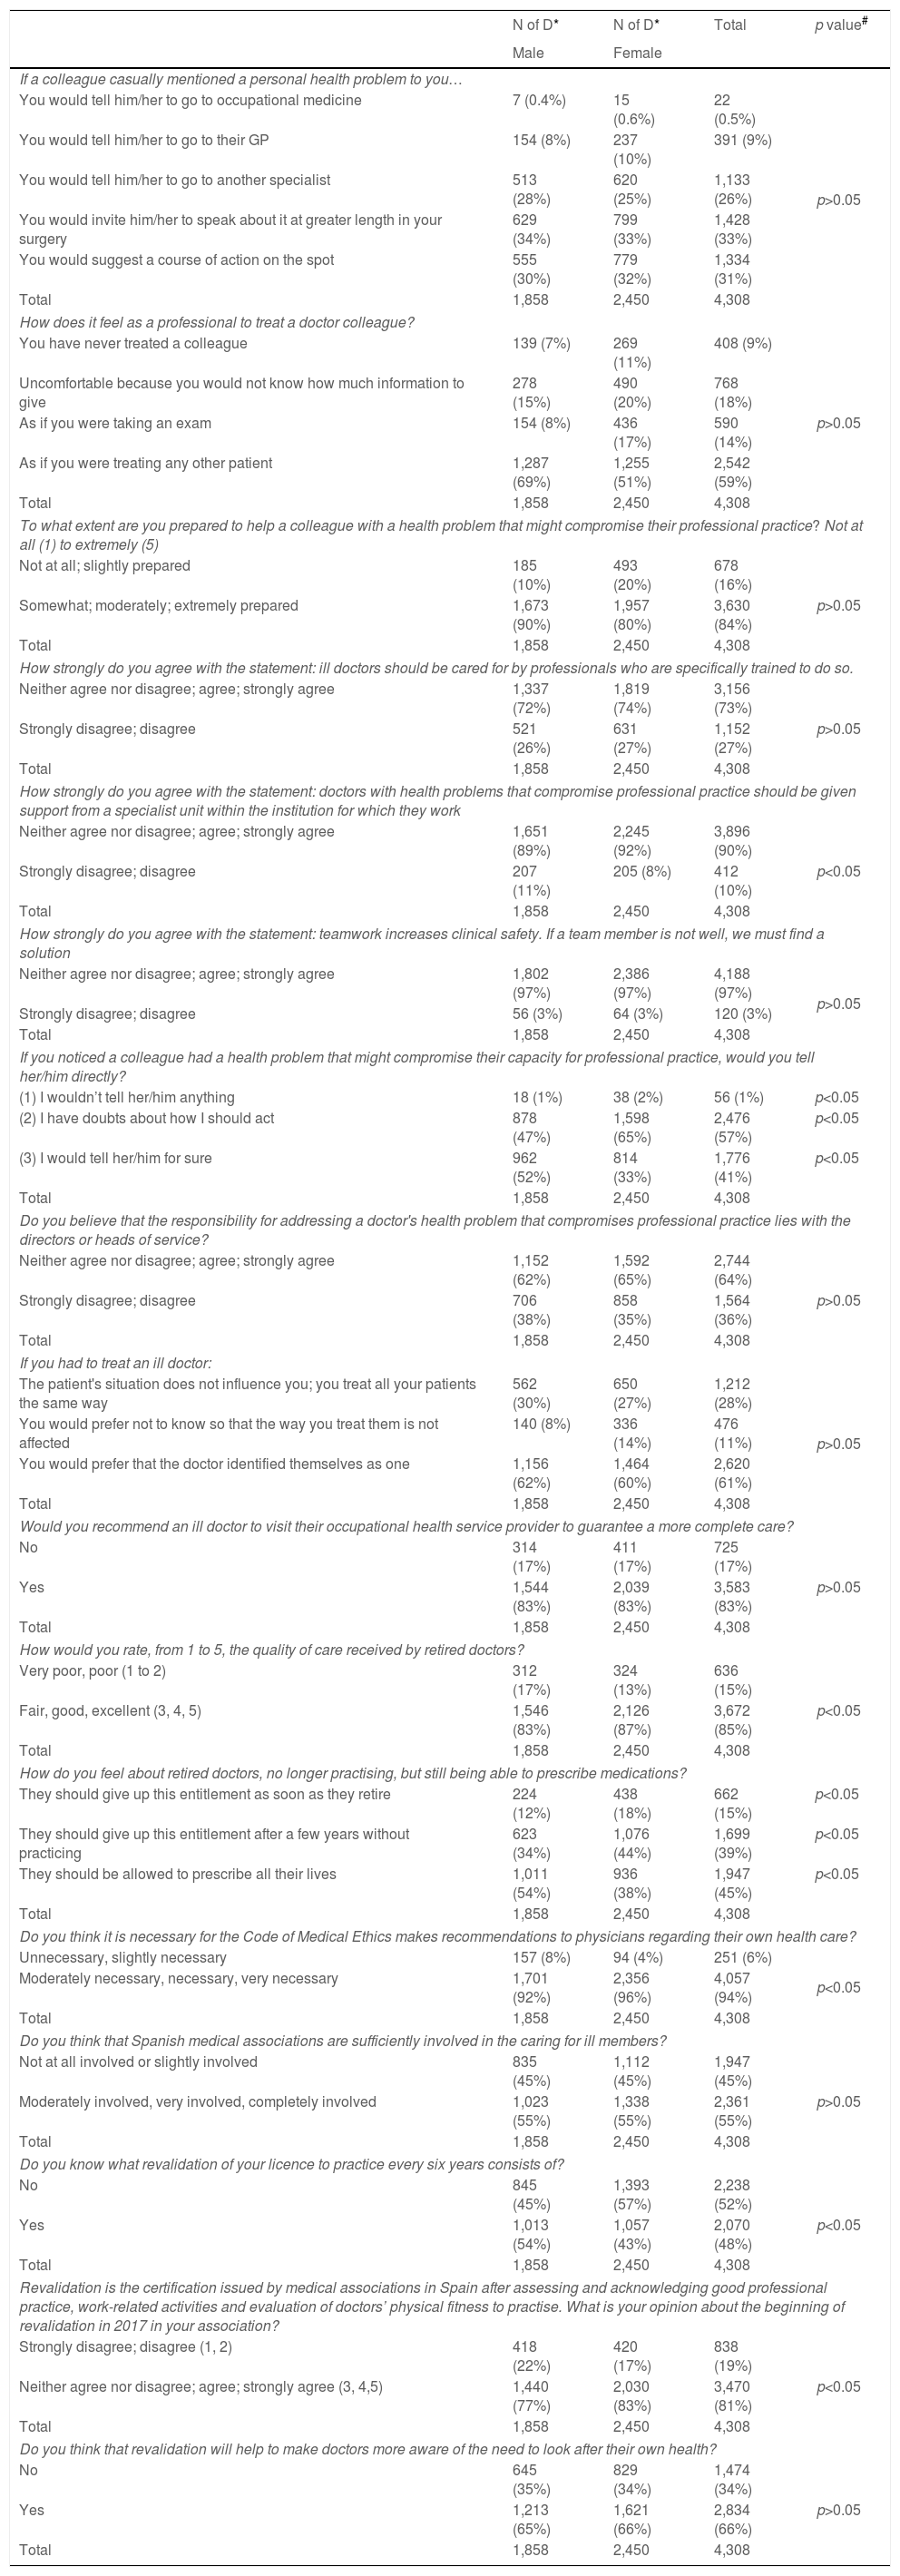
With respect to doctors who treated ill physicians (Table 5), when a colleague casually tell them about a personal health problem, most would invite the sick doctor to talk about it in their surgery (34% vs 33%, p>0.05). Doctors who treated ill doctors stated that they felt as though they were treating any other patient (69% vs 51%, p<0.05). However, a significant percentage of female doctors stated that they felt as though they were taking an exam (8% vs 18%, p<0.05). Therefore, a greater proportion of the women felt unprepared when asked to help a sick physician (10% vs 20%, p<0.05). A high percentage of doctors agreed that sick doctors should be treated by trained specialists (72% vs 74%, p>0.05). Moreover, they agreed that special units within the healthcare organisations should care for sick doctors (72% vs 74%, p>0.05).
Distribution of items about doctors of ill doctors and medical associations by sex.
| N of D* | N of D* | Total | p value# | |
|---|---|---|---|---|
| Male | Female | |||
| If a colleague casually mentioned a personal health problem to you… | ||||
| You would tell him/her to go to occupational medicine | 7 (0.4%) | 15 (0.6%) | 22 (0.5%) | p>0.05 |
| You would tell him/her to go to their GP | 154 (8%) | 237 (10%) | 391 (9%) | |
| You would tell him/her to go to another specialist | 513 (28%) | 620 (25%) | 1,133 (26%) | |
| You would invite him/her to speak about it at greater length in your surgery | 629 (34%) | 799 (33%) | 1,428 (33%) | |
| You would suggest a course of action on the spot | 555 (30%) | 779 (32%) | 1,334 (31%) | |
| Total | 1,858 | 2,450 | 4,308 | |
| How does it feel as a professional to treat a doctor colleague? | ||||
| You have never treated a colleague | 139 (7%) | 269 (11%) | 408 (9%) | p>0.05 |
| Uncomfortable because you would not know how much information to give | 278 (15%) | 490 (20%) | 768 (18%) | |
| As if you were taking an exam | 154 (8%) | 436 (17%) | 590 (14%) | |
| As if you were treating any other patient | 1,287 (69%) | 1,255 (51%) | 2,542 (59%) | |
| Total | 1,858 | 2,450 | 4,308 | |
| To what extent are you prepared to help a colleague with a health problem that might compromise their professional practice? Not at all (1) to extremely (5) | ||||
| Not at all; slightly prepared | 185 (10%) | 493 (20%) | 678 (16%) | p>0.05 |
| Somewhat; moderately; extremely prepared | 1,673 (90%) | 1,957 (80%) | 3,630 (84%) | |
| Total | 1,858 | 2,450 | 4,308 | |
| How strongly do you agree with the statement: ill doctors should be cared for by professionals who are specifically trained to do so. | ||||
| Neither agree nor disagree; agree; strongly agree | 1,337 (72%) | 1,819 (74%) | 3,156 (73%) | p>0.05 |
| Strongly disagree; disagree | 521 (26%) | 631 (27%) | 1,152 (27%) | |
| Total | 1,858 | 2,450 | 4,308 | |
| How strongly do you agree with the statement: doctors with health problems that compromise professional practice should be given support from a specialist unit within the institution for which they work | ||||
| Neither agree nor disagree; agree; strongly agree | 1,651 (89%) | 2,245 (92%) | 3,896 (90%) | p<0.05 |
| Strongly disagree; disagree | 207 (11%) | 205 (8%) | 412 (10%) | |
| Total | 1,858 | 2,450 | 4,308 | |
| How strongly do you agree with the statement: teamwork increases clinical safety. If a team member is not well, we must find a solution | ||||
| Neither agree nor disagree; agree; strongly agree | 1,802 (97%) | 2,386 (97%) | 4,188 (97%) | p>0.05 |
| Strongly disagree; disagree | 56 (3%) | 64 (3%) | 120 (3%) | |
| Total | 1,858 | 2,450 | 4,308 | |
| If you noticed a colleague had a health problem that might compromise their capacity for professional practice, would you tell her/him directly? | ||||
| (1) I wouldn’t tell her/him anything | 18 (1%) | 38 (2%) | 56 (1%) | p<0.05 |
| (2) I have doubts about how I should act | 878 (47%) | 1,598 (65%) | 2,476 (57%) | p<0.05 |
| (3) I would tell her/him for sure | 962 (52%) | 814 (33%) | 1,776 (41%) | p<0.05 |
| Total | 1,858 | 2,450 | 4,308 | |
| Do you believe that the responsibility for addressing a doctor's health problem that compromises professional practice lies with the directors or heads of service? | ||||
| Neither agree nor disagree; agree; strongly agree | 1,152 (62%) | 1,592 (65%) | 2,744 (64%) | p>0.05 |
| Strongly disagree; disagree | 706 (38%) | 858 (35%) | 1,564 (36%) | |
| Total | 1,858 | 2,450 | 4,308 | |
| If you had to treat an ill doctor: | ||||
| The patient's situation does not influence you; you treat all your patients the same way | 562 (30%) | 650 (27%) | 1,212 (28%) | p>0.05 |
| You would prefer not to know so that the way you treat them is not affected | 140 (8%) | 336 (14%) | 476 (11%) | |
| You would prefer that the doctor identified themselves as one | 1,156 (62%) | 1,464 (60%) | 2,620 (61%) | |
| Total | 1,858 | 2,450 | 4,308 | |
| Would you recommend an ill doctor to visit their occupational health service provider to guarantee a more complete care? | ||||
| No | 314 (17%) | 411 (17%) | 725 (17%) | p>0.05 |
| Yes | 1,544 (83%) | 2,039 (83%) | 3,583 (83%) | |
| Total | 1,858 | 2,450 | 4,308 | |
| How would you rate, from 1 to 5, the quality of care received by retired doctors? | ||||
| Very poor, poor (1 to 2) | 312 (17%) | 324 (13%) | 636 (15%) | p<0.05 |
| Fair, good, excellent (3, 4, 5) | 1,546 (83%) | 2,126 (87%) | 3,672 (85%) | |
| Total | 1,858 | 2,450 | 4,308 | |
| How do you feel about retired doctors, no longer practising, but still being able to prescribe medications? | ||||
| They should give up this entitlement as soon as they retire | 224 (12%) | 438 (18%) | 662 (15%) | p<0.05 |
| They should give up this entitlement after a few years without practicing | 623 (34%) | 1,076 (44%) | 1,699 (39%) | p<0.05 |
| They should be allowed to prescribe all their lives | 1,011 (54%) | 936 (38%) | 1,947 (45%) | p<0.05 |
| Total | 1,858 | 2,450 | 4,308 | |
| Do you think it is necessary for the Code of Medical Ethics makes recommendations to physicians regarding their own health care? | ||||
| Unnecessary, slightly necessary | 157 (8%) | 94 (4%) | 251 (6%) | p<0.05 |
| Moderately necessary, necessary, very necessary | 1,701 (92%) | 2,356 (96%) | 4,057 (94%) | |
| Total | 1,858 | 2,450 | 4,308 | |
| Do you think that Spanish medical associations are sufficiently involved in the caring for ill members? | ||||
| Not at all involved or slightly involved | 835 (45%) | 1,112 (45%) | 1,947 (45%) | p>0.05 |
| Moderately involved, very involved, completely involved | 1,023 (55%) | 1,338 (55%) | 2,361 (55%) | |
| Total | 1,858 | 2,450 | 4,308 | |
| Do you know what revalidation of your licence to practice every six years consists of? | ||||
| No | 845 (45%) | 1,393 (57%) | 2,238 (52%) | p<0.05 |
| Yes | 1,013 (54%) | 1,057 (43%) | 2,070 (48%) | |
| Total | 1,858 | 2,450 | 4,308 | |
| Revalidation is the certification issued by medical associations in Spain after assessing and acknowledging good professional practice, work-related activities and evaluation of doctors’ physical fitness to practise. What is your opinion about the beginning of revalidation in 2017 in your association? | ||||
| Strongly disagree; disagree (1, 2) | 418 (22%) | 420 (17%) | 838 (19%) | p<0.05 |
| Neither agree nor disagree; agree; strongly agree (3, 4,5) | 1,440 (77%) | 2,030 (83%) | 3,470 (81%) | |
| Total | 1,858 | 2,450 | 4,308 | |
| Do you think that revalidation will help to make doctors more aware of the need to look after their own health? | ||||
| No | 645 (35%) | 829 (34%) | 1,474 (34%) | p>0.05 |
| Yes | 1,213 (65%) | 1,621 (66%) | 2,834 (66%) | |
| Total | 1,858 | 2,450 | 4,308 | |
The majority of doctors agreed that teamwork was essential for clinical safety and stated that they would try to find a solution if any team member were ill (97% vs 97%, p<0.05). However, when asked about their actions if they noticed a colleague had a health problem that could compromise their capacity to work, female doctors indicated that they had doubts as to how they would act (47% vs 65%, p<0.05). Contrastingly, half of male doctors stated that they would warn a sick colleague (52% vs 33%, p<0.05). Most doctors felt that managers or heads of services should be involved in the management of sick colleagues, particularly women (62% vs 65%, p>0.05).
When treating a sick doctor, more than half of the participants stated that they would prefer that sick doctors introduce themselves as doctors at the point of care (62% vs 60%, p>0.05). Most doctors would consider sending sick doctors to the occupational medicine service to guarantee that they received a better care (83% vs 83%, p<0.05). A greater proportion of female physicians felt that retired doctors should receive a quality care, even if they were not actively practicing as part of a healthcare organisation (83% vs 87%, p<0.05). Male doctors agreed to maintain retired doctors’ ability to prescribe throughout their lives for their own use (54% vs 38%, p<0.05), whereas women preferred to withdraw the ability to prescribe once retired or just a few years after retirement (46% vs 62%, p<0.05). Nearly all doctors agreed to state recommendations regarding doctors’ healthcare in the Spanish Medical Association's Code of Deontology and Medical Ethics, being the proportion of women significantly higher (92% vs 96%, p<0.05). Half of the doctors considered that the Spanish Medical Association was sufficiently involved in caring for its ill members (55% vs 55%, p<0.05). Only half of the doctors were aware of the implementation of periodic membership revalidation (45% vs 57%, p<0.05). However most of them agreed with its introduction (77% vs 83%, p<0.05) and that its implementation may contribute to improving doctors’ health (65% vs 66%, p>0.05).
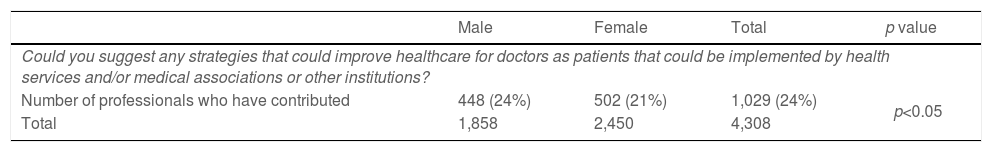
One-fifth of the doctors made contributions in the final open question regarding improvements for doctors’ ill-health issues. Men gave more suggestions than women with a statistically significant difference. The main topics that were identified after content analysis of the answers are summarized in Table 6.
Final open question. Suggestions to improve healthcare for doctors as patients.
| Male | Female | Total | p value | |
|---|---|---|---|---|
| Could you suggest any strategies that could improve healthcare for doctors as patients that could be implemented by health services and/or medical associations or other institutions? | ||||
| Number of professionals who have contributed | 448 (24%) | 502 (21%) | 1,029 (24%) | p<0.05 |
| Total | 1,858 | 2,450 | 4,308 | |
| Summary of the final open question |
| • How to improve the healthcare pathway for doctors? |
| Ill doctors want to speed up the access to the health system through specific consultations for doctors to reduce the time spent on sick leave and aiming to not overburden colleagues. |
| Doctors would prefer not to share waiting rooms with other patients, in order to preserve their privacy. |
| • How to reduce the impact of work on doctors’ health? |
| To facilitate replacements so as not to overburden their colleagues while in sick leaves. |
| To facilitate conciliation and time flexibility to accomplish work and family commitments. |
| To increase consultation time for each patient to reduce stressful working days. |
| To promote job stability and ensure rest day after on-call duty. |
| To promote health check-ups and to reduce occupational risks. |
| To make adaptations regarding age, disability, or health problems. |
| To offer psychological programs to tackle work related stress management. |
| With regard to long sick leaves, they advocated for work adaptation to facilitate returning to work. |
| • Treatment received in the care process |
| Many doctors who have been patients feel that they have not been treated with the empathy, understanding and love as they expected as patients. Nevertheless, they recognized to receive a high technical care instead. |
| Doctors who have treated doctors say that “the invulnerability of the doctor as a person should not be taken for granted” and that in the face of fear of unassumed self-illness, good communication and closeness should be offered to ill colleagues. |
| To make the medical community aware that sick doctors have peculiarities, and that it is needed to adapt the information to their personal situation. |
| To set an identification in medical records of ill doctors to inform doctors who treat them that the patient is a doctor. |
| To introduce in the pre- and post-graduate medical training plans on how to treat the sick doctor. |
| • Doctors of sick doctors |
| To create special units to visit ill doctors to guarantee confidentiality and faster referral to specialists. Occupational Medicine Department should have a crucial role in coordination with Medical Associations. |
| To avoid treating close colleagues so as not to lose objectivity. |
| Retired doctors claim for a special status as they lose the possibility of asking advice from colleagues when they retire and some of them feel “abandoned”. To find out a healthcare pathway for retired doctors through their family physician. |
| A telephone help line for the sick doctor to reduce informal consultations to colleagues which do not guarantee a proper follow-up. |
| • Assessment of professionals |
| To promote occupational health annual check-ups for doctors at their healthcare institutions to assess both the doctor's health and the adaptation to the job in case of need. |
| Many doctors complaint that some medical visits should not be at the same hospital they work, to guarantee confidentiality. |
| To consider a periodical psychological assessment of doctors to ease the early detection of mental problems. |
| The intervention of the Ethics Committee and Deontological Committee, to assess sick doctors at high risk of harming patients. |
| • Medical associations |
| Many colleagues are calling for greater involvement of Medical Associations with doctors regarding personal health support and professional impact perspective. |
The results of CAMAPE survey showed differences between male and female doctors regarding their perception of the process of getting ill, the impact of illness at work, and the role of doctors who treat sick doctors. These results are supported by a large sample of Spanish registered doctors who answer the online questionnaire (4,308 physicians).
Results reflect both the Spanish and global trends in the feminisation of medical profession in recent years.10,19 The age distribution of the survey is similar to that of the Report of the General Council of Medical Colleges about the Demography of the Medical Profession 2017.19 Women were 10 years younger than men (46±12 vs 55±12, p<0.05) similar to national data.19 The fact that men are older than women could influence some of the results observed in the survey. In particular, regarding health status and morbidities as well as the experience of treating ill doctors and the way they manage their disease.
Non-surgical specialties have greater female representation than surgical specialities. It is more common for female physicians to be single. It may be indicative of the choice that female doctors must make between their professional careers and personal life, particularly in early stages.10,20 Men participated in dual practice more frequently than women in Spain.10 Johannessens et al.21 found that having a large family and cohabitating increased the odds ratio of dual practice among men; however, it reduced the odds ratio in women.
An Irish study found that the doctors’ health status was better among men16 while in our study women reported better health, as it is also found in a Finnish study.14 This is congruent with the higher prevalence of comorbidities declared by men (cardiovascular diseases, high blood pressure, and diabetes) than by women. However, studies have shown that depressive and anxiety disorders were more frequent among female doctors.16,22 This observation was congruent with our findings. Therefore, the management of depressive and anxiety issues is essential for the wellbeing of future female doctors. Studies have shown that physicians are aware that their health status is likely to have influenced their professional activity at some point in their lives, as in our results.17
Regarding alcohol intake, male physicians consumed more alcohol than their female counterparts. Men also exercised more than women; however, smoking prevalence did not demonstrate a significant difference. A recent study in Ireland found similar results regarding these lifestyle issues.17
More female doctors recognised that work affected their health (38% vs 50%) and that the main reason for this was work overload as it is stated in other studies.16,23 Nevertheless, both male and female doctors tended to go to work while ill. The main reason for doctors attending work when they were sick was because they did not want to overburden their colleagues. A Swedish study24 concluded that female doctors recognised presenteeism more often than men. The main reasons for this were the desire to not overburden others and the high workload for women, as it is in our study. On the other hand, Swedish male doctors reported reasons related to “ability” and “money”, whereas in our study, male doctors attributed it to their responsibility to their patients. Improving work-related factors with targeted interventions, including a supportive work environment, may increase life satisfaction among doctors and reduce the impact of presenteeism among Spanish doctors, particularly women.
When doctors suffer from presumably minor health problems, they tend to seek their own solutions, usually through self-medication.13,25 A study in Norway found that 90% of the doctors had prescribed their own medicines.13 As in our study (Table 4), they found that antibiotics, painkillers, and hypnotics were the more frequent prescribed medications with only statistical differences among sex for a higher prescription rate of antibiotics among women. Opioid analgesics were prescribed more frequently by male doctors, as in our survey.
When illness process seems abnormal, doctors often seek help from colleagues, both formally and informally.26 Chen et al.27 demonstrated that a small number of doctors considered visiting their family doctor, with the likelihood of doing so increasing with younger physicians. In a German study, only 19% had a GP.15 In our survey, women, who on average were 10 years younger than the men, tended to go to the family doctor more often. However, 88% of men and 91% of women in our study reported that “doctors with a health problem that compromise professional practice should be given support from a specialist unit” as in a Rosvold et al. study.13
Female Spanish doctors felt that it was important that some recommendations regarding the health care of sick physicians were included in the Spanish Code of Medical Ethics, as proposed by international initiatives such as that by Taub et al.28 When considering the ability to prescribe medication, male doctors felt that it should be retained for life after retirement as it happen in other countries.29 Contrastingly, Spanish female doctors felt that this capacity should be given up upon retiring. This cautious attitude among female doctors may reflect a more prudent gender attitude. A recent study shows a greater social prudence in the pandemic by the female population. Female doctors were more likely to perceive COVID-19 as a very serious health problem, to agree with restraining public policy measures, and to comply with them.30
Our study had several limitations that cannot be ignored. First, this was a self-administered survey based on the physicians’ opinions. Second, we only conducted a bivariate analysis according to sex, which revealed significant differences that need to be tested through multivariate analysis to identify factors that may have influenced the different behaviours exhibited by men and women. It remains to analyse whether some health behaviours variables may differ between sexes only for doctors or for other professions with a similar level of studies as well. Finally, our survey did not include questions about parenthood or other care burdens, which could provide key insights into the gender issues among physicians that have been demonstrated in some studies and becomes a necessary line of research among the Spanish medical professionals.10,20 Nevertheless, we would like to highlight the fact that the percentage of doctors who are single men (7%) and single women (23%) compared to married men (83%) and married women (68%), both with significant statistical differences, could reflect the conflict among medical professional development and family commitment among female doctors.
ConclusionsOur survey described differences in behaviors and attitudes of male and female doctors towards the process of falling ill. It finds high rates of self-treatment and presenteeism in both sexes. Women declare a higher prevalence of anxiety disorders and feeling more insecure when treating sick fellows. They requested training and deontological recommendations about doctors’ health. More studies with a gender perspective are needed to address these realities to improving the health of the increasingly feminized medical profession.
FundingThis study was funded by the State Programme of I+D+I 2013-2016 (PI18/00968), Institute of Health Carlos III (ISCIII)-General Subdirection of Research Evaluation and Promotion of the European Regional Development Fund (ERDF) “Another way to make Europe”, and cofinanced by ERDF.
Authors’ contributionsAll the authors are members of the Bioethics Research Group of Aragon (GIBA-IISAragon) that is leading the project “Getting Sick is Human: When the Doctor is the Patient”. This project involves the writing of four doctoral theses related to the stages of the medical practitioner career: medical student, junior doctor, practising doctor and retired doctor. The individual contribution to the manuscript is as follows: conceptualization, RAT, MPAP and MTDM; methodology, MPAP, BMG, CPA; data curation, MPAP; formal analysis, ISS, MPAP, CPA, BMG; writing – original draft preparation, ISS and MPAP; writing – review & editing, MPAP, BMG, AGR; supervision, RAT, MTDM; project administration, RAT and AGR; funding acquisition, RAT and MPAP.
Ethical approvalThis study was approved by the Clinical Research Ethics Committee of Aragon (CEICA) on 5 October 2016. Registration number CI P16/0236.
Conflict of interestsThe authors declare that there is no conflict of interest.
To all Spanish registered doctors who answered the survey, to the Spanish Collegiate Medical Organization, to Galatea Foundation, to Zaragoza University and IIS-Aragón. To Eva Andres who helped us with statistical analysis.