


Despite the booming development of financial technology (fintech) in China, little academic literature has explored the effects of fintech on poverty. This paper explores the effects of fintech on poverty alleviation in the provinces of China. The sample includes data for 31 provinces for the period of 2011 to 2020. To reflect the technological innovation of finance, we first use web crawler technology and word frequency analysis to collect variables, and then construct a fintech index for each province. Due to the heterogeneity in poverty among various provincial regions, we further propose a novel sparse support vector quantile regression to examine the effectiveness of fintech on poverty reduction within individual Chinese provinces. Quantile estimators of the proposed method are used as empirical “location” measures for poverty. The empirical results show that although the development of fintech index is uneven among provincial regions, fintech effectively reduces poverty in every province. Moreover, the positive effects of fintech on poverty alleviation are much stronger in low-income provinces than in high-income provinces. Therefore, policy-makers and practitioners should build more digital financial technology systems, especially in Chinese low-income provinces.
Although China has made great achievements in terms of poverty alleviation since 1978, it still faces great challenges related to achieving the goal of completely eliminating poverty. The poverty alleviation problem in China has attracted attention from a broad range of academics, such as those from the field of sociology (Fu et al., 2021), economics (Liao et al., 2020), and finance (Zameer et al., 2020; Ning et al., 2021). Rapid financial development is one of the main methods that can enable the effective alleviation of poverty in China (Ho & Iyke, 2017; Zhu et al., 2021). Financial innovation, including financial product innovation and financial process innovation, has promoted financial sector development (Qamruzzaman & Wei, 2019).
Financial technology (fintech), as technology-driven financial innovation, has promoted rapid financial development in China (Lee et al., 2021). With a booming fintech sector and large numbers of users, China has been at the forefront of the expansion of digital financial services (Kong & Loubere, 2021). In some areas, fintech has developed much more rapidly in China than it has in the United States, such as that related to payments, wealth management, and online insurance (Chen, 2016). In China, fintech development can be divided into three stages (Cheng & Qu, 2020; Bu et al., 2021). The first stage (2005–2010) was the finance IT stage (Bu et al., 2021). During this stage, IT technology promoted the operational efficiency of financial institutions. The second stage (2011–2015) was that of internet finance (Bu et al., 2021). During this stage, internet technology was developed to facilitate financing, payments, investment, and information intermediary services. The third stage, which started 2015, involves the combination of traditional finance and emerging financial technologies, such as artificial intelligence, blockchain, cloud computing, and big data (Cheng & Qu, 2020).
Despite the recent rapid development of fintech in China, little academic literature has explored the effects of fintech on poverty. Appiah-Otoo and Song (2021) adopted a generalized method of moment (GMM) model to examine the impact of fintech on poverty. They confirmed that fintech complements economic growth and financial development, which directly and indirectly reduces poverty in China. It is important to note that Appiah-Otoo and Song (2021) directly used the financial inclusion index (Guo et al., 2020) to measure the development of fintech in China. This is unreasonable since financial inclusion index (Guo et al., 2020) cannot reflect the technological level of finance. Few studies have given attention to the construction of fintech index that measures the financial technology development in China. Moreover, while Appiah-Otoo and Song (2021) focused on the effect of fintech on poverty reduction in China, they ignored the considerable heterogeneity in poverty among the country's provincial regions (Ren et al., 2017; Gustafsson, 2009).
Hence, the above discussion leads to the following research question: First, how can a fintech index be constructed to reflect the digital financial services and technological innovation in Chinese finance industry? Second, does heterogeneity in poverty exist among the country's provincial regions? If it exists, does fintech play a positive role in poverty alleviation among the Chinese provinces?
In this study, we formulate two research objectives to answer the above questions. Based on disaggregated indices for the usage depth of digital finance and digitization levels (Guo et al., 2020), we first employ web crawler technology and word frequency analysis to collect variables that reflect the technological innovation of the finance sector in China and then employ the geometric mean method (Lyons et al., 2021) to calculate a fintech index for each Chinese province. We further use the K-means clustering algorithm (Hartigan & Wong, 1979) to aggregate the provincial fintech indices to form 3 regions. Second, we test the heterogeneity in poverty among Chinese provinces and then propose a novel model called generalized elastic net Lp-norm support vector quantile regression (GLpSVQR) to examine the effects of fintech on poverty alleviation at different quantile levels.
This study contributes to the literature in three ways. First, we apply web crawler technology and word frequency analysis to collect data on new variables reflecting the technological innovation of the finance sector and then combine usage depth of digital finance and digitization levels (Guo et al., 2020) to construct a fintech index for each province in China. Second, the proposed generalized elastic net Lp-norm support vector quantile regression effectively solves the main influencing factor selection problem since the Lp-norm regularization term has an inherent variable selection property (Ye et al., 2021). Third, the novel sparse support vector quantile regression is proposed as a means to address heterogeneity in poverty among Chinese provinces, where quantile estimators are used as empirical “location” measures for poverty. Finally, this study contributes to the literature on the financial technology innovation and poverty alleviation, which have been acknowledged as a global challenge in economic growth (Sanz et al., 2017; Sapena et al., 2018).
The rest of this paper is organized as follows. First, a review of research on fintech and poverty is presented. Second, a novel sparse regression method is proposed to cope with the heterogeneity in poverty among various provincial regions. Third, data source and variables are described. Then, the empirical results and robustness test are presented. Finally, this paper concludes with a review of the findings and suggestions for future research.
Literature reviewDefinitions of financial technologyAlthough the rapid development of global fintech has received global attention, there is no standard definition of fintech (Chen et al., 2019; Cheng & Qu, 2020). Schueffel (2016) reviewed scholarly articles referencing fintech and defined fintech as a new financial industry. The Financial Stability Board (FSB) defined fintech as technologically enabled financial innovation. Subsequently, Leong and Sung (2018) defined fintech as a cross-disciplinary subject combining finance, technology management and innovation management. For Chen et al. (2019), fintech was refered to “the set of recently developed digital technologies that have been applied - or that will likely be applied in the future - to financial services”. Thakor (2020) claimed that fintech is the use of technology to provide new and improved financial services. Wójcik (2021) defines fintech as “a set of innovations and an economic sector that focus on the application of recently developed digital technologies to financial services”. In China, the People's Bank of China (PBOC) officially issued its Financial Technology Development Plan (2019–2021) in September 2019, which defined fintech as the application of emerging technologies.
From the various definitions of fintech, it is evident that the term refers to a broad, complex, and rich phenomenon (Iman, 2020). Some authors focus on the financial services industry that applies technology (Schueffel, 2016; Thakor, 2020; Wójcik, 2021), while others focus on technological innovations (Chen et al., 2019). This paper adopts the fintech definition given by Leong and Sung (2018) since it refers to the combination of finance, technology and innovation, which offers a greater level of detail.
Measurement of financial technologyRegarding to the elements of fintech, Ng and Kwok (2017) classify fintech into four categories: efficient payment processes, robo-advisors, peer-to-peer load and deposit platforms, and crowd funding. Moreover, Lee (2019) note that the fintech involves banking technology, pay technology, regression technology, wealth technology, lend technology, and insurance technology. Similar to Lee (2019), Li and Xu (2021) claim that the key technologies of fintech include internet technology, big data, artificial intelligence, distributed technology, and security technology. Focusing on many different contexts of fintech, Lee and Shin (2018) identify five elements of fintech ecosystems: fintech start-ups, technology developers, governments, financial customers, and traditional financial institutions.
To show the level of fintech development, Findexable constructed the Global fintech Index, an overall score indicating the quantity and quality of companies in the fintech ecosystem. The Global fintech Index, which ranks 65 countries, more than 230 cities, and 7000 companies worldwide, is the world's first global ranking of fintech ecosystems. Although the Global fintech Index is widely adopted (Lyons et al., 2021; Wójcik, 2021), it partially covers only the political and economic environment of fintech development (Pauliukevičienė & Stankevičienė, 2021).
In China, the fintech industry has rapidly grown since 2013. Cheng and Qu (2020) applied web crawler technology and word frequency analysis to construct a bank fintech index, which measures the development of fintech in the banking industry. Subsequently, Lee et al. (2021) used principal component analysis to construct a financial technology index composed of four dimensions: (1) credit, deposit and capital-raising services, (2) payments, clearing and settlement services, (3) investment management services, and (4) market support services. The fintech index developed by Lee et al. (2021) only includes the dimension of financial services. Wang et al. (2021) applied factor analysis to comprehensively construct a Chinese fintech index based on the following five attributes: big data, artificial intelligence, distributed technology, technology interconnectedness, and technology security. The fintech index developed by Wang et al. (2021) only focuses on the technology dimension. The fintech index of Deng et al. (2021) was derived from the municipal digital financial index compiled by the Peking University Digital Finance Research Center, which was constructed from the demand perspective, rather than the industry supply perspective (Lee et al., 2021).
From the analysis of the measurement of the fintech index in China, it is evident that the measurement of this index is a complex process. No standard fintech index has been developed in China. Some authors focus on the financial service dimension, while others focus on the technology dimension. According to the definition of fintech adopted in this paper, we evaluate levels of fintech development across multiple dimensions, including the usage depth of digital finance, the level of digitization, and the level of technology innovation, thus offering more detail on finance services, financial innovation and technology development.
Financial technology and poverty alleviationFinancial technology development plays a positive role in poverty alleviation through numerous channels (Mushtaq & Bruneau, 2019). Financial inclusion has been a very popular channel between fintech and poverty alleviation. Fintech has accelerated increases in financial inclusion because it has the capability to reach financially vulnerable populations (Muneeza et al., 2018). Fintech can offer inexpensive, convenient, and secure financial services to people; thus, it is beneficial to the development of inclusive finance.
In China, the rapid growth of fintech has significantly influenced the development of inclusive finance as one of its key emerging drivers. For instance, mobile banking, third-party payments, Yu'ebao and crowd funding are considered important ways to promote financial inclusion due to their accessibility, affordability, and safety. Since the G20 summit in 2010, financial inclusion has been widely perceived as a dynamic tool in the context of poverty alleviation (Mohammed et al., 2017; Omar & Inaba, 2020). Existing literature at the macro level and household level has generally indicated that the level of inclusive financial development in China has had a significant positive impact on the income poverty (Li, 2019; Yang & Fu, 2019; Peng, 2019; Wang, 2020).
Few studies have focused on whether fintech impacts poverty in China. Wang and He (2020) studied the effects of fintech on farmers’ vulnerability to poverty in China and found that farmers’ use of fintech has positive effects on poverty reduction by improving financial access, disseminating information, promoting social linkages, and promoting rural e-commerce. Zhang et al. (2020) investigated the growth and distribution effects of fintech development, using household survey data from China. The authors argued that fintech development in China has a positive effect in narrowing the urban-rural income gap by expanding access to financial services. It is important to note that academic studies on fintech and poverty in China have focused on the microlevel household perspective (Wang & He, 2020; Zhang et al., 2020). Moreover, Appiah-Otoo and Song (2021) used a panel of data on 31 provinces in China for 2011 to 2017 to examine the direct and indirect effects of fintech and its submeasures of third-party payment and credit on poverty measured by household per capita consumption. The authors confirm that fintech complements economic growth and financial development in reducing poverty in China. Appiah-Otoo and Song (2021) focused on macro provincial perspective to examine the effect of fintech development on poverty alleviation, but little attention has been paid to fintech index construction problems and heterogeneity problems of poverty. Thus, this paper fills the above knowledge gaps by proposing a quantile regression model to explore the effect of fintech development on poverty reduction in China.
MethodologyNormalization and aggregation methodologyTo measure fintech development, we adopt a normalization and aggregation methodology (Lyons et al., 2021) to calculate a fintech index for each province in China. This methodology involves two steps. In the first step, we use the min-max method to normalize each dimension for each province using the following equation:
where Sd represents the score for the dth dimension for d={financeservice,financialinnovation,technologydevelopment}.
In the second step, the fintech index is calculated by aggregating the normalized scores for the three dimensions using the following geometric mean approach:
where Sservice, Sinnovation, and Stechnology represent the normalized scores for the three dimensions.Generalized elastic net Lp-norm support vector quantile regression
To address the potential for unobserved heterogeneity among poverty-stricken regions in China (Ren et al., 2017; Gustafsson, 2009) and the variable selection problem related to high-dimensional dataset, we propose a generalized elastic net Lp-norm support vector quantile regression (GLpSVQR) to examine how fintech affects poverty alleviation in China using a province-level dataset covering 2011 to 2020.
Suppose that Y=(y1,⋯yN)aptaradummyentityaptaradummyx27; is a response variable, X is a known N×K design matrix of covariates, xi=(xi1,⋯xiK)aptaradummyentityaptaradummyx27; is a K-dimensional explanatory variable, and β0 and β=(β1,⋯βK)aptaradummyentityaptaradummyx27; are unknown parameters that need to be estimated. Consider the following linear regression model:
where ε is the random error.
Quantile regression (QR) (Koenker & Bassett, 1978) is an effective method to address regression problems involving heterogeneity, as it estimates β0 and β in a regression function (1) based on a full range of conditional quantile functions (Shim & Lee, 2010). To demonstrate a nonparametric version of QR, Takeuchi et al. (2006) introduced the spirit of support vector regression (SVR) (Drucker et al., 1997) into the QR framework. Subsequently, support vector quantile regression (SVQR) was proposed (Hu et al., 2012; Anand et al., 2020). SVQR maintains the advantages of quantile regression and support vector regression but it lacks the sparseness property related to the variable selection problem for high-dimensional data. Therefore, Ye et al. (2021) proposed an Lp-norm support vector quantile regression (Lp–SVQR) (0 < p < 1).
Lp–SVQR simultaneously realizes estimation and variable selection. However, Lp–SVQR solutions sometimes suffer from the singularity problem (Li et al., 2020). Since minimizing the L2-norm regularization solves the singularity problem, we introduce L2-norm regularization into the Lp–SVQR framework and propose a generalized elastic net Lp-norm support vector quantile regression (GLpSVQR) as follows:
where ∥⋅∥p represents the Lp-norm, ∥⋅∥2 represents the L2-norm, λ(λ ≥ 0) is a tuning parameter that balances the quantile loss, τ(0 < τ < 1) is the quantile level, ξ and ξ* are slack variables, and e is a vector of ones with appropriate dimensions.
The combination of Lp-norm and L2-norm, that is, λ∥β∥pp+∥β∥22, forms a generalized elastic net that is similar to that of Li et al. (2020), which was used for classification. Therefore, GLpSVQR maintains the advantages of Lp-SVQR and SVQR. GLpSVQR not only has the variable selection ability to solve estimation problems with high-dimensional dataset, but also prevents overfitting. Moreover, GLpSVQR can effectively address heterogeneity problems in the estimation process since quantile estimators are a class of empirical “location” measures for the dependent variable.
Regression problem (2) is not differentiable due to the Lp-norm regularization term. To make it smooth, we introduce the upper-bound variable υ=([υ]1,⋯,[υ]K)T; thus, problem (2) can be written as follows:

Problem (3) is differentiable and can be solved using a convergent successive linear algorithm (SLA). The SLA process starts with a random initial point β^00,β^0,υ^0,ξ^0,ξ^*0, and at the k-th iteration, k=1,2,…,β^0k,β^k,υ^k,ξ^k,ξ^*k is produced by solving the following problem:
where υ^k−1=([υ^k−1]1,…,[υ^k−1]K)T. The convergence of the SLA can be easily found in Ye et al. (2017).
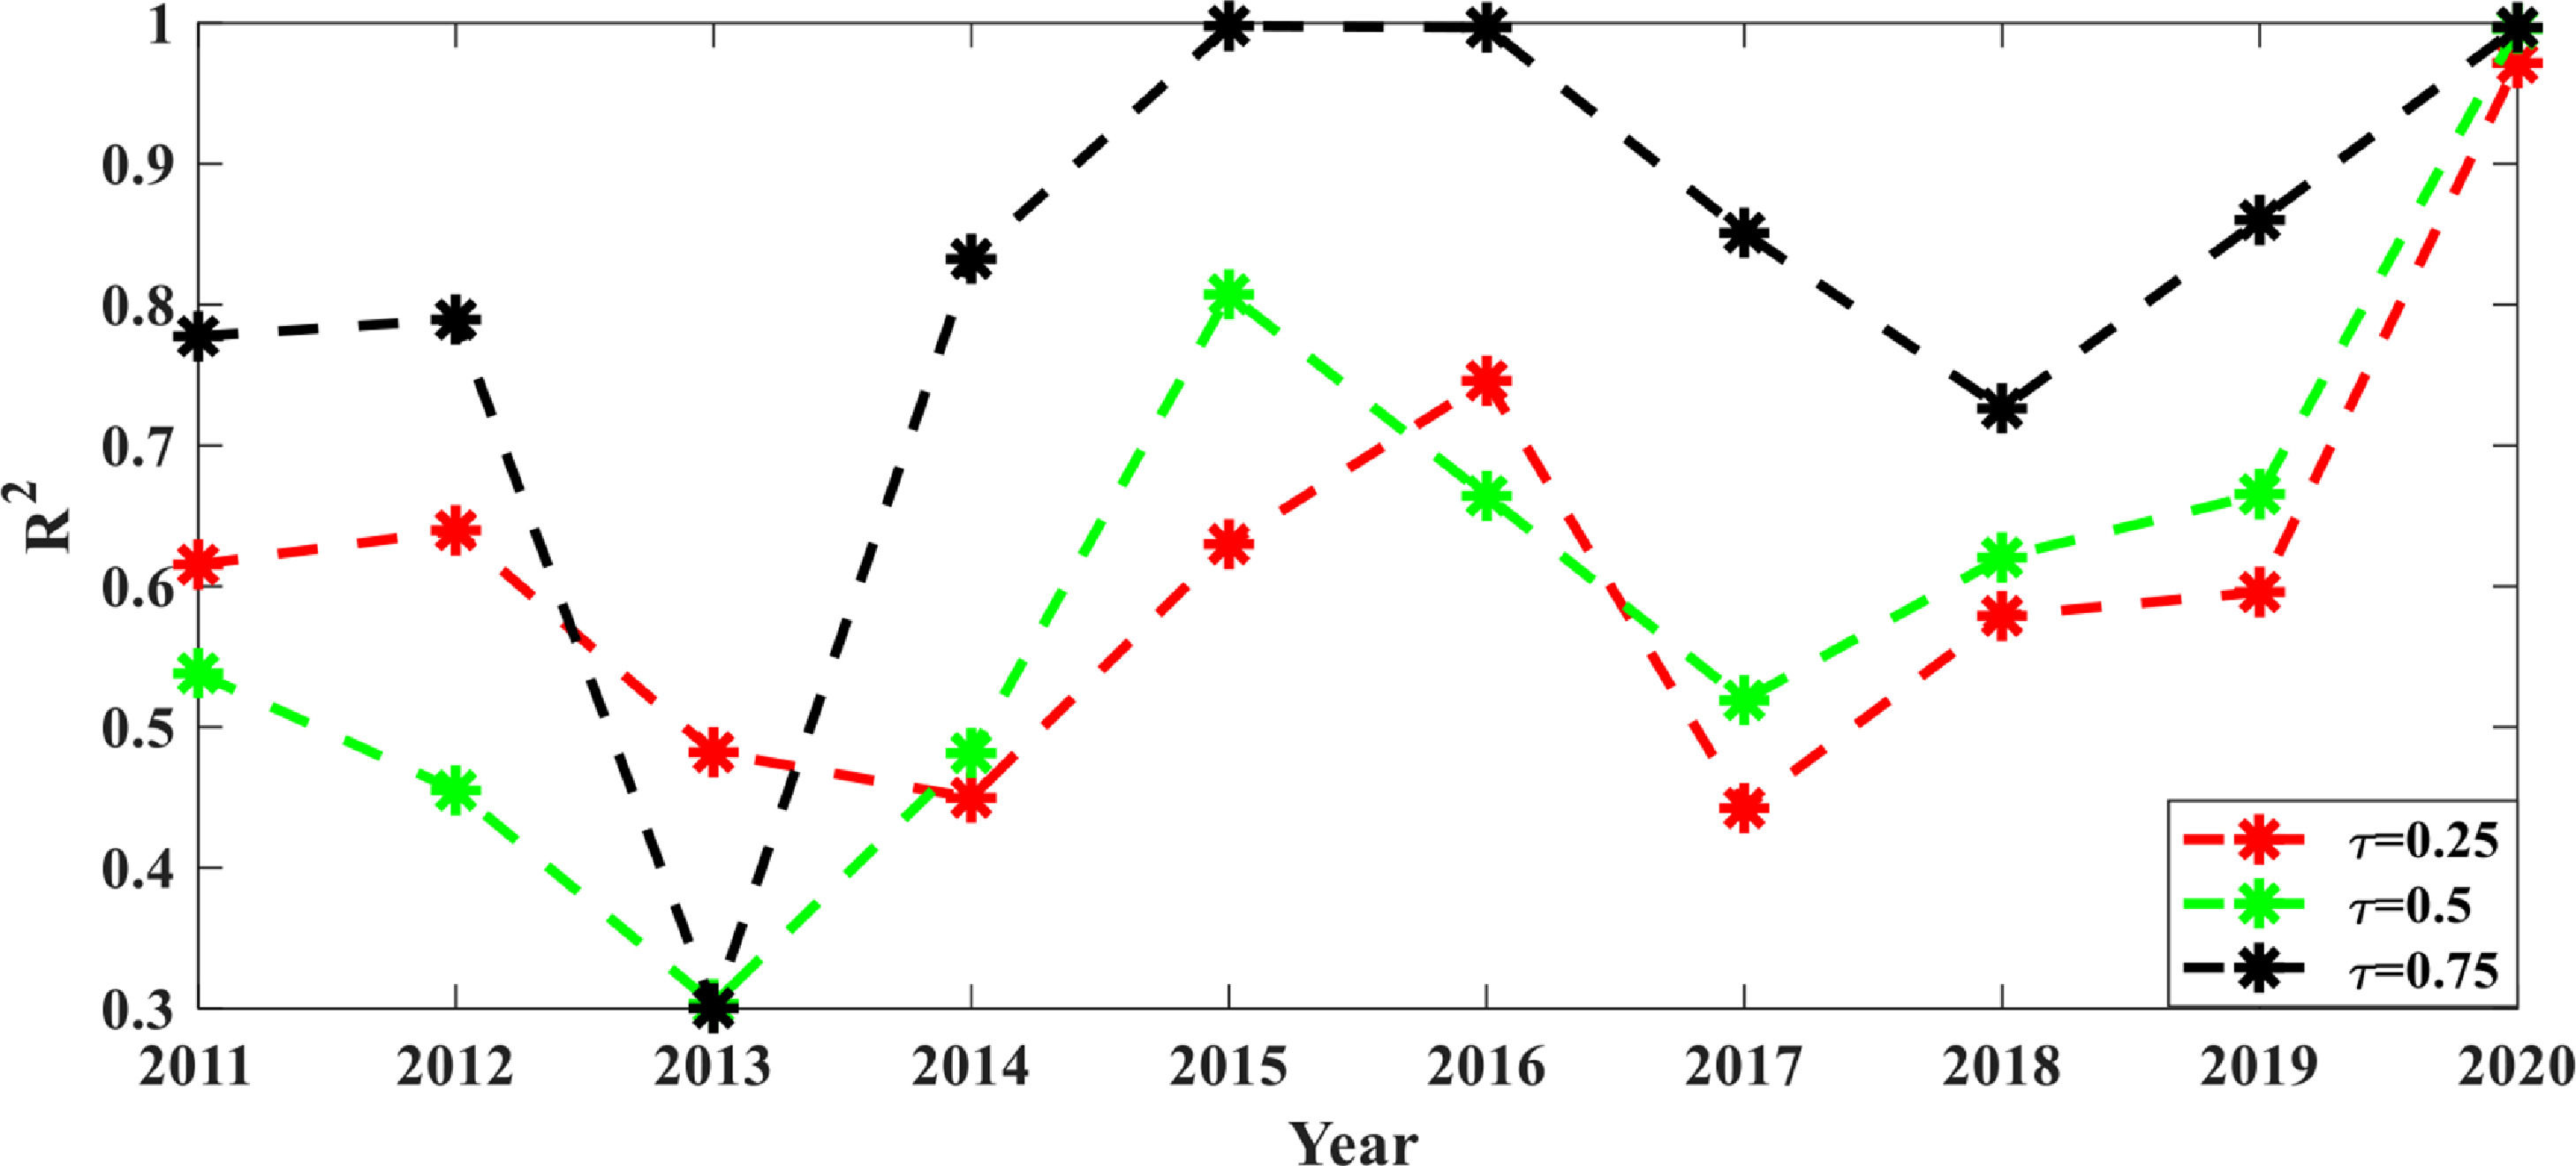
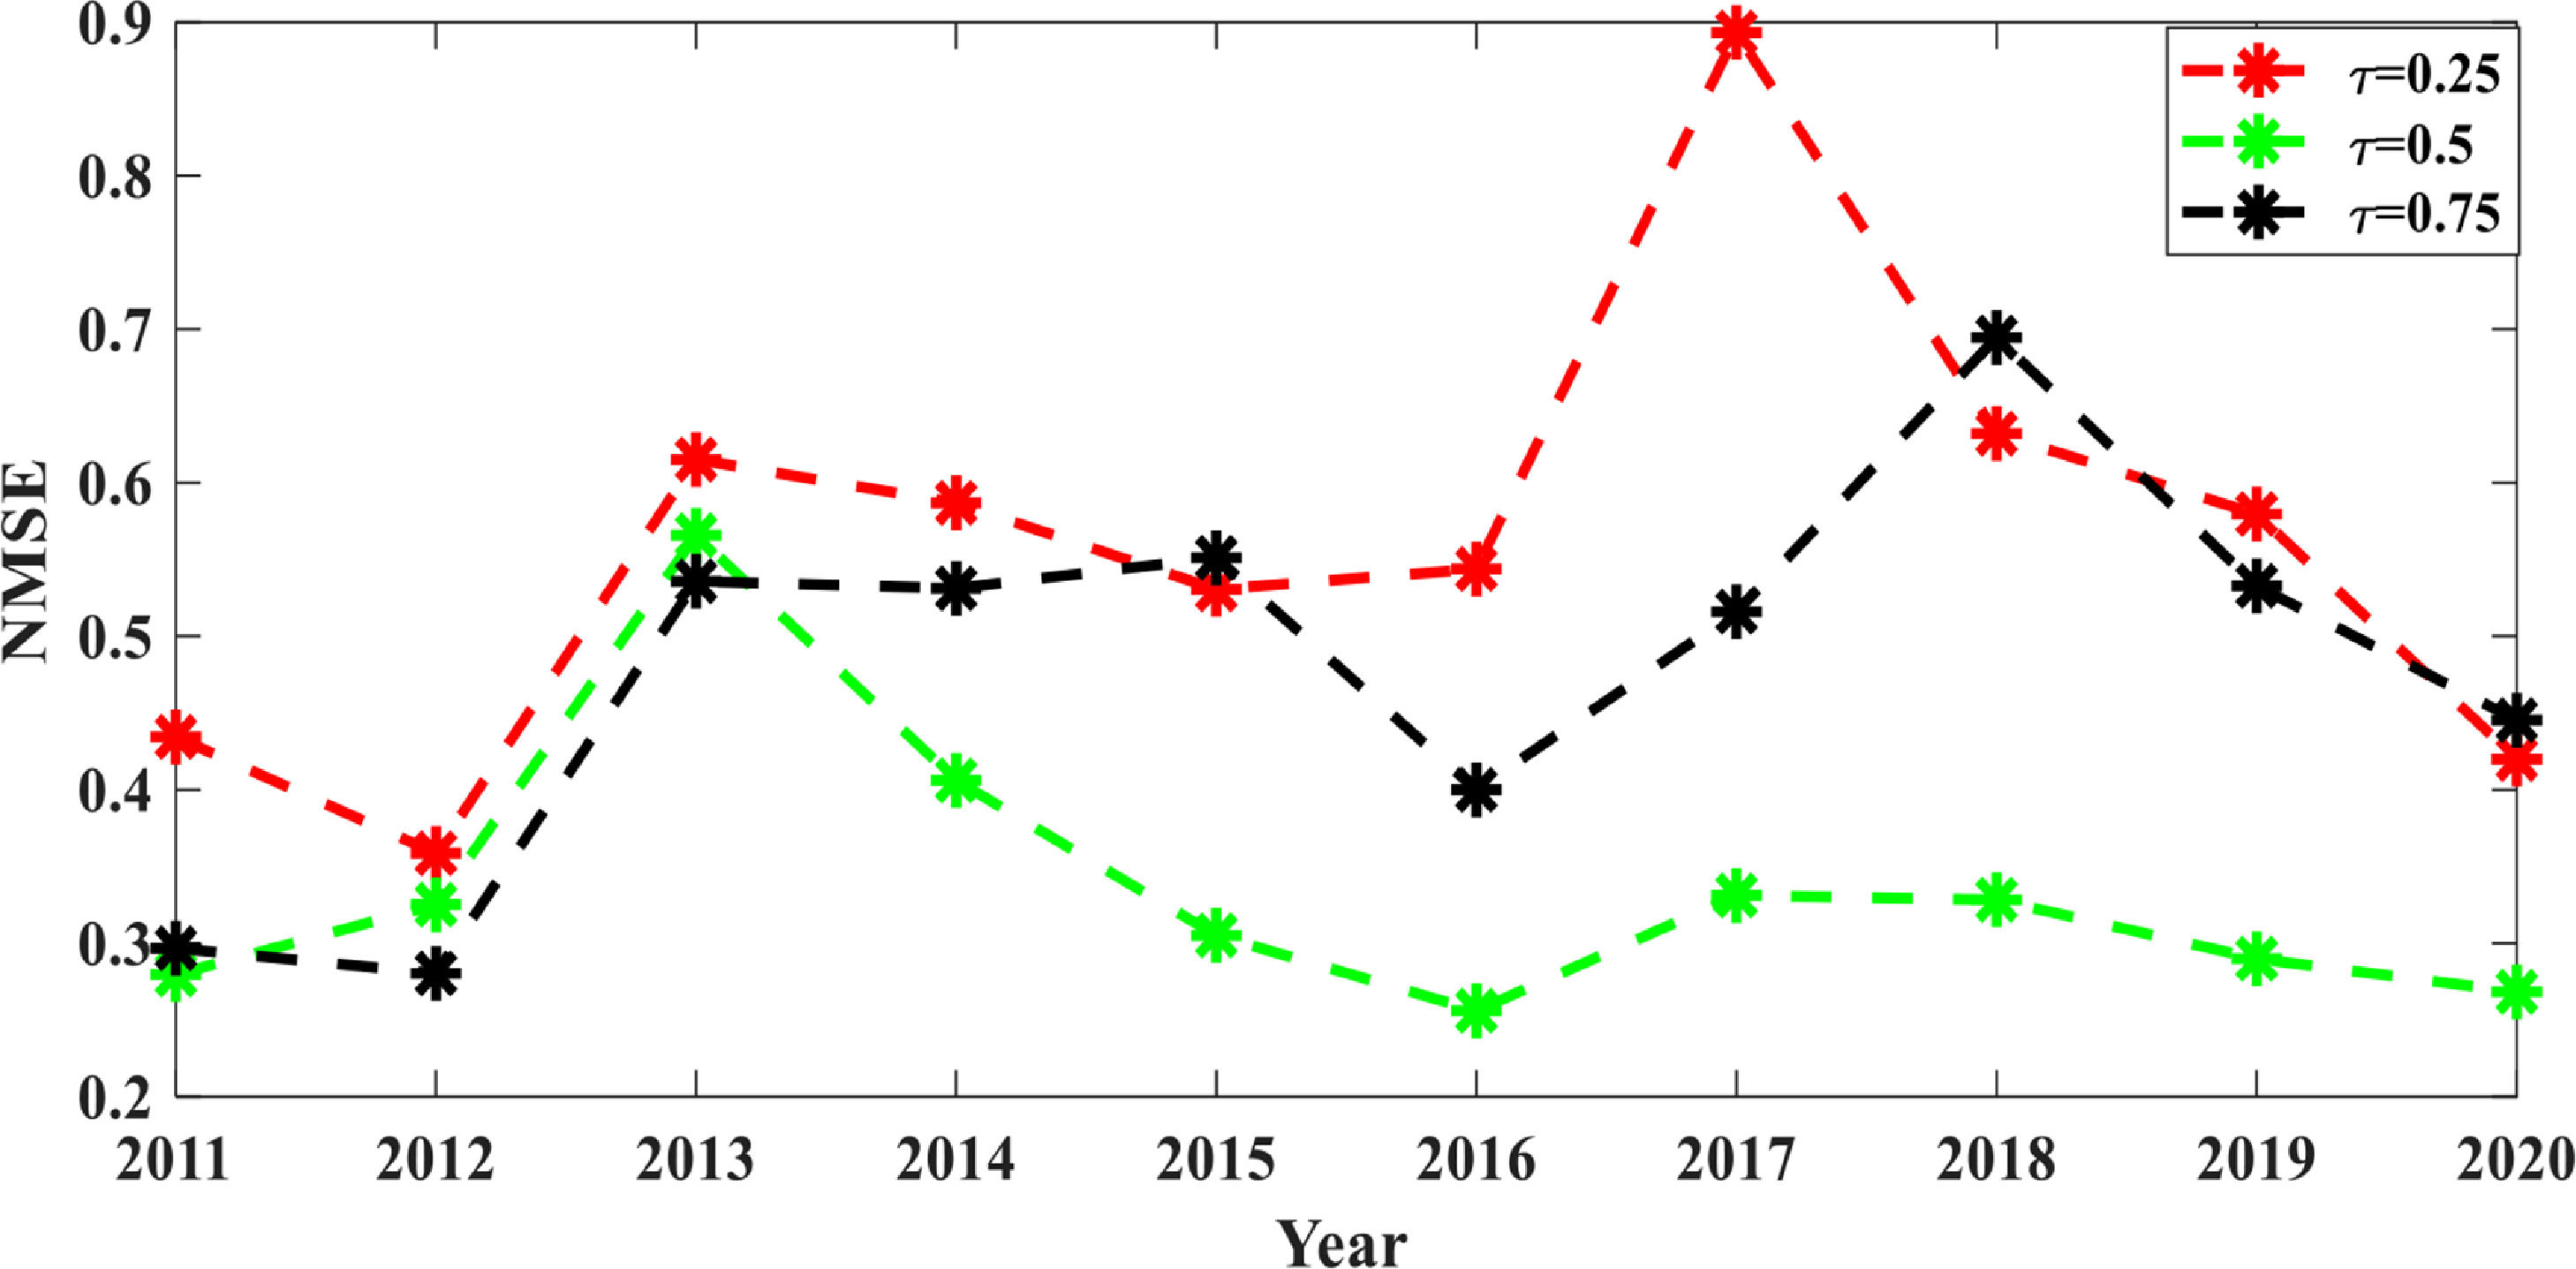
To evaluate the regression results of GLpSVQR, let n be the number of samples, y^i be the predicted value of yi, and y¯=∑i=1nyi/n be the average value of y1,…,yn. We use the normalized mean squared error (NMSE) and R2 to evaluate the regression results of GLpSVQR. These values are defined as follows:


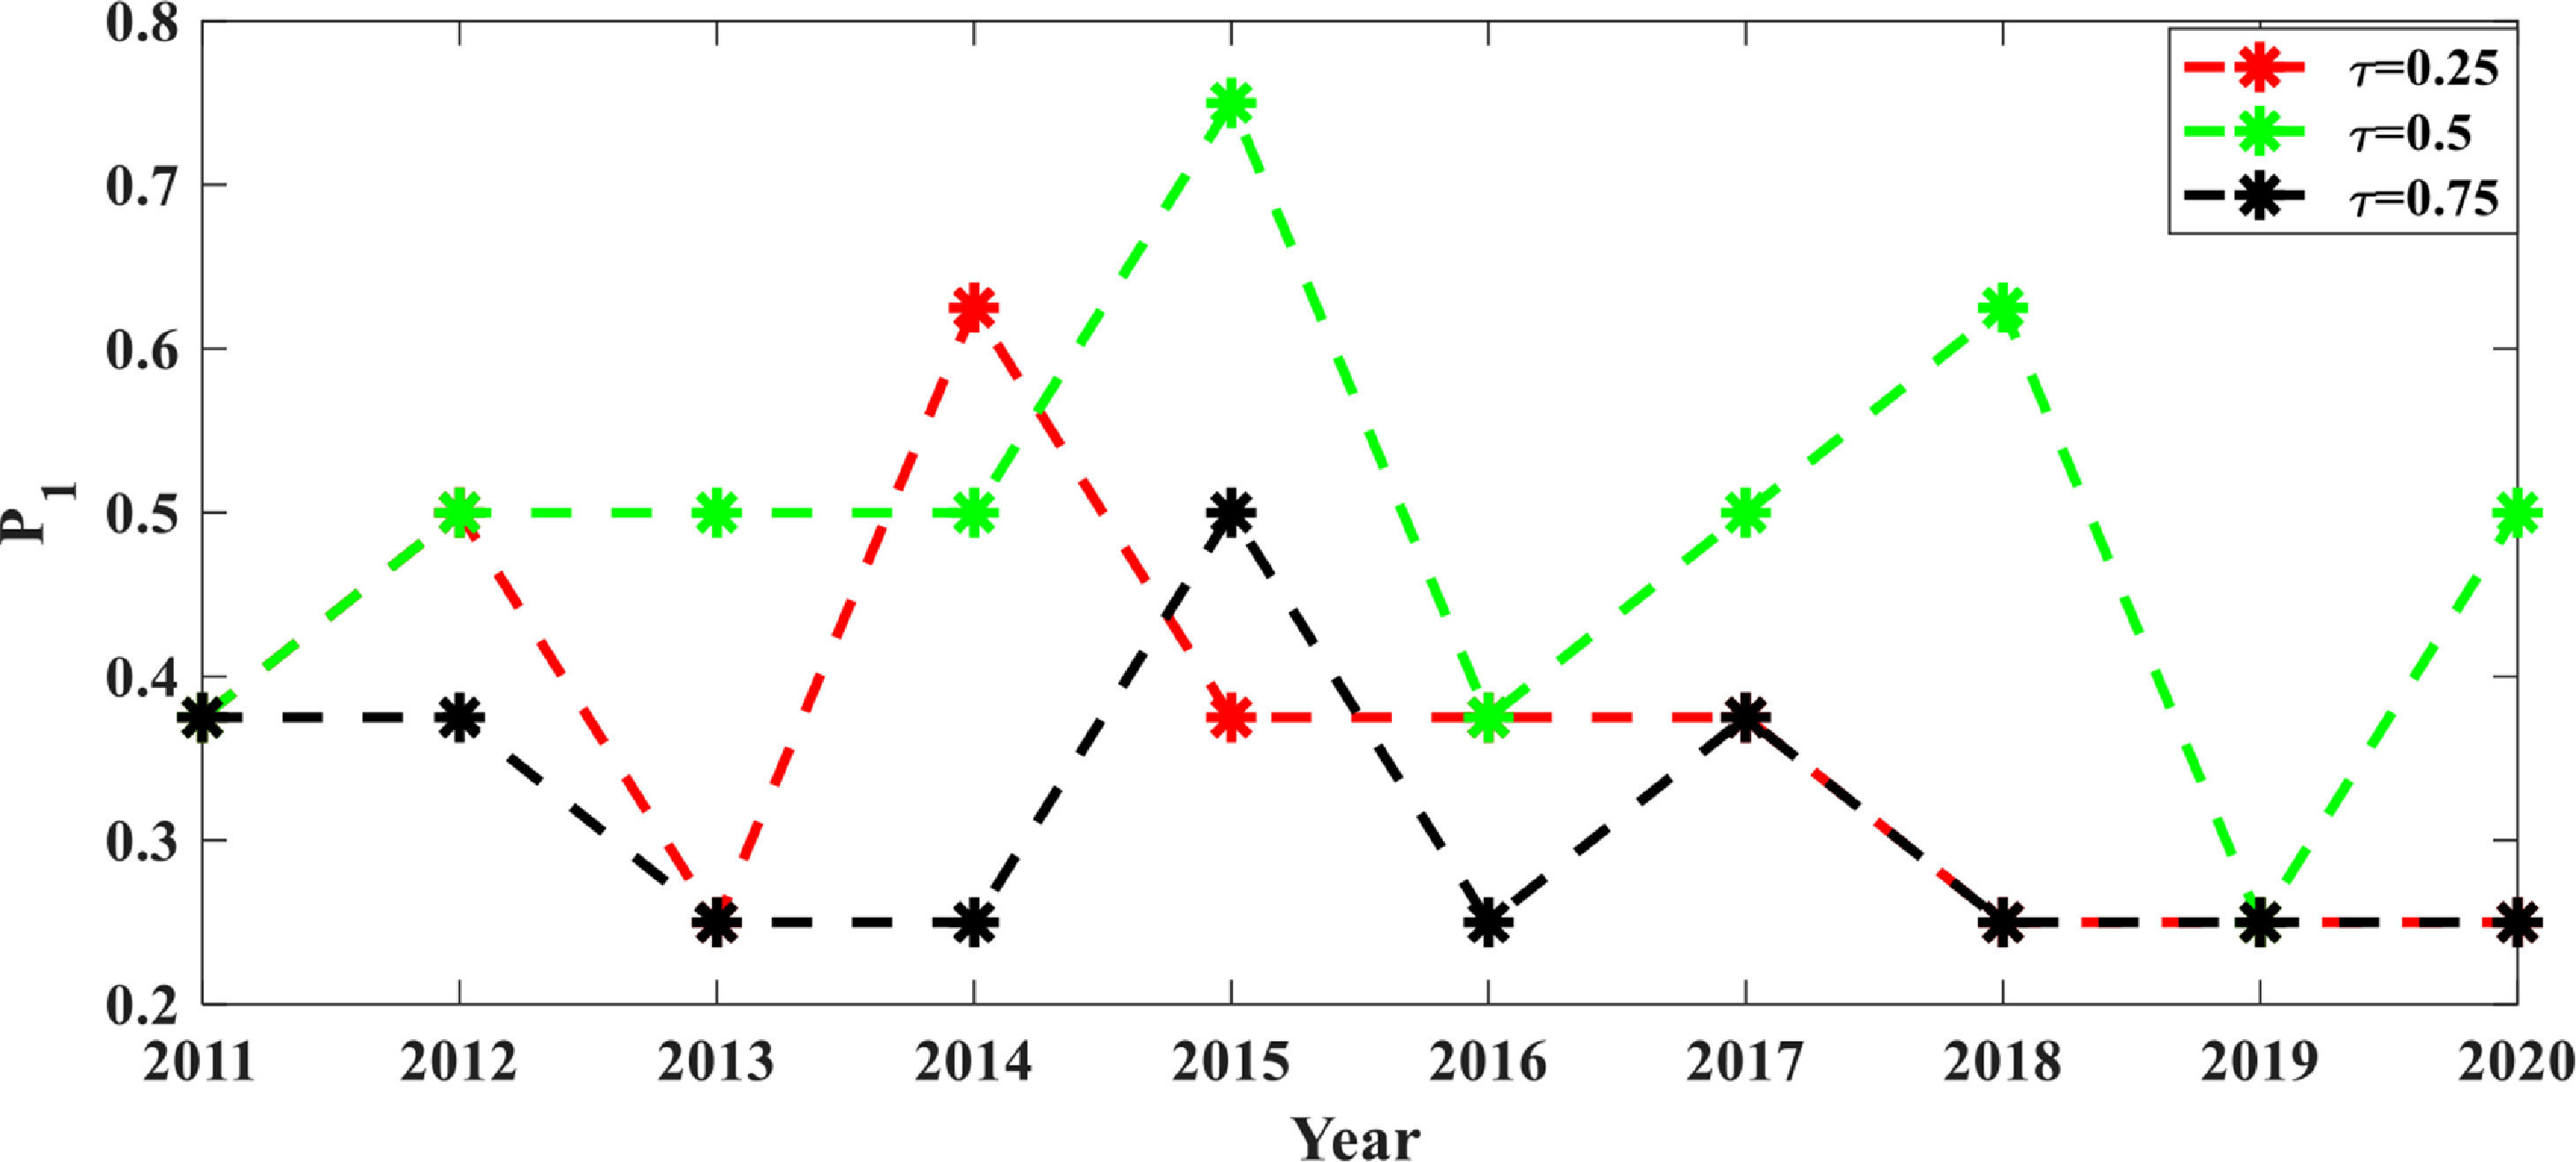
In addition, we use the proportion of nonzero estimated coefficients (P1) to evaluate the variable selection ability of GLpSVQR (Ye et al., 2021). The optimal values of these parameters for our experiments are determined using the grid search method.
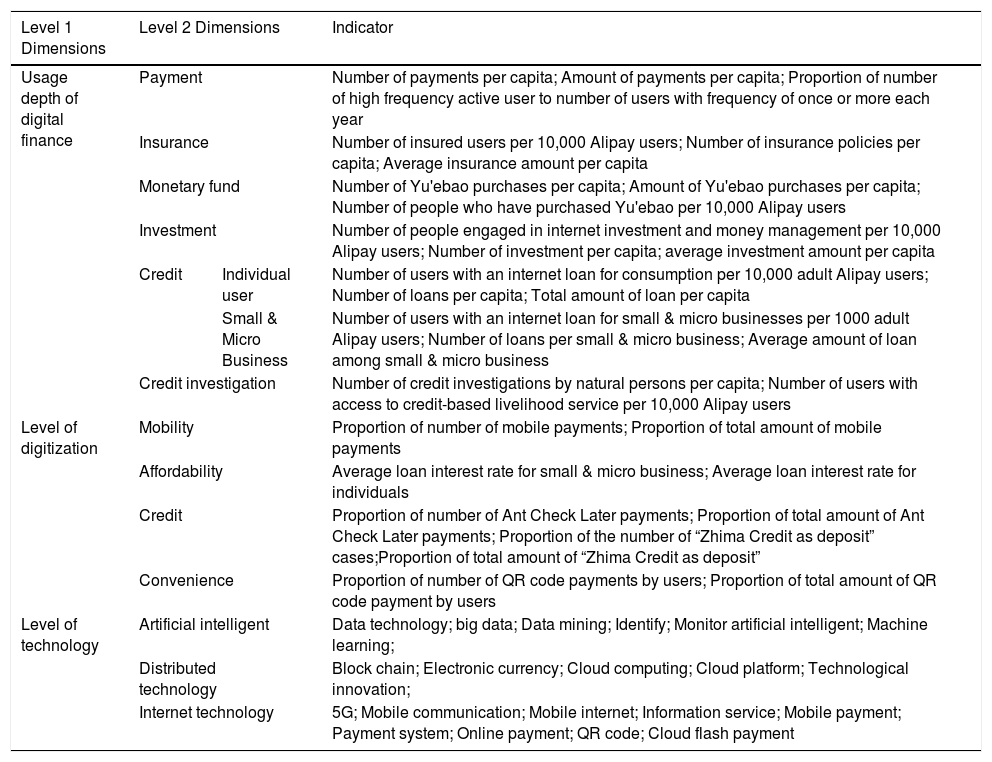
Data sources and variablesFintech indexFintech can be evaluated across different dimensions, including the usage depth of digital finance, the level of digitization, and the level of technology. Our data on the usage depth of digital finance and the digitization level of financial services come from Guo et al. (2020). To collect data on the finance technology level, we use web crawler technology and word frequency analysis to search fintech-related keywords in the financial operation reports of every province in China. The usage depth of digital finance refers to payments, insurance, monetary funds, investments, credit, and credit investigation. The level of digitization encompasses mobile usage level, affordability, credit level, and facilitation. The finance technological level covers artificial intelligence, distributed technology, and internet technology. The specifications of variables, which reflect fintech activities, are listed in Table 1. We use a normalization and aggregation methodology (Lyons et al., 2021) to calculate a fintech index for each province in China.
Fintech dimensions.
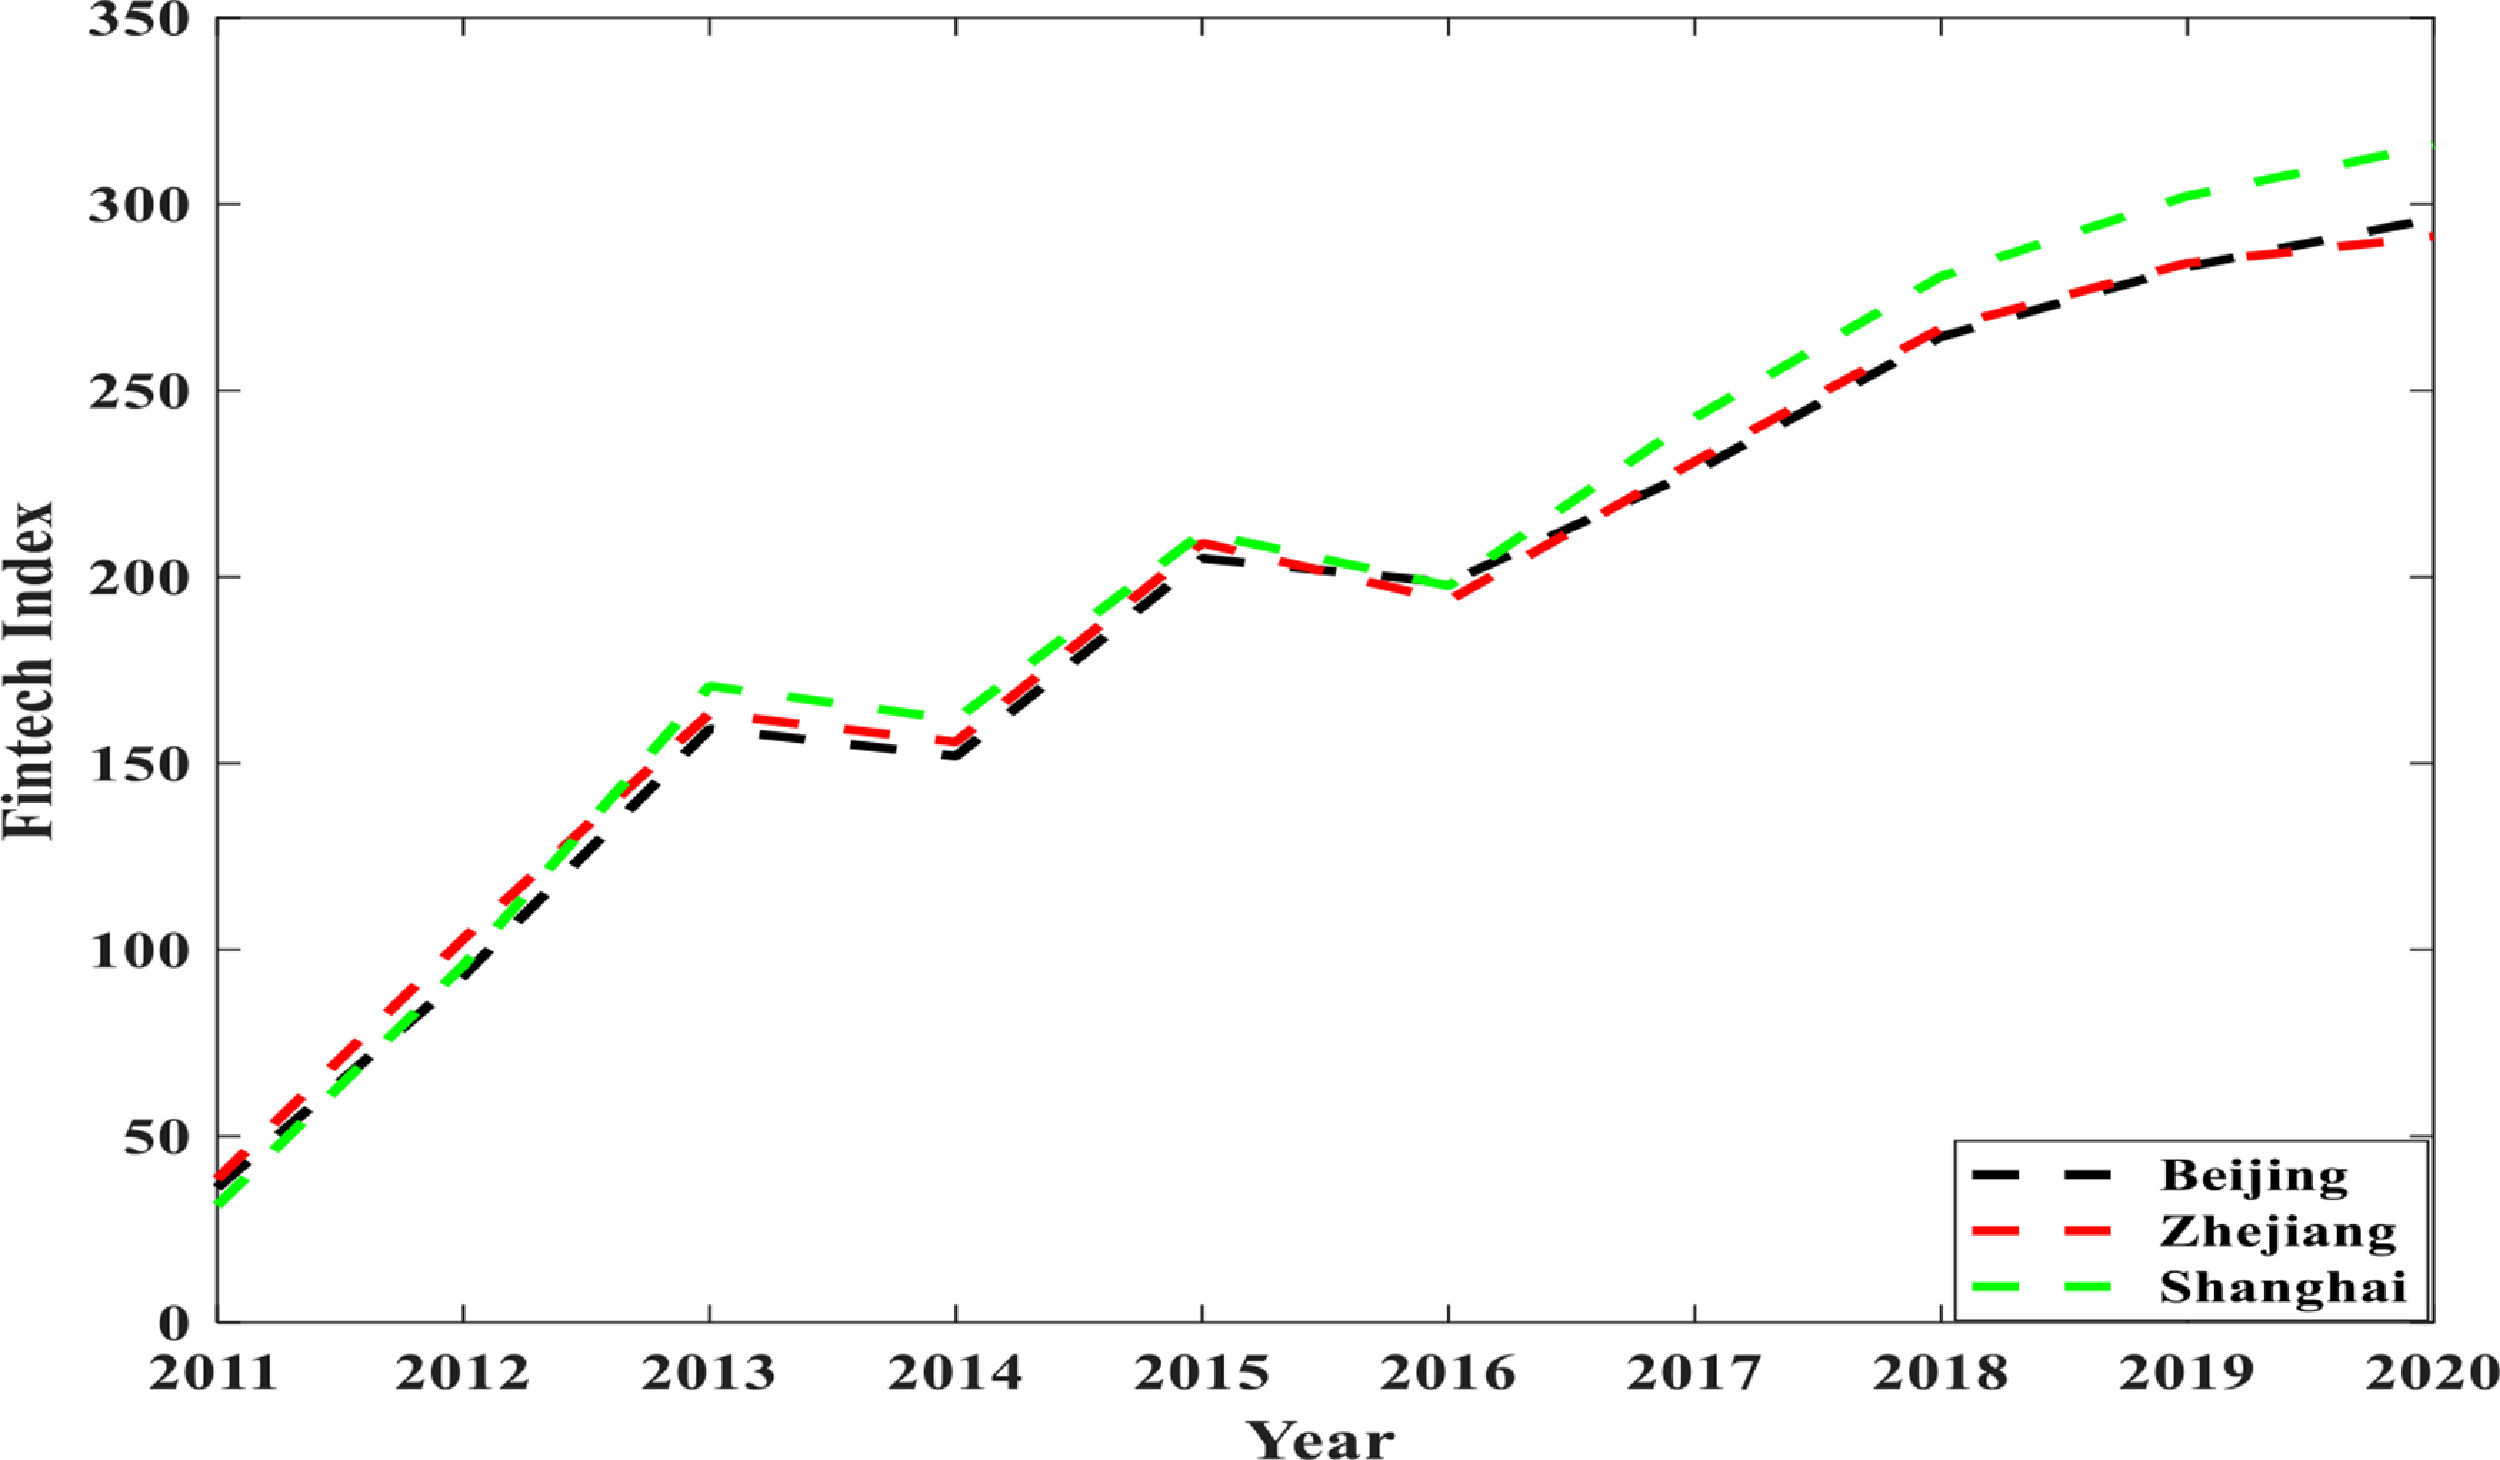
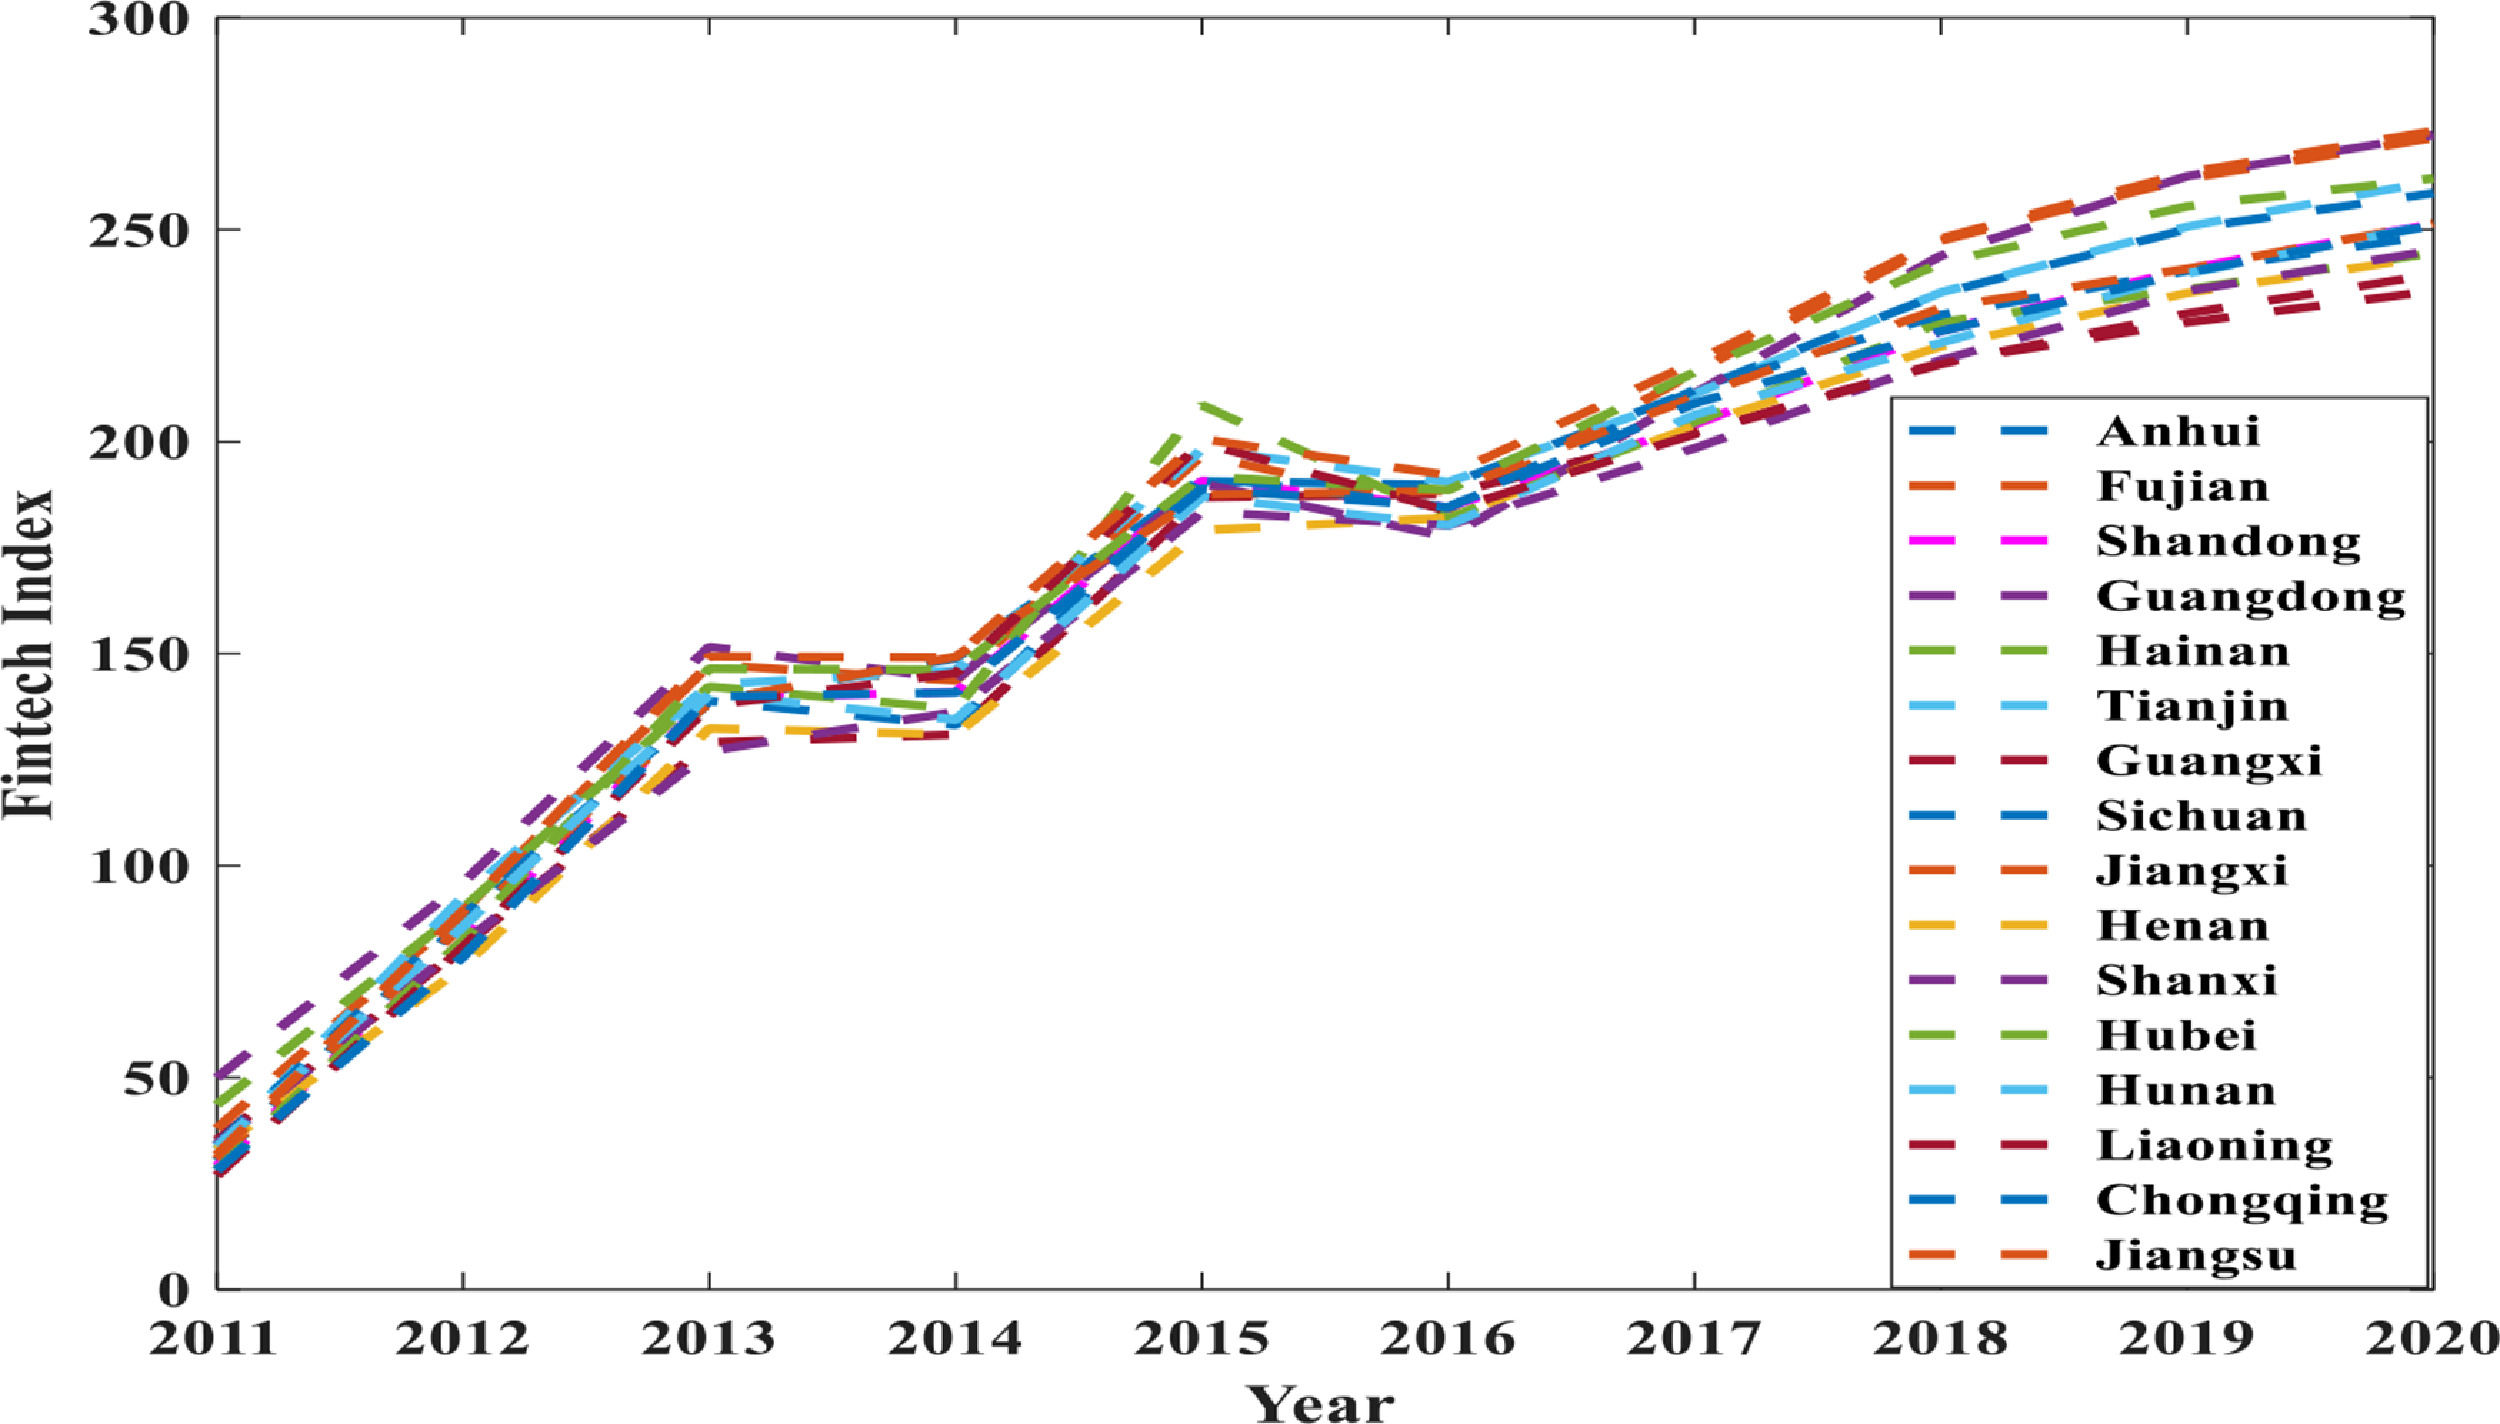
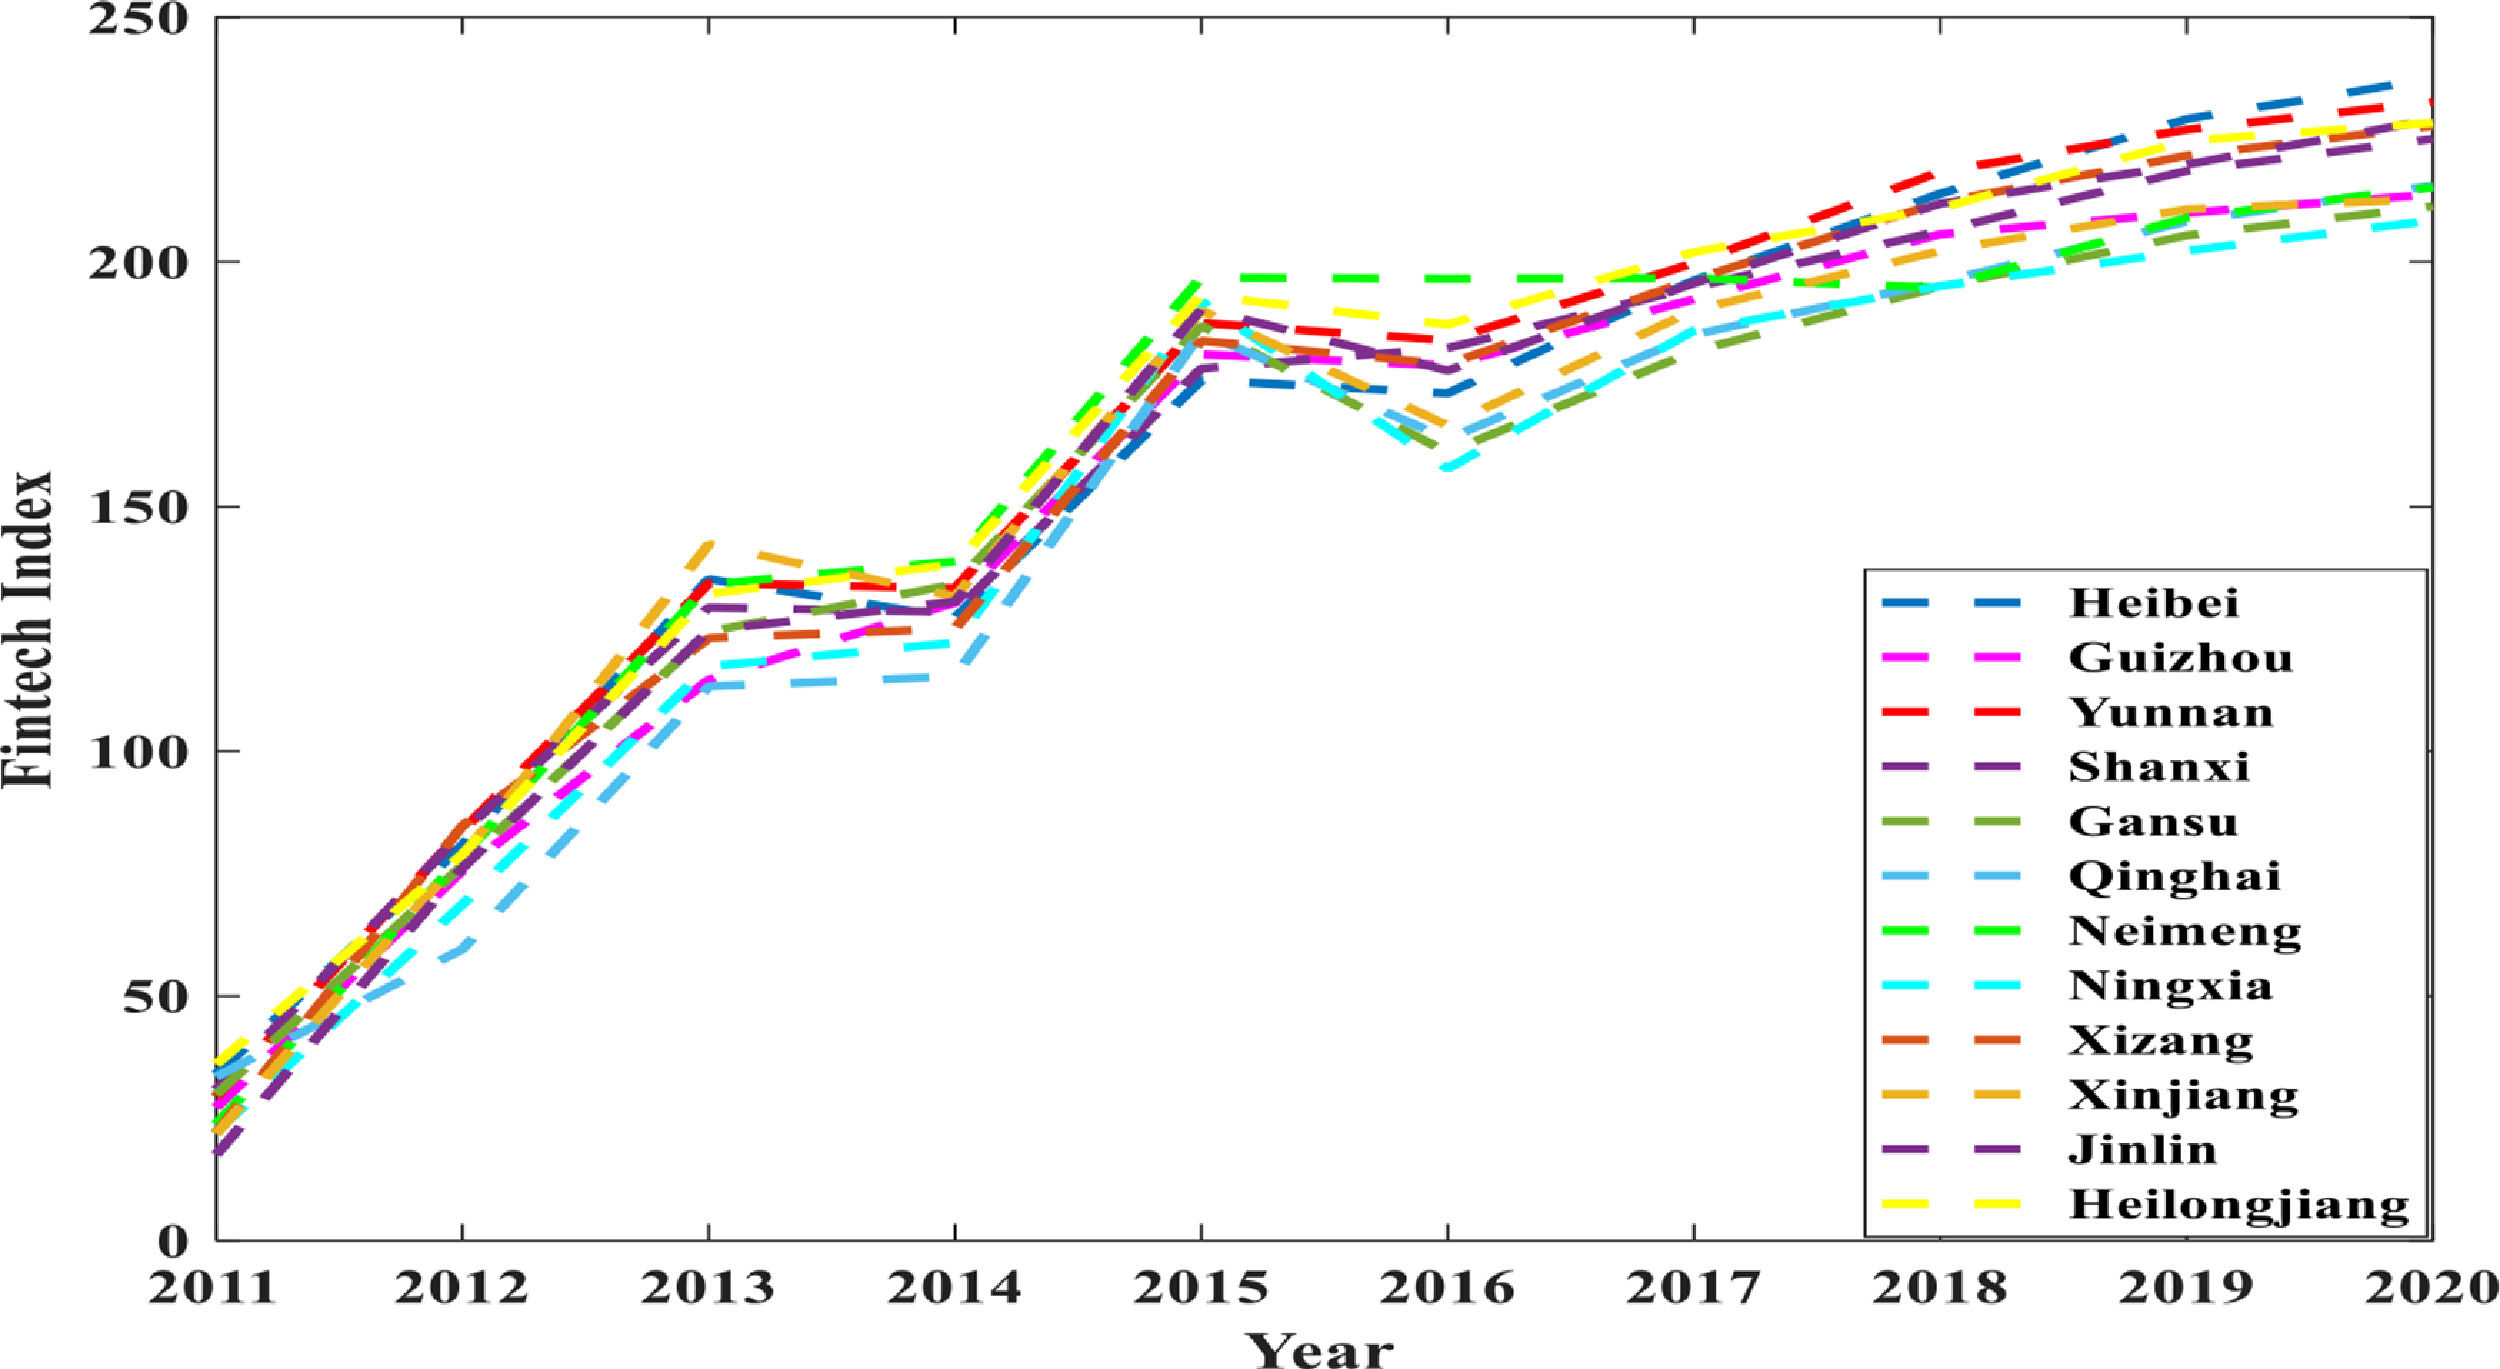
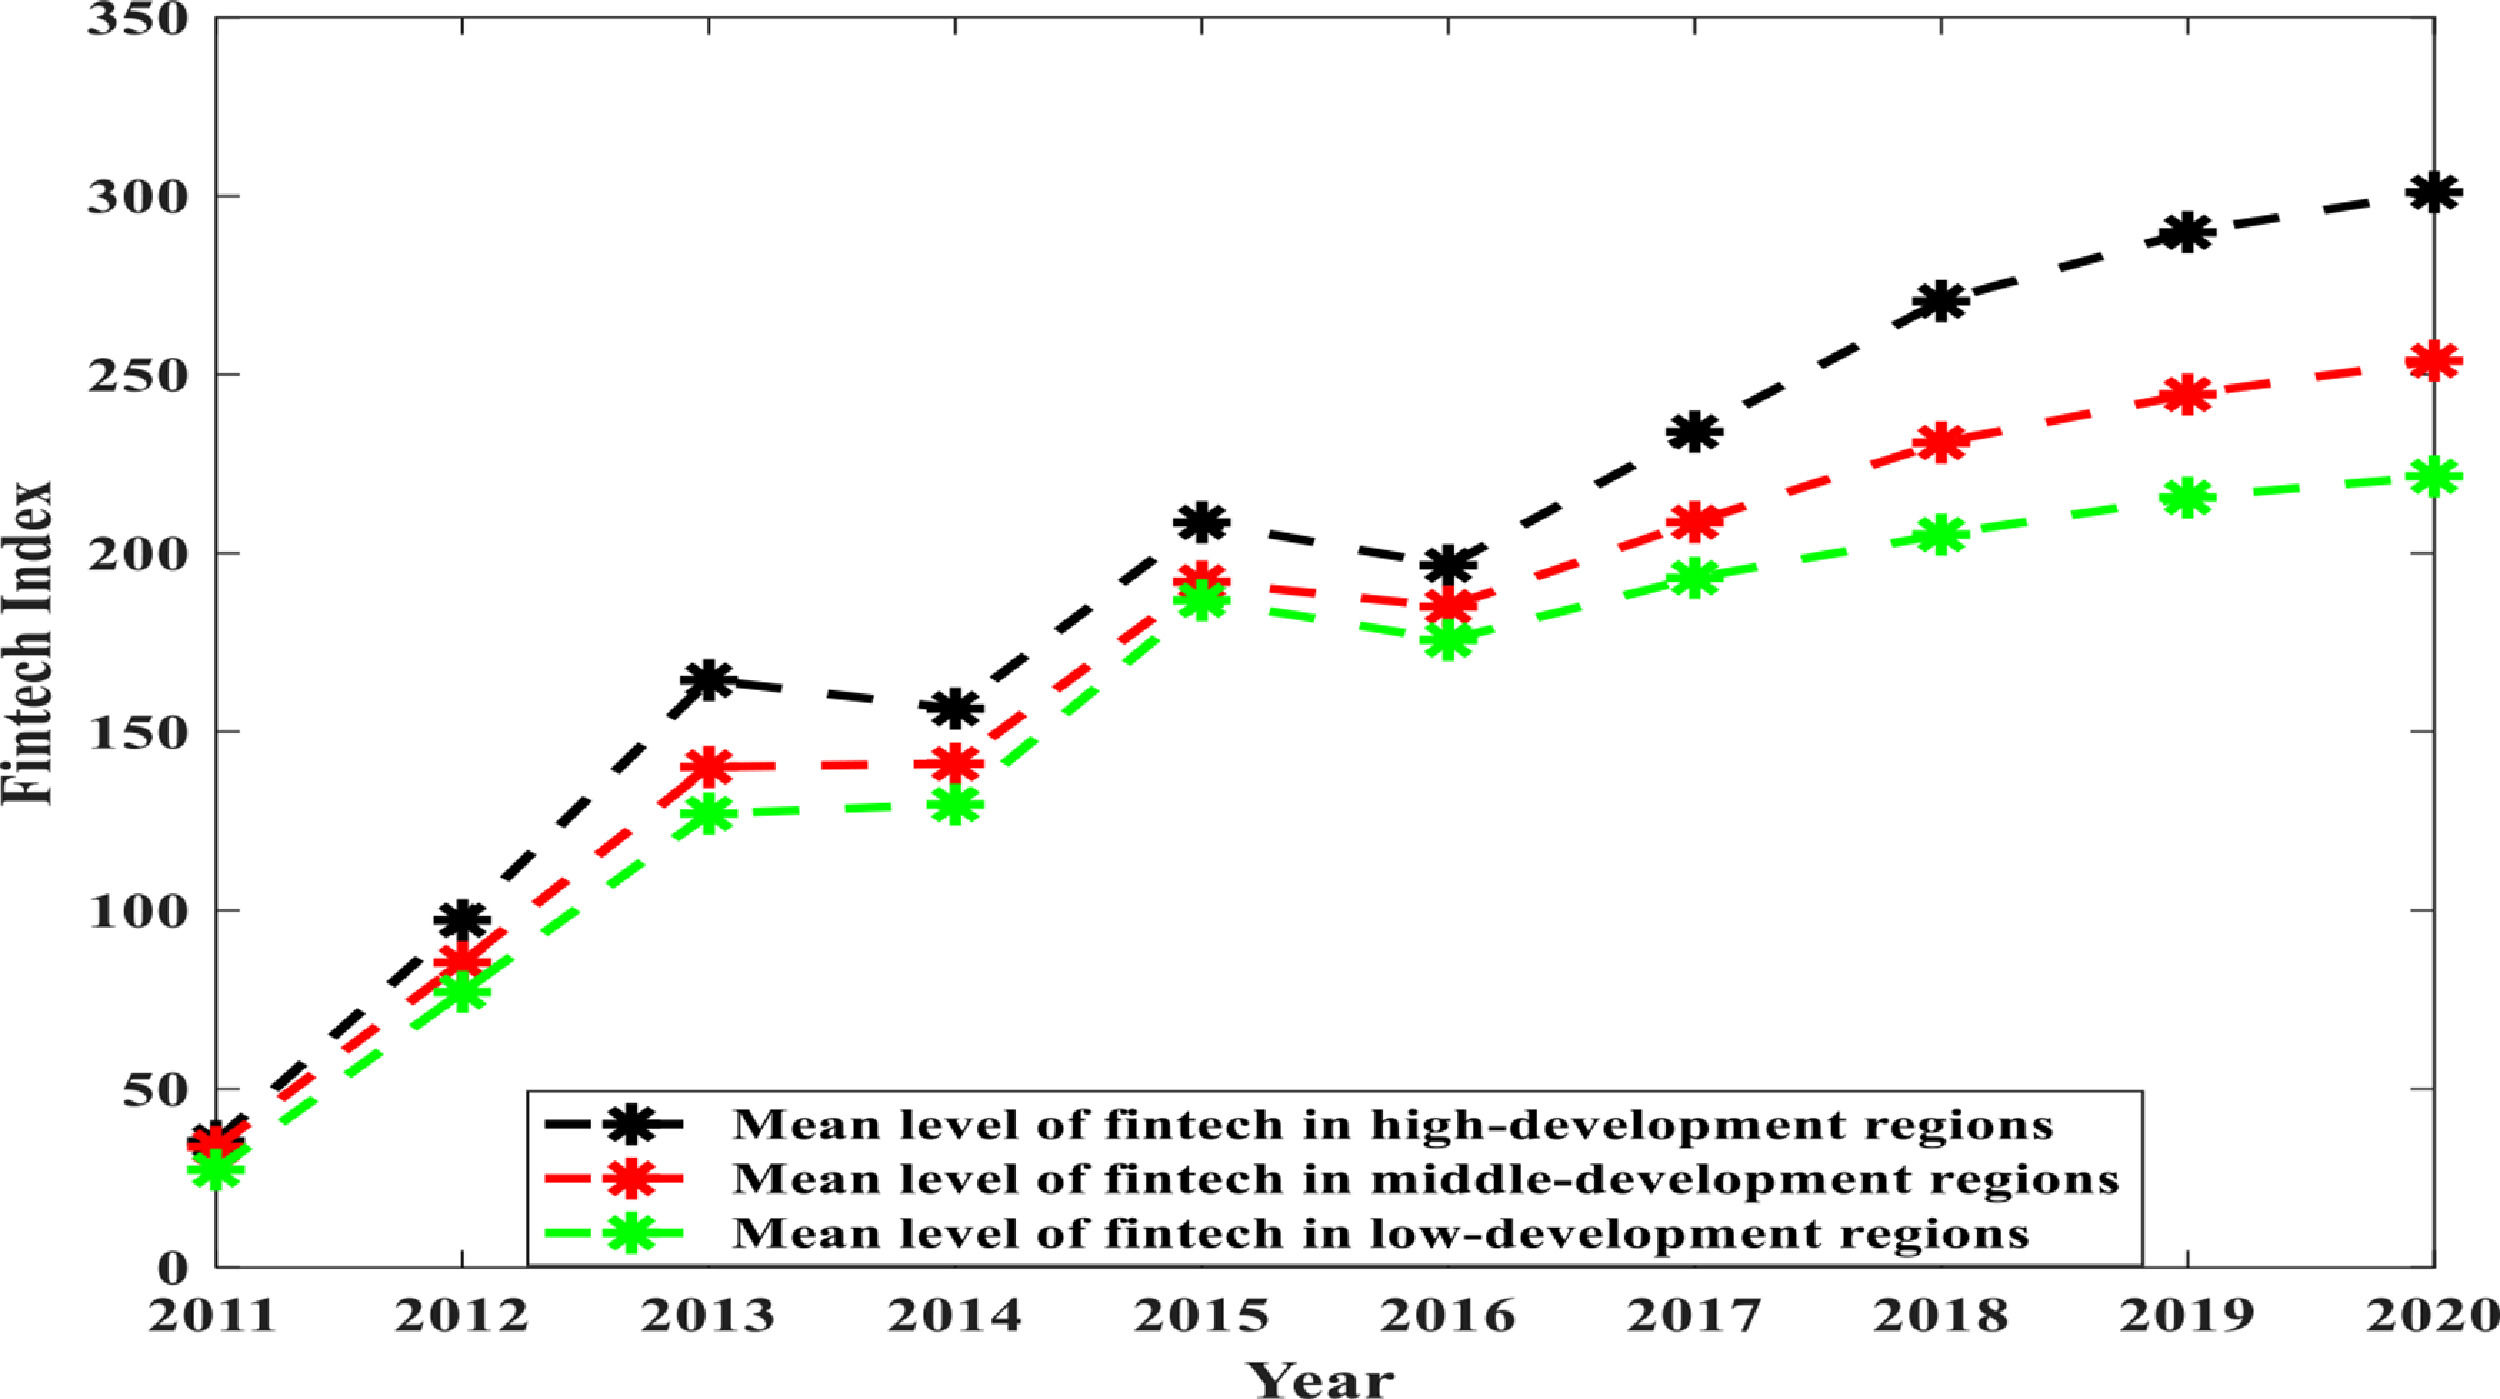
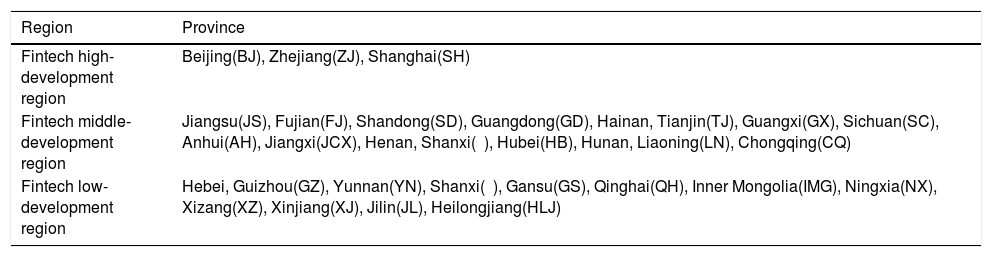
We further use the K-means clustering algorithm (Hartigan & Wong, 1979) to aggregate the Chinese provincial fintech indices into 3 clusters (excluding Hong Kong, Macao, and Taiwan): a high-development region, an intermediate-development region, and a low-development region. The provinces included in each region are listed in Table 2. The trend of the fintech index belonging to the same cluster is shown in Figs. 1-3. From Fig. 1, we can see that the fintech high-development region includes Beijing, Zhejiang, and Shanghai. The fintech level of this region is approximately 200. The intermediate-development region includes 16 provinces, such as Jiangsu, Fujian, and Guangdong. The fintech level of this region is approximately 170, as shown in Fig. 2. The low-development region includes 12 provinces, such as Hebei, Guizhou, Yunnan, and Gansu. In Fig. 3, we find that the fintech level of this region is approximately 160. Fig. 4 shows fintech mean level of each cluster. From the figure, we can see that the clustering centers of different groups have different trend. Moreover, the gap of fintech level among different clusters has become larger in recent years. Figs. 1-4 show the heterogeneity in fintech level among Chinese provincial regions.
Regional division of fintech in China.


To analyze the impact of fintech on poverty alleviation in China, we take poverty as our dependent variable. Poverty is a diverse and dynamic concept (Wang et al., 2021). This paper adopts the poverty definition given by Ravallion (1998) who defined poverty as inadequate income to gain essential necessities for survival. According to the definition of poverty, we measure poverty by the poverty headcount ration data (H), which refers to the ratio of the people below the poverty line (q) to the total registered population (n) (Liu et al., 2017). Our independent variables include: fintech, measured by the proposed fintech index; income inequality, measured as the proportion of urban per capita disposable income to rural per capita disposable income; economic level, measured as the logarithmic form of per capita GDP; trade, measured as the sum of exports and imports as a share of GDP; education, measured as the education expenditures as a share of GDP; fixed asset investments, measured as fixed asset investments as a share of GDP; foreign direct investment, measured as FDI as a share of GDP; and public budget expenditures, measured as public budget expenditure as a share of GDP. The data of these variables except for the fintech index come from China's National Bureau of Statistics. All annual data range from 2011 to 2020.
Heterogeneity testWe adopt a meta-analysis to test whether poverty and each of our independent variables are heterogeneous. Typically, in meta-analyses, heterogeneity is assessed with the I2 index (Higgins & Thompson, 2002). All the heterogeneity tests of poverty among the provincial regions are implemented in Stata 15.1. I2 values of 25%, 50%, and 75% are interpreted as representing low, moderate, and high levels of heterogeneity. The heterogeneity test results corresponding to each year are similar. Here, we only present the heterogeneity test results corresponding to 2011. The education, fixed asset investment, foreign direct investment, public budget expenditure, and trade I2 values are 99.8%, 97.8%, 100%, 99.6%, and 99.9%, respectively. These values reflect great heterogeneity among the examined provincial regions. The income inequality I2 value is 38.2%, indicating the low level of heterogeneity in relation to this factor among the provincial regions. The I2 values of fintech index and the economy are 0, indicating that there is no heterogeneity among the provincial regions in relation to these factors.
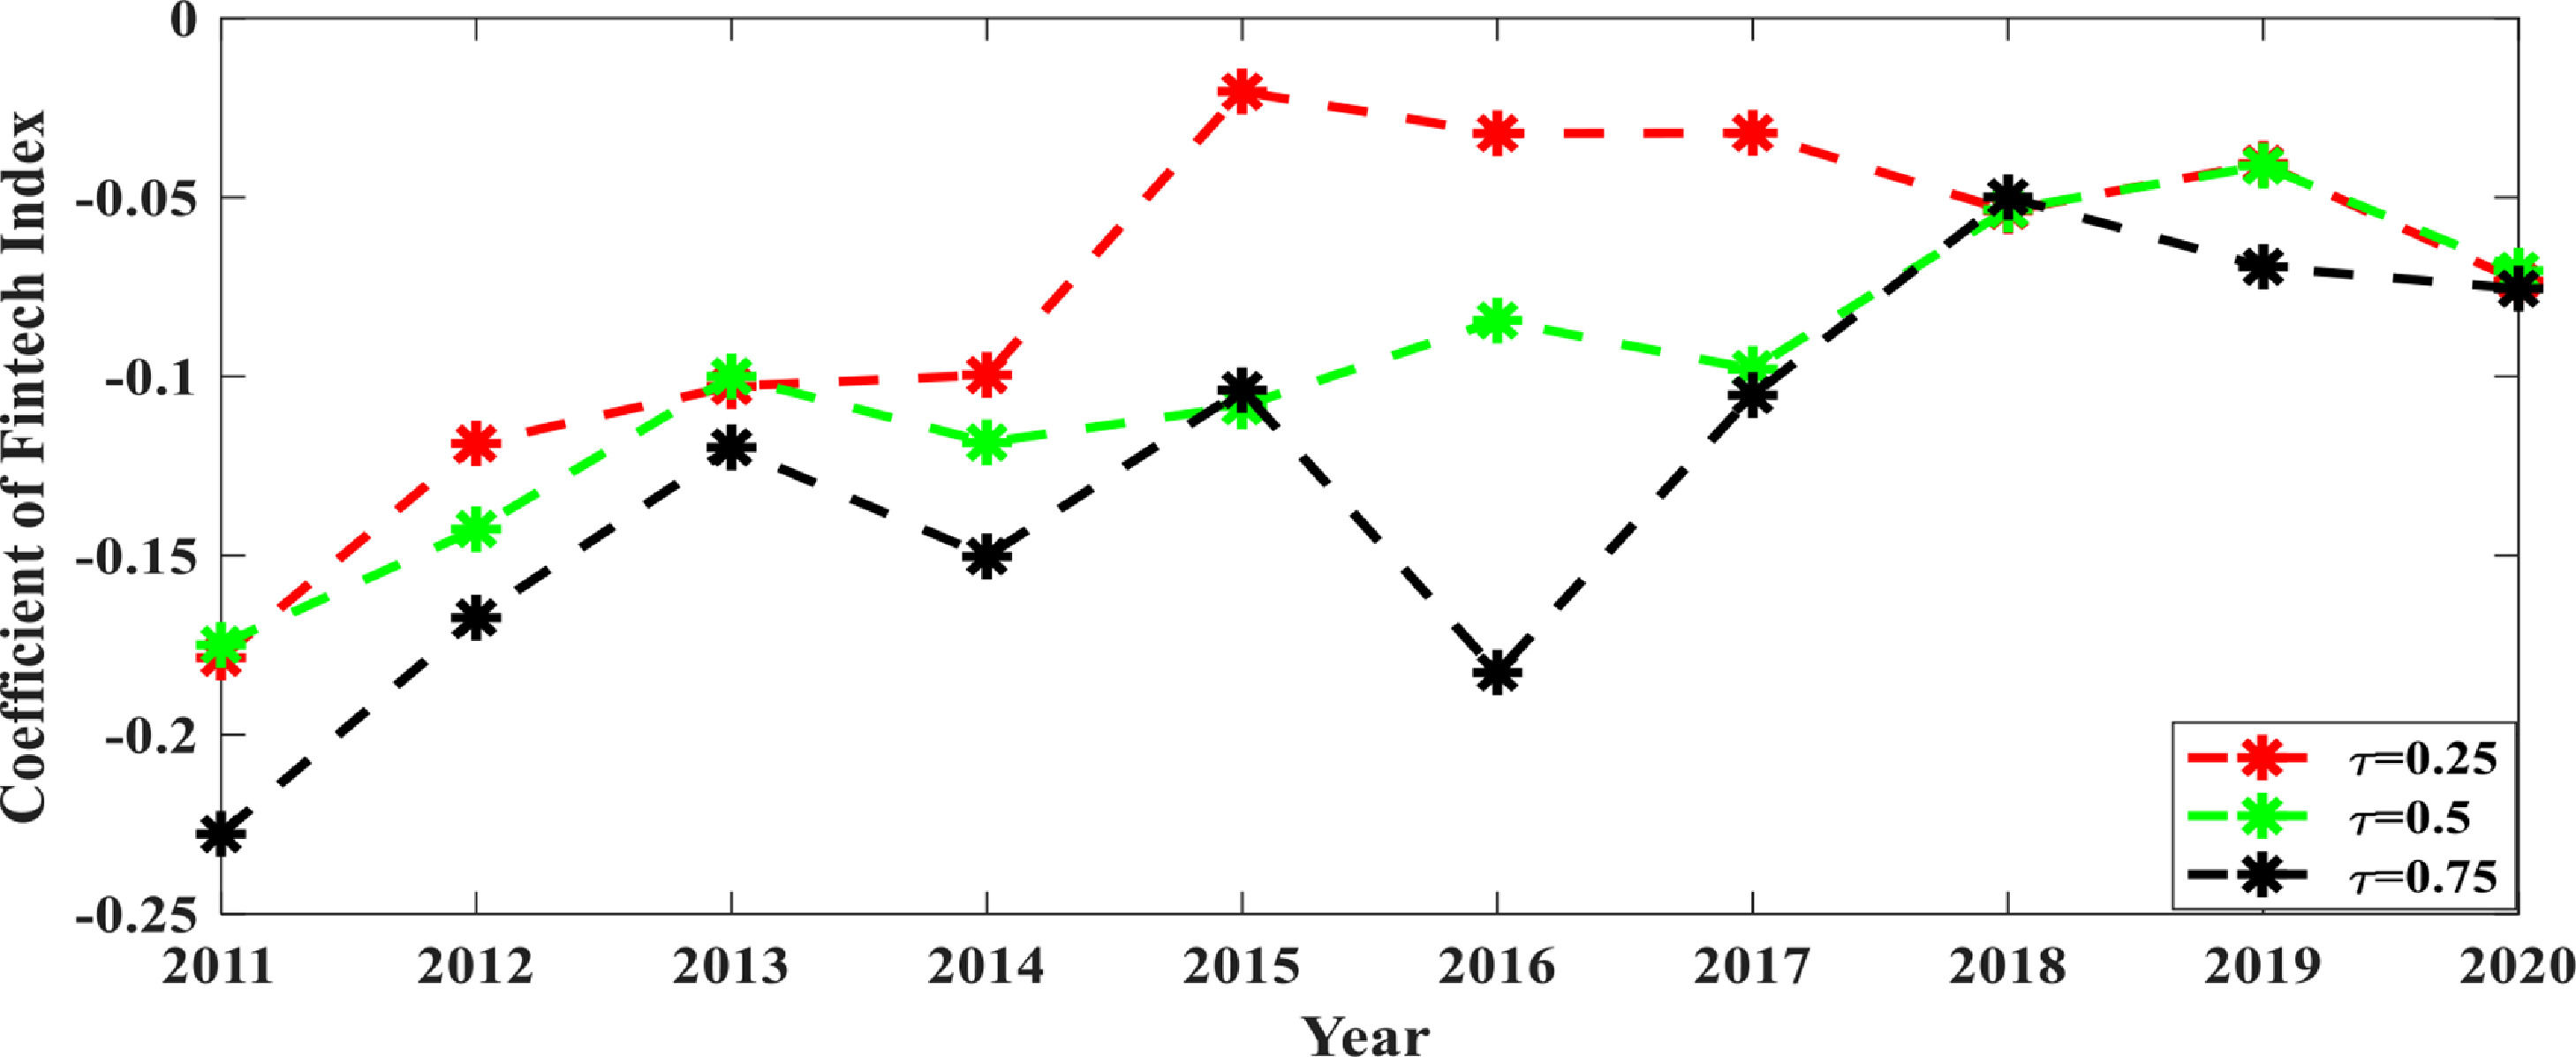
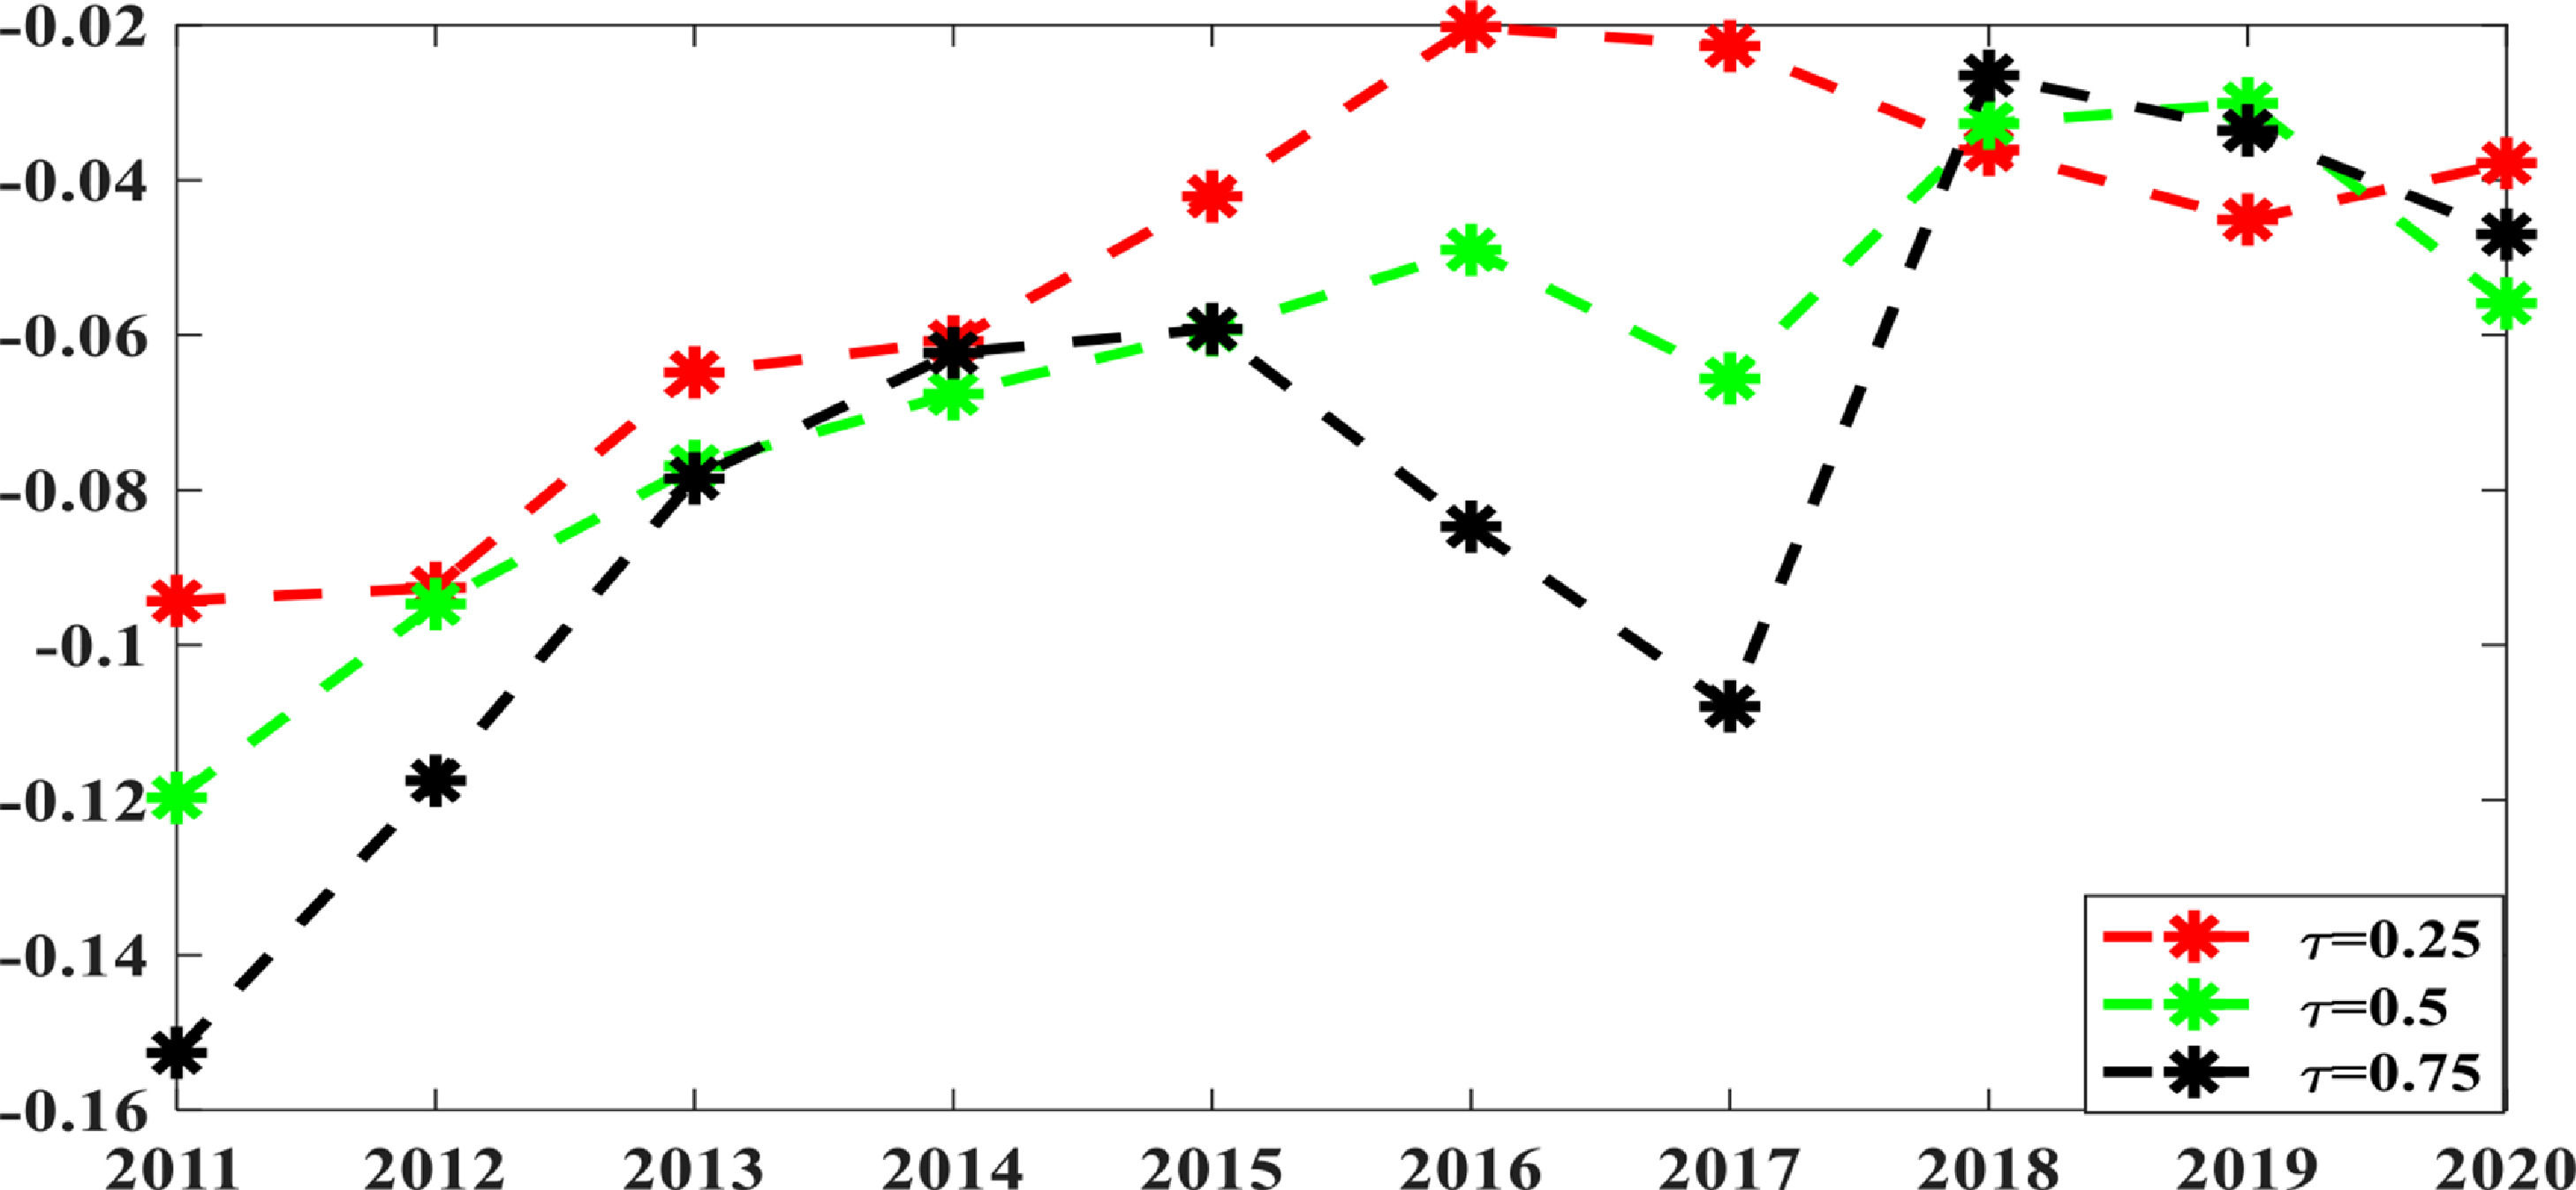
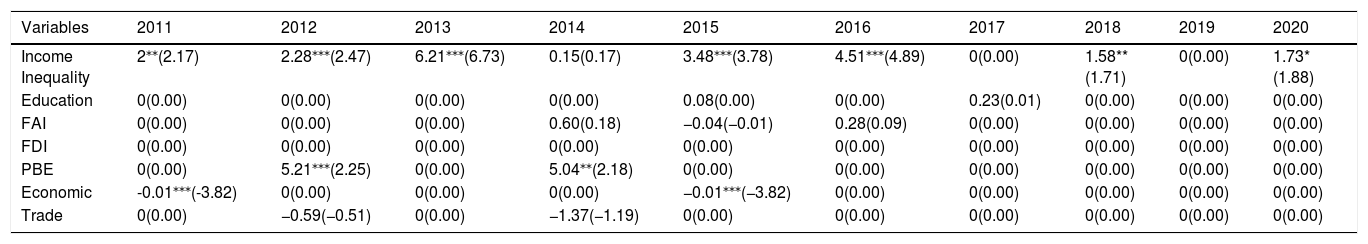
Empirical analysisMain resultsBased on the presence of heterogeneity among the provincial regions, we propose GLpSVQR to examine the potentially differential effects of fintech on poverty alleviation in China. The quantile parameter is chosen from the set {0.25,0.50,0.75}. Fig. 5 provides the regression coefficients of the fintech index, when τ = 0.25, 0.5, and 0.75. Other quantile regression results at different quantile levels are listed in Tables 3-5. The variable selection results are shown in Fig. 6. Figs. 7-8 show the empirical NMSE and R2 results at different quantile levels.

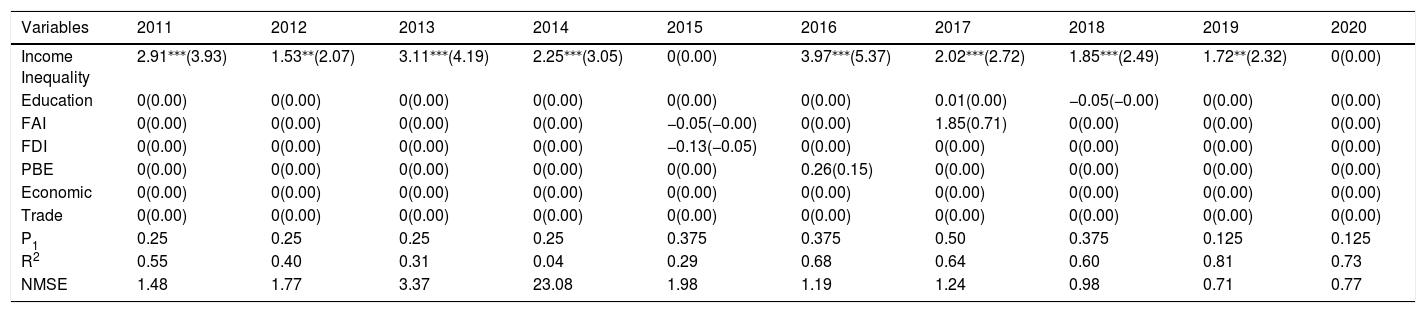
Support vector quantile regression results at 0.25 quantile level.
∗, ∗∗, and ∗∗∗ indicate significance at the 0.10, 0.05, and 0.01 levels, respectively.
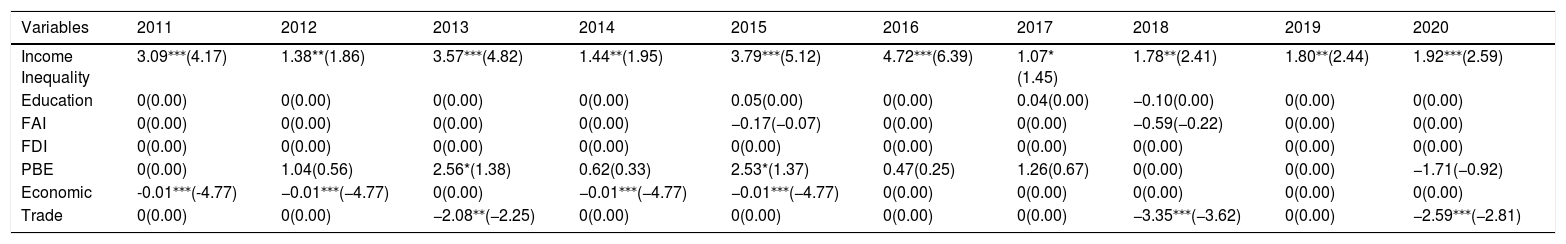
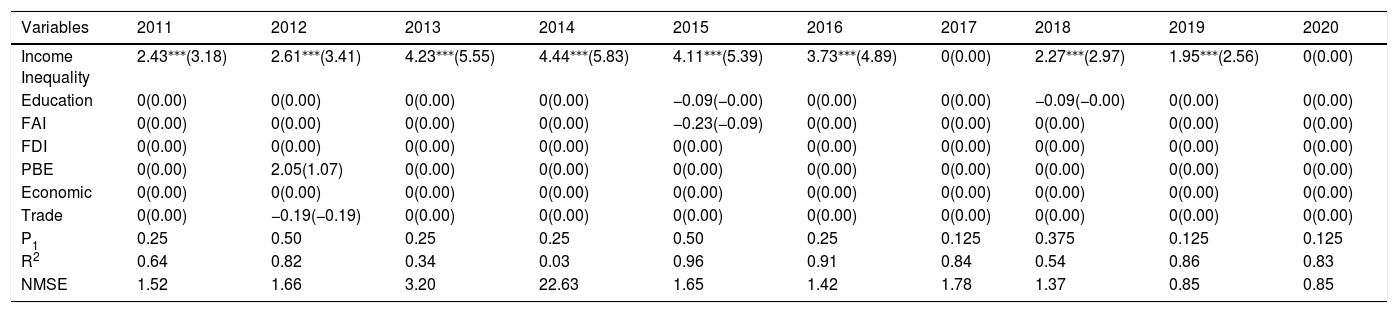
Support vector quantile regression results at 0.5 quantile level.
∗, ∗∗, and ∗∗∗ indicate significance at the 0.10, 0.05, and 0.01 levels, respectively.
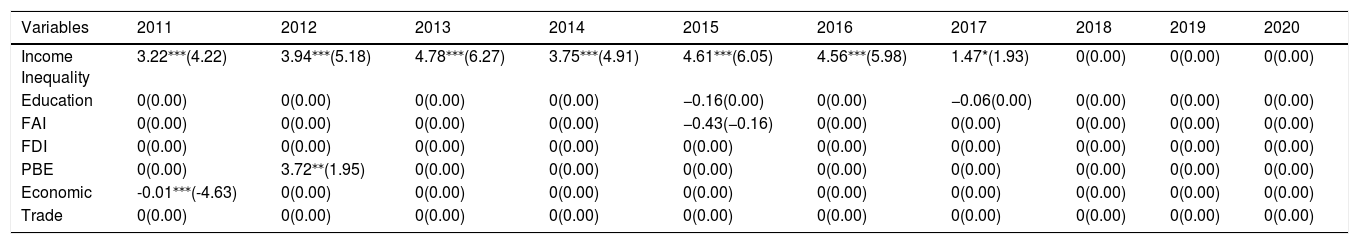
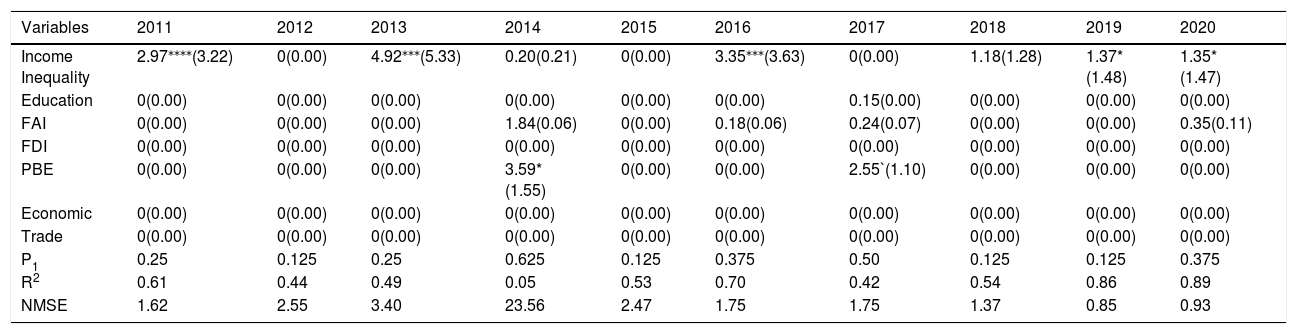
Support vector quantile regression results at 0.75 quantile level.
∗, ∗∗, and ∗∗∗ indicate significance at the 0.10, 0.05, and 0.01 levels, respectively.
 at different quantile levels.")


In Fig. 5, the red regression coefficient curve with periodicity, representing the high-income provinces, fluctuates at around −0.1. The green regression coefficient curve with periodicity, representing the moderate-income provinces, fluctuates at around −0.15. The black regression coefficient curve, representing the low-income provinces, fluctuates at around −0.2. The coefficients of fintech at different quantile levels are negative, indicating that fintech reduces poverty in all provinces of China. The estimated coefficients suggest that one-point increase in fintech adoption in a province results in a 10–20% decline in poverty reduction. Moreover, from the trends of these three regression coefficient curves, we find that the absolute values of the regression coefficient have decreased in recent years.
The findings obtained from Fig. 5 have several meaningful interpretations. First, the negative coefficients of fintech suggest that the fintech development has positive effects on poverty reduction. Second, the impact of fintech development on poverty reduction among provincial regions has decreased in the last three years. Third, different fintech quantile levels have different impacts on poverty alleviation, which indicates that the effects of fintech on poverty reduction across regions are heterogeneous. Finally, the poverty-reducing impact is stronger in low-income provinces than in high-income provinces. In other words, fintech in less developed provinces plays a more significant role in alleviating poverty than in high-income provinces since fintech development provides easier access to financial services, and reduces transaction costs, information asymmetry, and household risk (Zhang et al., 2019; Wang & He, 2020; Appiah-Otoo & Song, 2021; Giaretta & Chesini, 2021).
Tables 3-5 show that income inequality is selected in every quantile regression process. The positive coefficients and t-statistic value of income inequality indicate that the income inequality significantly influences poverty. These results imply that income inequality worsens the poverty situation in China. Moreover, the coefficients and t-statistic value in Tables 3-5 also indicate that economic level, trade, education, fixed asset investments, foreign direct investment, and public budget expenditures insignificantly influence poverty in most regression cases. Fig. 6 shows the proportion of nonzero estimated coefficients (P1) to evaluate the variable selection ability of GLpSVQR, which indicates that GLpSVQR selects a few variables in every regression process. Fig. 7 and Fig. 8 show the regression results of R2 and NMSE, respectively. From Figs. 6-8, we find that GLpSVQR selects a few variables in every regression process with large R2 values and small NMSE values. Thus, the very few variables selected by GLpSVQR capture useful statistical information from the samples which indicate that the proposed GLpSVQR is an effective method for solving the representative variable selection problem.
Robustness test resultsTo test the robustness of our results, we use the poverty gap (PG) as an alternative measure of poverty. The poverty gap is defined as follows:

Where H is the poverty headcount ration data, and I is the gap ratio. I is defined as follows:
where CI is urban per capita disposable income of residents, and RI is rural per capita disposable income. The measurements of independent our variables are unchanged.
The results of the proposed support vector quantile regression are reported in Fig. 9 and Tables 6-8. Fig. 9 shows the coefficients of the fintech index when τ=0.25,0.5, and 0.75. The red regression curve with periodicity, which represents the high-income provinces, fluctuates around -0.04. The black regression coefficient curve with periodicity, which represents the low-income provinces, fluctuates around -0.1. These results are consistent with those in Fig. 5, indicating that an increase in the development of fintech is associated with a decrease in poverty at different quantile levels. In summary, these results indicate that in each region, the development of fintech significantly reduces poverty. Tables 6-8 present the results of the proposed quantile regression when τ=0.25,0.5, and 0.75. The variable selection results of GLpSVQR in Tables 6-8 are in line with the results in Tables 3-5. The small values of NMSE and large R2 also indicate that the relevant statistical information is well captured by GLpSVQR with a few selected variables.

Re-estimation of the quantile regression results at 0.25 quantile level.
∗, ∗∗, and ∗∗∗ indicate significance at the 0.10, 0.05, and 0.01 levels, respectively.
Re-estimation of the quantile regression results at 0.5 quantile level.
∗, ∗∗, and ∗∗∗ indicate significance at the 0.10, 0.05, and 0.01 levels, respectively.
Re-estimation of the quantile regression results at 0.75 quantile level.
∗, ∗∗, and ∗∗∗ indicate significance at the 0.10, 0.05, and 0.01 levels, respectively.
This paper was undertaken to investigate the interrelationship between fintech and poverty alleviation in 31 Chinese provinces. We adopted web crawler technology and word frequency analysis to create new variables that reflect the technological finance technological level of the finance sector and then used the normalization and aggregation methodology to construct a fintech index for each Chinese province. The clustering results of fintech index in China indicated the uneven fintech development among provincial regions. To address the presence of heterogeneity among various provincial regions, we proposed a novel sparse support vector quantile regression to investigate whether the development of fintech across provinces impacts poverty reduction. The findings provided in this paper show that fintech has been an important driver of poverty alleviation in every province of China, corroborating previous studies such as Appiah-Otoo and Song (2021) and Wang and He (2020). Moreover, the effects of fintech on poverty reduction have been much stronger in low-income provinces than in high-income provinces. In specific, one-point increase in fintech adoption in the high-income provinces results in 10% decline in poverty, while that in the low-income provinces results in 20% decline.
Our meaningful research results have important policy implications. First, financial sector policies aimed at reducing poverty in China should emphasizes building more digital financial technology systems, such as through the widespread adoption of artificial intelligence, blockchain technology, cloud computing, and big data (Cheng & Qu, 2020). Second, due to the stronger effects of fintech on poverty reduction in low-income provinces, policy-makers and practitioners should prioritize increasing investment in digital financial technology systems in regions with low fintech development, especially in Ningxia, Qinghai, and Gansu. The expansion of access to financial services significantly alleviates poverty in low-income provinces. Third, policy makers should encourage financial technology innovation which benefits low-income groups directly by expanding access to financial services. Finally, financial knowledge is as important as infrastructure and should be transferred, especially in rural areas.
Similar to other empirical research, this paper has limitations that should be acknowledged. First, this study measures levels of financial technology development by using web crawler technology and word frequency analysis to search for fintech-related keywords in the financial operation reports of every province in China. However, these financial operation reports come from the website of the People's Bank of China. Future research must use different sources that reflect fintech development level. Second, the proposed sparse quantile regression method can solve the heterogeneity problems of regressions since it involves a class of empirical “location” measures for the dependent variable. However, the regression coefficients were estimated year by year, preventing an analysis of relationships between years. Thus, the dynamic sparse quantile regression method should be proposed in future studies.
This work is supported by Philosophy and Social Sciences Leading Talent Training Project of Zhejiang Province (No. 21YJRC07-1YB).