


This study starts out from two premises. Firstly, previous studies show that the quality of traditional services can be perceived differently by different customers. Secondly, in the electronic services area some researchers have used the sociodemographic profile of the Internet user to explain the differences in their online behavior. In the light of this, our study analyze whether the perceived quality of electronic services can vary depending on the sociodemographic and web-graphics characteristics of the online consumer (age, gender, level of education, and frequency of Internet use). The responses were obtained from 267 online consumers who have experienced a problem during the online service delivery (service encounters with incidents). The results show (1) the reliability dimension is that which is best valued, while the service recovery has the worst performance, (2) the perceived quality of service is relatively homogenous between the different groups of online buyers, and (3) the measurement invariance of the measurements is demonstrated.
Este estudio tiene su punto de partida en 2 premisas. En primer lugar, previos estudios muestran que la calidad de los servicios tradicionales puede ser percibida de forma distinta por los consumidores. En segundo lugar, en el área de los servicios electrónicos, algunos investigadores han utilizado el perfil sociodemográfico del usuario de Internet para explicar las diferencias en su comportamiento online. En base a esto, nuestro estudio analiza si la calidad percibida de los servicios electrónicos puede variar según las características sociodemográficas y web-gráficas de los consumidores online (género, edad, nivel de educación y frecuencia de uso de Internet). Las respuestas se obtuvieron de una muestra de 267 consumidores que habían tenido algún problema durante la prestación del servicio (encuentros de servicio con incidentes). Los resultados muestran que: a)la dimensión fiabilidad es la mejor evaluada, mientras que la recuperación del servicio tuvo el peor desempeño; b)la calidad de servicio percibida es relativamente homogénea entre los diferentes grupos de compradores online, y c)se confirma la invarianza de medida de las escalas utilizadas.
The percentage of Internet users who make purchases is growing and there are many companies with an online presence who use the Internet as a new platform to provide their services. Specifically, 40% of the population of the EU 27 has purchased goods or services through the Internet (Eurostat, 2011). This volume of business generated by the B2C e-commerce accounts for 14% of the total turnover of companies in these countries. In addition, 70% of households and 85% of companies in the EU 27 are connected to the Web (Eurostat, 2011).
Typically, online customers can more easily compare alternatives than offline customers and a competing offer is just a few clicks away on the Internet (Shankar, Smith, & Rangaswamy, 2003). Add to that that online consumers have a wider range of choices in selecting products and services, and highly competitive prices. As a result, competition between different Websites is high in order to attract the users’ attention and make them repeat a visit. In this situation, it is generally not easy for online retailers to gain competitive advantages based solely on a cost leadership strategy (Jun, Yang, & Kim, 2004). Many researchers point out that to deliver a superior service quality is one of the key determinants of online retailers’ success (Zeithaml, Parasuraman, & Malhotra, 2002) and it is a major driving force on the route to long-term success (Fassnacht & Koese, 2006).
To set out which aspects must be evaluated in the service quality, many researchers have used the service encounter approach (Bitner, 1990; Bitner, Booms, & Tetrault, 1990; etc.). Shostack (1985: p. 243) defines the term service encounter as “a period of time during which a consumer directly interacts with a service”. This definition encompasses all aspects of the service firm with which the consumer may interact, including its personnel, its physical facilities and other tangible elements, during a given period of time. Shostack (1985) does not limit the encounter to the interpersonal interactions between the customer and the firm. In fact, she suggests that service encounters can occur without any human interaction element. This view of a service encounter is still valid in the online services context. In the evaluation of e-service quality, it is necessary to consider all the cues and encounters that occur before, during and after the transactions (Zeithaml et al., 2002). Specifically, two different service encounters can take place in the context of Internet: (1) service encounters with non-interpersonal interactions, during which customers get the service for themselves, without the presence of employees (service encounter without incidents) and (2) service encounters with interpersonal and non-interpersonal interactions. Generally, the interactions with a member of the organization take place when a customer needs to solve any problem or doubt that may arise during the service delivery (service encounter with incidents). However, most of the papers that appear in the literature are performed in service encounters without incidents.
On the one hand, in the area of traditional services, the literature shows that the perception of the service quality can significantly differ from one customer to another and, consequently, so can their satisfaction and future behavior (Kwan & Jing, 1994; Sánchez, Sánchez, Marín, & Gázquez, 2007). Customers can even differently perceive the attributes which make up the service quality. For example, McDougall and Levesque (1994) show that in the evaluation of the service quality a bank offers, we can find two types of customers: those who give more importance to the provision of services without mistakes and the high competence of the employees and those who value more the bank having a convenient schedule and a good location. Likewise, different studies also suggest that the degree of satisfaction or loyalty to a service varies depending on the type of customer (Bryant & Cha, 1996; Mittal & Kamakura, 2001; Naylor & Kleiser, 2002; Patterson, 2007; Yuksel & Yuksel, 2002).
In the context of electronic services, many works have analyzed whether the Internet user's sociodemographic profile is related to their purchasing behavior on the Internet (e.g., Chang & Samuel, 2004; Donthu & García, 1999; Swinyard & Smith, 2003; etc.). Three types of behavior can be roughly distinguished. On the one hand, there are those Internet users who shop online (online shoppers). On the other hand, there are those who reject this kind of activity (online non-shoppers). Moreover, within the segment of Internet users who are not shoppers, we can tell two types of users: those who frequently use Internet although they do not purchase (browser behavior) and those who use Internet infrequently and generally have trouble doing so (reluctant to Internet). The literature shows that there are significant differences between these segments based on their sociodemographic characteristics (e.g., Bhatnagar & Ghose, 2004; Swinyard & Smith, 2003; etc.). However, the articles that explore the role that demographic characteristics play in the evaluation of the service quality of a Website are very scarce. Facing this situation, the main purpose of this work is to go deeply into the usefulness of these variables to examine whether there are differences in consumer's electronic service quality perceptions in service encounters with incidents.
The article is structured as follows. First, we review the most relevant research about the electronic service quality literature. We describe the sample and measures used in the study. Then, we show the results of the empirical research. Finally, we discuss the conclusions and implications for management, the limitations and future research.
Theoretical backgroundElectronic service qualityThe application of technology in services provisions also means the appearance of a new concept: electronic services. The contributions which have been made in the literature about the study of electronic services originate in the areas of marketing services (e.g., Janda, Trocchia, & Gwinner, 2002), of electronic commerce (e.g., Yoo & Donthu, 2001), of research about information systems (e.g., Aladwani & Palvia, 2002) or in works which are centered on the technology acceptation model (TAM) (e.g., Davis, 1989; Davis, Bagozzi, & Warshaw, 1989; etc.). Although there is not a commonly accepted definition about the electronic services concept (Fassnacht & Koese, 2006), some have been proposed in the literature. For example, Rust (2001) defines the concept as “that service which is offered by an organization through an electronic system” (p. 283). Colby and Parasuraman (2003) suggest that “electronic services are services offered by an electronic means –normally Internet – and which refer to transactions begun and to a great extent controlled by the consumer” (p. 28). Fassnacht and Koese (2006) state that they are “those services that are offered using information and communication technologies in which the consumer only interacts with a user's interface” (p. 23). In these definitions two basic properties of electronic services stand out. Firstly, they are services which are offered through an electronic system – e.g., ATMs, telephonic banking, automatic billing in hotels through an interactive television, vending machines, etc. Secondly, electronic services are technological self-services or self-services based on technology (SSTs) (Bitner, Brown, & Meuter, 2000; Dabholkar, 1996, 2000; Meuter, Ostrom, Roundtree, & Bitner, 2000). Customers begin and control the transaction performing active roles in the services provisions, in such a way that they are able to obtain the product or the service by themselves, even managing to get by without employees who attend the public. Nevertheless, some customers prefer interaction with employees, considering the service encounter as a social experience (Zeithaml & Gilly, 1987).
The delivery of these electronic services offers benefits for both firms and customers. The use of technology enables the service provider to have a standardized service delivery, reduced labor costs, to expand the delivery options (Curran & Meuter, 2005) and to improve productivity and convenience for their employees and customers (La & Kandampully, 2002). However, the infusion of technology can also raise concerns of privacy, confidentiality and the receipt of unsolicited communications (Bitner et al., 2000). Some studies have analyzed the factors that contribute to (or not) the use of an SST. For example, the ease of use and usefulness are critical constructs that influence an individual's attitude toward a technology (Davis, 1989). Curran and Meuter (2005) propose four antecedents for attitudes toward the SSTs: ease of use, usefulness, risk and need for interaction. Dabholkar (1996) also found control and waiting time to be important determinants for using an SST. More recently, Belanche, Casaló, and Flavián (2011) suggest that the use of online services is determined by the perceived usefulness, the attitude toward its use and the perceived control. Consumers will weigh up these advantages and disadvantages when deciding whether or not to use an SST. Internet has become one primary type of SST.
Since the pioneering work of Zeithaml et al. (2002), the quality of online services has been explored in some depth. Parasuraman, Zeithaml, and Berry (1985) suggest that service quality is an abstract and elusive construct because of three features that are unique to services: the intangibility, heterogeneity and inseparability of production and consumption. The best-known approach for measuring service quality is the SERVQUAL model (Parasuraman, Zeithaml, & Berry, 1988). The original five dimensions of SERVQUAL are tangibles, reliability, responsiveness, assurance and empathy. Some academic researchers have extended the SERVQUAL dimensions to the online context (Kaynama & Black, 2000; Sánchez-Franco & Villarejo, 2004). However, traditional theories and concepts about service quality cannot be directly applied to the online context due to the important differences between the two settings. First, the service quality literature is dominated by people-delivered services, while in online services, human-to-human interactions are substituted by customer-to-Website interactions (Parasuraman, Zeithaml, & Malhotra, 2005). Therefore, responsiveness and empathy dimensions can be evaluated only when the online customer contacts a member of the organization. Second, although reliability and security dimensions may be useful, tangibles are irrelevant as the customer only interacts with the Website. Third, new dimensions are relevant, such as Website design or information quality. Fourth, if the evaluation of the quality of a traditional service is going to depend especially on the personnel in charge of the service provision, the quality of the services which are offered through Internet are going to largely depend on the consumers themselves and their interaction with the Website (Fassnacht & Koese, 2006). Fifth, compared to the traditional quality of service, the e-service quality is an evaluation which is more cognitive than emotional (Zeithaml, Parasuraman, & Malhotra, 2000). In this way, these authors state that negative emotions such as annoyance and frustration are less strongly shown than in the quality of the traditional service, while positive feelings of affection or attachment which exist in traditional services do not appear in the Internet context.
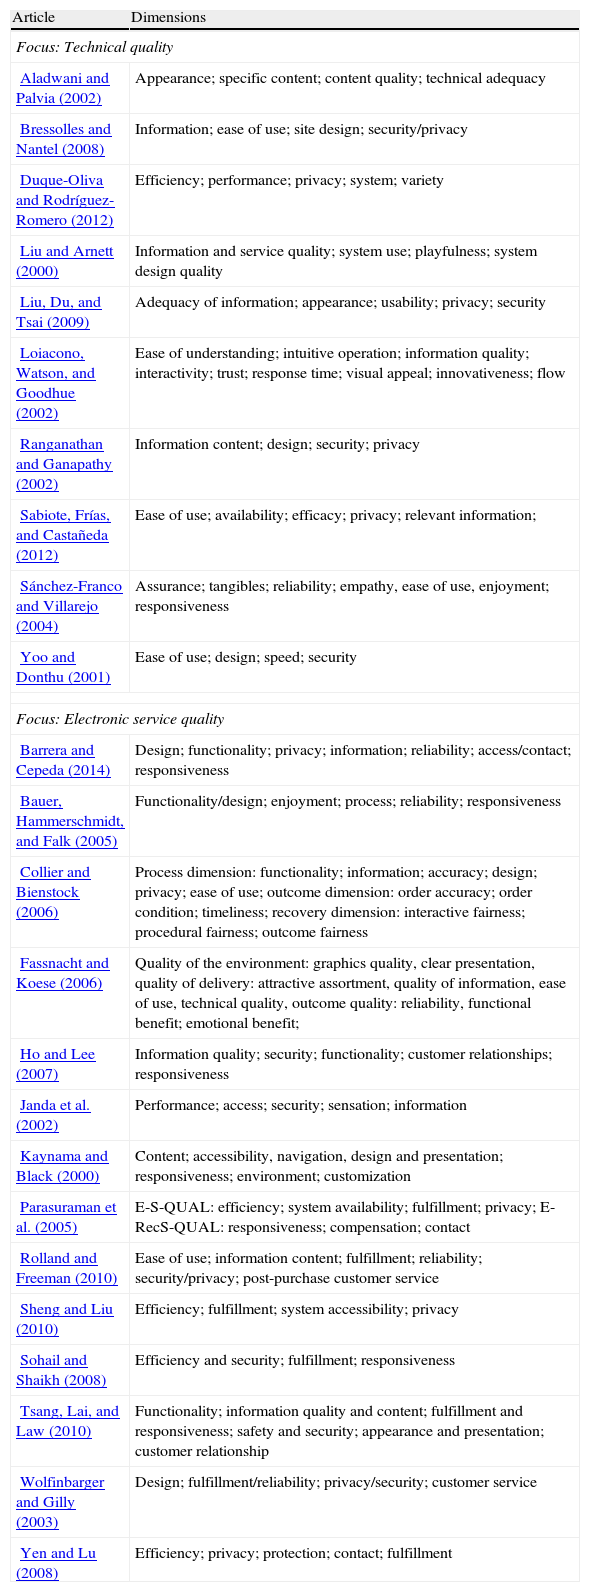
Various conclusions can be inferred from reviewing the literature: (1) the e-service quality is a multidimensional construct (Zeithaml et al., 2000) whose measurement must gather the evaluation of the interaction with the Website, the evaluation carried out by the customer of the product or service received and, if any problem arises, how the Website of the online firm handles it (Collier & Bienstock, 2006). Although most researchers are in favor of the evaluation of this latter aspect, Fassnacht and Koese (2006) state that we should not evaluate the human interaction which can take place in the electronic services provisions, given their self-service nature. (2) There are basically two approaches when tackling the conceptualization and measurement of e-service quality (Table 1). The epicenter of the first approach is the technical characteristics of the Website (technical quality). The first studies about Internet service quality belong to this first group. They centered uniquely on the interaction that takes place between the customer and the Website. None of these research works gathers all the aspects of the online purchasing process and therefore they do not carry out a complete evaluation of e-service quality. The main proposal of these measurement instruments is to generate information for the site designers, more than measuring the quality of the service which customers perceive (Parasuraman et al., 2005). This weakness is the main motive for the appearance of the second approach (service quality) which offers a more complete vision of the field of the e-service quality construct. The dimensions and the measurement instruments gather not only the technical aspects of the Website, but also how the customers perceive the quality of the product or service received and how their problems or doubts were solved during the service provision. (3) The researchers do not agree when identifying the dimensions of the quality of an electronic service. Moreover, the meaning, the importance and the items of the same dimension vary from one study to another. These differences are partly due to the scales being focused on one service in particular. (4) The evaluation of e-service quality is carried out at different levels of abstraction depending on the study. Most researchers offer a set of dimensions (first order constructs) and a series of indicators to measure each of them (e.g., Ho & Lee, 2007). However, other authors propose second order hierarchical models (Wolfinbarger & Gilly, 2003), or even third order models (Fassnacht & Koese, 2006). (5) Some authors propose scales in which problem solving does not appear (e.g., Liu et al., 2009) or is evaluated for the whole sample (e.g., Wolfinbarger & Gilly, 2003). However, this last aspect must only be evaluated by those people who had problems during the transaction (Collier & Bienstock, 2006; Parasuraman et al., 2005). Following the literature review, the dimensions proposed to evaluate e-service quality are: design, functionality, privacy, reliability and recovery. These dimensions are herewith defined and explained.
Online service quality scales in previous studies.
| Article | Dimensions |
| Focus: Technical quality | |
| Aladwani and Palvia (2002) | Appearance; specific content; content quality; technical adequacy |
| Bressolles and Nantel (2008) | Information; ease of use; site design; security/privacy |
| Duque-Oliva and Rodríguez-Romero (2012) | Efficiency; performance; privacy; system; variety |
| Liu and Arnett (2000) | Information and service quality; system use; playfulness; system design quality |
| Liu, Du, and Tsai (2009) | Adequacy of information; appearance; usability; privacy; security |
| Loiacono, Watson, and Goodhue (2002) | Ease of understanding; intuitive operation; information quality; interactivity; trust; response time; visual appeal; innovativeness; flow |
| Ranganathan and Ganapathy (2002) | Information content; design; security; privacy |
| Sabiote, Frías, and Castañeda (2012) | Ease of use; availability; efficacy; privacy; relevant information; |
| Sánchez-Franco and Villarejo (2004) | Assurance; tangibles; reliability; empathy, ease of use, enjoyment; responsiveness |
| Yoo and Donthu (2001) | Ease of use; design; speed; security |
| Focus: Electronic service quality | |
| Barrera and Cepeda (2014) | Design; functionality; privacy; information; reliability; access/contact; responsiveness |
| Bauer, Hammerschmidt, and Falk (2005) | Functionality/design; enjoyment; process; reliability; responsiveness |
| Collier and Bienstock (2006) | Process dimension: functionality; information; accuracy; design; privacy; ease of use; outcome dimension: order accuracy; order condition; timeliness; recovery dimension: interactive fairness; procedural fairness; outcome fairness |
| Fassnacht and Koese (2006) | Quality of the environment: graphics quality, clear presentation, quality of delivery: attractive assortment, quality of information, ease of use, technical quality, outcome quality: reliability, functional benefit; emotional benefit; |
| Ho and Lee (2007) | Information quality; security; functionality; customer relationships; responsiveness |
| Janda et al. (2002) | Performance; access; security; sensation; information |
| Kaynama and Black (2000) | Content; accessibility, navigation, design and presentation; responsiveness; environment; customization |
| Parasuraman et al. (2005) | E-S-QUAL: efficiency; system availability; fulfillment; privacy; E-RecS-QUAL: responsiveness; compensation; contact |
| Rolland and Freeman (2010) | Ease of use; information content; fulfillment; reliability; security/privacy; post-purchase customer service |
| Sheng and Liu (2010) | Efficiency; fulfillment; system accessibility; privacy |
| Sohail and Shaikh (2008) | Efficiency and security; fulfillment; responsiveness |
| Tsang, Lai, and Law (2010) | Functionality; information quality and content; fulfillment and responsiveness; safety and security; appearance and presentation; customer relationship |
| Wolfinbarger and Gilly (2003) | Design; fulfillment/reliability; privacy/security; customer service |
| Yen and Lu (2008) | Efficiency; privacy; protection; contact; fulfillment |
The design of a Website plays an important role in attracting, sustaining and retaining the interest of a customer in a site (Ranganathan & Ganapathy, 2002). Numerous studies in the literature consider the Website design as a dimension of e-service quality (Aladwani & Palvia, 2002; Liu et al., 2009; Loiacono et al., 2002; Yoo & Donthu, 2001; etc.). The literature review about the key factors of a Website design highlights three important issues: attractiveness, proper fonts and proper colors. Although it has sometimes been regarded as a purely esthetic element, prior studies have demonstrated the influence of Website design on site revisit intention (Yoo & Donthu, 2001), customer satisfaction (Tsang et al., 2010) and loyalty intentions (Wolfinbarger & Gilly, 2003).
FunctionalityFunctionality refers to the correct technical functioning of the Website. It is one of the most basic requirements for any kind of Website and its meaning is closely related to the dimensions of the system availability (Parasuraman et al., 2005), or technical adequacy (Aladwani & Palvia, 2002). The five items of functionality that we considered were: always up and available, has valid links, loads quickly, enables us to get on to it quickly and makes it easy and fast to get anywhere on the site. Its impact on online customers’ higher-order evaluations pertaining to Websites has also been observed. For example, Tsang et al. (2010) conducted an investigation in the travel online context in which functionality was found to be the most important dimension in increasing customer satisfaction.
PrivacyWebsites are usually collecting and storing large amounts of data concerning their users’ activities, user evaluations of online questionnaires or personal data (Tan, Qin, Kim, & Hsu, 2012). As a result, one of the aspects that most concern online consumers is the privacy of personal information (ONTSI, 2012). In our study, privacy refers to the degree to which the customer believes that the site is safe from intrusion and personal information is protected (Parasuraman et al., 2005; p. 219). The privacy of a Website should be reflected through symbols and messages to ensure the security of payment and the customer's personal information not being shared with other companies or Internet sites. As such, there appears to be a high degree of support for privacy as an important e-service quality dimension and it was found to be one of the most significant dimensions in increasing customer satisfaction (Janda et al., 2002).
ReliabilityThe evaluation of service delivered quality has been carried out with the dimensions of: fulfillment/reliability (Wolfinbarger & Gilly, 2003), reliability (Yang & Jun, 2002), performance (Janda et al., 2002), fulfillment (Parasuraman et al., 2005), etc. Congruent with these articles, our study considers reliability as an important dimension of e-service quality. Moreover, in the context of online services, the information made available by the Websites is an important component of the service delivered. Therefore, reliability refers to the accuracy of the service delivered by the company, the billing process being correct and the information that appears on the Website being clear, current and complete. The service delivered quality or reliability has been empirically shown to have a strong impact on customer satisfaction and quality, and the second strongest predictor of loyalty intentions and attitudes toward the Website (Wolfinbarger & Gilly, 2003).
RecoveryAn essential aspect in the evaluation of the quality of an electronic service is the way in which the company solves problems or doubts which may arise during its provision. There is no doubt that errors in the electronic service provision cause the loss of customers in many cases and a negative word of mouth. What is more, the physical separation between the customer and the supplier and the fact that customers can choose another company with a simple click accentuates the importance of solving these mistakes even more (Collier & Bienstock, 2006). Different dimensions have been proposed in the literature to evaluate this aspect: responsiveness (Zeithaml et al., 2000), customer attention (Wolfinbarger & Gilly, 2003), communication (Cai & Jun, 2003), access (Yang & Jun, 2002), etc. In our study, service recovery refers to the customer's capacity to communicate with the organization and how any problem or doubt that may arise is solved. Thus, the Website should show its street, e-mail, phone or fax numbers, the customer service must be available 24h a day/7days a week and the response to the customer's inquiries must be quick and satisfactory. Moreover, this latter measure should only be evaluated by individuals who needed help or the solving of a problem.
Socio-demographic profile and use of InternetThe study of the relationships between the sociodemographic profile and the use of new technologies has been tackled quite thoroughly. Thus, Zeithaml and Gilly (1987) show that younger people (“nonelderly”) are more inclined to accept the use of new technologies while a greater rejection occurs with older people (“elderly”). However, a much more interesting question is to analyze if the sociodemographic profile is related to the behavior of Internet shopping (Chang & Samuel, 2004). Amongst the variables most used, those which stand out are gender, age, the level of studies, the number of inhabitants of the population or the income level. In this sense, previous research suggests that online consumers, unlike non-buyers, are mostly male (Chang & Samuel, 2004; Study on e-commerce B2C 2009 – ONTSI; Vrechopoulos, Siomkos, & Doudikis, 2001), have higher incomes and a higher educational level (Allred, Smith, & Swinyard, 2006; Donthu & García, 1999; Study on e-commerce B2C 2012 – ONTSI; Swinyard & Smith, 2003). Donthu and García (1999) uphold that online shoppers are older than non-shoppers, while the works of Swinyard and Smith (2003) and Allred et al. (2006) argue the opposite. These conclusions depend on the sociodemographic profile of the samples gathered in each work. Furthermore, some studies clearly show that online shoppers who buy more frequently tend to be men with high incomes (Chang & Samuel, 2004; Fuentes & Gil, 2011).
While demographic information is useful, this alone provides little diagnostic information about Web users (Bhatnagar & Ghose, 2004). Thus, in the research on electronic commerce so-called webgraphics have also been used, among which stand out experience with Internet use and the level of knowledge of Internet. As a result, people who use Internet more frequently are more prone to shop in this way (Allred et al., 2006; Bhatnagar & Ghose, 2004; Fuentes & Gil, 2011; Ruiz & Sanz, 2006; Swinyard & Smith, 2003). To sum up, the literature shows that the behavior of online shopping is determined by the Internet user's sociodemographic profile. Therefore, we expect that:Hypothesis 1 The evaluation of the electronic service quality perceived is going to differ according to gender. The evaluation of the electronic service quality perceived is going to differ according to age. The evaluation of the electronic service quality perceived is going to differ according to the level of education. The evaluation of the electronic service quality perceived is going to differ according to the frequency of Internet use.
Based on the previous research discussed above, we use five dimensions to evaluate electronic service quality: design, functionality, privacy, reliability and recovery. The scales proposed are based on previous studies and the items aim to collect the full meaning of each dimension (see Appendix). The survey instrument contains 24 items and it is based on a 7-point Likert-type scale which ranges from strongly disagree to strongly agree.
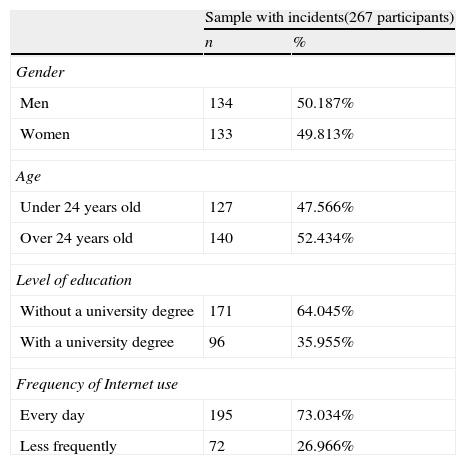
Data collectionData collection was obtained from a convenience and snowball sample of online customers. An invitation soliciting participants for this study was sent via emails. From these invitation emails, the respondents were able to access the Website where the online questionnaire was posted and they were asked to forward this invitation to their friends and relatives. This approach is particularly appropriate for e-service quality studies (Tsang et al., 2010). The fieldwork took place from April to June 2012, and we select 267 questionnaires where the respondents said that they had a problem or doubt during the online service delivery. The profile of the online shopper in our sample closely relates to the profile of the online shopper that appears in the ‘B2C e-commerce Survey – ONTSI (2012)’. This shows the adequacy of the sample (Table 2).
Profile of the participants.
| Sample with incidents(267 participants) | ||
| n | % | |
| Gender | ||
| Men | 134 | 50.187% |
| Women | 133 | 49.813% |
| Age | ||
| Under 24 years old | 127 | 47.566% |
| Over 24 years old | 140 | 52.434% |
| Level of education | ||
| Without a university degree | 171 | 64.045% |
| With a university degree | 96 | 35.955% |
| Frequency of Internet use | ||
| Every day | 195 | 73.034% |
| Less frequently | 72 | 26.966% |
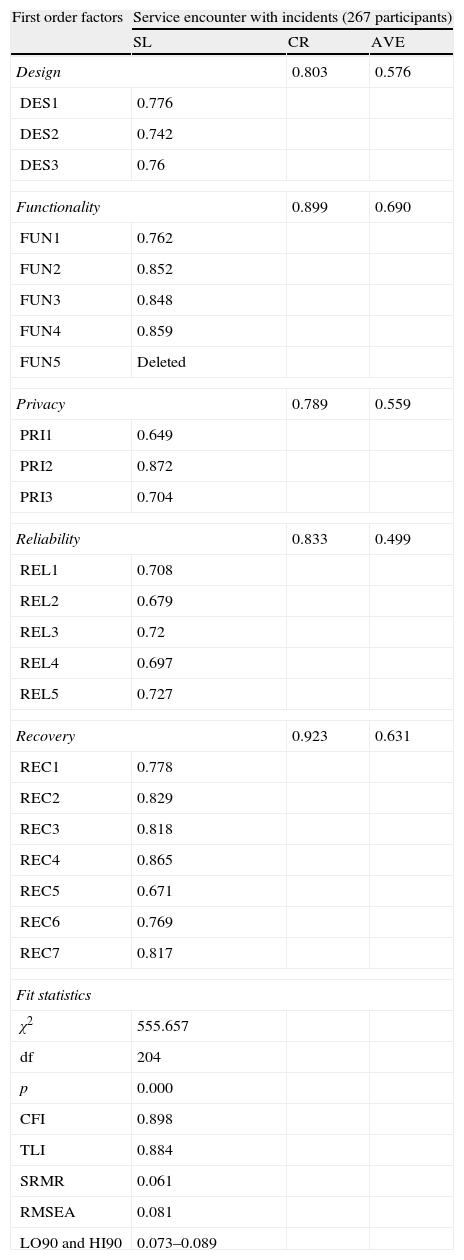
To evaluate the scales proposed, we have followed the traditional procedures used in marketing research (Gerbing & Anderson, 1988). In Table 3 we present the results of dimensionality, convergent validity and reliability assessment. We also offer the standardized loadings, the composite reliability and the average variance extracted (AVE). As can be seen, all the items significantly load in their respective dimensions. The AVE values obtained are all above the recommended value of 0.50. This indicates that each construct's items have convergent validity. What is more, each construct shows good internal consistency, with reliability coefficients which vary between 0.789 and 0.923. Several common indices utilized of the overall fitness of an estimated model with the AMOS software package were included with cutoffs for the Comparative Fit Index (CFI) close to 0.95, Tucker–Lewis Index (TLI) close to 0.95, Root Mean Square Error of Approximation (RMSEA) close to 0.06 and Standardized Root Mean Square Residual (SRMR) close to 0.08 (Hu & Bentler, 1999). With regard to RMSEA, we also created confidence intervals (LO90 and HI90), as recommended by Byrne (2009).
Dimensionality, convergent validity, and reliability assessment.
| First order factors | Service encounter with incidents (267 participants) | ||
| SL | CR | AVE | |
| Design | 0.803 | 0.576 | |
| DES1 | 0.776 | ||
| DES2 | 0.742 | ||
| DES3 | 0.76 | ||
| Functionality | 0.899 | 0.690 | |
| FUN1 | 0.762 | ||
| FUN2 | 0.852 | ||
| FUN3 | 0.848 | ||
| FUN4 | 0.859 | ||
| FUN5 | Deleted | ||
| Privacy | 0.789 | 0.559 | |
| PRI1 | 0.649 | ||
| PRI2 | 0.872 | ||
| PRI3 | 0.704 | ||
| Reliability | 0.833 | 0.499 | |
| REL1 | 0.708 | ||
| REL2 | 0.679 | ||
| REL3 | 0.72 | ||
| REL4 | 0.697 | ||
| REL5 | 0.727 | ||
| Recovery | 0.923 | 0.631 | |
| REC1 | 0.778 | ||
| REC2 | 0.829 | ||
| REC3 | 0.818 | ||
| REC4 | 0.865 | ||
| REC5 | 0.671 | ||
| REC6 | 0.769 | ||
| REC7 | 0.817 | ||
| Fit statistics | |||
| χ2 | 555.657 | ||
| df | 204 | ||
| p | 0.000 | ||
| CFI | 0.898 | ||
| TLI | 0.884 | ||
| SRMR | 0.061 | ||
| RMSEA | 0.081 | ||
| LO90 and HI90 | 0.073–0.089 | ||
SL, standardized loadings; CR, composite reliability; AVE, average variance extracted; all t-values were greater than 2.576 (p<0.001).
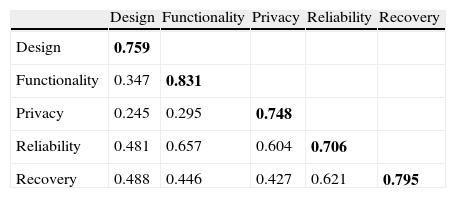
Discriminant validity, which verifies that each factor represents a separate dimension, was analyzed examining whether inter-factor correlations are less than the square root of the average variance extracted (AVE) (Fornell & Larcker, 1981). Table 4 shows that the square roots of each AVE are greater than the off-diagonal elements. With this result, it should therefore be understood that there is discriminant validity in the e-service quality measurement scale.
Discriminant validity of measures.
| Design | Functionality | Privacy | Reliability | Recovery | |
| Design | 0.759 | ||||
| Functionality | 0.347 | 0.831 | |||
| Privacy | 0.245 | 0.295 | 0.748 | ||
| Reliability | 0.481 | 0.657 | 0.604 | 0.706 | |
| Recovery | 0.488 | 0.446 | 0.427 | 0.621 | 0.795 |
The bold numbers on the diagonal are the square root of the AVE. Off-diagonal elements are correlations between constructs.
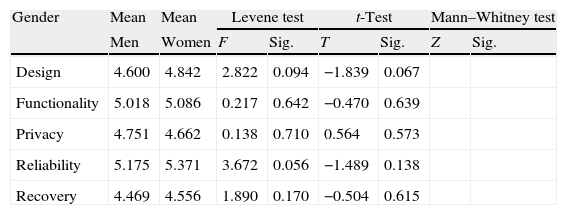
Next, we posit if the evaluation of the dimensions of the electronic service quality differ according to the sociodemographic profile of the respondents. To do so, we use the Student t test to compare the measurements in the case of equality of variances between the groups. If the condition of homoscedasticity is not fulfilled, we use the Mann–Whitney test (non-parametric test).
As can be observed in Table 5, regardless of the sociodemographic profile, the best valued dimension of the quality of service is reliability, while the service recovery has the worst performance. With respect to the comparative analysis according to the Internet users’ sociodemographic variables, the results show that women have a higher valuation of the service quality of Web sites than men. Regarding age, people under 24 also perceive a greater service quality than those over 24. Likewise, people without a university degree score perceived quality service higher than people with a university degree. Lastly, people who use Internet everyday perceive a smaller service quality than those who use the Internet less frequently. However, all these differences are not significant (p<0.05). Therefore, hypotheses 1, 2, 3 and 4 are rejected.
Student t-test and Mann–Whitney test.
| Gender | Mean | Mean | Levene test | t-Test | Mann–Whitney test | |||
| Men | Women | F | Sig. | T | Sig. | Z | Sig. | |
| Design | 4.600 | 4.842 | 2.822 | 0.094 | −1.839 | 0.067 | ||
| Functionality | 5.018 | 5.086 | 0.217 | 0.642 | −0.470 | 0.639 | ||
| Privacy | 4.751 | 4.662 | 0.138 | 0.710 | 0.564 | 0.573 | ||
| Reliability | 5.175 | 5.371 | 3.672 | 0.056 | −1.489 | 0.138 | ||
| Recovery | 4.469 | 4.556 | 1.890 | 0.170 | −0.504 | 0.615 | ||
| Age | Mean | Mean | Levene test | t-Test | Mann–Whitney test | |||
| 24 years or less | 25 years or more | F | Sig. | T | Sig. | Z | Sig. | |
| Design | 4.801 | 4.648 | 0.548 | 0.460 | 1.153 | 0.250 | ||
| Functionality | 5.200 | 4.917 | 5.500 | 0.020 | – | – | −1.592 | 0.111 |
| Privacy | 4.832 | 4.593 | 0.960 | 0.328 | 1.509 | 0.133 | ||
| Reliability | 5.225 | 5.316 | 1.638 | 0.202 | −0.682 | 0.496 | ||
| Recovery | 4.513 | 4.512 | 0.003 | 0.957 | 0.004 | 0.997 | ||
| Level of education | Mean | Mean | Levene test | t-Test | ||
| Without a university degree | With a university degree | F | Sig. | T | Sig. | |
| Design | 4.789 | 4.597 | 3.488 | 0.063 | 1.395 | 0.164 |
| Functionality | 5.124 | 4.923 | 3.650 | 0.057 | 1.342 | 0.181 |
| Privacy | 4.770 | 4.594 | 1.312 | 0.253 | 1.066 | 0.287 |
| Reliability | 5.278 | 5.263 | 0.266 | 0.606 | 0.115 | 0.909 |
| Recovery | 4.528 | 4.485 | 0.203 | 0.652 | 0.237 | 0.813 |
| Frequency of Internet use | Mean | Mean | Levene test | t-Test | ||
| Every day | Not every day | F | Sig. | T | Sig. | |
| Design | 4.538 | 4.442 | 0.028 | 0.868 | 0.492 | 0.623 |
| Functionality | 4.697 | 4.782 | 0.514 | 0.474 | −0.568 | 0.570 |
| Privacy | 4.990 | 5.219 | 0.000 | 0.990 | −1.419 | 0.157 |
| Reliability | 4.643 | 4.880 | 0.025 | 0.875 | −1.327 | 0.186 |
| Recovery | 5.259 | 5.308 | 1.555 | 0.214 | −0.327 | 0.744 |
*p<0.1.
**p<0.05.
When latent mean scores are used to compare groups, it is necessary to establish a strong measurement invariance of the measures (equal factor loadings and equal intercepts) (Byrne, Stewart, Kennard, & Lee, 2007). A critical assumption in multigroup analysis is that the instrument measures the same construct(s) in exactly the same way across all groups (i.e., the instrument is measurement and structurally equivalent) (Byrne & van de Vijver, 2010). Nevertheless, if the equivalence or invariance of an assessment instrument does not hold, the validity of the inferences and interpretations extracted from the data may be erroneous (Byrne, 2008), and the findings based on comparisons of the groups cannot be valid.
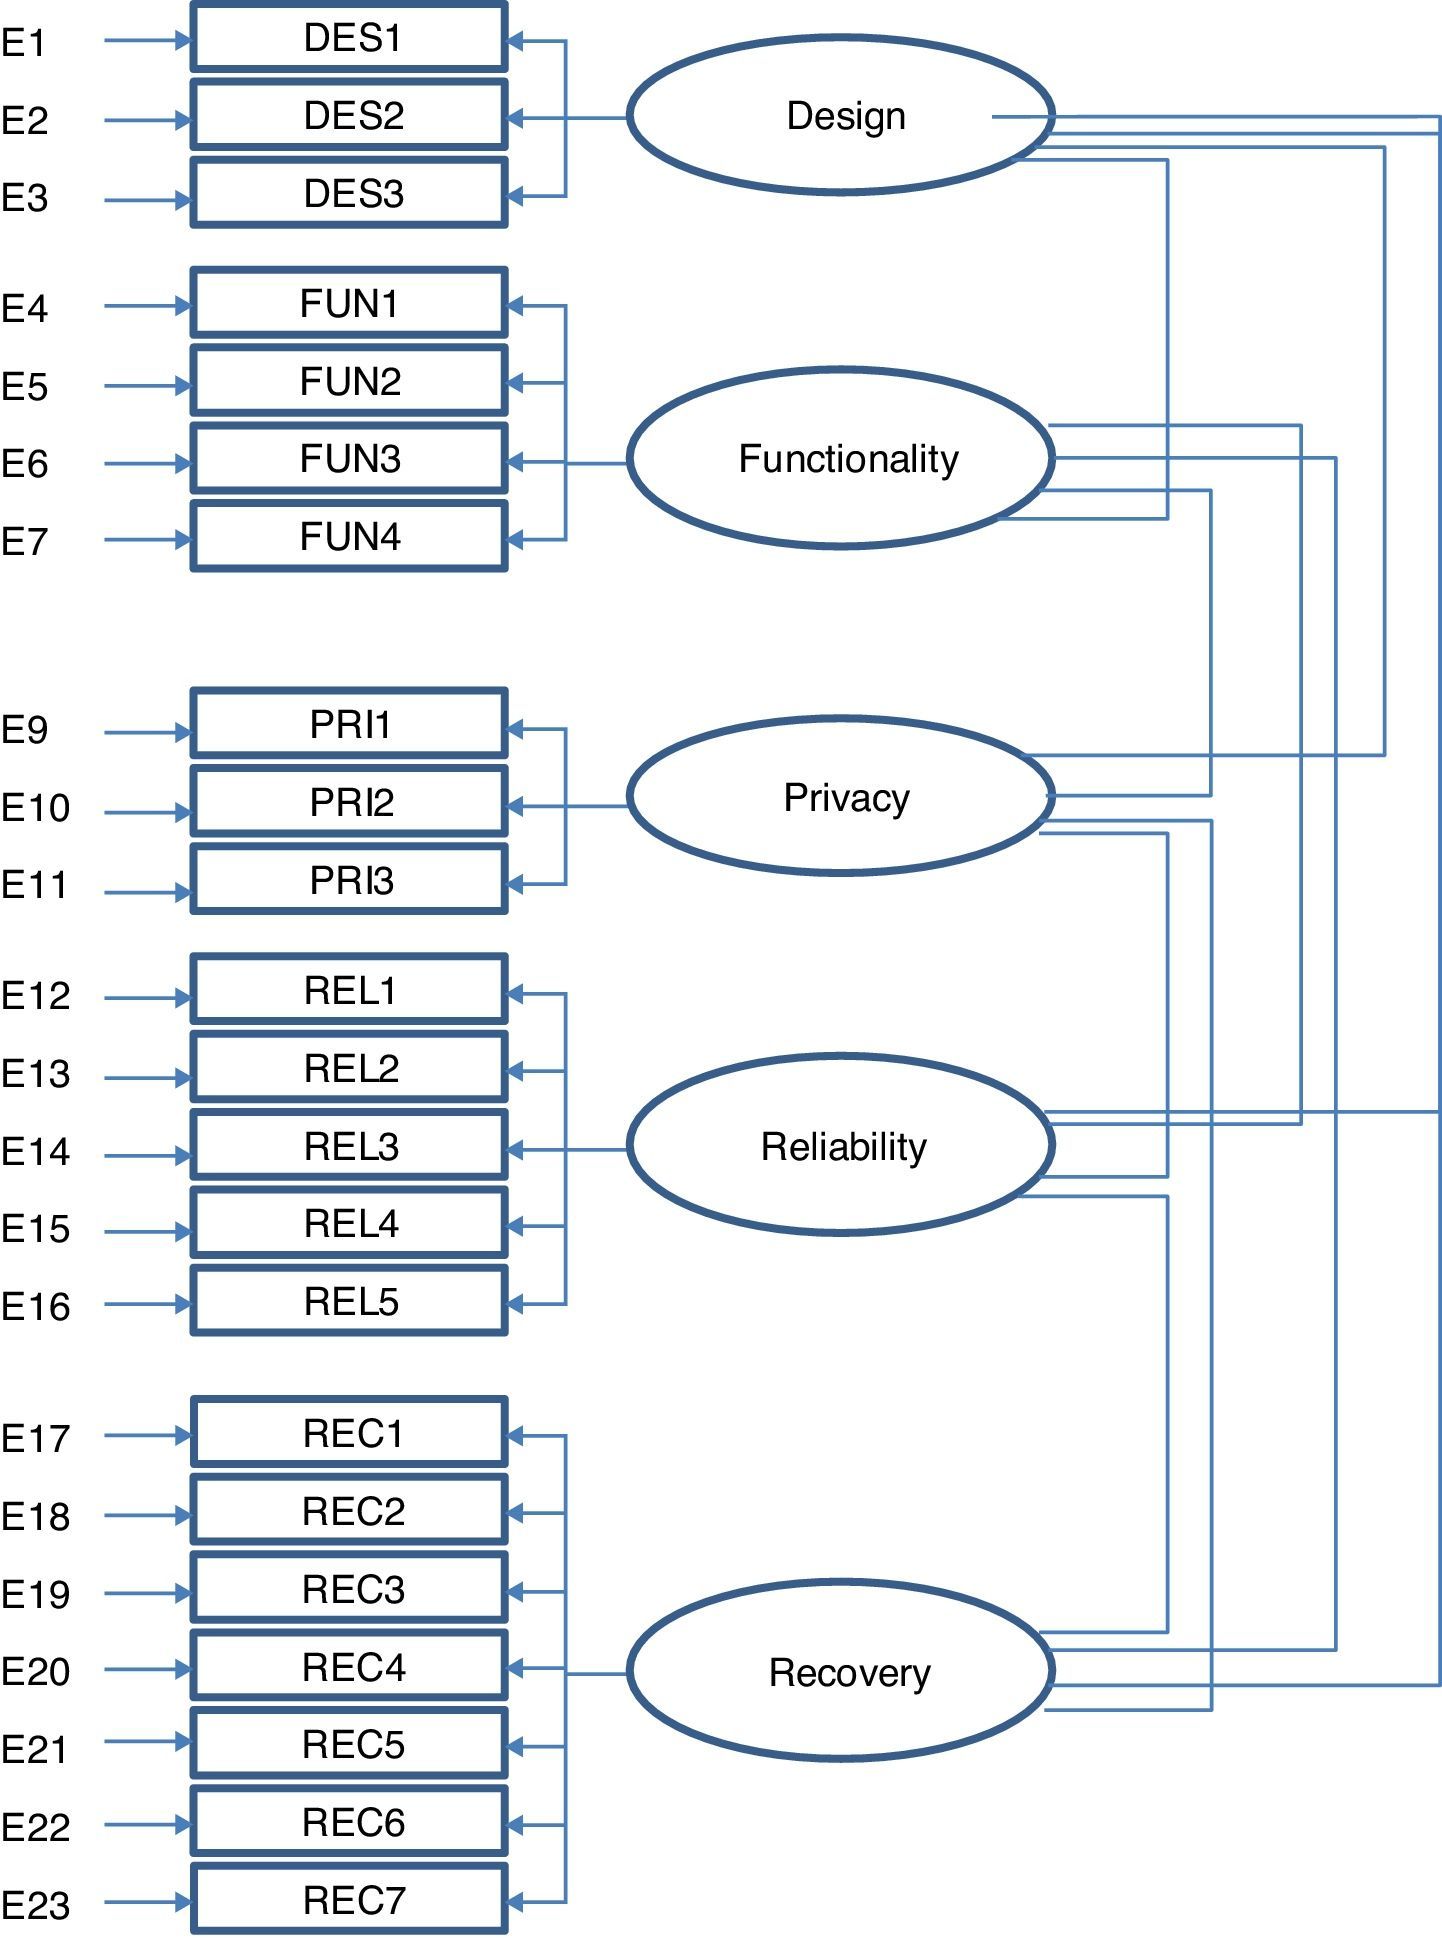
Measurement invariance is concerned with the extent to which parameters comprising the measurement instrument are similar across groups (Byrne, 2008) and it is evaluated at three levels: weak (factor loadings invariance), strong (factor loadings and item intercepts invariance) and strict (factor loadings, item intercepts and error variances and covariances invariance). This author shows that testing for measurement invariance entails a hierarchical set of steps that typically begins with the determination of a well-fitting multigroup baseline model (configural model – Fig. 1). The importance of this model is that it serves as the baseline against which all subsequent tests for equivalence are compared.

The next stage of the analysis is if the factor structure is similar across the different groups (test of invariance of the configural model). The parameters are estimated for all groups simultaneously. Given that the configural model fits reasonably well (Table 6), we can conclude that both the number of factors and the pattern of their item loadings of the electronic service quality scale are similar across the sociodemographic variables. Consequently, the results support the configural invariance of the measurement model and justify the evaluation of more restrictive invariant models.
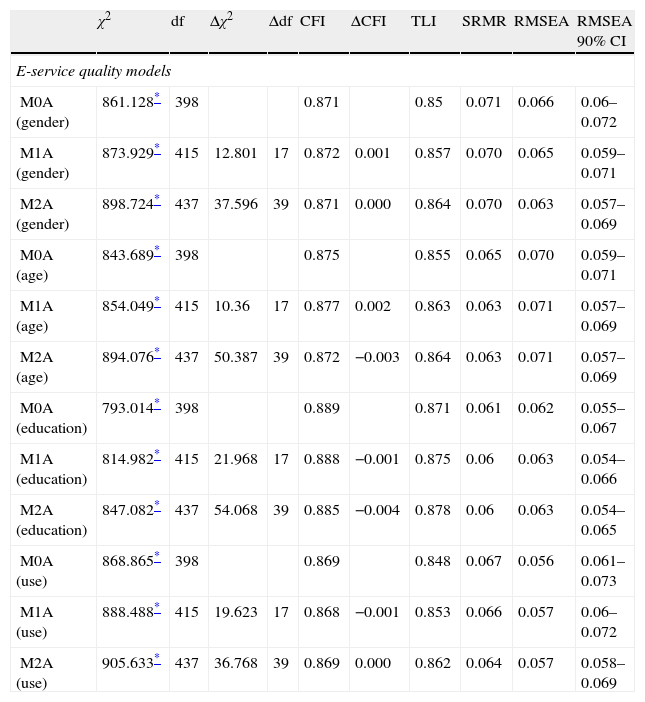
Testing for the strong measurement invariance of electronic service quality scale.
| χ2 | df | Δχ2 | Δdf | CFI | ΔCFI | TLI | SRMR | RMSEA | RMSEA 90% CI | |
| E-service quality models | ||||||||||
| M0A (gender) | 861.128* | 398 | 0.871 | 0.85 | 0.071 | 0.066 | 0.06–0.072 | |||
| M1A (gender) | 873.929* | 415 | 12.801 | 17 | 0.872 | 0.001 | 0.857 | 0.070 | 0.065 | 0.059–0.071 |
| M2A (gender) | 898.724* | 437 | 37.596 | 39 | 0.871 | 0.000 | 0.864 | 0.070 | 0.063 | 0.057–0.069 |
| M0A (age) | 843.689* | 398 | 0.875 | 0.855 | 0.065 | 0.070 | 0.059–0.071 | |||
| M1A (age) | 854.049* | 415 | 10.36 | 17 | 0.877 | 0.002 | 0.863 | 0.063 | 0.071 | 0.057–0.069 |
| M2A (age) | 894.076* | 437 | 50.387 | 39 | 0.872 | −0.003 | 0.864 | 0.063 | 0.071 | 0.057–0.069 |
| M0A (education) | 793.014* | 398 | 0.889 | 0.871 | 0.061 | 0.062 | 0.055–0.067 | |||
| M1A (education) | 814.982* | 415 | 21.968 | 17 | 0.888 | −0.001 | 0.875 | 0.06 | 0.063 | 0.054–0.066 |
| M2A (education) | 847.082* | 437 | 54.068 | 39 | 0.885 | −0.004 | 0.878 | 0.06 | 0.063 | 0.054–0.065 |
| M0A (use) | 868.865* | 398 | 0.869 | 0.848 | 0.067 | 0.056 | 0.061–0.073 | |||
| M1A (use) | 888.488* | 415 | 19.623 | 17 | 0.868 | −0.001 | 0.853 | 0.066 | 0.057 | 0.06–0.072 |
| M2A (use) | 905.633* | 437 | 36.768 | 39 | 0.869 | 0.000 | 0.862 | 0.064 | 0.057 | 0.058–0.069 |
M0A: unconstrained configural models; M1A: first-order factor loadings invariant models; M2A: first-order factor loadings and item intercepts invariant models.
In testing for measurement invariance, the research compares the equality of estimated parameters across different groups. This procedure involves testing the fit of a series of increasingly restrictive models against a baseline model (the configural model in which no equality constraints are imposed). The models analyzed can be seen as nested models to which the constraints are progressively added. For the comparison of the nested models, previous research has employed the likelihood ratio test (also known as the chi square difference test). This χ2 difference value (Δχ2) is distributed as χ2, with degrees of freedom equal to the difference in degrees of freedom (Δdf). If this value is statistically significant, in the comparison of two nested models, it suggests that the constraints specified in the more restrictive model do not hold (i.e., the two models are not equivalent across groups). However, due to the sensitivity of the χ2 to sample size and non-normality (Hair, Anderson, Tatham, & Black, 1999), Cheung and Rensvold (2002) have proposed a more practical criterion, the CFI increment (ΔCFI), to determine if the models compared are equivalent. In this sense, when there is a change greater than 0.01 in the CFI between two nested models, the least constrained model is accepted and the other rejected, that is, the most restrictive model does not hold. If the change in CFI is equal or inferior to 0.01, it is considered that all specified equal constraints are tenable, and, therefore, we can go on with the next step in the analysis of the measurement invariance.
After configural invariance is established, we continue with the testing for the measurement invariance. As can be observed, when the factor loadings and item intercepts belonging to the electronic service quality scale are equally constrained, the differences in the ΔCFI between the configural model (M0A) and the constrained models (M1A and M2A) do not exceed 0.01. This indicates that the factor loadings and the item intercepts are equivalent across all the sociodemographic variables. Therefore, the results show the strong measurement invariance of the electronic service quality scale.
Conclusions, implications, limitations and future researchFacing the growth of electronic commerce, previous studies have analyzed: (1) the profile of the Internet user who shops online and (2) the existence of heterogeneity between Internet users with respect to their shopping behavior. In this sense, the descriptive criteria (sociodemographic and webgraphics variables) have been very useful to understand these questions. On the other hand, in recent years a multitude of studies have appeared in the literature which have tackled the factors which determine the perceived service quality in Websites. Our research analyze whether the evaluation of the electronic service quality differs according to the online shoppers’ sociodemographic profile. As far as we know, no article has until now dealt with the role which sociodemographic or webgraphics characteristics play in the evaluating of a Website's service quality. This work therefore covers an important research gap and the main conclusions of this study are now shown.
Firstly, from the literature review, the evaluation of the electronic service quality has been carried out with five key dimensions: design, functionality, privacy, reliability and recovery. In addition, we used a sample of online shoppers who have experienced a problem during the online service delivery (service encounters with incidents). Therefore, all participants evaluated these five dimensions. The first order factorial model with intercorrelated dimensions has good psychometric properties and a good data fit. This is why it can be used with confidence to make evaluations and inferences about the conceptual question which was the initial motivation.
Secondly, regarding the importance of the dimensions of a Website's service quality, this research clearly shows that reliability is the most important factor. These results coincide with the conclusions of previous studies. These also empirically demonstrated that reliability has a strong influence on the perceived quality of certain e-services (Bauer et al., 2005; Wolfinbarger & Gilly, 2003). As a result, the managers of online services must center themselves specifically on questions such as the exactitude of the service offered and correct billing, and offer clear, complete and error-free information. However, in spite of there being a strong consensus about the fact that privacy is one of the most important in the evaluation of an online service quality (B2C-ONTSI study on e-commerce) and one of those that have the most influence on customer satisfaction (Janda et al., 2002), this research shows the slight importance of this dimension. This fact is possibly due to the technological advances of recent years concerning online purchase payment security (Udo, Bagchi, & Kirs, 2010) and there being a growing tendency in the number of customers who are familiar with this type of electronic transactions (B2C-ONTSI study on e-commerce). In our study we ask the respondents to evaluate the Website which they use the most. Therefore, it seems that there is a certain familiarity and trust with the Websites chosen. In this line, previous studies point out that privacy may not be a critical factor in those who use Internet more often (Wolfinbarger & Gilly, 2003). For those users who do not carry out online purchases, privacy is probably not a factor of great importance. A third explanation may be the fact that younger consumers perceive less risk in this type of purchases than older consumers (Udo et al., 2010) (approximately 80% of our sample's purchasers were between 18 and 34 years old).
Thirdly, another important component of an electronic service quality is how consumers perceive their problems or concerns are resolved by the organization. In our study, 22.95% of the respondents stated having had an incident. From the management point of view, online companies must identify the nature of these errors and start up service recovery programs and policies to attain their customers’ satisfaction and loyalty (Holloway & Beatty, 2003). When these failures occur during the service delivery, online providers should strive to fix them or offer some compensation to the consumer. However, our study shows that the worst performance appears in the recovery dimension. These results indicate that organizations often obviated online post-purchase aspects, resulting in lower perceived service quality. The online providers should offer different ways (email, phone, etc.) so that the consumer can contact the customer service. Moreover, these problems or concerns will not be solved with a general answer, but with a specific response to the specific problems of each client.
Fourthly, although in the area of traditional services the literature shows that the service quality perception varies significantly depending on the customer (e.g., Kwan & Jing, 1994; McDougall & Levesque, 1994), our study shows that the evaluation of the service quality by online shoppers is quite homogeneous. At least, we have not found great differences according to gender, age, educational level or frequency of Internet use. These results have the following implications from the management point of view: (1) although they have been of great use in the past to determine the behavior of online shoppers, the webgraphics and sociodemographic variables are not very valid to identify consumer segments with different perceptions of a service and (2) unlike traditional services which are characterized by a high degree of heterogeneity (Kotler, 2000), the delivery of an electronic service is quite homogeneous as there are not interactions between employees and customers. In this sense, Liu and Wei (2003) uphold that this homogenization in the electronic context is much greater for the services of goods bought via Internet, as they are the only ones which can suffer any damage through transport and delivery. Then, contrary to the traditional shopping of goods, their perceived quality cannot be perceived as constant when shopping via Internet.
Some limitations of this research should be acknowledged and directions for future studies ought also to be suggested. Convenience sampling does not permit results to be generalized to a larger population. A future study should try to validate and generalize the findings of this study by using a wider sample. The large discrepancy in sample sizes between groups may have resulted in a substantial decrease in the power of the tests performed (Byrne et al., 2007). Therefore, it is recommended to test the measurement invariance when the sample sizes across groups do not differ greatly. The sample sizes of respondents who needed help are small. It is necessary to conduct future analysis that has a higher incidence of encountering problems. Finally future research lines could be developed to evaluate if the quality of electronic services differs according to other factors (e.g., lifestyle characteristics of online shoppers).
Design
DES1: The Website looks attractive
DIS2: The Website uses fonts properly
DIS3: The Website uses colors properly
Adapted from Liu et al. (2009)
Functionality
FUN1: This Website is always up and available
FUN2: This Website has valid links
FUN3: This Website loads quickly
FUN4: This Website enables me to get on to it quickly
FUN5: It makes it easy and fast to get anywhere on the site
Adapted from Aladwani and Palvia (2002), Parasuraman et al. (2005) and Collier and Bienstock (2006)
Privacy
PRI1: In the Website appear symbols and messages that signal the site is secure
PRI2: The Website assures me that personal information is protected
PRI3: The Website assures me that personal information will not be shared with other parties
Adapted from Janda et al. (2002), Collier and Bienstock (2006) and Parasuraman et al. (2005)
Reliability
REL1: The service received was exactly the same as what I ordered
REL2: The billing process was done without mistakes
REL3: Information Website is clear
REL4: Information Website is current
REL5: Information Website is complete
Adapted from Parasuraman et al. (2005), Wolfinbarger and Gilly (2003) and Aladwani and Palvia (2002)
Recovery
REC1: The Website shows its street, e-mail phone or fax numbers
REC2: The Website has customer service representatives
REC3: If I want to, I can easily contact a customer service representative
REC4: The Website responds to my inquiries
REC5: The Website gives me a satisfactory response
REC6: When I have a problem the Website shows a sincere interest in solving it
REC7: The website responds quickly to my inquiries
Adapted from Collier and Bienstock (2006) and Parasuraman et al. (2005)
Note: All items are measured with a seven-point Likert scale, anchored at 1 “strongly disagree” and 7 “strongly agree”.