


Firms, especially Chinese manufacturing firms, invest significant resources in innovation activities to sustain their position in the intensifying competitive environment. However, innovation efficiency has led to growing concerns due to the rapid increase in R&D expenditures. The purpose of this study is to explore the complicated role of competition on innovation efficiency and firm performance with a sample of 12,020 Chinese manufacturing firms for the period 2005–2007. The results show that most Chinese manufacturing firms are inefficient in R&D activities. Competition forces firms to focus on the improvement of innovation efficiency, but at the same time, it also undermines collaboration and leads to unpredictable R&D results. Therefore, there is an inverted U-shaped relationship between these variables. Competition also negatively moderates the positive impact of innovation efficiency on firm performance. The findings help firms formulate appropriate innovation strategies for sustainable innovation performance.
Firms face increasingly fierce competition with the progress of market-oriented reform in China. Innovation helps firms escape destructive competition in price, advertising and promotion (Mendi & Costamagna, 2017). Innovation is a critical source of competitive advantage (Ramos-Hidalgo et al., 2022). Firms are committing an increasing number of resources to R&D to enhance their competence, particularly in China. R&D expenditures increased from 89.566 billion RMB (¥) in 2000 to 2439.31 billion RMB in 2020, with an annual growth rate of 17.97%, according to the “China Statistical Yearbook”. R&D investment improves the competitiveness of Chinese manufacturers. It stimulates sustainable development of the Chinese manufacturing industry (Tsai et al., 2009). At the same time, competition also forces firms to improve the utilisation of limited R&D resources and reduce waste. Firms convert R&D input into innovative outcomes more efficiently under conditions of fierce competition (Wadho & Chaudhry, 2018). The maximising output of limited R&D resources is of concern as R&D spending grows (Bai, 2013; Beneito et al., 2015; Chen et al., 2018). Firms with higher innovation efficiency and that invest more in innovation activities identify more growth opportunities (Kang et al., 2017). Higher innovation efficiency provides firms with a real competitive edge (Song et al., 2015). Innovation efficiency is the key to achieving sustainable innovation and maintaining a competitive advantage.
Competitive intensity is the degree of pressure exerted by rivals, which forces firms to counterattack (Barnett, 1997). The driver of innovation is the perception of competitive pressure. A firm commits resources to innovation according to the competitive environment (Wadho & Chaudhry, 2018). Fierce competition drives a firm to increase its R&D investment to maintain a sustainable competitive advantage (Grossman et al., 2004). The literature mainly focuses on the effect of competition on R&D intensity (e.g., Aghion et al., 2005; Blind et al., 2017; Grossman et al., 2004) or technological change (Polemis & Tzeremes, 2019). To the best of our knowledge, however, whether the unprecedented levels of fierce competition help firms to improve their R&D efficiency has not received much research attention. Indeed, there are remarkably few studies on this topic, such as Cao et al. (2020) and Haschka & Herwart (2020). Innovation efficiency affects a firm's financial performance. The traditional view assumes that firms have greater profitability with a more efficient transformation of R&D investment (Chen et al., 2018). However, this positive role still lacks theoretical and empirical support (Cruz-Cázares et al., 2013). The financial performance of innovation is contingent on external market factors (Liao & Rice, 2010). Fierce competition may cause the distinct influence of innovation efficiency on firm profitability. Somewhat surprisingly, no previous study has investigated the complex influence of competition on innovation efficiency and firm performance.
The complex interactions between competition intensity and innovation efficiency and firm performance need to be fully analysed. However, extant studies are still insufficient (Cruz-Cázares et al., 2013). To fill the abovementioned gaps, the main purpose of this paper is to explore the influence of competition on innovation efficiency and firm performance based on panel data of 36,060 samples from the Chinese manufacturing industry for the period 2005–2007. The novelty of this study is that it reveals the negative moderating role of competitive intensity on the relationship between innovation efficiency and financial performance. It contributes to the literature in three important ways. First, it objectively estimates the innovation efficiency of Chinese industrial enterprises based on firm-level data by using the stochastic frontier analysis (SFA) method. Second, it reveals that competition has an inverted U-shaped effect on the improvement of R&D efficiency, which is different from the positive effect found by Cao et al. (2020) and is also unlike the negative roles in Haschka & Herwart (2020). Third, it explores the moderating effects of competition on the impacts of innovation efficiency on firm performance. In addition, this paper also contributes to the most appropriate choice of innovation behaviours according to the competitive environment.
The remainder of this paper is organised as follows. Section 2 presents the theoretical framework and develops the corresponding research hypotheses based on the analysis of the extant research literature and theoretical underpinnings. Section 3 describes the econometric models, the definitions of the variables and their measures. Section 4 introduces the data and their collation. Section 5 tests the research hypotheses and discusses the results. Section 6 presents the research conclusions and recommendations.
2Theoretical background and research hypotheses2.1Effects of competition on innovation efficiencyInnovation efficiency is the capability of a firm to maximise its innovation outputs using a given R&D investment (Cruz-Cázares et al., 2013). The competition mechanism provides a credible commitment for firms in the product market, which inhibits the simple duplication of similar technology. Competition facilitates the technical proficiency of firms (Lee & Wong, 2011), forcing them to pay more attention to R&D investment efficiency and innovation quality (Almeida & Campello, 2007). Firms adopt a market-oriented innovation strategy against the competition. They make more effort to search for investment opportunities in broader markets, which provides more valuable innovative projects. Firms also accelerate the commercialisation of R&D outcomes to obtain a first-mover advantage. Firms pay more attention to the diffusion and sharing of internal knowledge in fierce competition settings. The diffusion of knowledge within a firm is accelerated by in-house training, interdepartmental collaboration, and brainstorming, inter alia(Lee et al., 2016). Competition promotes cooperation among R&D team members (Xie et al., 2020). It facilitates the diffusion of knowledge and information within a firm. The resources and financial budgets used for R&D are reduced due to fierce competition, which forces firms to improve innovation-related processes to maximise innovation output (Aliasghar et al., 2022). Firms make efforts to improve innovation efficiency to offset the loss of scale efficiency caused by the reduction of resources (Song et al., 2015).
Social capital is the key antecedent for the formation of organisational capability (Kemper et al., 2013). Competence shapes the market position of a firm and its relationships with vendors, customers and competitors. The positive influence of social capital on R&D capability is restrained because violent competition erodes closer cooperation. This increases the complexity of production coordination. Then, it delays the decision-making speed and inhibits effective counterattacks against competitors (Giachetti & Dagnino, 2014). Competition also stimulates patent applications to generate exclusive rights, which deters knowledge spillover to competitors (Haschka & Herwart, 2020). To more effectively win in a resource-limited setting, firms weaken their R&D capability and pay more attention to marketing or other capabilities (Kemper et al., 2013). In particular, it is difficult for small and medium-sized firms to acquire external support because they have fewer resources (Müller & Zimmermann, 2009). Some of the R&D investments cannot be converted into real output due to the shortage of resources in subsequent actions. Competition increases the uncertainty of R&D activities (Li et al., 2008). Firm behaviour becomes more random in a fierce competitive setting (Auh & Menguc, 2005). In this situation, firms are reluctant to radically change their current technology (Christensen, 1997). In contrast, the monopolistic market structure increases the predictability of rivals’ behaviour, which can maximise the return on R&D investment (Schumpeter, 1942). Through the discussions presented above, competitive intensity has an inverted U-shaped effect on innovation efficiency. Only moderate competition boosts innovation efficiency the most. Accordingly, this study develops the following hypothesis:
Hypothesis 1. Competition has an inverted U-shaped relationship with innovation efficiency.
2.2Impacts of innovation efficiency on firm performanceInnovation is the intrinsic engine for firm development (Cruz-Cázares et al., 2013). The positive impact of R&D activity on firm performance has been validated by many studies (Ramos-Hidalgo et al., 2022). R&D activity cultivates new knowledge for the improvement of products. It helps firms gain benefits with respect to market space and to profit from new products developed in innovation activities. R&D activity helps firms improve their process technology (Zona, 2016), which contributes to the improvement of product quality and the reduction of production costs. The R&D experience of talent is enriched by trial and error. Learning by doing promotes innovation efficiency (Beneito et al., 2015). R&D experience not only increases the output of new products but also improves the quality of products (Beneito et al., 2014). The capability of R&D management is strengthened by optimising the R&D process. The scale effect and cumulative effect of R&D activities increase the innovation output of firms (Chen et al., 2004).
The improvement of innovation efficiency increases the innovation output of limited R&D resources. Unnecessary development activities are excluded. The time to market is shortened, and the development cost is reduced. Firms expand their market space with a variety of new products. Production costs are also reduced because the manufacturing process is optimised. Improved product quality results in a better consumption experience for consumers, for which they are willing to pay higher prices. Firms with greater innovation efficiency have higher expected returns and more easily access cheaper external financing (Kang et al., 2017). Thus, stated formally, this research suggests:
Hypothesis 2.Innovation efficiency will have a positive effect on firm performance.
2.3Moderating effect of competition on the relationship between innovation efficiency and firm performanceCustomers are faced with more opportunities to choose the right products in a highly competitive market, making their demands and preferences more volatile. Firm behaviour also becomes more unpredictable under more intense competition (Auh & Menguc, 2005), which reduces the business success of innovation (Song & Parry, 1997). Firms are more sensitive to the new product development of their rivals in fierce competition (Kim et al., 2015) and react more quickly to rivals’ innovative outcomes (Chen et al., 2017). The introduction of new products rapidly induces the development of similar products or alternative products. A large number of manufacturers flood into the same product market. On the one hand, it produces the rent-reduction effect of innovation by the lower prices or the lower price-cost margins of new products (Ghosh et al., 2017). On the other hand, it induces further competition in the quickly saturated new product market. Firms pursue the development of new generation products to escape from the competition. This causes a shorter product lifespan, which reduces the profitability of innovation output because of the shorter window within which to obtain innovation rent (Polemis & Tzeremes, 2019). The low cost of substitutability makes the customer very sensitive to price. The business-stealing effect decreases the new product development cost of followers (Ghosh et al., 2017), which invades the innovator's market space. New products also crowd out the innovator's own similar products because of the existence of a share-reduction effect or self-cannibalisation (Giachetti & Dagnino, 2014). Furthermore, the improvement of innovation efficiency may crowd out production or marketing activities due to the limited resources of firms. Faced with intensifying competitive pressure, firms prefer to invest in their existing core technologies, ignoring new technologies (Christensen, 1997; Gilbert, 2005). The profitability of new products will probably slow because of the diminishing marginal returns of traditional technology and rapid changes in customer preferences.
At the same time, competition not only drives firms to improve innovation efficiency but also accelerates the speed of new products to the market. Competition drives novelty and diversity of innovation (Aliasghar et al., 2022). Firms are driven to continuously create new products to sustain competitiveness (Ramos-Hidalgo et al., 2022). Firms can acquire innovation rents from the first-mover advantage. Competition forces firms to focus more on the personalised preferences of customers. New products have superior features and are service customer focused. Competition makes firms more sensitive to competitors’ innovation behaviour (Chen et al., 2017). Firms search and analyse information about new products from competitors. They quickly develop new products that are different from those of their competitors. Competition also strengthens the collaboration between firms in the supply chain. Closer partnerships are conducive to knowledge creation and sharing (Ang, 2008). Competition forces firms to search for more valuable innovation opportunities that create superior value for their customers at a lower cost and with better quality. Taken together, there are two opposing views about the role of competition in the relationship between innovation efficiency and firm performance. Accordingly, the two opposing hypotheses are proposed:
Hypothesis 3a.The effect of innovation efficiency on firm performance will be negatively moderated by the competitive intensity level.
Hypothesis 3b.The effect of innovation efficiency on firm performance will be positively moderated by the competitive intensity level.
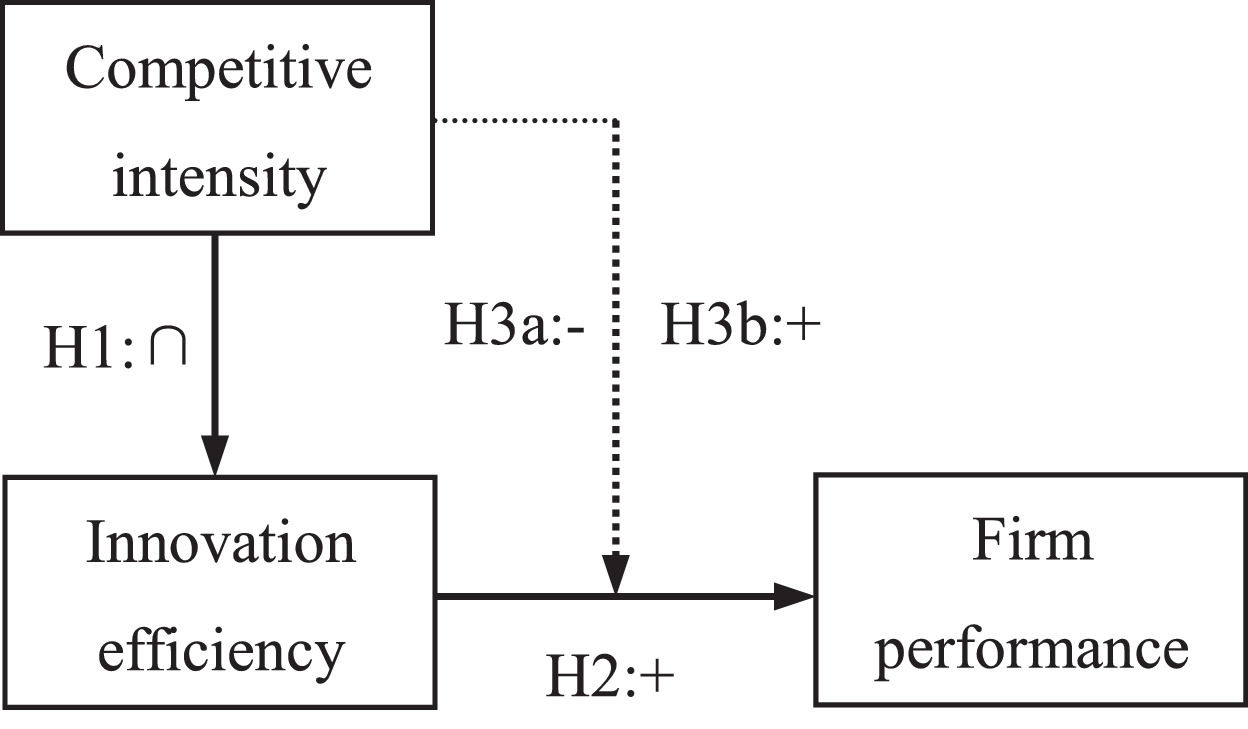
Facing intensifying competition, firms improve innovation efficiency to obtain their target business performance. The interactions of competition between innovation efficiency and firm performance are summarised in Fig. 1. It illustrates the above hypotheses and their interactions.
3Main variables and econometric model
This paper adopts relative indicators to eliminate the simultaneity problem caused by firm size (Ebersberger & Herstad, 2011), price fluctuation, industrial difference and others (Ouyang et al., 2015), which facilitates comparison across firms (Grabowski, 1968). The main reference indicator is sales revenue.
3.1R&D input and innovation outputR&D inputs involve spending on both capital goods (O'Regan et al., 2006) and R&D labour (Wang & Huang., 2007). R&D expenditure includes not only the cost of raw materials, instruments, equipment, housing and other fixed assets but also the employment cost of R&D employees, such as salary, bonuses, allowances and social insurance (Cruz-Cázares et al., 2013). Human capital investment has been regarded as a principal component of R&D expenditure. The inclusion of spending on human capital will produce a problem of double counting in production functions (Beneito et al., 2015). Therefore, in contrast to existing research, this study adopts R&D expenditure as the single innovation input to avoid double counting (e.g., Bai, 2013; Cruz-Cázares et al., 2013; Griliches, 1979; Hong et al., 2016; Li et al., 2017).
A variety of indicators such as patent application, new product rate (Guan et al., 2006), paper publication (Wang & Huang, 2007), and innovative product (Cruz-Cázares et al., 2013) have been used to measure R&D output. Some firms may protect their private knowledge through trade secrets because the intellectual property protection system in China still needs improvement. Patents are not involved in the innovation process (Mahroum & Al-Saleh, 2013). They only reflect the results of knowledge production rather than their commercial performance. There are substantial sleeping patents that cannot be successfully commercialised (Chen et al., 2018). Innovation should be the first commercial application of invention (Freeman & Soete, 1987). Accordingly, this paper adopts the output value of new products to measure innovation output.
3.2Competitive intensityCompetitive intensity is the degree of competition faced by firms in the same industry (Li et al., 2008). Its measures mainly include the number of firms (Porter, 1980), profitability (Boone, 2008), the Herfindahl index (Giachetti & Dagnino, 2014; Wiggins & Ruefli, 2002), and the cost-plus method (Graddy, 1995). The Herfindahl index synthetically reflects the number of firms and their relative sizes in the same industry. It can reveal the difference in degrees of concentration that the industry concentration does not indicate. The Herfindahl index is adopted to characterise the competitive intensity faced by firms (Li et al., 2008). It is expressed as follows:
where HHIjt denotes the Herfindahl index of industry j including the ith firm at time t, Njt is the number of firms of industry j at time t, Sijt is the sales revenue of the ith firm in industry j at time t, and Sjt represents the total sales revenue of industry j at time t. The fiercer (milder) the competition, the smaller (larger) the size of the inter-firm difference in the same industry and the smaller (larger) HHI. Furthermore, HHI is converted to the positive index as the measure of the degree of competitiveness, i.e., COI.3.3Innovation efficiency

Innovation efficiency is the capability to maximise innovation output using a given innovation input. Innovation efficiency is an effective measure of innovation capability (Song et al., 2015). It will help to improve R&D investment to accurately measure innovation efficiency by identifying weaknesses and the best practical benchmarking (Chen et al., 2017). The measurement of innovation efficiency mainly includes the nonparametric methods represented by the data envelopment analysis method (DEA) and the parametric methods represented by the SFA method. The DEA method is applicable to the relative efficiency measurement of decision-making units (DMUs) based on multiple inputs and outputs (Carayannis et al., 2016; Chen & Guan, 2012; Kao, 2017). It is not necessary to subjectively predefine functional relationships between input and output because the DEA method involves the linear programming technique (Chen et al., 2017). However, this method can only obtain the relative rank score of each DMU because it does not deal with random noise, extreme values or heterogeneity (Carayannis et al., 2016; Cruz-Cázares et al., 2013). The SFA method is based on economic techniques. It estimates the functional relationship between R&D input and innovation output. It distinguishes between inefficient factors and statistical noise, although it is only applicable to scenarios with only one output (Lampe & Hilgers, 2015). It resolves the influences of heterogeneity and extreme values better than nonparametric methods (Hong et al., 2016). Statistical tests of the estimation results can also be performed. The estimation results of the SFA method are more realistic and applicable (Chen et al., 2017). The SFA method will be employed to estimate the innovation efficiency of industrial firms in this study.
R&D expenditure and R&D personnel are both adopted as the main inputs in the extant literature (e.g., Bai, 2013; Guan & Chen, 2010). However, in reality, labour input has been included in R&D expenditures. R&D expenditure is taken as the sole input of innovation activities to avoid the problem of double counting in this study. Following the work of Kumbhakar & Lovell (2000), the production function of R&D investment and output can be described with the following equation:
where Yit is the output value of new products of firm ith in year t; Kit is the R&D stock of firm ith in year t; λ is the coefficient of variables; vit is the random error term, denoting the observation error; and uit is the technical inefficiency term, representing the deviation of the actual output from the production frontier, which follows truncated normal distribution (u,σu2) (Battese & Coelli, 1992).where η reflects the impact of time on innovation efficiency.

Innovation efficiency is defined as the ratio of actual innovation output to the frontier output:

R&D experience is one of the most important sources of innovation (Beneito et al., 2014). R&D investment affects not only the current but also the future development of new products through cumulative physical equipment, best practices, process knowledge, and management experience in the innovation process (Wang & Hagedoorn, 2014). Firms can more quickly and more cheaply assimilate external knowledge due to the increase in absorptive capacity derived from earlier R&D investments (Cohen & Levinthal, 1990). Some of the present R&D achievements can be used as direct inputs for future R&D activities (Chen et al., 2017; Scotchmer, 1991). R&D expenditure exerts lagged impacts on innovation. Jefferson et al. (2006) argue that there is a 1-year time lag between R&D input and output, but Falk (2012) considers that the positive impact of R&D input on firm performance has a lagged term of approximately two years. The R&D expenditures in different periods interact with each other because of the time lag effect, the persistency of innovation investment (Beneito et al., 2015) and the multistage reciprocal effect of different inputs. Firms can produce more new products as R&D capital accumulates. Accordingly, this study employs the accumulated R&D investment as the R&D input. It is calculated with the perpetual inventory method (PIM). The R&D stock of the ith firm is calculated following Bai (2013), Goto & Suzuki (1989), and Griliches (1980):
where Iit is the ith firm's R&D expenditure at time t and δ is the annual depreciation rate of R&D capital. Following the previous estimation of the depreciation rate of R&D capital (Bai, 2013; Cruz-Cázares et al., 2013; Griliches, 1980; Hong et al., 2016; Li et al., 2017), δ=0.15 is adopted in this study.
The initial R&D stock Ki0 is calculated as follows (Goto & Suzuki, 1989):
where Ki0 represents the initial R&D stock, Ii0 denotes the R&D expenditure in 2005, and g is the average growth rate of R&D expenditures during 2005–2007. Due to the great volatility of R&D investment and the shorter analysis period, g is measured by the average R&D investment growth rate of all firms during the period of analysis. It is set to 0.211 by calculation.3.4Performance variable
Innovation is the first commercial application of invention (Freeman & Soete, 1987). Innovation is the process of transforming knowledge into economic returns (Dvir & Pasher, 2004; Schumpeter, 1942). The return on sales (ROS) indicates the profitability of the business. ROS is less sensitive to accounting methods relative to return on assets, return on equity and other performance measures. It can be expressed as follows:
where ROSit represents the return on sales of firm i at time t and Rit is the total profit of firm i at time t.Sit is the sales revenue of firm i at time t.3.5Control variables
Firm size, staff education, exports and other firm characteristics may also affect the innovation activities of firms (Blind et al., 2017). This paper employs firm size, firm age, export intensity, proportion of state-owned shares and per capita educational cost as control variables to control their influences on the relationships between competitive intensity, innovation efficiency and financial performance based on the extant literature. Furthermore, it minimises the endogeneity problem due to variable omissions.
State-owned enterprises often have access to preferential treatment, including business protection, bank credit, staff treatment, tax preferences, and financial subsidies. However, these preferential treatments may lower their innovation efficiency due to insufficient incentives and supervision mechanisms (Song et al., 2011). Nonstate-owned enterprises have a higher preference for patent application (Hu & Jefferson, 2009). The proportion of state-owned shares is used to measure the effects of state-owned capital on innovation efficiency and firm performance. It is calculated as:
where SOEit represents the proportion of state-owned shares of firm i at time t, SOCit denotes the state-owned capital of firm i at time t, and PCit is the paid-in capital of firm i at time t.
The learning effect of exports promotes innovation (Wadho & Chaudhry, 2018). Exports contribute to the accumulation of knowledge and the improvement of learning ability. Export intensity is used to measure the export level of firms. It is expressed as:
where ESIit denotes the export intensity of firm i at time t and DVEit is the delivery value of the exports of firm i at time t.
Skilled employees are critical to the commercialisation of innovation (Ramos-Hidalgo et al., 2022). Job training should be provided according to the production requirements, which develops the technical skills of employees and stimulates their enthusiasm for innovation. It is effective for attracting more highly skilled talent. Education and training should be paramount considerations for firms. The per capita educational cost is calculated as:
where EDUit represents the per capita educational cost of firm i at time t, SECit is the staff educational cost of firm i at time t, and NOEit is the number of employees of firm i at time t.
Size affects innovation activity and firm performance (Tsai & Yang, 2013; Xie et al., 2020). A large firm has more resources and more diversified capabilities, which provide a knowledge base for the development of new products (Kim et al., 2015). A large firm conducting diversified operations has more opportunities to exploit R&D outputs for profit (Kamien & Schwartz, 1982). Large firms can transform R&D investment into product innovation more efficiently than small and medium-sized firms (Beneito et al., 2014). However, Pavitt et al. (1987) support the idea that large or small firms have greater innovation efficiency than medium-sized firms and that innovation efficiency has an inverted U-shaped relationship with firm size. This paper adopts the number of employees as the measure of firm size.
R&D staff, know-how, rules and regulations, complementary resources (Wöhrl et al., 2009), and R&D experience are constantly being accumulated as firms age. Credit accumulation in business with customers and financial institutions boosts innovation (Mendi & Costamagna, 2017). Firms also become increasingly overstaffed and bureaucratic as they grow (Chen & Hambrick, 1995), which limits their organisational efficiency in translating R&D investment into innovative outcomes in the face of environmental changes. There is a risk that ageing firms will fall into a competency trap. In contrast, younger firms have greater flexibility (Tsai & Hsu, 2014) and face less inertia and obsolescence (Coad et al., 2016). They can develop new products more quickly. In this study, firm age is calculated by the corresponding statistical year plus 1 minus its founding year.
The definitions of the variables are shown in Table 1.
Variable definition.
The econometric models are formulated to verify the three-dimensional relationship between competitive intensity, innovation efficiency and firm performance.
where αi and βi are the coefficients, Controls represents the set of control variables, such as per capita educational cost (EDU), proportion of state-owned shares (SOE), export intensity (ESI), firm size (FS) and firm age (AGE), and εit is the error term.4Data sources and sample

The basic data mainly come from the Chinese Industrial Enterprise Database (CIED) for the period 1998–2009. The database is conducted and maintained by the National Bureau of Statistics of China. The database provides exhaustive information on state-owned industrial enterprises and nonstate-owned industrial enterprises above a designated size (sales no less than 5 million RMB (guimoyishang in Chinese)) in China. It has been widely employed because of its obvious advantages in broad enterprise coverage, long time horizons and diverse statistical indicators (e.g., An, 2012; Brandt et al., 2012; Song et al., 2011; Weng & Söderbom, 2018; Zhang et al., 2010). At the same time, CIED also has some limitations, such as the lack of key statistical indicators in some years, the outliers of some indicators, different statistical scopes and vague definitions of some indicators. The sample firms that met one or more of the following criteria were excluded from the original dataset: (1) Firms belonging to nonmanufacturing industries such as mining, production and supply of electric power and heat power, production and distribution of water, and production and distribution of gas; (2) Firms with at least one of the indicators such as total assets, paid-in capital, annual average balance of current assets, original value of fixed assets, average annual number of persons employed, main business income, main business cost and gross industrial output being less than or equal to zero; (3) Firms with at least one of the indicators such as R&D expenditure, advertising expense, intermediate industrial input and its component factors such as material input, intermediate input in overhead account, intermediate input in administrative overhead, intermediate input in operating expense being negative; (4) Firms with total assets less than the current assets or net fixed assets; and (5) Firms with accumulated depreciation less than the current depreciation.
The R&D expenditures and output value of new products are consecutively reported only from 2005 to 2007. Accordingly, the dataset used in this paper is drawn from CIED for 2005–2007. Table 2 shows the number of firms before and after dataset cleaning every year. The sample used for the calculation of HHI includes 828,671 observations from 482 four-digit standard industrial classification (SIC) codes for manufacturing industries. The percentages of sample firms with positive R&D investment (RDF) to the total number of firms for each year are 10.167%, 10.571% and 11.048%, respectively. A large majority of Chinese manufacturing firms do not invest in R&D, although the percentage of firms involved in innovation is increasing. Only firms with uninterrupted R&D investment over the sample period were included as sample firms, of which there were 12,020. The same firm in the dataset was identified based on its identification number, name, name of the legal representative, founding time, industry code, major product, city (county) and township where the firm was located in turn by reference to the methods of Brandt et al. (2012) and Ouyang et al. (2015). The final samples include 36,060 firm-year observations, corresponding to a balanced panel of 12,020 firms from 464 four-digit industries.
Overview of the data.
| Year | Original | Cleaned | RDF | RDF (%) | RDI (%) | ONP* (%) | ROS (%) |
|---|---|---|---|---|---|---|---|
| 2005 | 271,835 | 246,060 | 25,018 | 10.167 | 0.409 | 11.583 | 4.693 |
| 2006 | 301,961 | 273,059 | 28,866 | 10.571 | 0.435 | 12.534 | 5.025 |
| 2007 | 336,768 | 309,552 | 34,199 | 11.048 | 0.446 | 11.966 | 6.062 |
| Total | 910,564 | 828,671 |
Some missing or incorrect values were completed to improve the accuracy of the sample. The founding year of Chengdu Karl Mine Equipment Co., Ltd. (Chengdu Keer Kuangshan Shebei Youxian Gongsi in Chinese) in 2005 and 2006 was corrected in accordance with its founding year in 2007. The founding year of Xinjiang Shihezi Dawang Food Co., Ltd. (Xinjiang Shihezi Dawang Shipin Youxian Gongsi in Chinese) was missing in 2005 and 2006. Its founding year was 2006 in 2007. However, it has been operating since 2005. Therefore, its founding year was identified as 2005. The founding year of Fuxin Chiyu Petroleum Machinery Co., Ltd. (Fuxin Chiyu Shiyou Jixie Youxian Gongsi in Chinese) in 2005 was corrected according to 2006 and 2007. The number of employees of the Honghe Tobacco Group Honghe Cigarette Factory (Honghe Yancao Jituan Honghe Juanyanchang in Chinese) in 2007 was estimated with the average number of employees in 2005 and 2006.
To eliminate the impact of price fluctuations and minimise the possibility of introducing new systematic errors by inflation, all monetary values in 2007 and 2008 were deflated based on constant 2005 prices. The consumer price index (CPI), the producer price index (PPI) and the price index of investment in fixed assets are employed as the deflators, which are drawn from the China Statistical Yearbook from 2006 to 2008. Sales revenue, total industrial output value, output value of the new product, operating profit and delivery value of export were deflated by the producer price index. The paid-in capital and state-owned capital were deflated by the price index of investment in fixed assets. The staff educational cost was deflated by the consumer price index. The proportions of human capital expenditures and fixed assets expenditures are 0.55 and 0.45, respectively (Beneito et al., 2015; Loeb & Lin, 1977). The R&D expenditure was deflated according to the following equation: 0.55*CPI+0.45*PPI. Table 3 reports the mean, standard deviation and correlation of the main variables. The average competitive intensity is 0.975, with a standard deviation of 0.039. The annual means are 0.974, 0.975 and 0.977, respectively, implying that Chinese firms face intensifying competition. The innovation efficiency is approximately 0.050 with a standard deviation of 0.092, indicating that most Chinese firms have poor innovation capability. There are only 1,041 firms with an average innovation efficiency above 0.200 during the sample period, suggesting there is great potential for improving the innovation efficiency of Chinese manufacturing firms. The average return on sales is 0.048 with a standard deviation of 0.179, which is lower than the average return on sales of all the samples (0.053), indicating that R&D activities definitely have not improved firm performance.
| Variables | Mean | S.D. | 1 | 2 | 3 | 4 | 5 | 6 | 7 | 8 |
|---|---|---|---|---|---|---|---|---|---|---|
| 1. COI | 0.975 | 0.039 | 1.000 | |||||||
| 2. IE | 0.050 | 0.092 | -0.002 | 1.000 | ||||||
| 3. ROS | 0.048 | 0.179 | 0.043** | 0.012* | 1.000 | |||||
| 4.EDU | 0.309 | 0.883 | -0.018** | -0.006 | 0.036** | 1.000 | ||||
| 5. SOE | 0.092 | 0.263 | -0.054** | 0.048** | -0.049** | 0.010 | 1.000 | |||
| 6. ESI | 0.177 | 0.314 | 0.018** | 0.081** | -0.011* | -0.055** | -0.098** | 1.000 | ||
| 7. FSc | 5.691 | 1.354 | -0.049** | 0.221** | -0.017** | -0.041** | 0.246** | 0.142** | 1.000 | |
| 8. AGE | 15.157 | 15.505 | -0.032** | 0.120** | -0.058** | 0.005 | 0.304** | -0.083** | 0.347** | 1.000 |
The time horizons of this study cover only three years. The individual fixed effect method is subject to biased parameter estimates if the time span of the sample is too short (Kudina et al., 2009). The feasible generalised least squares (FGLS) method has a lower requirement for the homogeneity of data variance. The heteroscedasticity between individuals of cross sections can exist as long as the simultaneous residuals are not correlated (Harvey, 1976). Consequently, the FGLS method is employed to test the related research hypotheses in this study. Furthermore, the interaction term was introduced in the analysis of the moderating effect. The interaction term (COI×IE) is usually highly correlated with its individual variables. They were generated by the mean-centred variables to reduce multicollinearity (Tsai & Hsu, 2014).
5.1Testing hypothesisThe estimation results of the direct relationships between competitive intensity, innovation efficiency and firm performance are shown in Table 4. Model 1 and Model 3 only include the control variables, such as per capita educational cost, export intensity, firm age, the proportion of state-owned shares and firm size. The estimates of Model 1 suggest that innovation efficiency is positively affected by export intensity, firm age and firm size. Furthermore, by comparing the coefficients of firm size in Table 4 (Table 6) with the counterparts in Table 5 (Table 7), it is revealed that firms in fast-changing industries have greater innovation efficiency. The estimated coefficient of the proportion of state-owned shares is negative and significant, indicating that a firm with a higher proportion of state-owned shares has less innovation efficiency. This result is consistent with the findings of Li et al. (2017). Job training has no significant effect on innovation efficiency. However, it has a positive and significant effect on innovation efficiency when δ is 0.25 (Tables 5 and 7). These results indicate that firms in industries undergoing rapid technological development need more job training. The regression parameters of Model 3 indicate that job training and firm size can increase firm profitability. In contrast, firm profitability is negatively influenced by the proportion of state-owned shares, export intensity and firm age. The different effects of job training on IE and ROS suggest that job training in the Chinese manufacturing industry may mainly improve production efficiency rather than innovation efficiency. The estimates of the control variables are quite similar in sign and magnitude in Models 3–7.
Estimation results of the roles of competition intensity on innovation efficiency and firm performance.
| Variables | Model 1 | Model 2 | Model 3 | Model 4 | Model 5 | Model 6 | Model 7 |
|---|---|---|---|---|---|---|---|
| Dependent variables | IE | ROS | |||||
| Controls | |||||||
| 1.EDU | 0.0000 | -0.0002 | 0.0075⁎⁎⁎ | 0.0073⁎⁎⁎ | 0.0077⁎⁎⁎ | 0.0077⁎⁎⁎ | 0.0078⁎⁎⁎ |
| 2. SOE | -0.0029⁎⁎⁎ | -0.0031⁎⁎⁎ | -0.0242⁎⁎⁎ | -0.0233⁎⁎⁎ | -0.0237⁎⁎⁎ | -0.0220⁎⁎⁎ | -0.0221⁎⁎⁎ |
| 3. ESI | 0.0157⁎⁎⁎ | 0.0154⁎⁎⁎ | -0.0104⁎⁎⁎ | -0.0112⁎⁎⁎ | -0.0104⁎⁎⁎ | -0.0102⁎⁎⁎ | -0.0099⁎⁎⁎ |
| 4. FS | 0.0134⁎⁎⁎ | 0.0135⁎⁎⁎ | 0.0023⁎⁎⁎ | 0.0023⁎⁎⁎ | 0.0019⁎⁎⁎ | 0.0019⁎⁎⁎ | 0.0019⁎⁎⁎ |
| 5. AGE | 0.0004⁎⁎⁎ | 0.0004⁎⁎⁎ | -0.0006⁎⁎⁎ | -0.0006⁎⁎⁎ | -0.0006⁎⁎⁎ | -0.0006⁎⁎⁎ | -0.0006⁎⁎⁎ |
| Independent variables | |||||||
| 1. COI | 0.3146⁎⁎⁎ | 0.1567⁎⁎⁎ | 0.1514⁎⁎⁎ | 0.1530⁎⁎⁎ | |||
| 2. COI2 | -0.1731⁎⁎⁎ | ||||||
| 3. IE | 0.0347⁎⁎⁎ | 0.0358⁎⁎⁎ | 0.0369⁎⁎⁎ | ||||
| 4. COI×IE | -0.3258⁎⁎⁎ | ||||||
| Constant | -0.0366⁎⁎⁎ | -0.1785⁎⁎⁎ | 0.0431⁎⁎⁎ | -0.1099⁎⁎⁎ | 0.0431⁎⁎⁎ | -0.1047⁎⁎⁎ | -0.1062⁎⁎⁎ |
| Observations | 36060 | ||||||
| R-squared | 0.8503 | 0.8610 | 0.3347 | 0.3643 | 0.3837 | 0.3276 | 0.3430 |
| Adjusted R2 | 0.8502 | 0.8610 | 0.3346 | 0.3642 | 0.3836 | 0.3275 | 0.3429 |
| D.W. | 0.5121 | 0.5130 | 1.2772 | 1.2770 | 1.2756 | 1.2757 | 1.2758 |
| F-statistic | 40945.190 | 31897.380 | 3626.799 | 3443.637 | 3741.046 | 2509.554 | 2353.121 |
Estimation results of the roles of competition intensity on innovation efficiency and firm performance (δ=0.25).
| Variables | Model 1 | Model 2 | Model 5 | Model 6 | Model 7 |
|---|---|---|---|---|---|
| Dependent variables | IE | ROS | |||
| 1.EDU | 0.0003⁎⁎⁎ | 0.0003⁎⁎⁎ | 0.0076⁎⁎⁎ | 0.0078⁎⁎⁎ | 0.0078⁎⁎⁎ |
| 2. SOE | -0.0047⁎⁎⁎ | -0.0043⁎⁎⁎ | -0.0237⁎⁎⁎ | -0.0219⁎⁎⁎ | -0.0220⁎⁎⁎ |
| 3. ESI | 0.0125⁎⁎⁎ | 0.0133⁎⁎⁎ | -0.0106⁎⁎⁎ | -0.0098⁎⁎⁎ | -0.0101⁎⁎⁎ |
| 4. FS | 0.0146⁎⁎⁎ | 0.0143⁎⁎⁎ | 0.0019⁎⁎⁎ | 0.0018⁎⁎⁎ | 0.0018⁎⁎⁎ |
| 5. AGE | 0.0004⁎⁎⁎ | 0.0004⁎⁎⁎ | -0.0006⁎⁎⁎ | -0.0006⁎⁎⁎ | -0.0006⁎⁎⁎ |
| Independent variables | |||||
| 1. COI | 0.1800⁎⁎⁎ | 0.1511⁎⁎⁎ | 0.1537⁎⁎⁎ | ||
| 2. COI2 | -0.0922⁎⁎⁎ | ||||
| 3. IE | 0.0353⁎⁎⁎ | 0.0376⁎⁎⁎ | 0.0377⁎⁎⁎ | ||
| 4.COI×IE | -0.3164⁎⁎⁎ | ||||
| Constant | -0.0410⁎⁎⁎ | -0.1281⁎⁎⁎ | 0.0434⁎⁎⁎ | -0.1043⁎⁎⁎ | -0.1062⁎⁎⁎ |
| R-squared | 0.7860 | 0.7888 | 0.3861 | 0.3273 | 0.3415 |
| Adjusted R2 | 0.7860 | 0.7887 | 0.3859 | 0.3272 | 0.3414 |
| D.W. | 0.5120 | 0.5166 | 1.2754 | 1.2758 | 1.2760 |
| F-statistic | 26488.22 | 19232.03 | 3778.343 | 2506.258 | 2336.985 |
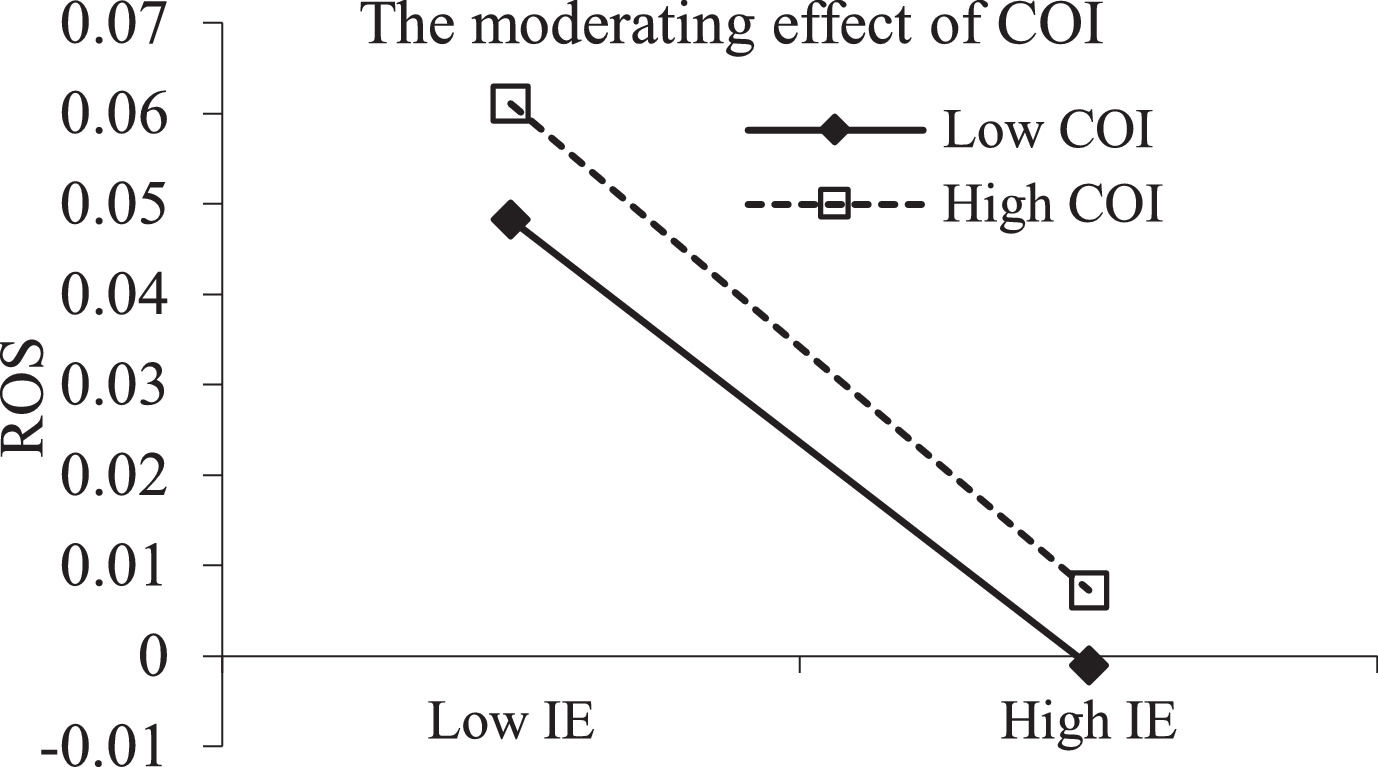
Model 2 includes the controls, competitive intensity and the squared term. There is a statistically significant inverted U-shaped relationship between competitive intensity and innovation efficiency (α1=0.3146,p−value=0.000; α2=−0.1731,p−value=0.000). Thus, Hypothesis 1 is verified. Only moderate competition can help a firm improve its innovation efficiency. It is undesirable to improve innovation efficiency in competitive circumstances that are too high or too low. Model 5 introduces the controls and innovation efficiency to test the relationship between innovation efficiency and firm performance. As expected, the variable IE has a positive and significant impact on firm performance; that is, the more efficient a firm is in its innovation activities, the better its performance. This result is consistent with that of Cruz-Cázares et al. (2013). Thus, Hypothesis 2 is supported. Hypothesis 3 proposes that competitive intensity may moderate the relationship between innovation efficiency and firm performance. The results of the moderated regression analysis are shown in Models 6–7. Model 4 only includes the controls and competitive intensity. Model 6 includes the controls, competitive intensity and innovation efficiency. The regression coefficients of competitive intensity are positive and significant in the three models. This suggests that competition improves firm profitability. Model 7 includes the controls, competitive intensity, innovation efficiency and their interaction terms. The negative and significant regression coefficient of the interaction term shows that competitive intensity negatively moderates the effect of innovation efficiency on firm performance. This supports Hypothesis 3a but contradicts Hypothesis 3b. Fig. 2 shows the negative moderating effect of competitive intensity. As shown in Fig. 2, it even changes the positive influence of innovation efficiency on firm performance when the competition is sufficiently fierce. The main reason is that competition undermines the profitability of new products. Competition drives the rival's imitation behaviour and accelerates knowledge diffusion of new products, reducing rivals’ development costs. The quick reactions of rivals weaken the superiority of innovation efficiency improvements. Marketing proficiency is paramount in ensuring the successful commercialisation of new products in fiercely competitive environments (Lee & Wong, 2011). Marketing efforts can provide greater customer support for new products. The increase in marketing costs and decline in adoption rates caused by competition lower the profit of new products. Competition drives firms to invest too much in incremental innovation, which diverts limited resources from radical innovation activities. Price increases cannot counteract the rise in other costs because of the low level of innovativeness. R&D investment has a higher adjustment cost than physical investment (Kang et al., 2017). The persistence of R&D crowds out the investment that may be used for production capacity or other improvements (Tsai et al., 2009), which undermines the improvements in the production process and the quality of the product (Weng & Söderbom, 2018), damaging the profitability of new products.

The inflexion point of the effects of competition on innovation efficiency is 0.9087 ((−0.3146)/(2×(−0.1731))), as Table 4 shows. When the competitive intensity (COI) is less than 0.9087, competition can stimulate firms to improve innovation efficiency. Otherwise, competition will hamper the improvement of innovation efficiency. The mean of competitive intensity was 0.975 in the Chinese manufacturing industry from 2005 to 2007, suggesting that competition has already inhibited innovation in most Chinese firms. The moderating role of competition has changed the positive effect of innovation efficiency on firm performance, as shown in Fig. 2. The intersection point is 0.1133 (0.0369/0.3258), indicating that the improvement of innovation efficiency will reduce the profit of firms if the competitive intensity is greater than 0.1133. The improvement of innovation efficiency may have harmed the profitability of most Chinese firms for the period 2005–2007.
5.2Robustness checksThe updating speed of technology is increasing, especially in the high-tech industry. The R&D capital stock will depreciate more quickly. The depreciation speed of R&D investment may affect the innovation behaviour of firms. This may change the relationships between competitive intensity, innovation efficiency and firm performance. To verify whether the relevant research conclusions still hold true, the depreciation rate of R&D capital (δ) is assumed to be 0.25. The results (Table 5) show that the conclusions are still consistent with those of δ=0.15. Furthermore, we adopt the gross industrial output value instead of sales revenue as the main reference indicator. The relevant results are still true, as shown in Table 6. The estimation results are shown in Table 7 when the indicator of gross industrial output value and δ=0.25 are adopted simultaneously. Although the magnitude of the coefficients varies slightly, the sign and significance remain similar to the results shown in Table 5. With the rapid growth of China's economy, innovation policies from the Chinese government or changes in the macroeconomic environment may affect our conclusions. In addition, a pooled OLS controlling for year effects is conducted to test the time effect. As Table 8 shows, the time effect is insignificant. Our results are still consistent.
Estimation results of the roles of competition intensity on innovation efficiency and firm performance. (by gross industrial output value).
Estimation results of the roles of competition intensity on innovation efficiency and firm performance (by gross industrial output value and δ=0.25).
Estimation results of the roles of competition intensity on innovation efficiency and firm performance (pooled OLS).
Research on the relationship between competition and innovation is still not consistent (Mendi & Costamagna, 2017). Most of the extant literature about the effects of competition on firm innovation focuses on the effects of competition on R&D investment (e.g., Aghion et al., 2005; Schumpeter, 1934), which explores the linear or nonlinear roles of competition on innovation investment. This paper empirically investigates the relationships between competition, innovation efficiency and firm performance based on panel data of Chinese industrial firms. The findings reveal the roles of competition on innovation efficiency and firm performance. First, competitive intensity has an inverted U-shaped effect on innovation efficiency, and only moderate competition exerts the appropriate amount of pressure to improve firm innovation efficiency. Competition increases knowledge search activities and promotes innovation (Aliasghar et al., 2022). The lack of competition leads to delays and inefficiencies in innovation activities (Zhang, 2017). Excessive competition exacerbates uncertainties and uses up limited resources. It also deteriorates internal or external collaboration of firm innovation activities (Tsai & Hsu, 2014) and reduces the contributions of resources and organisational routines to the development of new products (Lee & Wong, 2011). It also adds to the complexity of knowledge learning and knowledge diffusion among firms (Haschka & Herwart, 2020). All of these impede the efficient transformation of R&D input into innovation output. Overcompetition lowers innovation efficiency.
Second, competition negatively moderates the relationship between innovation efficiency and firm performance. The improvement of innovation efficiency increases the innovation output of limited R&D input. It guarantees higher financial returns. However, innovation is an integrated system that includes requirement analysis, production, marketing, service and other activities. The improvement of innovation efficiency may appropriate the resources used for other activities, especially under neck-and-neck competition circumstances. Competition also cuts the price of new products. This might mean that innovation is unprofitable for firms. In particular, Chinese firms have a poorer capability to translate technology into commercial outputs (Chen & Guan, 2012), decreasing the positive effect of innovation efficiency on firm performance. Competition can also force a firm to increase its activities such as value-added services, marketing and promotion, which exerts a direct positive effect on firm performance.
The motivation of innovation is to make profits. Competition affects the innovation activities of firms. This paper empirically examines the roles of competition on innovation efficiency and firm performance based on the panel dataset of 12,020 Chinese manufacturers. The relevant findings can help firms make better decisions about innovation strategies according to the particular market situation. Although some distinct contributions have been provided, limitations still exist. First, competitive intensity is a multidimensional construct. This paper only adopts the Herfindahl index to represent competitive intensity. Other measures, such as industry concentration, the Lerner index (Lerner, 1934), the Boone indicator (Boone, 2008), the H statistic (Bikker et al., 2012) and even the subjective perception of firms, may also be adopted for future research. Second, only firms with uninterrupted R&D investments are selected as the sample. This may cause selection bias. Third, the innovation activities of firms with different technological levels have different impacts on firm performance (Cruz-Cázares et al., 2013). This paper does not deal with the technological differences between industries. Fourth, firm performance may reversely affect innovative behaviours (Cruz-Cázares et al., 2013), which will induce the problem of endogeneity. Despite these limitations, the main results of this study can be used as references for enterprises’ innovation activities and national R&D policies.
The author is grateful for the insightful and valuable comments and suggestions provided by the Editor and two anonymous reviewers. This study was funded by the National Office for Philosophy and Social Sciences (CN) (Grant No. 20BGL044)
