


How do exporters react to changes in formal institutional contexts? We hypothesise that when the formal institutional context reduces uncertainty, family-firm exporters increase their productivity more than those of non-family firms. To examine our general conjecture empirically, we leveraged the shift from a flexible to a fixed exchange rate regime that occurred with the adoption of the euro. Our findings showed that, after adopting the euro, intra-European Union (EU) family-firm exporters achieved higher productivity than non-family-firm exporters. Owing to the elimination of exchange rate volatility, intra-EU family-firm exporters, who were particularly sensitive to uncertainty because of their specificities related to wealth concentration, family-oriented goals, and corporate transparency, became more willing to adopt investment decisions than intra-EU non-family-firm exporters. Consequently, these investments yielded significant improvements in the productivity levels of the former group. We also found that the gains in productivity were not evenly distributed among intra-EU family-firm exporters. The introduction of the euro facilitated the transition of intra-EU family-firm exporters from low to intermediate productivity levels. Moreover, it allowed those with initially intermediate productivity levels to remain in the same group, while reducing the likelihood of falling behind high-productivity intra-EU family-firm exporters.
Globalisation of the world economy has spurred firms to expand their operations internationally to foster growth and bolster survival. In this global scenario, the formal institutional context, composed of formal rules such as laws and regulations (North, 1990) that shape the conditions under which a firm's leaders make decisions, constitutes one of the main research streams in international business (Teagarden et al., 2018). However, the impact of formal institutional changes on international companies’ decisions and their subsequent impact on performance are contingent on the heterogeneity among firms. A growing body of research demonstrates that international family firms differ from their non-family counterparts (for a recent literature review, see Arregle et al., 2021; Pukall & Calabrò, 2014) because family firms combine business- and family-oriented goals (Basco, 2017) and consequently react differently to contextual pressures and stimuli. The introduction of a single European currency, the euro, within the framework of formal institutional changes for exporters, marked a significant transition from a flexible to a fixed exchange rate regime. This shift effectively eliminated exchange rate fluctuations within the eurozone. Consequently, a well-defined set of regulations emerged within the formal European institutional framework. In this regard, the European Union (EU) offers a compelling backdrop for examining how formal institutions impact the productivity of exporters. More precisely, a research question of significant interest emerges when we direct our attention towards how international firms respond to such a formal institutional change. Does the transition from a variable to a fixed exchange rate regime exert a balanced impact on family- and non-family-firm exporters’ productivity?
As the exchange rate shifted from a flexible to a fixed regime, thereby cancelling exchange rate fluctuations within the eurozone, the adoption of a single currency had a unique and specific impact on firms located in and trading with countries that embraced the euro (hereinafter, intra-EU exporters). One of the undiscussed advantages of the process leading to a common currency is the elimination of exchange rate volatility among the EU members. This resulted in a reduction in the uncertainty faced by intra-EU exporters in terms of price volatility and demand uncertainty (e.g., Eudey, 1988; Giavazzi & Pagano, 1988). Therefore, introducing the euro, which eliminated exchange rate volatility, was expected to affect intra-EU exporters’ investment and productivity levels. However, this could not apply equally to all intra-EU exporters because the new fixed exchange rate regime changed exporters’ perceptions of risk, typifying a main factor constraining firms’ internationalisation (Johanson & Vahlne, 1977).
We contend that the diversity of intra-EU firm exporters’ sensitivities to uncertainty lead to differential benefits in terms of productivity. More precisely, we maintain that the decrease in uncertainty related to price volatility, facilitated by adoption of the euro, has helped risk-averse intra-EU exporters pursue additional investments. These investments play a role in augmenting productivity by acting as a pathway towards strengthening efficiency. The sensitivity of firms to uncertainty varies and is influenced by the structure, composition, and identities of the owners’ rights (Blair, 1995; Shleifer & Vishny, 1997). One important aspect in this regard is the nature of the dominant owners, specifically, whether the firm is a family firm. Family ownership control over businesses significantly influences family firms’ sensitivity to uncertainty (Bianco et al., 2013), primarily because of the distinctive characteristics associated with family firms. These characteristics include limited wealth diversification, family-oriented goals, and a tendency towards secretive and opaque practices, resulting in a lack of corporate transparency. Therefore, we suggest that the reluctance of family-firm exporters towards investment spending under conditions of uncertainty (relative to non-family-firm exporters) can be mitigated in a fixed exchange regime. Given that uncertainty in price volatility and demand decreased for intra-EU firm exporters in the fixed exchange rate regime, we hypothesised that intra-EU family-firm exporters benefitted more from productivity than intra-EU non-family-firm exporters after adopting the euro.
Additionally, considering the heterogeneity of family firms (Daspit et al., 2021) and the literature on irreversible investment decisions under uncertainty (e.g., Darby et al., 1999; Lyandres & Zhdanov, 2010), we argue that the heterogeneity of family-firm exporters in terms of different initial total factor productivity (TFP) levels shape their decision to invest in technology, eventually affecting productivity changes. Therefore, we argue that euro adoption reduces low-productivity firms’ opportunity cost because of the irreversible investment expenditure and produces a minimal increase in the opportunity cost of waiting for high-productivity firms. Under this expected scenario, we hypothesised that productivity upgrading after euro adoption was more likely for either low- or high-productivity intra-EU family-firm exporters because the former experienced a lower risk of unwanted investments, and the latter faced better investment opportunities.
To test our hypotheses, we use a representative sample of intra-EU exporters operating in various Spanish manufacturing industries from 1991 to 2014. First, we compare the productivity of intra-EU family- and non-family-firm exporters before and after the introduction of the euro, using a difference-in-difference-in-differences estimator. Our results suggest that intra-EU family-firm exporters attain higher TFP levels than their non-family counterparts when the exchange rate regime shifts from a flexible to a fixed system. Second, we found that while intra-EU family-firm exporters with low initial productivity levels were able to increase their TFP levels after the adoption of the euro, high-productivity intra-EU family-firm exporters became less likely to fall into the low-productivity group, the TFP of intermediate-productivity intra-EU family-firm exporters remained rather stable and did not significantly change upon comparing the period under a fixed exchange rate regime with that under a flexible exchange rate regime.
Our analysis makes important theoretical and practical contributions to the literature. First, it contributes to the debate on the relationship between exports and productivity. Previous research has focused on examining the association between exports and productivity (Delgado et al., 2002) and exploring the mechanisms of this relationship, such as learning by exporting (Girma et al., 2004). We adopt a different approach by exploring how firm productivity is affected by changes in the formal institutional context governing the rules of international trade. Our study reveals that not all firms respond equally to formal institutional changes. In particular, the family nature of the firm affects how it reacts to formal institutional changes, consequently modifying the export–productivity relationship. Accordingly, our second contribution sheds light on the international family business literature (Alayo et al., 2022) and the context-theorising debate (Krueger et al., 2021). While previous studies have extensively investigated the internationalisation of family firms (Alessandri et al., 2018; Arregle et al., 2019; Kano & Verbeke, 2018; Urkiola and Alayo, 2022), our study serves to bridge the contextless research gap in family business studies (Amato, Basco, & Lattanzi, 2022). In this sense, we document the different productivity outcomes experienced by intra-EU family-firm exporters. These variations arise because of shifts in the formal institutional context, contingent upon their initial productivity status (i.e., pre-euro adoption). Consequently, to better understand firm heterogeneity, particularly that of family businesses, future research should go beyond mere demographic considerations related to ownership, governance, and management composition (e.g., Diaz-Moriana et al., 2019). It should encompass an exploration of the contextual factors that influence their behaviour and initial positions, allowing them to interpret changes in the formal institutional context.
2Hypotheses development2.1The exchange rate regime and the export–productivity relationshipMost studies measure productivity at the aggregate and firm levels using the TFP concept. Following Comin (2010), we define TFP as the proportion of output not explained by the employed inputs. Research conducted at the firm level has acknowledged the heterogeneity of firms’ TFP. These studies aimed to understand why firms with similar input levels produced highly different output levels. Since Nadiri (1970), the economic literature has identified two major sets of TFP determinants: technological characteristics and relative factor price movements. Castiglionesi and Ornaghi (2013) showed that the average TFP growth of Spanish manufacturing firms could be fully explained by technological progress and human capital. Mastromarco and Zago (2012) report similar results. Therefore, every factor that affects a firm's technological progress may also affect its TFP. Harris and Moffat (2015) examine several possible TFP determinants using a British plant-level dataset. According to this study, knowledge creation was the most important TFP determinant, followed by spatial location. External economies of scale are the third most important TFP determinant. Harris and Moffat (2015) found that external economies of scale associated with market-based competition are significantly more important in increasing TFP than internal economies of scale owing to firm size. Therefore, multi-plant enterprises that operate in a single region may be less efficient than single- or multi-plant enterprises that are exposed to international competition.
Beyond the aforementioned factors that influence TFP, economic institutions, in a broader context, directly affect capital accumulation, thus indirectly affecting productivity. For instance, the enforcement of property rights diminishes economic uncertainty and instability, thereby safeguarding the value of owner/shareholder investment (Johnson et al., 2002). Consequently, a robust rule of law increases the likelihood of preserving specific regulations intended to safeguard stakeholder interests, including investment opportunities. Overall, cultivating stability within property rights systems establishes an institutional framework that encourages investment (Stulz, 2005). Kim and Loayza (2019) examined the diverse effects of distinct determinants on firm productivity growth, shedding light on the ever-evolving nature of institutional dimensions over time. Following a similar trajectory, on a broader scale, Tebaldi (2016) underscored the significance of formal instructional quality for national-level productivity growth.
The empirical literature indicates that firms that export abroad are more productive than those that do not (e.g., Delgado et al., 2002; Girma et al., 2004). On the one hand, because export activities are subject to sunk costs, only highly productive firms find it convenient to enter foreign markets. On the other hand, exporting may increase productivity, particularly if the product is exported to more competitive markets, with competitors closer to the technological frontier. To survive, exporters must invest in technological advances and learn from innovative competitors (Girma et al., 2004). Exporters’ investments in technology and, therefore, productivity are typically subject to uncertainty. Export uncertainty comprises two main components. The first is the risk of competition in foreign markets because exporters are exposed to political concerns, cultural issues, and environmental changes that are difficult to anticipate. The second is the uncertainty related to exchange rate volatility, which affects firms’ income volatility through prices and demand. The literature has extensively analysed economic uncertainty and its effects on investment (e.g., Byrne & Davis, 2005; Dixit & Pindyck, 1994).
The link between formal institutions and internationalisation behaviour has been considered in the literature in the context of market-entry modes (Brouthers, 2002). Specifically, the export behaviour literature emphasises the importance of sunk costs in export decisions (e.g., Baldwin, 1988; Baldwin & Krugman, 1989; Dixit, 1989a, 1989b; Krugman, 1989). Exporters incur costs that may be sunk in nature when entering foreign markets, such as the associated costs of research on foreign demand and competition, establishing marketing and distribution channels, adjusting their product characteristics to meet foreign tastes, and/or fulfilling foreign countries’ quality and security legislation (Bernard & Jensen, 2004; Roberts & Tybout, 1997). Therefore, exporters’ investment expenditures are largely irreversible, that is, they are mostly sunk costs that cannot be recovered. This irreversibility makes exporters’ investments especially sensitive to uncertainty over future exchange rates. When an exporter makes an irreversible investment expenditure, it gives up the possibility of waiting for new information, which may affect the desirability or timing of the expenditure. Therefore, exporters may delay irreversible decisions to learn more about the market and economic conditions.1, 2, 3, 4, 5, 6, 7, 9, 10, 11, 12 and 13 Waiting becomes an appropriate alternative to investing (Dixit & Pindyck, 1994). In other words, exporters may find it convenient to wait rather than commit to a particular investment level.
As uncertainty is one of the main constraints that exporters must address (Johanson & Vahlne, 1977), in the context of price volatility and demand uncertainty, typical of a flexible exchange rate regime, risk-averse firms tend to produce and demand less of all inputs related to labour, capital, and technology (Baron, 1971; Leland, 1972; Sandmo, 1971).2 In the European context, adopting the euro as a single currency in 1999 for 19 of the 28 European Union member states implied, for the first time, that European exporters that traded with countries belonging to the eurozone were subject to a fixed exchange rate regime. Exchange rate fluctuations were cancelled within the eurozone. Fixed exchange rate regimes represent a monetary institution used by governments, consisting of clear and visible rules for currency behaviour (Bodea, 2010). Adopting the euro reduced the uncertainty caused by price volatility and profits for intra-EU firm exporters, with an ensuing incentive for risk-averse intra-EU firm exporters to invest to achieve productivity improvements.
2.2Family versus non-family intra-EU exporters’ productivity under a change in the exchange rate regimeExporters form a heterogeneous group of firms, and the nature of their heterogeneity influences investment decisions and outcomes (Hoskisson et al., 2002; Wright et al., 1996). In particular, investment decision-making is likely to differ between family- and non-family-firm exporters for several reasons. First, the controlling family typically has an undiversified wealth position because of its concentrated ownership (Anderson et al., 2003; Anderson & Reeb, 2003; Hiebl, 2012; Schulze et al., 2001). Consequently, because of their ensuing greater risk aversion, more conservative management and governance behaviours are expected in family firms compared to non-family firms; for example, in terms of growth (Hamelin, 2013) and/or the propensity to innovate (Migliori et al., 2020). In this regard, Bianco et al. (2013) find that family firms’ investments are significantly more sensitive to uncertainty than those of non-family firms. This greater sensitivity to uncertainty is basically because of the higher risk aversion and greater opacity of family firms.
Second, family firms also differ from other types of organisations because of the existence of two interlinked systems: family and business (Berrone et al., 2012; Gomez-Mejia et al., 2007). Family management, which reinforces the position of the controlling family as the dominant coalition within the organisation, gives rise to a distinct set of family-centred goals and increases the overlap between the family and firm (Aparicio et al., 2017). The intertwining of the controlling family's interests and values with the business objectives leads to ambidexterity in family firms’ behaviours (Matzler et al., 2015). Family managers typically have strong emotional and social bonds with their firms and develop strong psychological connections (Pierce et al., 2001). As family firms bear the internal risk of pursuing family-oriented goals (Martin & Gomez-Mejia, 2016), they are likely to be more conservative in investment decisions than non-family firms. Put differently, family firms are more inclined to prioritise long-term stability and sustainability over aggressive growth or high-risk investments. As a result, family firms tend to prioritise investments that maintain the status quo (Morck & Yeung, 2003). These investments include protecting the business for future generations and fulfilling non-economic goals linked to family needs and expectations.
Finally, in addition to the features of wealth diversification and family-oriented goals, family firms are generally less transparent (Anderson et al., 2009) regarding corporate and management practices than non-family firms. They tend to be less willing to produce and disclose information to stakeholders than non-family firms. The opaque behaviour of family firms is related to their intention to keep things within family boundaries and facilitate the private benefits of control, thereby preserving their entrenchment culture. Bianco et al. (2013) show that family business opacity makes family firms more cautious about irreversible investment decisions.
When faced with irreversible investment decisions in exports, the value of waiting is higher for risk-averse agents (Isik, 2005). Thus, we posit that family-firm exporters are likely to delay such decisions compared to their non-family counterparts, with the benefit of acquiring better information about prices, costs, and other market conditions. However, such a delay becomes part of the investment costs (by being incorporated into the investment project's expected net present value) and may have a negative effect on family-firm exporters’ factor productivity. Because the adoption of the euro eliminated exchange rate volatility for intra-EU exporters (Darby et al., 1999), intra-EU family-firm exporters, who usually exhibit greater risk aversion than non-family firms owing to the family's substantial wealth tied to the business, the intricate alignment of family and business strategies, and their inclination towards less transparent practices to uphold the family-centric culture, would promote investments more than non-family exporters and, consequently, improve their productivity.3 In other words, we suggest that the introduction of the fixed exchange rate regime within the eurozone has favoured intra-EU family-firm exporters’ investment (and, consequently, their productivity levels) relative to intra-EU non-family firm exporters. Therefore, our first hypothesis is presented as follows:
Hypothesis 1 : Intra-EU family-firm exporters, following the adoption of the euro, exhibit higher levels of productivity improvement compared to their non-family counterparts.
We now posit that the productivity benefits of adopting the euro are not uniform across intra-EU family-firm exporters. Specifically, based on the literature on irreversible investment decisions under uncertainty (e.g., Darby et al., 1999; Lyandres & Zhdanov, 2010), we propose that the likelihood of family-firm exporters reaping productivity gains after the adoption of the euro depends on their initial productivity level.
Darby et al. (1999) and Lyandres and Zhdanov (2010) explicitly consider the value of waiting when assessing the profitability of an investment, that is, delaying the investment and therefore increasing the value of the investment opportunity. First, Darby et al. (1999) extend the Dixit–Pindyck (1994) model to varying degrees of price uncertainty, where price uncertainty is caused by exchange rate volatility. Considering risk-neutral firms, Darby et al. (1999) fixed two price thresholds that defined the waiting region for irreversible investment decisions: a lower threshold associated with the decision to exit the market and a higher threshold associated with the decision to invest. These authors show that above a minimum level of exchange rate volatility, investments are inhibited owing to uncertainty and vice versa. If volatility is sufficiently low, a positive relationship is obtained between risk and investment. This happens because volatility allows producers to diversify away from domestic markets. Second, similar to Darby et al. (1999), Lyandres and Zhdanov (2010) provide a real options model in which firms risk defaulting on their debt. While the optimal investment timing is determined by the trade-off between the value of immediate cash flows from the investment and the value of the option to wait, in their model, the latter is affected by the possibility of a firm defaulting on its debt. Highly indebted companies face a higher risk of default, in which case they may be taken over by debt holders, leading to a potential loss of investment options. Thus, the presence of risky debt reduces the value of waiting, and highly leveraged firms are expected to exercise their investment opportunities earlier (i.e., speed up their investment) than their unleveraged counterparts. This is the so-called accelerated investment effect (e.g., Boyle & Guthrie, 2003; Lyandres & Zhdanov, 2010).
Applying Lyandres and Zhdanov's (2010) logic to our export framework, exporters may optimally delay investment in a positive net present value project if they can increase the value of their investment opportunity. However, because investments in new technology demand significant financial resource commitments when exporters’ investment decisions are financed via debt, they would become sensitive to the financial frictions they must face (Lyandres & Zhdanov, 2010). Exporters with lower productivity typically incur higher financing costs than their higher-productivity counterparts. This discrepancy arises because exporters with greater productivity can navigate financial constraints more effectively by using self-financing strategies (Moll, 2014). Therefore, a low-productivity exporter is more likely to default on its debt and is therefore more prone to accelerate its investment decisions (i.e., the value of the waiting option decreases). However, for high-productivity exporters, financial constraints and the risk of bankruptcy are not problematic because they have better access to financial resources (based on the value of their reputation) and the possibility of reinvesting their profits. Owing to the reduction in uncertainty that originated after the adoption of the euro, high-productivity exporters would have more incentives to invest, thereby improving their productivity (and maintaining their competitiveness), as the real value of postponing investments is reduced compared to a more uncertain environment. In this setting, we argue that family firm exporters’ heterogeneity in terms of initial productivity levels determines their investment decisions (with consequences in terms of subsequent productivity gains).
Overall, two different productivity outcomes are expected for intra-EU family-firm exporters, conditional on their initial productivity levels. On the one hand, a reduction in exchange rate volatility implies a decline in the risk of an unwanted investment for low-productivity family exporters and a minimal increase in the opportunity cost of waiting for high-productivity exporters. This means that productivity upgrading is more likely for risk-averse firms characterised by either low or high productivity levels. The former would experience a lower risk of unwanted investment, whereas the latter face more investment opportunities. Therefore, our second hypothesis is stated as follows:
Hypothesis 2 : Compared with their intermediate-productivity counterparts, intra-EU low- and high-productivity family-firm exporters are more likely to increase their productivity after the adoption of the euro.
The analysis is based on a panel of manufacturing firms taken from the Spanish Survey of Business Strategies (SSBS)4, which is conducted yearly by SEPI Foundation. The SSBS covers a wide range of Spanish firms operating in all the country's manufacturing sectors. One of the SSBS's main features is the representative nature of the reference population, which consists of firms with 10 or more employees. The SSBS contains firm's information regarding the services and products provided, export activity, employment, technology, and accounting data related to performance. Various sources were used to obtain a comprehensive list of eligible firms from which the sample was drawn. These sources included official business registers, industry databases, and business associations. To minimize selection bias, the survey employed a stratified random sampling strategy to obtain a sample that accurately reflected the characteristics and distribution of manufacturing firms in Spain. The population of interest was first stratified according to relevant characteristics such as company size, industry sector, and geographical region. The strata were defined to capture the diversity of firms operating in Spain. Within each stratum, a random sampling method was applied to select a proportionate number of businesses to be included in the survey. This approach aimed to ensure that firms of different sizes and from various industries and regions were adequately represented in the sample. This dataset is subject to repeated quality and consistency controls.5
Since our focus is to find out the extent to which the adoption of the euro may have affected the subsequent productivity levels of intra-EU family- versus non-family-firm exporters, we use a quasi-experimental method to estimate such effects. Fundamentally, the analysis involves comparing the productivity outcomes across intra-EU family- and non-family-firm exporters, both before adapting the euro (control group) and after its adoption (treatment group). To avoid selection problems related to sample attrition (i.e., short-term appearance and disappearance of firms), we restrict our analysis to firms that were in business during the entire observation period. This also ensures that control and treatment groups remain homogenous over time. We end up with a balanced panel data of 172 firms for the period 1991–2014, that is, 3956 firm-year data points.
3.2VariablesOur dependent variable is TFP, which denotes total factor productivity, defined as output per unit of total input, where total input is a weighted sum of the individual inputs (see Table A.1. in the Appendix). As TFP simultaneously accounts for both labour productivity and output contributions of non-labour inputs, it is an effective measure of production efficiency (Martikainen et al., 2009). We estimate TFP following Levinsohn and Petrin (2003), Wooldridge (2009), and Petrin and Levinsohn (2012). This approach consists of regressing traditional inputs —namely labour and physical capital— on real value added (RVA) to extrapolate an unbiased measure of TFP (or technical efficiency). 6
The independent variables of interest in the second-stage regression are measures of the period after adopting the euro (Euro), intra-EU export intensity (Xeu), and family firm status (Family). First, we define a dummy variable (Euro) that takes the value of 1 for the period 1999–2014 and 0 otherwise. The 1992–1998 period corresponds to the pre-introduction of the euro, a period during which Spain was allowed to change its exchange rate (since the estimates of TFP are based on a lagged-variable specification, our final period is 1992–2014).7 Second, Xeu is the ratio of a firm's sales via exports within EU countries to total exports. This constitutes a measure of export intensity within the European Union. Compared with non-exporters, Spanish companies involved in intra-EU export activities have experienced reductions in input and output price volatility since the adoption of the euro. Third, as the SSBS database includes the number of owners and their relatives in top managerial positions, we follow previous works that have used the SSBS within the family context (e.g., Amato et al., 2020; Campos-García et al., 2020; Cirillo et al. 2022). We define a firm as belonging to a family (i.e., it is a family firm) when (a) the majority of equity belongs to one family; (b) at least one member of that family is actively involved in management (Cirillo et al., 2022). More specifically, we use a dummy variable (Family) that takes the value of 1 when the company is a family firm, and 0 otherwise. This variable enables us to divide treated and control firms into family and non-family firms.
Based on the studies presented in Section 2.1, we include in our analysis several variables that may have a positive or negative impact on firm productivity. Among these variables, we have the ratio of foreign sales through exports to total sales, which is one of the most common forms of measuring a firm's degree of internationalisation, especially for small and medium enterprises (SMEs) (e.g., Almodóvar et al., 2016; Cerrato & Piva, 2012; Keupp & Gassmann, 2009; Onkelinx et al., 2015; Reuber & Fischer, 1997; Salomon & Shaver, 2005). This variable (export) is thus consistent with prior and recent empirical studies that have used the SSBS in the family business field (e.g., Campos-García et al., 2020; Cirillo et al., 2022). The inclusion of this variable allows us to capture the fact that firms exporting in overseas markets tend to be more productive, and that this productivity can affect EU competitiveness (Melitz, 2003). In line with previous research, we also control for both short- and long-run determinants of TFP. Among short-run determinants, we consider capacity utilisation —that is, the firm's average use of capacity—, as well as the proportion of temporary workers employed by the company as of December 31st (e.g., Cappellari et al., 2012). There are two reasons why temporary workers are included in the analysis. On the one hand, due to differences in the number of temporary workers, two firms with the same number of long-term employees may exhibit different output levels. On the other hand, firms with a high proportion of temporary workers may have lower productivity levels because of the productivity gap between tenured and temporary workers (Gagliardi et al., 2023). Among the long-run determinants of TFP, we consider the number of workers with a university degree engaged in Research and Development (R&D) activities (e.g., Ballot et al., 2001; O'Mahony & Vecchi, 2009). Moreover, to control for the dispersion of a firm's economic activities, we include the total number of manufacturing and non-manufacturing plants owned by the company (Bernard et al., 2003). Lastly, we control for the age of the firm to take into account the learning effects associated with operational experience. By adding a vector of firm-specific fixed effects, we further control for time-invariant firm heterogeneity such as the firm's sector or local environment.
3.3Econometric analysis3.3.1Euro and total productivity factor: Average treatment effects on the treated groupTo investigate the differences in productivity-related outcomes of the euro between intra-EU family- and non-family-firm exporters (Hypothesis 1), we use a difference-in-difference-in-differences (DDD) estimator.8 We compare intra-EU family- and non-family-firm exporters before and after adopting the euro. According to the results of the Hausman test, we must use a fixed-effects (FE) estimator to control for firm-specific heterogeneity.9 Formally, the DDD specification of our model is as follows:
where αi is a vector of firm-fixed effects; β1, β2, and β3 are the direct effects of our three main variables on TFP; Xit is a matrix containing all two- and three-way interaction terms for our main regressors; γ is the corresponding vector of coefficients; Zit is a matrix of additional control variables; δ is the related vector of coefficients; and εit is the error term. In Eq. (1), non-family firms that do not export in the European Union constitute the reference group. Therefore, β1 represents the average productivity difference between family firms not exporting in the European Union and the reference group before the adoption of the euro. Fortunately, the family firm variable exhibits enough within variability to estimate this coefficient properly. Coefficient β2 is the marginal impact of export intensity in the European Union on non-family firms’ productivity with respect to the reference group before the adoption of the euro, whereas β3 is the effect of the adoption of euro on the reference group. The vector of coefficients, γ, contains the marginal effects of family and non-family exporters before and after the reform.3.3.2Euro and total factor productivity: Unconditional quantile treatment effects on the treated group
As our dependent variable (i.e., TFP) is negatively skewed (see Section 4.1 below), the mean is not the value that occurs most often. Therefore, a quantile regression analysis becomes necessary. Since we want to isolate the treatment effect from possible confounding effects, we use the unconditional quantile estimator proposed in Firpo et al. (2009), augmented with fixed effects (UQFE). After having determined the value of TFP at each quantile qτ, the UQFE algorithm uses a kernel density function to identify the density of TFP at each quantile:
where KTFP(·) is a kernel function and b, a positive scalar bandwidth. Starting from (2), the algorithm computes the re-centered influence function (RIF) as follows:where I(·) is the indicator function. Finally, we replace TFP in the FE specification with RIF(TFP,q^τ).10 To relax the assumption that errors are independent and identically distributed, we compute cluster-robust standard errors. With respect to conditional quantile regressions, the UQFE estimator carries out a counterfactual analysis in which any coefficient can be interpreted as the marginal effect of an explanatory variable, holding unobserved variables and other regressors fixed. In this sense, the term ‘unconditional’ signifies that we estimate the impact of an independent variable on the marginal distribution of the dependent one, which does not conditionally depend on changes in other factors.3.3.3Euro and total factor productivity: distributional effects

We also investigate whether the adoption of the euro affected the relative position of some firms with respect to the others in terms of TFP (Hypothesis 2). For this purpose, we divide the distribution of TFP in terciles: low, intermediate, and high TFP, that is, three classes (or states) of productivity. Since it is reasonable to assume that future TFP only depends on present TFP and current characteristics of the firm, we model the transition probabilities from one state to another using a Markov Chain model.11 According to the Markov Chain model, the distribution of M firms across K states at time T can be described by the following probability density function:
where P(TFPi,t=k|TFPi,t−1=j) denotes the transition probability that firm i has to pass from state j at time t-1 to state k at time t. Following MacRae (1977), we estimate transition probabilities using a conditional multinomial logit specification:

Eq. (5) enables us to grasp whether the adoption of the euro influenced the distribution of TFP, favouring some specific firms over others.
4Results4.1Descriptive statisticsThe descriptive statistics for the second-stage restricted sample are reported in Table 1, where we distinguished between family and non-family firms.12
Descriptive statistics.
Note: Main descriptive statistics for the second-stage variables when the sample is restricted to firms that always were in business during the period 1991–2014.
Family firms constitute 46.2 % of the sample. On average, they sell 40.5 % of their exports within the European Union, compared to 52.9 % for non-family firms. Comparing the mean value with the median, we can observe that the distribution of intra-EU export intensity is right-skewed for family firms and left-skewed for non-family firms. The average degree of capacity utilisation is similar across firm types: 79.9 % for family firms and 79.5 % for non-family firms. Family firms employ more temporary workers and fewer skilled workers in R&D than non-family firms. The number of company plants ranges between 1 and 386, and family firms have fewer plants than non-family firms. Finally, with an average age of 34.35 years, family firms are four years younger than the non-family ones. Table 2 provides the correlation matrix for the set of variables reported in Table 1. Although these are unconditional correlation coefficients, they do not exhibit unexpected signs.
Correlation matrix (N == 3956).
Note: Pairwise correlation coefficients for the second-stage variables when the sample is restricted to firms that always were in business during the period 1991–2014.
Table 3 reports the estimates of Eq. (1), where each column extends the treatment period by one year from 1999 to 2014. In Column (1) the treatment period is 1999–2000; in Column 2 the treatment period is 1999–2001; and so forth. In Column 1 —where the treatment period refers to 1999 onwards (i.e., only one year after the entrance in the fixed exchange regime)— the coefficient of Family·Euro·Xeu is statistically significant at 5 %, and the magnitude of the coefficient is already at the steady level of 0.29. As a result, intra-EU family-firm exporters immediately benefited from the euro in terms of TFP. According to the Euro·Xeu coefficient, during the first two years of the adoption of the euro, intra-EU exporters experienced a marginally significant reduction in TFP. Nevertheless, the coefficient of Family·Euro·Xeu reveals that, compared with non-family-firm exporters, intra-EU family-firm exporters benefited from the euro immediately. Column 2 —where the treatment period is taken as from 2000 onwards— confirms the aforementioned results with better statistical significance levels.
Difference-in-difference-in-difference results for TFP (fixed effects).
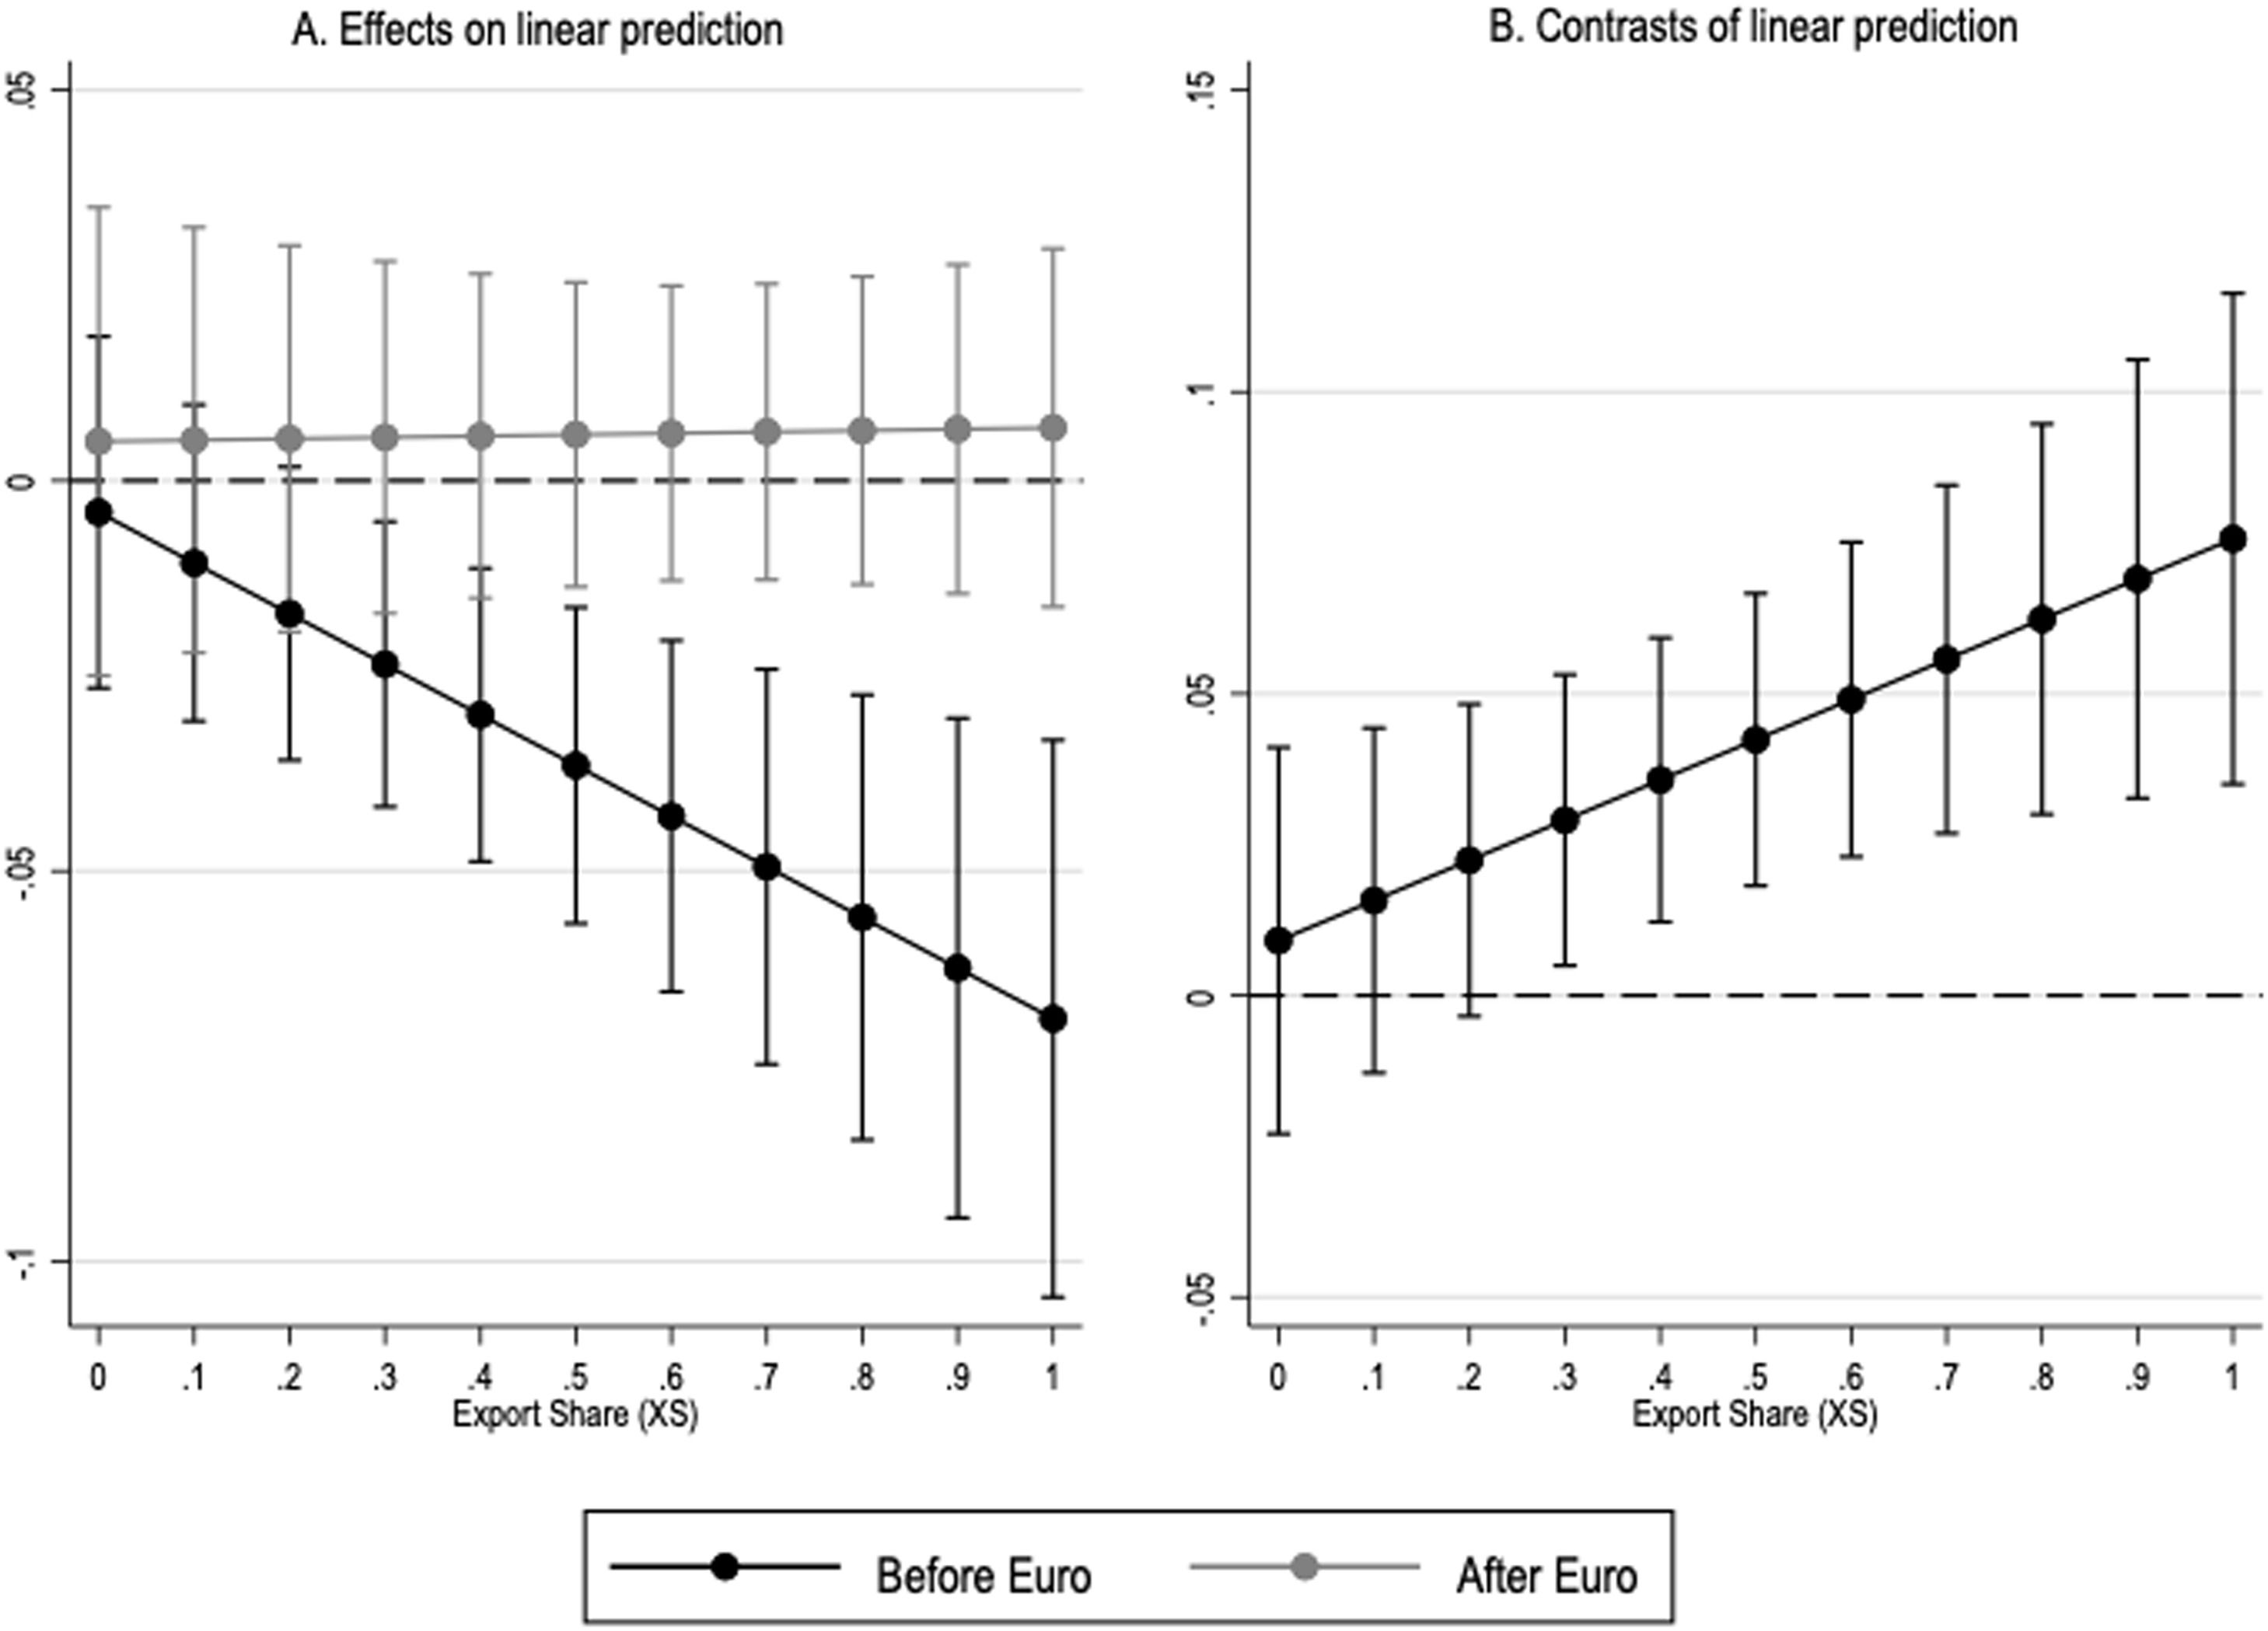
It is worth noticing that a positive and marginally significant coefficient for the variable Xeu is obtained since the year 2001 (Columns 3–16). Moreover, the estimated coefficient for Family·Euro·Xeu is extremely robust to the treatment period considered. This means that the adoption of euro had a positive, long-lasting effect on the TFP of family firms exporting within the European Union. More importantly, a gap between the family and non-family-firm exporters’ TFP is evident in Columns 3–16. This stability allows us to compare the TFP of family- and non-family-firm exporters before and after the adoption of the euro. As Fig. 1 shows, apart from idiosyncratic differences captured by firm-fixed effects, the euro favoured a catching-up process of intra-EU family-firm exporters with non-family-firm ones. Therefore, overall, the results discussed so far regarding the average treatment effect on the treated group remain robust to different treatment windows, and we have evidence to support our first hypothesis.
 Marginal effects on TFP of Spanish family and non-family-firms' export shares to other EU countries before and after the adoption of the euro. (Panel B) Difference between family and non-family firms in the marginal effects of export shares to other EU countries on TFP before and after the adoption of the euro.")
(Panel A) Marginal effects on TFP of Spanish family and non-family-firms' export shares to other EU countries before and after the adoption of the euro.
(Panel B) Difference between family and non-family firms in the marginal effects of export shares to other EU countries on TFP before and after the adoption of the euro.
We are now interested in assessing which exporters experienced the greatest benefits from the adoption of the euro in terms of TFP. For this purpose, Table 4 presents the unconditional quantile treatment effects (explained in Section 3.3.2). To exclude possible time-related confounders, we consider only three years after the adoption of the fixed exchange rate (i.e., 1999–2001) —in other words, we estimate a UQFE model corresponding to the model reported in Column 3 in Table 3. As shown in Table 4, the positive treatment effect found in Table 3 is driven only by the first two and last two quantiles of the TFP distribution (see the interaction term Family·Euro·Xeu). That is, the adoption of the euro boosted intra-EU family-firm exporters characterised by low and high levels of TFP. However, no significant effects for family-firm exporters with an intermediate TFP level are apparent —the only exception is the negative coefficient for Family·Euro·Xeu in the sixth decile of the TFP distribution, which suggests a reduction in TFP for intra-EU family-firm exporters after the adoption of the euro.
TFP (Unconditional Quantile Regression with fixed effects, N == 172).
| Deciles | (1) | (2) | (3) | (4) | (5) | (6) | (7) | (8) | (9) |
|---|---|---|---|---|---|---|---|---|---|
| Family | −0.097 | 0.023 | 0.053 | −0.114* | −0.095* | −0.066 | −0.058 | 0.090* | 0.139⁎⁎ |
| (0.101) | (0.068) | (0.070) | (0.066) | (0.056) | (0.048) | (0.058) | (0.054) | (0.060) | |
| Euro | 0.058 | 0.136⁎⁎ | −0.018 | −0.137⁎⁎ | −0.153⁎⁎ | −0.121* | −0.135* | 0.009 | 0.242⁎⁎ |
| (0.097) | (0.068) | (0.075) | (0.064) | (0.069) | (0.069) | (0.074) | (0.084) | (0.117) | |
| Xeu | 0.052 | 0.103 | 0.083 | 0.056 | 0.018 | 0.020 | −0.014 | 0.210* | 0.309* |
| (0.057) | (0.071) | (0.057) | (0.075) | (0.095) | (0.082) | (0.093) | (0.123) | (0.159) | |
| Family·Euro | −0.359⁎⁎ | −0.177 | −0.009 | 0.100 | 0.082 | 0.126* | 0.080 | −0.089 | −0.217* |
| (0.166) | (0.116) | (0.100) | (0.087) | (0.086) | (0.072) | (0.080) | (0.076) | (0.122) | |
| Family·Xeu | −0.081 | −0.183* | −0.046 | 0.011 | 0.099 | 0.068 | −0.015 | −0.293⁎⁎ | −0.387⁎⁎ |
| (0.137) | (0.107) | (0.113) | (0.108) | (0.106) | (0.095) | (0.110) | (0.136) | (0.154) | |
| Euro·Xeu | −0.157 | −0.218⁎⁎ | 0.053 | 0.096 | 0.134 | 0.135 | 0.157 | −0.149 | −0.641⁎⁎⁎ |
| (0.120) | (0.100) | (0.086) | (0.099) | (0.110) | (0.102) | (0.125) | (0.159) | (0.215) | |
| Family·Euro·Xeu | 0.687⁎⁎⁎ | 0.462⁎⁎ | −0.031 | 0.016 | −0.195 | −0.264⁎⁎ | −0.128 | 0.435⁎⁎ | 0.794⁎⁎⁎ |
| (0.229) | (0.205) | (0.165) | (0.168) | (0.159) | (0.133) | (0.166) | (0.202) | (0.249) | |
| Additional controls | Yes | Yes | Yes | Yes | Yes | Yes | Yes | Yes | Yes |
| Within R2 | 0.016 | 0.016 | 0.011 | 0.015 | 0.015 | 0.013 | 0.010 | 0.022 | 0.019 |
Note: Unconditional quantile regression estimates obtained using the method proposed by Firpo et al. (2009) and described in Section 3.3.2. Columns 1–9 refer to deciles 1–9 of the unconditional distribution of TFP, respectively. Additional controls comprise firm's export intensity, utilization capacity, proportion of temporary workers, share of workers with a university degree engaged in R&D activities, number of manufacturing and non-manufacturing plants owned by the company, age of the company. Cluster-robust standard errors are in parentheses.
Given the results in Table 4, we now investigate whether the adoption of the euro led to better chances of productivity upgrading for family firms compared to non-family firms. To this end, we analyse changes in the TFP distribution over the entire sample period (as explained in Section 3.3.3). As mentioned in Section 3.3.3, we have three states according to the terciles of the TFP distribution: low, intermediate, and high TFP levels.
Table 5 reports the transition probabilities for both family and non-family firms over the whole period. Results indicate a higher mobility in the intermediate TFP class than in the others two classes. Indeed, only 63.59 % of firms that were in this class did not change their relative status. Meanwhile, those in the low- and high-productivity status tended to be more persistent (in particular, the probability of remaining in the same class was 78.16 % and 78.98 %, respectively). As expected, movements from low- to high-productivity states were rather infrequent (3.72 %), as well as from high- to low-productivity states (3.04 %). By contrast, firms belonging to the intermediate-productivity class had similar probabilities of either falling to a lower TFP class or of catching up with high-productivity firms (17.57 % and 18.83 %, respectively).
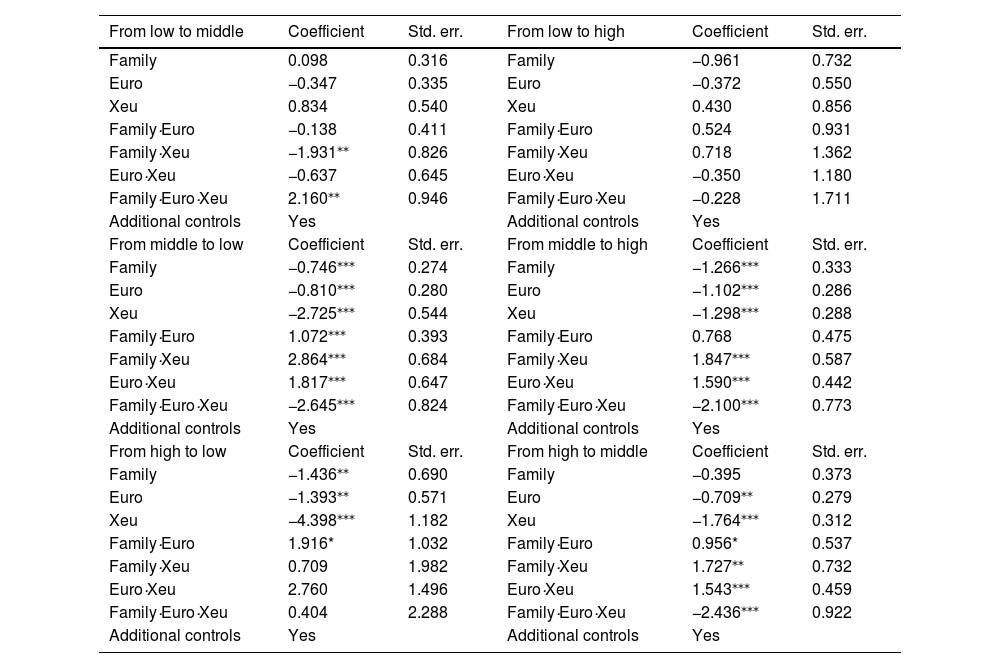
Table 6 reports the estimated probability of firm i passing from state j at time t-1 to state k at time t. As shown in Table 6, the euro facilitated the movement of intra-EU family-firm exporters from the low to the intermediate TFP state —the coefficient of Family·Euro·Xeu is positive and significant (2.16) —, therefore compensating the low mobility observed before the reform. However, the coefficient of Family·Euro·Xeu is not significant, which implies that the euro did not affect family-firm exporters’ movement from the low into the high TFP state. Additionally, the euro prevented intra-EU family-firm exporters in intermediate TFP levels from suffering a demotion in terms of productivity —their likelihood of falling to the lowest TFP tercile was substantially low —the coefficient of Family·Euro·Xeu is negative (−2.645) and significant. However, at the same time, after the adoption of the euro, the family-firm exporters in intermediate TFP levels were less likely to enter the highest productivity sate —the coefficient of Family·Euro·Xeu is negative and significant (−2.1). In other words, the euro helped stabilise intra-EU family-firm exporters’ position between the 4th and the 6th decile of the TFP distribution. Finally, high-productivity intra-EU family-firm exporters became less likely to fall to the intermediate TFP state (the coefficient of Family·Euro·Xeu is negative and significant −2.436). Overall, these results are consistent with those reported in Table 4 and provide a clear and robust picture of the consequences of the adoption of the euro on Spanish intra-EU family-firm exporters. Therefore, we have evidence to support Hypothesis 2.
TFP classes (Markov Chains).
| From low to middle | Coefficient | Std. err. | From low to high | Coefficient | Std. err. |
|---|---|---|---|---|---|
| Family | 0.098 | 0.316 | Family | −0.961 | 0.732 |
| Euro | −0.347 | 0.335 | Euro | −0.372 | 0.550 |
| Xeu | 0.834 | 0.540 | Xeu | 0.430 | 0.856 |
| Family·Euro | −0.138 | 0.411 | Family·Euro | 0.524 | 0.931 |
| Family·Xeu | −1.931⁎⁎ | 0.826 | Family·Xeu | 0.718 | 1.362 |
| Euro·Xeu | −0.637 | 0.645 | Euro·Xeu | −0.350 | 1.180 |
| Family·Euro·Xeu | 2.160⁎⁎ | 0.946 | Family·Euro·Xeu | −0.228 | 1.711 |
| Additional controls | Yes | Additional controls | Yes | ||
| From middle to low | Coefficient | Std. err. | From middle to high | Coefficient | Std. err. |
| Family | −0.746⁎⁎⁎ | 0.274 | Family | −1.266⁎⁎⁎ | 0.333 |
| Euro | −0.810⁎⁎⁎ | 0.280 | Euro | −1.102⁎⁎⁎ | 0.286 |
| Xeu | −2.725⁎⁎⁎ | 0.544 | Xeu | −1.298⁎⁎⁎ | 0.288 |
| Family·Euro | 1.072⁎⁎⁎ | 0.393 | Family·Euro | 0.768 | 0.475 |
| Family·Xeu | 2.864⁎⁎⁎ | 0.684 | Family·Xeu | 1.847⁎⁎⁎ | 0.587 |
| Euro·Xeu | 1.817⁎⁎⁎ | 0.647 | Euro·Xeu | 1.590⁎⁎⁎ | 0.442 |
| Family·Euro·Xeu | −2.645⁎⁎⁎ | 0.824 | Family·Euro·Xeu | −2.100⁎⁎⁎ | 0.773 |
| Additional controls | Yes | Additional controls | Yes | ||
| From high to low | Coefficient | Std. err. | From high to middle | Coefficient | Std. err. |
| Family | −1.436⁎⁎ | 0.690 | Family | −0.395 | 0.373 |
| Euro | −1.393⁎⁎ | 0.571 | Euro | −0.709⁎⁎ | 0.279 |
| Xeu | −4.398⁎⁎⁎ | 1.182 | Xeu | −1.764⁎⁎⁎ | 0.312 |
| Family·Euro | 1.916* | 1.032 | Family·Euro | 0.956* | 0.537 |
| Family·Xeu | 0.709 | 1.982 | Family·Xeu | 1.727⁎⁎ | 0.732 |
| Euro·Xeu | 2.760 | 1.496 | Euro·Xeu | 1.543⁎⁎⁎ | 0.459 |
| Family·Euro·Xeu | 0.404 | 2.288 | Family·Euro·Xeu | −2.436⁎⁎⁎ | 0.922 |
| Additional controls | Yes | Additional controls | Yes | ||
Note: Estimation of the Markov chain model described in Section 3.3.3. We divided TFP into three classes (low, middle and high) and assessed the impact of each regressor on the probability of passing from one class to another. Firms entering the lowest 33rd percentile of the TFP distribution belong to class “low”, firms between the 33rd and the 66th percentile belong to class “middle”, whereas those with a TFP level above the 66th percentile belong to class “high”. Additional controls comprise firm's export intensity, utilization capacity, proportion of temporary workers, share of workers with a university degree engaged in R&D activities, number of manufacturing and non-manufacturing plants owned by the company, age of the company. Inference is based on robust standard errors.
To ensure the robustness of our findings, we conducted several additional analyses and tests, as outlined in Appendix C. First, we tested the parallel trend assumption underlying the validity of any difference-in-differences approach. Second, we replaced our definition of family firms with a continuous measure of family involvement in the business. This is to ensure that our results are not influenced by other firms' characteristics that may have been omitted. Third, we replaced our dependent variable with the number of new products that firms launch each year. We use this measure as a direct measure of innovation to support our understanding of what causes TFP growth. Fourth, to validate the selected time break, we conducted a placebo regression analysis using a false time break. Fifth, we expanded the sample size by including firms born after the adoption of the euro and firms that left the sample before the break. As a final step, we investigated whether our results were limited to the Eurozone (i.e., the new currency area).
5ConclusionIn this study, we analyse the impact of the introduction of the euro on intra-EU exporter productivity. In doing so, we distinguish between family and non-family firms. The decision to adopt the euro eliminated the exchange rate volatility among intra-EU exporters. Consistent with our theoretical predictions and based on the family business and irreversible-investment literature, our findings show that the impact of euro adoption on the productivity of intra-EU exporters is not uniform across family and non-family firms. Before the introduction of the euro, intra-EU family-firm exporters had lower productivity levels than their non-family counterparts. However, after adopting the euro, intra-EU family-firm exporters caught up with their non-family counterparts in terms of productivity. Therefore, eliminating exchange rate volatility positively affects the productivity of intra-EU family-firm exporters relative to that of non-family exporters.
We attribute this finding to the varying sensitivity of family and non-family firms to uncertainty. These differences can be attributed to families’ lower levels of wealth diversification, family-oriented goals, and corporate opacity. As family firms’ investment decisions are more sensitive to uncertainty than those of non-family firms (Bianco et al., 2013), the elimination of exchange rate volatility and its subsequent reduction in income uncertainty favours the investments of intra-EU family-firm exporters, thus leading to an improvement in their productivity levels over those of non-family firms.
Nevertheless, in line with the theory of irreversible investment decisions under uncertainty, we find that the impact of euro adoption on productivity is not homogeneous across intra-EU family-firm exporters. Conversely, it is contingent on the initial level of productivity. Following the adoption of the euro, intra-EU family-firm exporters in the low-productivity group experienced a significantly higher probability of transitioning to an intermediate productivity level. Under uncertainty, low-productivity family-firm exporters have a smaller margin to absorb the expected loss from incorrect investment. However, when the exchange rate stabilises, investments become less uncertain, and family exporters with low productivity levels are less likely to exit the market when they make incorrect investments. Darby et al. (1999) formally modelled this mechanism. Intra-EU family-firm exporters in the intermediate-productivity group exhibited a greater tendency to remain at the same level because they neither risk exiting the market nor possess a large amount of resources to invest (and, therefore, may prefer to postpone their investment decisions). Finally, highly productive intra-EU family-firm exporters are unlikely to fall into the low-productivity group after adopting the euro. A small increase in the opportunity to invest may be sufficient to persuade a highly productive family-firm exporter to do so. Therefore, although the euro enabled intra-EU family-firm exporters to catch up with their non-family-firm counterparts, its effects on productivity were not uniform across all types of family-firm exporters.
5.1Theoretical and practical implicationsThis study makes several theoretical and practical contributions to the existing literature. First, it focuses on the relationship between exports and productivity. We extend current research on this relationship by exploring two contingent dimensions. On the one hand, we respond to John's (2006) call for more research on contextualising theories by introducing the moderating role of the formal institutional context, particularly concerning the impact of the euro's adoption on the export–productivity link. On the other hand, we address the heterogeneity of economic actors by distinguishing how the export–productivity link is unevenly distributed across different types of exporters. Our results confirm the important role of these moderators (at both the micro and macro levels) to better understand the nuances of the export–productivity link, which may also help extend the results observed in prior research (Wagner, 2007).
Second, our study adds to international family business studies (e.g., Alayo et al., 2022), as well as to the ongoing debate on context-theorising in the family business literature (Krueger et al., 2021). We compare the productivity outcomes of not only family- and non-family-firm exporters before and after euro adoption but also among different types of family-firm exporters. Our results show that, although adopting the euro enabled intra-EU family-firm exporters to catch up with their non-family-firm counterparts, its effects on productivity are not uniform across all types of family-firm exporters. In particular, in a highly uncertain context, intra-EU family-firm exporters with low productivity levels have a lower margin to absorb the expected loss from an incorrect investment decision. Therefore, when the exchange rate becomes fixed, these low-productivity exporters are not negatively impacted by wrong investment decisions, as in the previous flexible exchange rate regime (because investments have become less uncertain); conversely, a small increase in the opportunity to invest can be sufficient to persuade a high-productivity company to do so. In contrast, intra-EU family-firm exporters with initial medium productivity levels (i.e., those that are neither risking an exit from the market nor possessing a large amount of resources to invest in technology) may prefer to postpone their investment decisions. Therefore, we contribute to the family business literature by emphasising heterogeneity in family firms’ reactions to external contextual changes (Casillas & Moreno-Menendez, 2017).
Additionally, by analysing the impact of the euro on both family- and non-family-firm exporters, our study addresses the research gap highlighted by Amato, Basco, and Lattanzi, (2022), who emphasise the need for contextual research in family business studies. It is not only about the heterogeneity of family and non-family businesses and among family businesses but also about the heterogeneity of contexts and the different ways in which family firms react and perform. In this sense, we employed a context-sensitive approach to contextualise our research (Krueger et al., 2021) by incorporating the impact of context on family firms’ behaviour and performance. Family businesses cannot be studied without considering the contexts in which they compete. Family firms scrutinise the constraints and incentives generated by the context and its changes, which, in turn, prompt them to act and respond accordingly.
Our findings are relevant for policymakers. Given the importance of the risk associated with exports, introducing the euro to stabilise exchange rates was found to be particularly effective in stimulating investment. However, this study proves that a one-size-fits-all approach is not an option, as the impact of public policies depends on the diversity of economic actors (Basco & Bartkevičiūtė, 2016). In particular, we showed that economic actors’ reactions to external shocks, such as the adoption of the euro, were not uniform. Therefore, policymakers should be aware of the family nature of the firm; not all firms act in the same manner under a given environmental change. Additionally, studying the chances of productivity upgrading among intra-EU exporters is undoubtedly a relevant issue, especially given the direct impact of productivity on sustaining economic growth in modern economies. Technological progress, stemming from investments in research and development, is widely acknowledged as the primary engine of long-run economic growth. Therefore, policymakers need to understand the factors that drive productivity among intra-EU exporters, as they facilitate the emergence and dissemination of technological progress.
5.2Limitations and future researchThis study has some limitations. Although we have underlined heterogeneity among family firms regarding their reactions to adopting the euro, further research should explore alternative classifications of these companies to recognise that they are a heterogeneous group comprising single owners/managers, listed and non-listed firms, or firms with international investors. Additionally, further research is needed to better understand the mechanisms at play among exporters in the intermediate-productivity group. Among these exporters, both factors—increased risk of default and improved financing strategy—may contribute to shaping their investment decisions and, consequently, influence their productivity levels. Employing a competing hypothesis approach to further explore this effect can potentially illuminate the export–productivity relationship within the context of formal institutional changes. Finally, our study lacks generalisability because it is conducted on firms operating in Spain. Future research should extend the sample to other European countries to explore whether the differences between family and non-family intra-EU firm exporters hold.
Financial support is gratefully acknowledged from the Spanish Ministryof Science and Innovation [Ref. PID2019-106185GB-I00, ECO2016-75379-R] and the Region of Madrid [S2015/HUM‐3353 (EARLYFIN‐CM)]
Table A1 presents a brief definition for the variables entering the econometric analysis.
Definitions of variables.
| Dependent variable: | |
| Total factor productivity (TFP) | This variable is computed with the methodology proposed by Levinsohn and Petrin (2003), Wooldridge (2009), and Petrin and Levinsohn (2013). This approach consists of regressing traditional inputs —namely labour and physical capital—, on real value added (RVA) to extrapolate an unbiased measure of TFP (or technical efficiency). |
| Independent variables: | |
| Family | Dummy variable that equals 1 for family firms, and zero otherwise. A company is classified as a family firm if one or more members of the owner-family occupy managerial positions. |
| Euro | 1 for the 1999–2014 period; otherwise, 0. |
| Xeu | Ratio of sales in EU countries through exports to total exports. |
| Control variables: | |
| Export propensity (XS) | Ratio of sales through exports in foreign markets to total sales. |
| Capacity utilization (UC) | Utilization capacity: average annual usage of the company's standard production capacity. |
| Temporary workers (TW) | Proportion of temporary workers employed at the company on December 31st. |
| Workers in R&D (SWRD) | Number of workers with a university degree engaged in R&D activities. |
| Product innovations (PI) | Annual number of product innovations. |
| Number of plants (NP) | Total number of manufacturing and non-manufacturing plants owned by the company. |
| Overseas | Ratio of sales in EU countries through exports to total exports. |
| Age | Difference between current year and firm's year of foundation. |
Notes: This table provides a brief description of the variables entering the econometric analysis. The description of the variables used to derive the total factor productivity can be found in Appendix B, where we illustrate our first-step analysis.
Table A2 presents the main descriptive statistics for the entire sample, that is, the sample including firms that entered and exited the survey between 1991 and 2014. As for Table 1, we distinguish family firms from non-family firms. Table A2 shows that family firms are generally smaller, younger, and less involved in export and research activities.
Whole sample descriptive statistics (N = 38,513).
Note: This table presents the main descriptive statistics for the entire sample, that is, the sample including firms that entered and exited the survey during 1991–2014.
We compute TFP using the methodology proposed in Levinsohn and Petrin (2003), Wooldridge (2009), and Petrin and Levinsohn (2013). This approach consists of regressing traditional inputs, namely labour and physical capital, on real value added (RVA) to extrapolate an unbiased measure of TFP (or technical efficiency). Therefore, we must distinguish between the variables entering the first step and the variables entering the second step of the analysis.
In the first step, the dependent variable is the RVA produced by a firm in a given year: the value added deflated by the consumer price index (CPI, 2010 base year) not seasonally adjusted (OECD data). The value added is the sum of the sales, the variation in stocks and other management incomes minus the costs of external goods and services. The dependent variables employed in the first step are two. The first variable is the total (net) fixed asset and is a measure of physical capital stock (K) employed in the production of RVA. This variable is the total value of tangible fixed assets minus the accumulated depreciation and reserves at constant prices. The second variable is the number of workers (L) employed at the company on December 31st. In this stage, we do not distinguish between skilled and unskilled workers because of identification problems. Indeed, if we allow skilled workers to affect the RVA directly and indirectly, through TFP, the coefficient for skilled workers will be nonparametrically unidentified. To avoid this problem, we assume a Cobb–Douglas production function in which human capital increases TFP. This means that our measure of productivity will depend on human capital input, and therefore skilled labour will be included in our second step estimates. As a robustness check, we have also estimated a third-degree polynomial in physical and human capital. However, estimates do not change significantly (these additional results are available upon request from the authors). Formally, we estimate the following model:
where Kit is the stock of physical capital employed by firm i at time t in the production process, Lit is the input of labour for firm i at time t, α^K is the estimated physical capital elasticity, and α^L is the estimated labor elasticity. According to Eq. (1) and Levinsohn and Petrin (2003), we should estimate TFPit as a residual of a regression model in which 〖RVAit depends upon usual inputs. However, as argued by Wooldridge (2009), the estimates of Eq. (1) may suffer from serious endogeneity issues. Indeed, a higher level of productivity may boost the demand for inputs, and a simultaneity problem can arise. Therefore, Wooldridge (2009) and Petrin and Levinsohn (2012) propose to estimate Eq. (1) using a Generalized Method of Moment (GMM) estimator. This methodology has the advantage to take into consideration both endogeneity and the fact that RVA may be non-stationary over time and represents the main reason why we divided our analysis into two steps, where the second step is represented by the econometric analysis proposed in Section 3.3.
GMM estimates of RVA (N == 28,859).
| (1) | (2) | |
|---|---|---|
| RVAt-1 | 0.115⁎⁎⁎ | 0.088* |
| (0.019) | (0.049) | |
| Kt | 0.002 | −0.036 |
| (0.018) | (0.034) | |
| Kt-1 | 0.025⁎⁎ | 0.064⁎⁎⁎ |
| (0.013) | (0.022) | |
| Lt | 0.615⁎⁎⁎ | 0.719⁎⁎⁎ |
| (0.107) | (0.174) | |
| Lt-1 | 0.096 | 0.063 |
| (0.082) | (0.166) | |
| Wald (26) | 1445 | 1534.27 |
| #IVs | 693 | 152 |
| AR(1) p-value | .000 | .000 |
| AR(2) p-value | .254 | .794 |
| Hansen p-value | .121 | .236 |
| Hansen restr p-value | .172 | .691 |
| Diff null exogeneous | .092 | .925 |
Notes: This table shows the two-step difference GMM used to obtain the TFP measure. Column 1 is based on the standard specification, whereas Column 2, replace GMM-IVs with their principal components in order to reduce the instruments count. Cluster-robust standard errors are in parentheses.
Table B1 presents the GMM estimates used to compute our measure of TFP. In particular, following Hayakawa (2009), we used a two-step difference GMM in which unobserved individual effects are removed by the forward orthogonal deviation. This methodology is consistent under large N and fixed T, fixed N and large T, or large N and large T. The smaller number of observations is because the GMM estimator is based on a lagged structure for both regressors and instruments. In Column 1, we used the full set of traditional instruments, while in Column 2 we used a principal component analysis to reduce the number of instruments and improve the reliability of the overidentification tests. According to Table B.1, both labour input and physical capital contribute to explain the Real Value Added (RVA). Notice that the elasticity coefficient of labour is in line with traditional estimates based on Solow's residual. Physical capital is positively correlated with RVA but with one-period lag. Consistently with the construction of a standard GMM estimator, the residuals of the differenced equations are serially correlated (see the p-value of the Arellano-Bond AR(1) test). In contrast, we cannot reject the null hypothesis that the differenced residuals are uncorrelated (see the p-value of the Arellano-Bond AR(2) test). The p-value of the Hansen (1982) J-test shows that we cannot reject the null hypothesis that our instruments are unconditionally uncorrelated with the error term. Since a high number of instruments might weaken the Hansen statistic, Table B.1 also reports the Hansen J-test for a strictly exogenous set of instruments (namely, years) and its difference with respect to the whole set of instruments. Nonetheless, especially in Column 2, no differences between the two sets of instruments are detected, confirming the validity of our specifications.
The validity of a difference-in-differences approach relies on the hypothesis that the treated and untreated groups exhibit similar time-series patterns before the exogenous shock. This is known as the "parallel trend assumption". To verify this assumption, Fig. C.1 illustrates the time-varying behavior of average TFP for four different types of firms: family and non-family firms, exporters and non-exporters in other EU countries. Panel A of Fig. C.1 focuses on the period prior to the adoption of the euro, while Panel B shows the dynamic of TFP over the entire observation period. Fig. C1 supports the parallel trend assumption.

An extensive debate exists regarding the identification of a family firm. Our dataset contains only information regarding family members in managerial positions. So far, we have considered a family firm to be any business in which at least one member of the family holds a managerial position. To test the robustness of our findings, we now replace the dummy variable that indicates family firms with the variable counting the number of family managers. Considering different levels of export share in EU countries, Column 1 of Table C.1 and panel A of Fig. C.2 show the marginal effect of family managers on TFP before and following the adoption of the euro. Panel B compares family managers' impact on TFP before and after the shock. As can be seen, the euro reduced family managers' negative impact on total factor productivity. This result confirms the robustness of the findings reported in Table 3 and Fig. 1.
Family management, TFP and product innovations.
| (1) | (2) | |
|---|---|---|
| Family | −0.004 | 0.882⁎⁎⁎ |
| (0.011) | (0.338) | |
| Euro | −0.087⁎⁎⁎ | 0.441 |
| (0.031) | (0.292) | |
| Xeu | 0.058 | 1.138⁎⁎⁎ |
| (0.038) | (0.331) | |
| Family·Euro | 0.009 | −1.104⁎⁎⁎ |
| (0.016) | (0.388) | |
| Family·Xeu | −0.065⁎⁎⁎ | −1.920⁎⁎⁎ |
| (0.022) | (0.502) | |
| Euro·Xeu | −0.027 | −0.660* |
| (0.044) | (0.368) | |
| Family·Euro·Xeu | 0.067⁎⁎ | 1.692⁎⁎ |
| (0.028) | (0.662) | |
| Additional controls | Yes | Yes |
| N | 3956 | 2875 |
| Within R2 | 0.025 | |
| Overall R2 /Pseudo R2 | 0.109 | 0.482 |
Note: Column 1 provides the estimates of (1) in which we replace the family dummy variable with a continuous variable indicating the number of family members in top managerial positions. Column 2 shows the fixed-effects Poisson estimates for Eq. (1) in which we replaced the TFP measure with the number of firm's product innovations. Additional controls comprise firm's export intensity, utilization capacity, proportion of temporary workers, share of workers with a university degree engaged in R&D activities, number of manufacturing and non-manufacturing plants owned by the company, age of the company. Cluster-robust standard errors are in parentheses.

We now aim to test whether the euro has improved family firms' technological level. Therefore, we re-estimate Eq. (1) by replacing the TFP measure with a variable that represents the number of new products a firm has introduced each year. Given the count nature of the new dependent variable, we use a Poisson regression estimator with firm fixed effects. Like Figs. 1, C.3 illustrates, for family and non-family firms, the marginal effects of exports in EU countries on product innovation (PI) before and after the introduction of the euro. Since the adoption of the euro, family firms involved in export activities in the EU have caught up with non-family ones. The estimates used to draw Fig. C.3 can be found in Column 2 of Table C.1.

Another important robustness check is to determine whether the time break was selected correctly. Since exchange rates depend on agents’ expectations, and the adoption of the euro was announced years before its introduction, we must control for the fact that exchange rate uncertainty was not yet cancelled out before 1999. Similarly, we want to see if agents’ behaviours significantly changed when the euro started to circulate (i.e., in the year 2002). In Table C.2, we repeat the estimates of Eq. (1) using two counterfactual time breaks, namely, 1997 and 2002. The fact that the coefficient of Family·Xeu·break is smaller in Column 1 of Table C.2 than those estimated in Table 3 and that it is not significant in Column 2 of Table C2 reveals that the structural break was certainly located between the adoption of the fixed exchange regime (January 1999) and the introduction of the euro banknotes (January 2002).
Difference-in-difference results for TFP (False breaks).
| (1) | (2) | |
|---|---|---|
| Family | 0.009 | −0.003 |
| (0.044) | (0.034) | |
| Euro | −0.055 | −0.052 |
| (0.041) | (0.047) | |
| Xeu | −0.020 | 0.014 |
| (0.048) | (0.048) | |
| Family·Euro | 0.080 | 0.068 |
| (0.069) | (0.051) | |
| Family·Xeu | −0.193⁎⁎ | −0.121* |
| (0.086) | (0.064) | |
| Euro·Xeu | −0.040 | −0.036 |
| (0.074) | (0.070) | |
| Family·Euro·Xeu | 0.187* | 0.116 |
| (0.095) | (0.085) | |
| Additional controls | Yes | Yes |
| N | 3956 | 3956 |
| Within R2 | 0.023 | 0.022 |
| Overall R2 | 0.117 | 0.112 |
Note: This table presents a robustness test in which we re-estimated Eq. (1) using two different, false time breaks: 1998 and 2002. Additional controls comprise firm's export intensity, utilization capacity, proportion of temporary workers, share of workers with a university degree engaged in R&D activities, number of manufacturing and non-manufacturing plants owned by the company, age of the company. Cluster-robust standard errors are in parentheses.
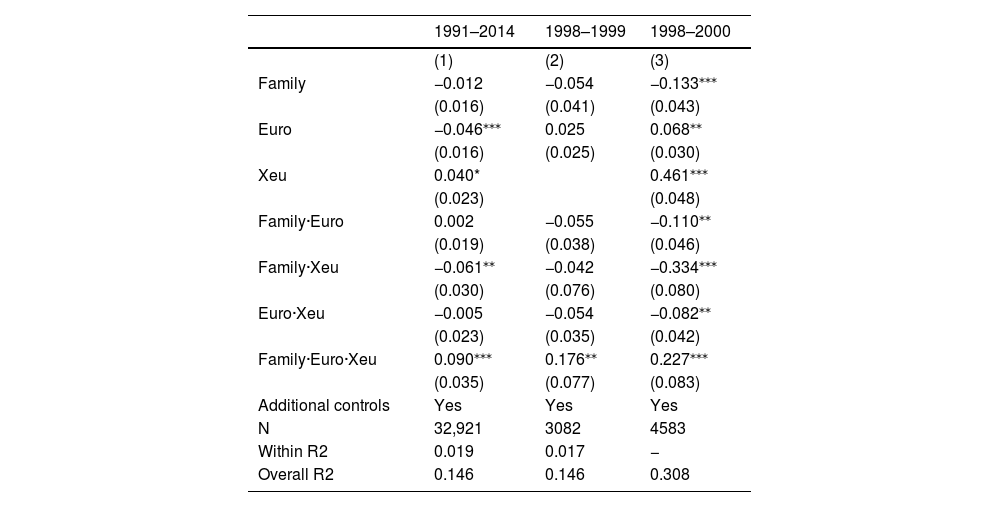
We now enlarge our sample and test whether our estimates lead to similar qualitative results despite the noise due to the comparison of firms that were born after the introduction of the euro with firms that exited the market before the adoption of the fixed exchange rate. The enlarged sample considers 4683 firms observed over the period 1991–2014, leading to 38,513 observations (the descriptive statistics of this total sample are shown in Table A.2 in the Appendix). Table C.3 shows the coefficients of an FE estimator and a simple pooled OLS regression.1313 Notice that by construction, the inclusion of lagged variables in the first-stage GMM estimator used to derive our TFP measure reduces the number of observations from 38,513 to 32,921.
Difference-in-difference results for TFP (larger sample).
| 1991–2014 | 1998–1999 | 1998–2000 | |
|---|---|---|---|
| (1) | (2) | (3) | |
| Family | −0.012 | −0.054 | −0.133⁎⁎⁎ |
| (0.016) | (0.041) | (0.043) | |
| Euro | −0.046⁎⁎⁎ | 0.025 | 0.068⁎⁎ |
| (0.016) | (0.025) | (0.030) | |
| Xeu | 0.040* | 0.461⁎⁎⁎ | |
| (0.023) | (0.048) | ||
| Family·Euro | 0.002 | −0.055 | −0.110⁎⁎ |
| (0.019) | (0.038) | (0.046) | |
| Family·Xeu | −0.061⁎⁎ | −0.042 | −0.334⁎⁎⁎ |
| (0.030) | (0.076) | (0.080) | |
| Euro·Xeu | −0.005 | −0.054 | −0.082⁎⁎ |
| (0.023) | (0.035) | (0.042) | |
| Family·Euro·Xeu | 0.090⁎⁎⁎ | 0.176⁎⁎ | 0.227⁎⁎⁎ |
| (0.035) | (0.077) | (0.083) | |
| Additional controls | Yes | Yes | Yes |
| N | 32,921 | 3082 | 4583 |
| Within R2 | 0.019 | 0.017 | − |
| Overall R2 | 0.146 | 0.146 | 0.308 |
Note: This table reports the estimations of Eq. (1) for different samples. In Column 1, we consider an enlarged sample of 4062 firms observed for the entire period 1991–2014. Column 2 considers the same sample for the period 1998–1999 (i.e., exactly around the break). Finally, Column 3 includes two years of break 1999 and 2000. Additional controls comprise firm's export intensity, utilization capacity, proportion of temporary workers, share of workers with a university degree engaged in R&D activities, number of manufacturing and non-manufacturing plants owned by the company, age of the company. Cluster-robust standard errors are in parentheses.
Difference-in-difference results for TFP (Overseas exports).
| 1991–1999 | 1991–2000 | 1991–2001 | 1991–2014 | |
|---|---|---|---|---|
| (1) | (2) | (3) | (4) | |
| Family | −0.046 | −0.051 | −0.048 | −0.077⁎⁎ |
| (0.035) | (0.034) | (0.034) | (0.032) | |
| Euro | −0.032 | −0.019 | −0.045 | −0.081⁎⁎ |
| (0.036) | (0.037) | (0.037) | (0.039) | |
| Xeu | 0.027 | −0.041 | 0.008 | 0.063 |
| (0.052) | (0.050) | (0.046) | (0.042) | |
| Family·Euro | −0.107 | −0.138 | −0.175 | 0.106 |
| (0.147) | (0.135) | (0.132) | (0.127) | |
| Family·Overseas | 0.380⁎⁎ | 0.362⁎⁎ | 0.381⁎⁎ | 0.392* |
| (0.181) | (0.167) | (0.166) | (0.235) | |
| Euro·Overseas | 0.035 | 0.025 | 0.035 | −0.125 |
| (0.142) | (0.134) | (0.138) | (0.155) | |
| Family·Euro·Overseas | −0.039 | 0.117 | 0.044 | −0.209 |
| (0.267) | (0.310) | (0.303) | (0.291) | |
| Additional controls | Yes | Yes | Yes | Yes |
| N | 1376 | 1548 | 1720 | 3956 |
| Within R2 | 0.015 | 0.015 | 0.013 | 0.025 |
| Overall R2 | 0.106 | 0.113 | 0.113 | 0.101 |
Note: This table reports the estimations of Eq. (1) using exporters outside EU as confounding group for different time periods. Column 1 is based on the period 1991–1999, Column 2 on 1991–2000, Column 3 on 1991–2001, whereas Column 4 considers the entire observational period (1991–2014). Additional controls comprise firm's export intensity, utilization capacity, proportion of temporary workers, share of workers with a university degree engaged in R&D activities, number of manufacturing and non-manufacturing plants owned by the company, age of the company. Cluster-robust standard errors are in parentheses.
Finally, we also run a placebo regression considering firms that export outside the European Union. In principle, firms that export overseas bear higher sunk and transportation costs. Therefore, according to Melitz (2003), they should also be more efficient. Moreover, if our treatment effect is capturing a set of efficient family firms instead of a change in the European context, we should find an even stronger result for firms trading with non-EU countries. By contrast, because firms exporting to non-European countries continued to experience price uncertainty even after the introduction of the euro, if our treatment effect is related to an elimination of the exchange rate volatility, we should observe low or even no effect of the euro on their TFP. Table C.4 shows that once we use the variable Overseas export intensity—which refers to export intensity outside the European Union—, instead of Xeu, the TFP of overseas family exporters does not change either in the short or in the long run. Indeed, these firms were more productive even before the euro adoption, and their productivity did not change because of the euro adoption.
The theory of irreversible investment has been extensively used in both empirical research and the theoretical literature for analysing risk-neutral decision makers’ choices (Isik, 2005).
In his seminal article, Sandmo (1971) shows that in a competitive market characterised by demand uncertainty, while risk-neutral firms will set marginal costs equal to the expected price, risk-averse firms will choose a lower output level for which marginal cost is less than the expected price. In other words, risk-averse firms will demand less of productive inputs. This result is consistent with Baron's (1971) conclusions, that a risk-averse purchaser tends to decrease input demand because of price uncertainty. Leland (1972) generalises Baron's (1971) and Sandmo's (1971) models by considering whether firms’ decisions are made before or after uncertain parameters are revealed. In line with this, Leland (1972) shows that when investment decisions are made before the price is revealed, increasing uncertainty leads risk-averse firms to produce less and therefore demand less of all inputs.
The opportunity cost of waiting is given by the difference between the firm's (private) discount rate and the degree of “misalignment”’ in the exchange rate (i.e., the deviation of the exchange rate from its equilibrium path at each point in time). Therefore, to incorporate a firm's risk aversion in the model, we can follow the financial literature on investment, which considers risk aversion through a premium in the firm's discount rate. By doing so, we can arrive at the usual result that “risk aversion and incomplete markets are likely to make the investment–uncertainty relationship negative (e.g., Craine, 1989; Zeira, 1990)” (Caballero, 1991, p. 279). Indeed, a necessary condition for a negative relationship between uncertainty and investment is that the opportunity cost of waiting must be greater or equal to the private sector's discount rate (Darby et al., 1999).
The data that support the findings of this study are available from SEPI Foundation, in collaboration with the Ministry of Industry, Trade and Tourism of Spain.
For more information about the SEPI Foundation and ESEE database, please refer to: www.fundacionsepi.es.
Assuming a traditional Cobb–Douglas production function, we identify the technological level of the firm with its TFP and use a robust General Method of Moments (GMM) estimator to derive it as a residual of the RVA. The second-step regression uses the residuals of the first-step regression as a measure of TFP. To obtain standardised coefficients, we z-transformed our dependent and independent variables. While we control for the effects of the reform on capital and labour demand in the first-stage regression, in the second-stage analysis we must consider the possibility of importing innovation (see Appendix B for details on this method).
As a robustness check (see Section 4.3), we first analyse the treatment effect using a few years after the introduction of the euro, and then we gradually extend the time horizon by adding one subsequent year to each of the following analysis. This also allows us to separate short- and long-term effects of the reform (i.e., adoption of the euro).
The decision by European companies to export within the European Union after the adoption of the euro is endogenous and depends on firms’ productivity (Melitz, 2003). However, given that sunk costs are the same for all firms, there is no reason to expect a different selection mechanism between family and non-family firms. Therefore, we expect a difference-in-difference-in-differences methodology to address this issue properly.
The results of the Hausman test are not shown but are available from the authors upon request. This allows us to take into account the possible correlation between time-variant regressors and time-invariant unobserved variables. Indeed, with longitudinal data, an FE estimator represents a natural choice to control for potential confounders (Angrist & Pischke, 2008; Arellano, 2003; Hsiao et al., 2012). Moreover, an FE approach allows us to exploit the crossover design of the analysis, considering the within effect of changing the export intensity and family status on firm's productivity. This helps us better isolate the effect of the family status from other possible confounders.
See Firpo et al. (2009) for additional details on the mathematical properties of the estimated functions. As argued in Firpo et al. (2009) this methodology is a generalisation of the traditional Oaxaca–Blinder decomposition to other distributional statistics. Kline (2011) shows that the Oaxaca–Blinder decomposition constitutes a propensity score-reweighting estimator based on a linear model for the conditional odds of being treated. This means that it represents a ‘doubly robust’ estimator of counterfactuals (see Robins et al., 1994). In other words, our estimates will be consistent even if the treatment status depends on our controls.
A Markov process is a dynamic stochastic process where one can predict the future of the process based solely on its present state. These models have been widely used in several disciplines such as economics, medicine, or sociology. For instance, in the economic literature, Markov Chains have been applied to study firm dynamics (see Tomlin, 2006; Weintraub et al., 2008), employment status (e.g., Bertola & Rogerson, 1997; Troske & Voicu, 2010), economic growth (e.g. Fiaschi & Lavezzi, 2003; Quah, 1993) and country emissions (Aldy, 2006; Bassetti et al., 2013).
The descriptive statistics for the first- and second-stage whole sample variables are reported in Appendix A (Table A.2). As regards the second-stage variables —please, refer to Table B.1 in Appendix B for the first-stage regression results.
Notice that by construction, the inclusion of lagged variables in the first-stage GMM estimator used to derive our TFP measure reduces the number of observations from 38,513 to 32,921.
- Direct and moderating effects of COVID-19 on cultural tourist satisfaction
- Destination recovery during COVID-19 in an emerging economy: Insights from Perú
- The impact of the COVID-19 crisis on consumer purchasing motivation and behavior
- Covid-19 vaccines: A model of acceptance behavior in the healthcare sector
recomendados

www.publicationethics.org.