


Excess weight is a public health problem associated with a greater burden of chronic diseases and increased use of health resources.
Material and methodsA subsample of Spanish adults aged 18–45 from the 2017 Spanish National Health Survey (N=7081) was used. The odds ratios of service utilisation of the group with BMI≥30kg/m2 were compared to the normal-weight group, using a model adjusted for sex, age, education, socioeconomic level, perceived health status and the presence of comorbidities.
ResultsIn all, 12.4% of the sample had obesity. Of these, 24.8% visited their general physician, 37.1% attended emergency services and 6.1% were hospitalised during the last 12 months, which were significantly higher rates than in the normal-weight population (20.3%, 29.2%, 3.8%, respectively). However, 16.1% visited a physiotherapist and 3.1% used alternative therapies, compared to 20.8% and 6.4% in the healthy weight group. After adjusting for confounding factors, people with obesity were more likely to visit emergency services (OR: 1.225 [1.037–1.446]) and less likely to visit a physiotherapist (OR: 0.720 [0.583–0.889]) or use alternative therapies (OR: 0.481 [0.316–0.732]).
ConclusionsSpanish young adults suffering from obesity are more likely to use some health resources than those of normal weight, even after adjusting for socioeconomic variables and comorbidities, but they are less likely to attend physical therapy. The literature shows that these differences are less marked than in older ages, so this stage of life could be a window of opportunity for prevention to achieve better resource management.
El exceso de peso es un problema de salud pública, asociado a una mayor carga de enfermedades crónicas y a un mayor uso de recursos sanitarios.
Material y métodosSubmuestra de adultos españoles de 18 a 45 años de la Encuesta Nacional de Salud 2017 (N=7.081). Las odds ratios de utilización de servicios del grupo con IMC ≥ 30kg/m2 en comparación con el grupo de peso normal, utilizando un modelo ajustado por sexo, edad, educación, clase socioeconómica, estado de salud percibido y presencia de comorbilidades.
ResultadosEl 12,4% de la muestra tenía obesidad, del cual el 24,8% acudió al médico de cabecera, el 37,1% acudió a los servicios de urgencias, el 6,1% fue hospitalizado durante los últimos 12 meses, siendo significativamente mayor que en la población de peso normal (el 20,3, el 29,2, el 3,8%, respectivamente). Sin embargo, el 16,1% visitó a un fisioterapeuta y el 3,1% utilizó terapias alternativas, en comparación con el 20,8 y el 6,4% del grupo de peso normal. Tras ajustar por factores de confusión, las personas con obesidad tenían una mayor probabilidad de acudir a los servicios de urgencias (OR: 1,225 [1,037-1,446]) y menos de acudir al fisioterapeuta (OR: 0,720 [0,583-0,889]) o a las terapias alternativas (OR: 0,481 [0,316-0,732]).
ConclusionesLos adultos jóvenes españoles que presentan obesidad muestran mayor probabilidad de utilizar algunos recursos sanitarios que los de peso normal, incluso después de ajustar por variables socioeconómicas y comorbilidades, pero son menos propensos a acudir a fisioterapia. La literatura muestra que estas diferencias son menos marcadas que en edades más avanzadas, por lo que esta etapa de la vida podría ser una ventana de oportunidad para la prevención para lograr una mejor gestión de los recursos.
The World Health Organization (WHO) defines overweight and obesity as accumulating excessive or abnormal fat that may impair health.1 This excess can cause adverse effects on the individual's physical, mental or social health, and obesity is considered a chronic non-communicable disease, preventable with lifestyle changes.2
The body mass index (BMI) indicates the relationship between weight and height and is considered the most useful population-based measure of excess weight (overweight and obesity) since its cut-off points are the same for all adult ages and both sexes.2 However, it has some drawbacks: it does not allow differentiation between lean and fat mass, it does not reflect the body fat distribution, and it is a poor indicator in subjects with short stature, high muscle mass, advanced age or hydrosaline retention, and pregnant women.3 Nevertheless, it is the only variable indicative of nutritional status included in the Spanish National Health Surveys (NHS).
Obesity is considered the second leading cause of preventable death produced by lifestyle.4 Overweight and related diseases reduce life expectancy in countries of the Organisation for Economic Co-operation and Development (OECD) by 2.7 years.5 It is estimated that 25,671 deaths were attributable to excess weight in Spain, mainly due to cardiovascular disease (58% of the total).4 In Europe, the economic cost of obesity is estimated to be between 0.09% and 0.61% of each country's gross domestic product.6
Between 1975 and 2016, the global prevalence of obesity has nearly tripled,1 and in 2016 more than 1.9 billion adults worldwide were found to have overweight (39% of the adult population), and more than 650 million had obesity (13% of the adult population).1 In Spain, the prevalence of obesity has also been progressively increasing over the last decades.7 Moreover, projections show a steady increase in the prevalence in all the regions of the country, expected to reach 20% of the Spanish population by 2030.6
It is estimated that obesity accounts for between 2% and 7% of total health costs in developed countries.2 The OECD predicts that the average percentage of health expenditure associated with overweight per year will be 8.2% of total health expenditure in the European Union in the period 2020–2050.5
Given that excess weight and associated diseases are more prevalent in later stages of life,8 the young adult group is presented as a window of opportunity to attack the problem as early as possible, reducing the burden of associated pathologies. However, the studies already published in Spain on the association between excess weight and the use of health resources are based on limited samples from a single hospital or the same geographical area.9 Only one study has been found in which this association has been estimated for the whole population, using the 2011–2012 NHS.10 Still, no studies have been focused on young adults at the national level, which can help plan more effective public health strategies to prevent chronic diseases, allowing better management of healthcare resources. Therefore, this study aimed to evaluate the differences in the use of health services in the Spanish young adult population under 45 years old, according to their nutritional status established by the BMI categories, especially considering the impact of obesity.
MethodsA descriptive, cross-sectional, retrospective, observational epidemiological study was conducted using microdata from the 2017 NHS.11 The NHS is a population-based study conducted by the Ministry of Health and the National Institute of Statistics, carried out through personal interviews with 23,089 individuals selected through a stratified three-stage sampling strategy. The first stage units are the census sections grouped into strata according to the size of the municipality to which they belong. Second stage units are the primary family dwellings within each census section. Finally, the third stage units are selected, considering the surveyable persons (15 years of age or older) in the dwelling at the time of interview.
Of the 23,089 individuals initially included in the database, those aged 15–17 years (579) and over 45 years (14,659) were excluded. In addition, 174 individuals were deleted due to a lack of data on self-reported BMI. Also, women who had been pregnant in the previous 12 months (194) and individuals who had suffered some kind of accident were discarded due to their higher use of health services (402). Therefore, the final sample consisted of 7081 persons, corresponding to 30.66% of the original sample.
BMI was calculated using self-referenced weight (kg) and height (cm) data and the cut-off points for adults proposed by the WHO2 (underweight: BMI<18.5kg/m2; normal weight: between 18.5kg/m2 and 24.99kg/m2; overweight: between 25.0kg/m2 and 29.99kg/m2; obesity: ≥30.0kg/m2).
Likewise, the use of health resources was analysed: visits to the general physician (GP) and specialised consultations in the last four weeks; visits to other health professionals (nurse, physiotherapist, psychologist), visits to the emergency room, diagnostic imaging tests, laboratory and day hospital services and hospitalisations (excluding childbirth) in the last 12 months, as well as the use of alternative therapies. When performing the analysis, it was impossible to differentiate whether the use of resources occurred within the public or private system as this information was not provided in the original database.
Statistical analysis was carried out using the IBM® SPSS 23 programme. 95% confidence was assumed for all analyses, considering the significant value to be p<0.05. The chi-square test was used to detect differences in resource utilisation between the group with normal BMI and the other categories. Logistic regression analyses were performed using the least-squares method to find odds ratios (OR) accepted as valid if the p-value of a chi-square test was less than 0.05 and if the confidence interval (CI) did not contain unity. The aim was to assess possible differences between the probabilities of using healthcare resources among adults aged 18–45 with obesity compared to the normal weight group. The most parsimonious model was sought for all the dependent variables studied within the service use group, trying to optimise the variables for which it adjusted. A first model that adjusted for sex, age group, educational level, social class, current economic activity and perceived health status was calculated. In a second model, the analysis was also adjusted for arterial hypertension, diabetes, hypercholesterolaemia, migraine, low back pain, osteoarthritis, depression and anxiety, which were pathologies significantly associated with the nutritional status in this sample of young adults.
ResultsAccording to the NHS data, in 2017, 54.6% of the Spanish adult population aged 18–45 had a healthy BMI, while 29.7% had overweight and 12.4% obesity, with a very low percentage of underweight people (3.3%). These percentages were lower than those found when considering the entire adult population of the NHS.
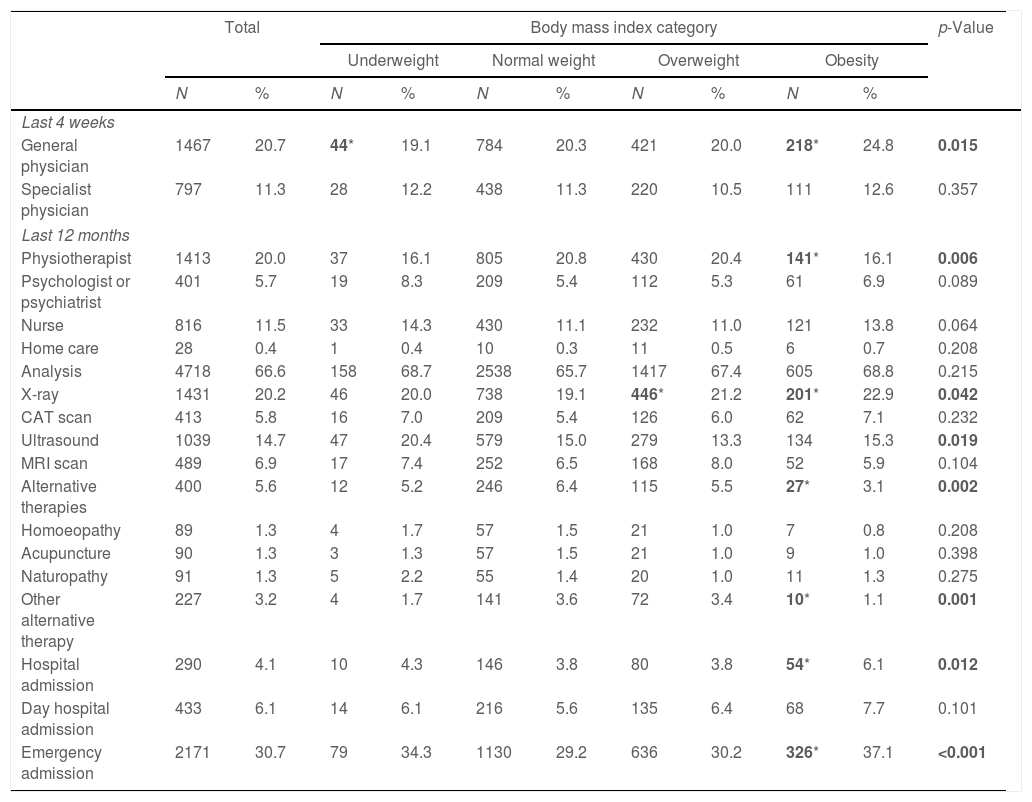
The number and proportion of subjects aged 18 to 45 who used health services distributed by body mass index groups are shown in Table 1. Statistically significant differences were observed between the four categories of BMI regarding GP consultations during the last four weeks, visits to a physiotherapist, X-ray and ultrasound scans, and the use of alternative therapies. Also, hospital admission and emergency room attendance during the last 12 months differ by BMI category. As shown in Table 1, persons with a BMI of 30kg/m2 or more visited their GP in the previous four weeks in a significantly higher proportion than those with normal BMI. In contrast, no differences were observed in visits to specialists in those same weeks.
Number and proportion of Spanish adults aged 18–45 surveyed in the National Health Survey who used health services and distribution by body mass index categories.
| Total | Body mass index category | p-Value | |||||||||
|---|---|---|---|---|---|---|---|---|---|---|---|
| Underweight | Normal weight | Overweight | Obesity | ||||||||
| N | % | N | % | N | % | N | % | N | % | ||
| Last 4 weeks | |||||||||||
| General physician | 1467 | 20.7 | 44* | 19.1 | 784 | 20.3 | 421 | 20.0 | 218* | 24.8 | 0.015 |
| Specialist physician | 797 | 11.3 | 28 | 12.2 | 438 | 11.3 | 220 | 10.5 | 111 | 12.6 | 0.357 |
| Last 12 months | |||||||||||
| Physiotherapist | 1413 | 20.0 | 37 | 16.1 | 805 | 20.8 | 430 | 20.4 | 141* | 16.1 | 0.006 |
| Psychologist or psychiatrist | 401 | 5.7 | 19 | 8.3 | 209 | 5.4 | 112 | 5.3 | 61 | 6.9 | 0.089 |
| Nurse | 816 | 11.5 | 33 | 14.3 | 430 | 11.1 | 232 | 11.0 | 121 | 13.8 | 0.064 |
| Home care | 28 | 0.4 | 1 | 0.4 | 10 | 0.3 | 11 | 0.5 | 6 | 0.7 | 0.208 |
| Analysis | 4718 | 66.6 | 158 | 68.7 | 2538 | 65.7 | 1417 | 67.4 | 605 | 68.8 | 0.215 |
| X-ray | 1431 | 20.2 | 46 | 20.0 | 738 | 19.1 | 446* | 21.2 | 201* | 22.9 | 0.042 |
| CAT scan | 413 | 5.8 | 16 | 7.0 | 209 | 5.4 | 126 | 6.0 | 62 | 7.1 | 0.232 |
| Ultrasound | 1039 | 14.7 | 47 | 20.4 | 579 | 15.0 | 279 | 13.3 | 134 | 15.3 | 0.019 |
| MRI scan | 489 | 6.9 | 17 | 7.4 | 252 | 6.5 | 168 | 8.0 | 52 | 5.9 | 0.104 |
| Alternative therapies | 400 | 5.6 | 12 | 5.2 | 246 | 6.4 | 115 | 5.5 | 27* | 3.1 | 0.002 |
| Homoeopathy | 89 | 1.3 | 4 | 1.7 | 57 | 1.5 | 21 | 1.0 | 7 | 0.8 | 0.208 |
| Acupuncture | 90 | 1.3 | 3 | 1.3 | 57 | 1.5 | 21 | 1.0 | 9 | 1.0 | 0.398 |
| Naturopathy | 91 | 1.3 | 5 | 2.2 | 55 | 1.4 | 20 | 1.0 | 11 | 1.3 | 0.275 |
| Other alternative therapy | 227 | 3.2 | 4 | 1.7 | 141 | 3.6 | 72 | 3.4 | 10* | 1.1 | 0.001 |
| Hospital admission | 290 | 4.1 | 10 | 4.3 | 146 | 3.8 | 80 | 3.8 | 54* | 6.1 | 0.012 |
| Day hospital admission | 433 | 6.1 | 14 | 6.1 | 216 | 5.6 | 135 | 6.4 | 68 | 7.7 | 0.101 |
| Emergency admission | 2171 | 30.7 | 79 | 34.3 | 1130 | 29.2 | 636 | 30.2 | 326* | 37.1 | <0.001 |
N: number of subjects; %: percentage; BMI: body mass index; CAT: computerised axial tomography; MRI: magnetic resonance imagine; p-value in bold: statistically significant differences between the four BMI categories; in bold with *: statistically significant differences when comparing each BMI category with the normal weight group.
Persons suffering from obesity visited a physiotherapist during the last 12 months in the same proportion as those with low weight but in a significantly lower proportion than people with normal weight. However, they did not differ in the times seen by nursing staff or psychologists, or home care visits by nurses. Also, there were statistically significant differences in alternative therapies, used in a lower proportion by people with obesity than in the normal weight category. However, these differences were due to what the NHS classified as “other alternative therapies“, including practices such as osteopathy, chiropractic, etc., since the three primary alternative therapies (homoeopathy, acupuncture and naturopathy) did not show statistical significance.
Concerning the performance of diagnostic tests, significant differences were found for ultrasound scans, with the underweight group having the highest proportion, while the result obtained for individuals with obesity did not differ from that found for normal-weight individuals. As for X-rays, their performance was significantly associated with having overweight or obesity. The normal weight group showed a lower proportion, although the differences between groups did not exceed 4%. No differences were found in the performance of the remaining radiological and analytical tests. The differences were also statistically significant in hospital admissions and the emergency department's use in the last 12 months, which were greater in the group with a BMI≥30kg/m2 than in the other groups. In the specific case of hospital admissions, the percentage in the group with obesity was almost twice as high as in the normal weight group.
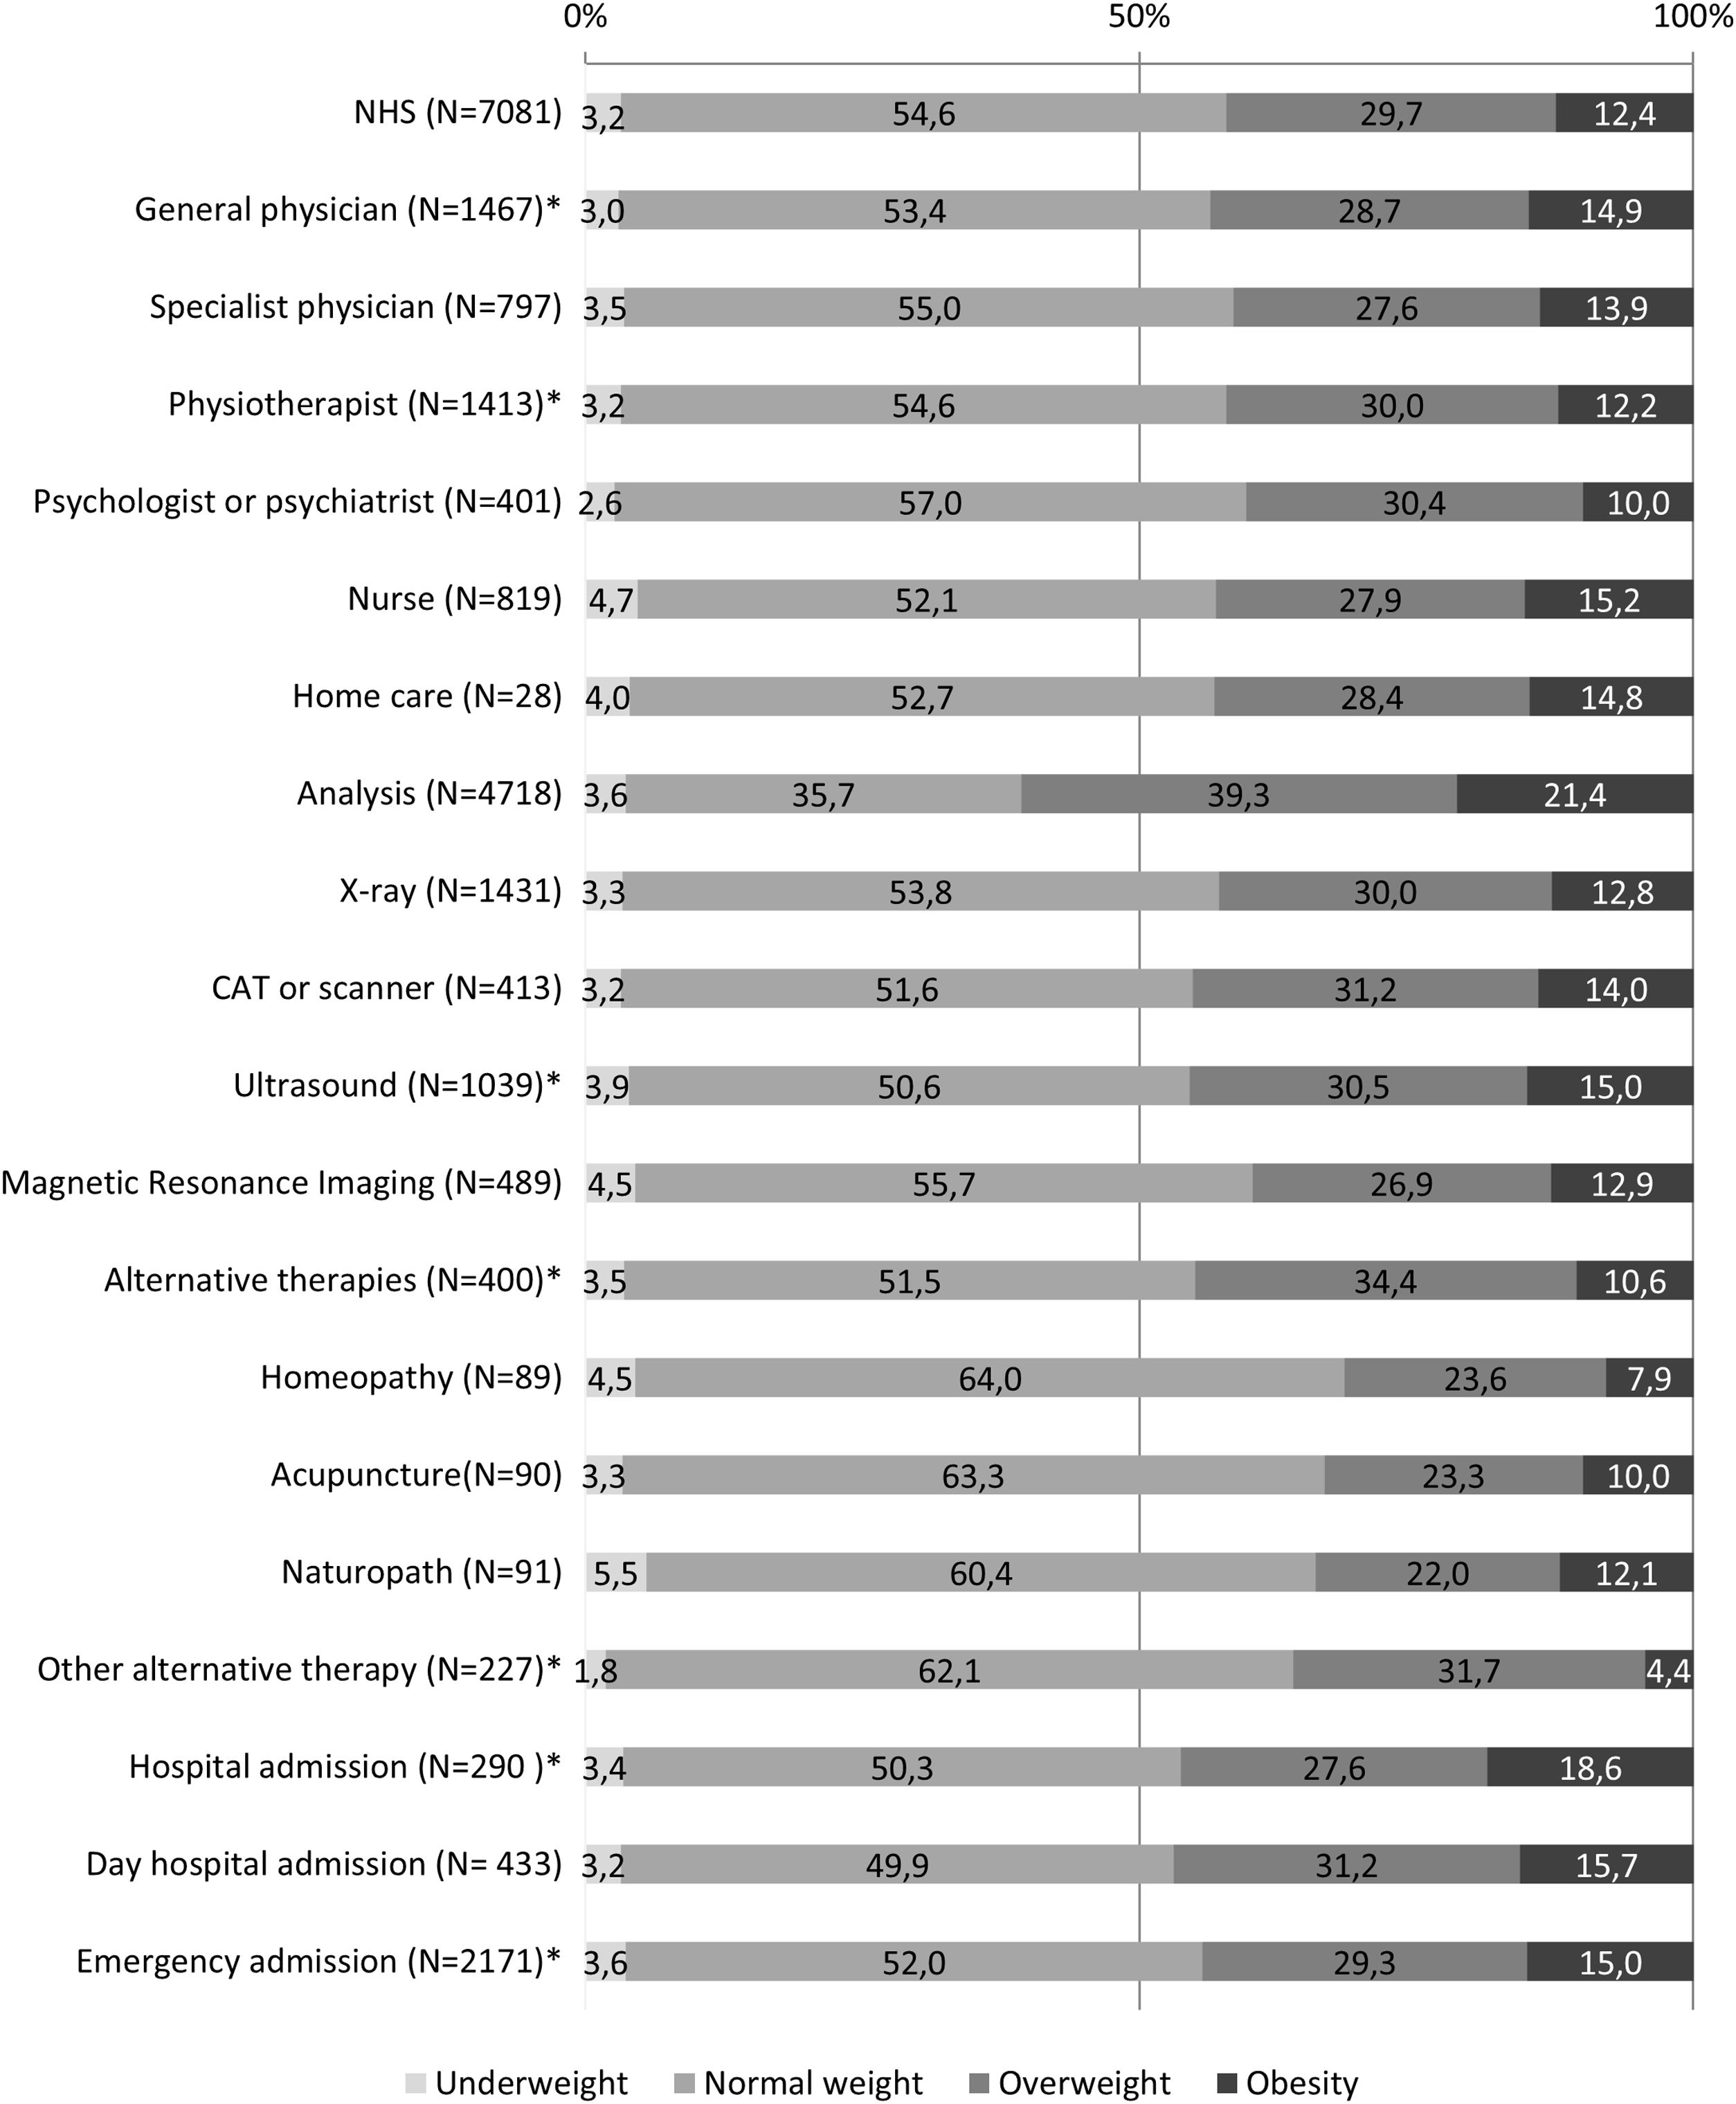
The percentage represented by each BMI category within the total number of people who used the health services is shown in Fig. 1. It can be seen that the percentage of people with overweight was much higher in the case of analytical tests than for the other tests. In the case of admission to a day hospital and alternative therapies, people with normal weight made the most use of these resources, just as they were the ones who most went to a psychologist or psychiatrist.

Use of health services by body mass index categories. Distribution by each BMI category of the subsample of adults who reported using each type of health service during the last 12 months. Footnote: *Statistically significant differences between groups. CAT: computerised axial tomography; NHS: national health survey.
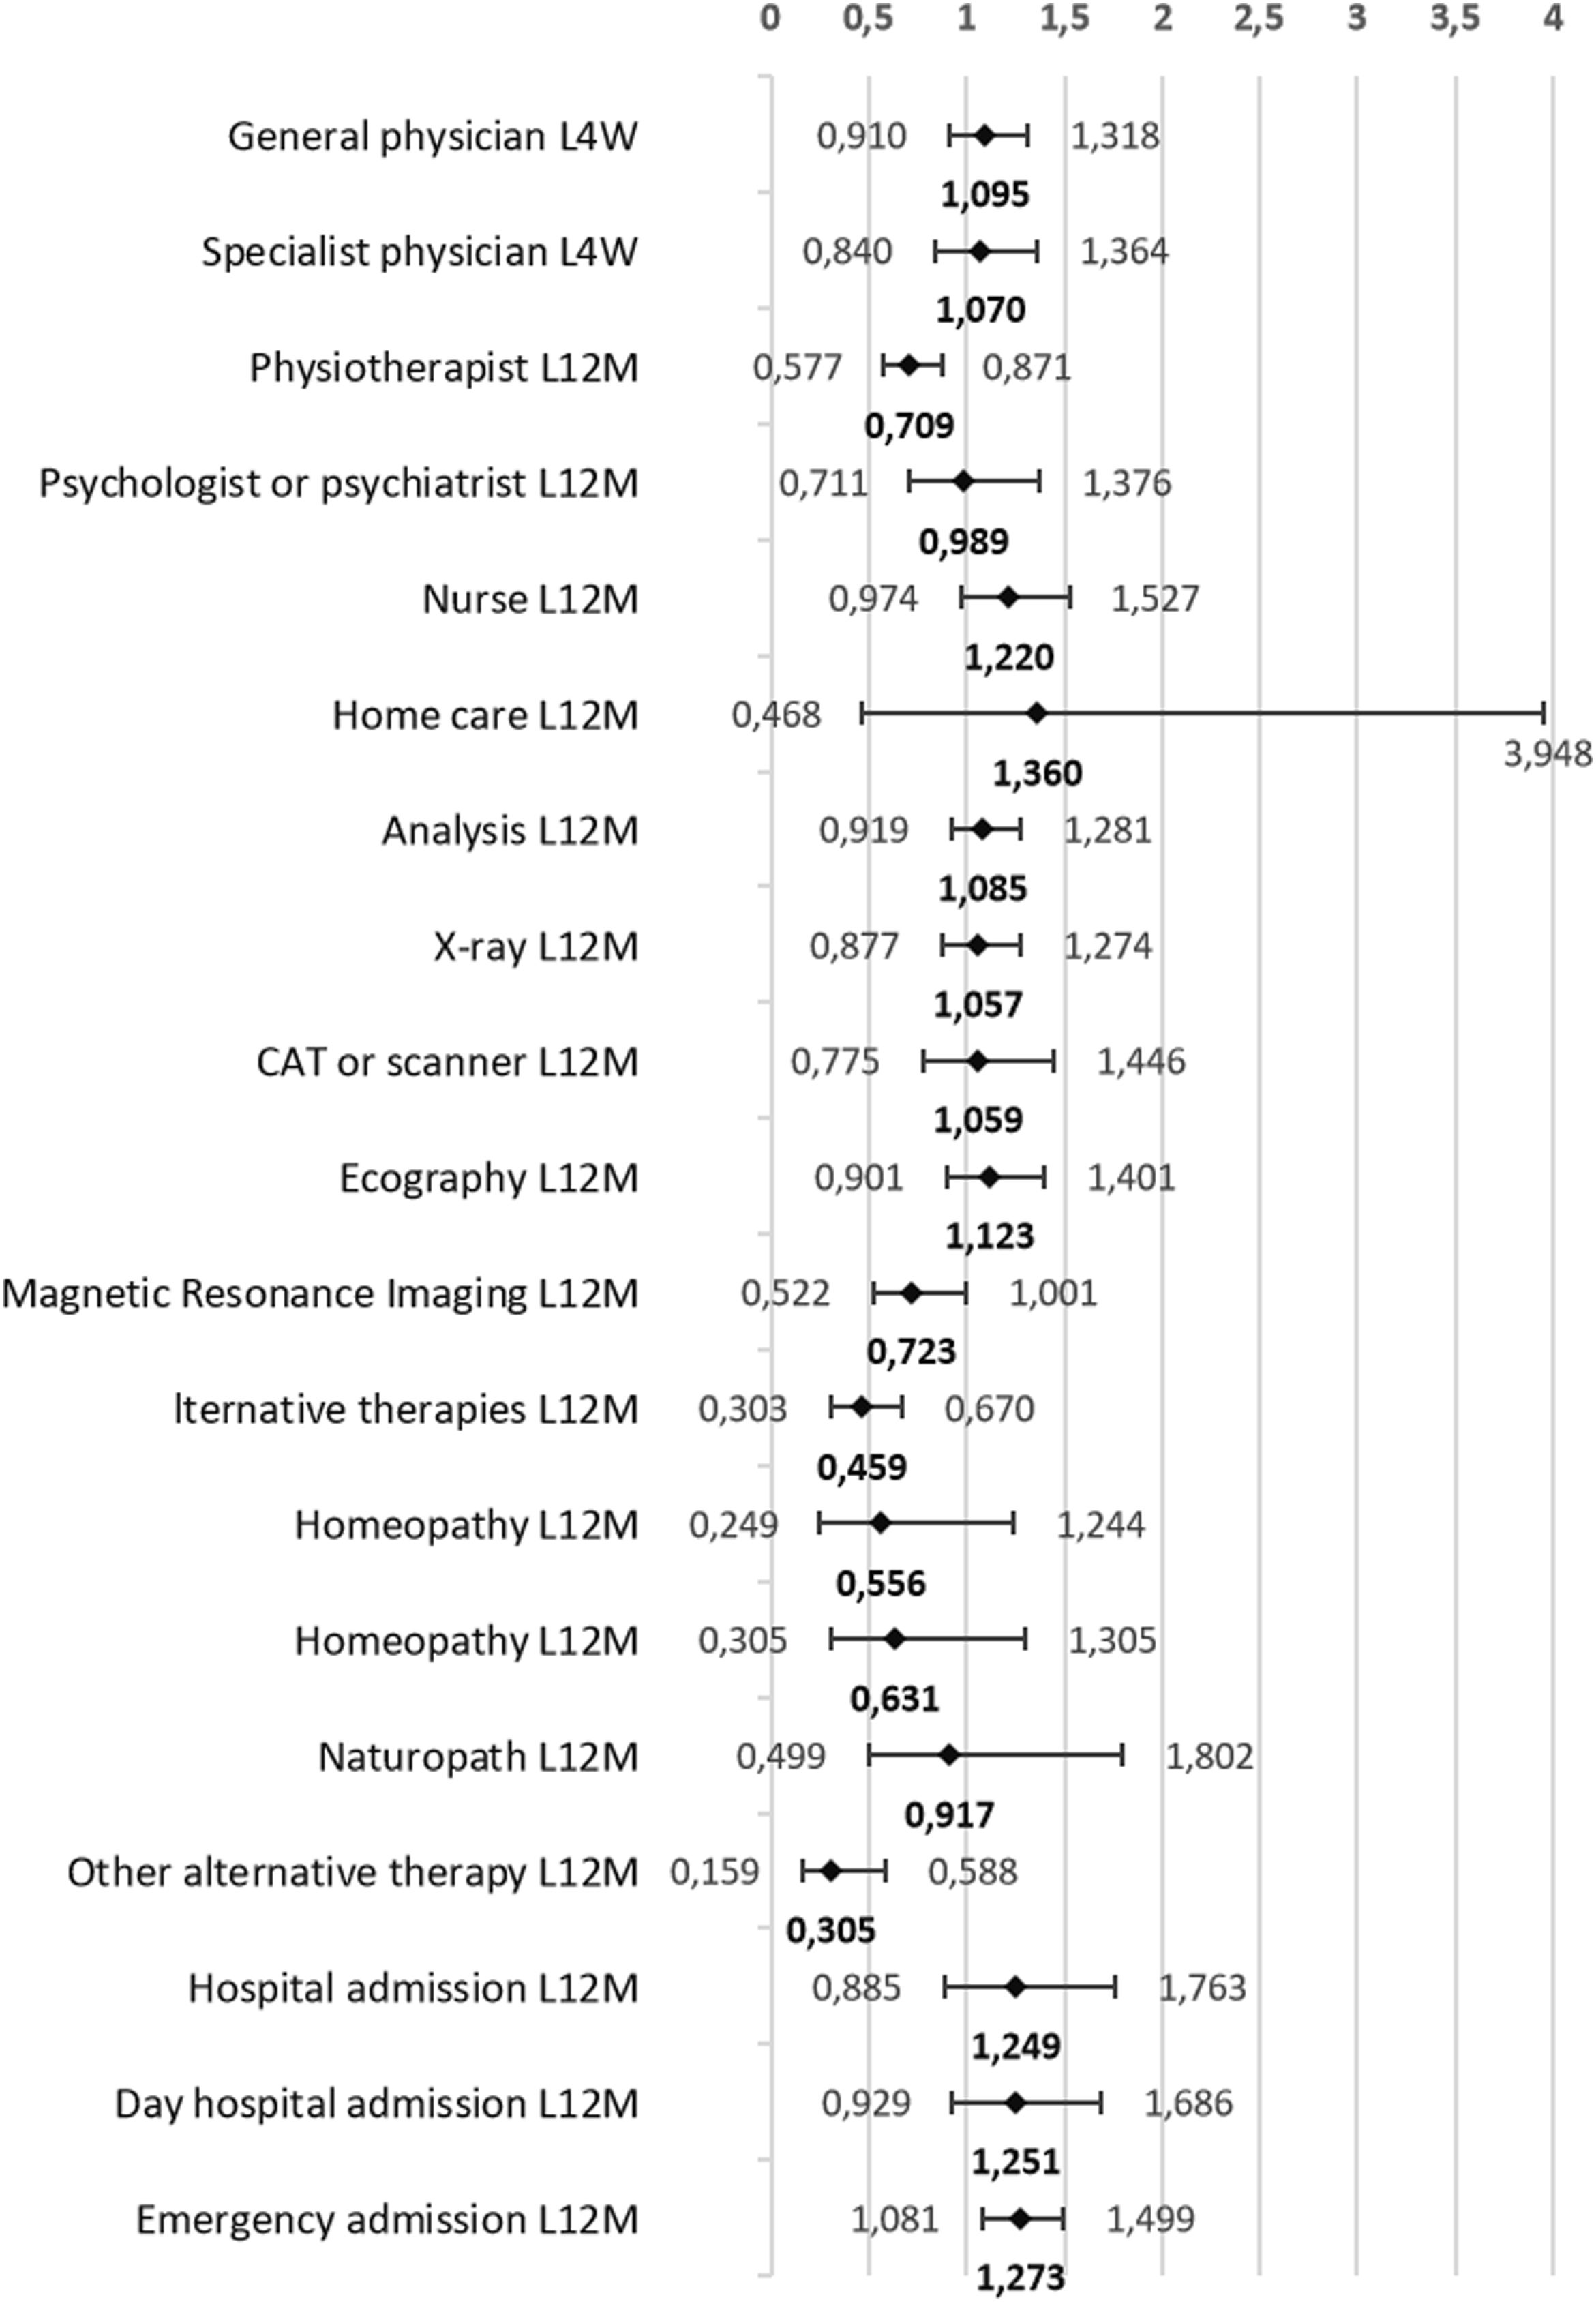
As shown in Fig. 2, after controlling for sex, age group, educational level, social class, current economic activity, and perceived health status in the last 12 months, individuals with obesity were 1.27 times more likely to use emergency services than those with normal weight. However, the probability of visiting a physiotherapist was 1.41 times lower. Likewise, people with obesity were 2.18 times less likely to use alternative therapies for their health problems. Specifically, this probability was 3.28 times lower in therapies classified as other, which would correspond to osteopathy, chiropractic, etc.
 that adults aged 18–45 years with obesity use health services compared to their normal-weight peers. Model adjusted for sex, age group, educational level, social class, current economic activity, and perceived health status in the last 12 months. Footnote: L4W: last four weeks; L12M: last twelve months; CAT: computerised axial tomography.")
Probability (odds ratio) that adults aged 18–45 years with obesity use health services compared to their normal-weight peers. Model adjusted for sex, age group, educational level, social class, current economic activity, and perceived health status in the last 12 months. Footnote: L4W: last four weeks; L12M: last twelve months; CAT: computerised axial tomography.
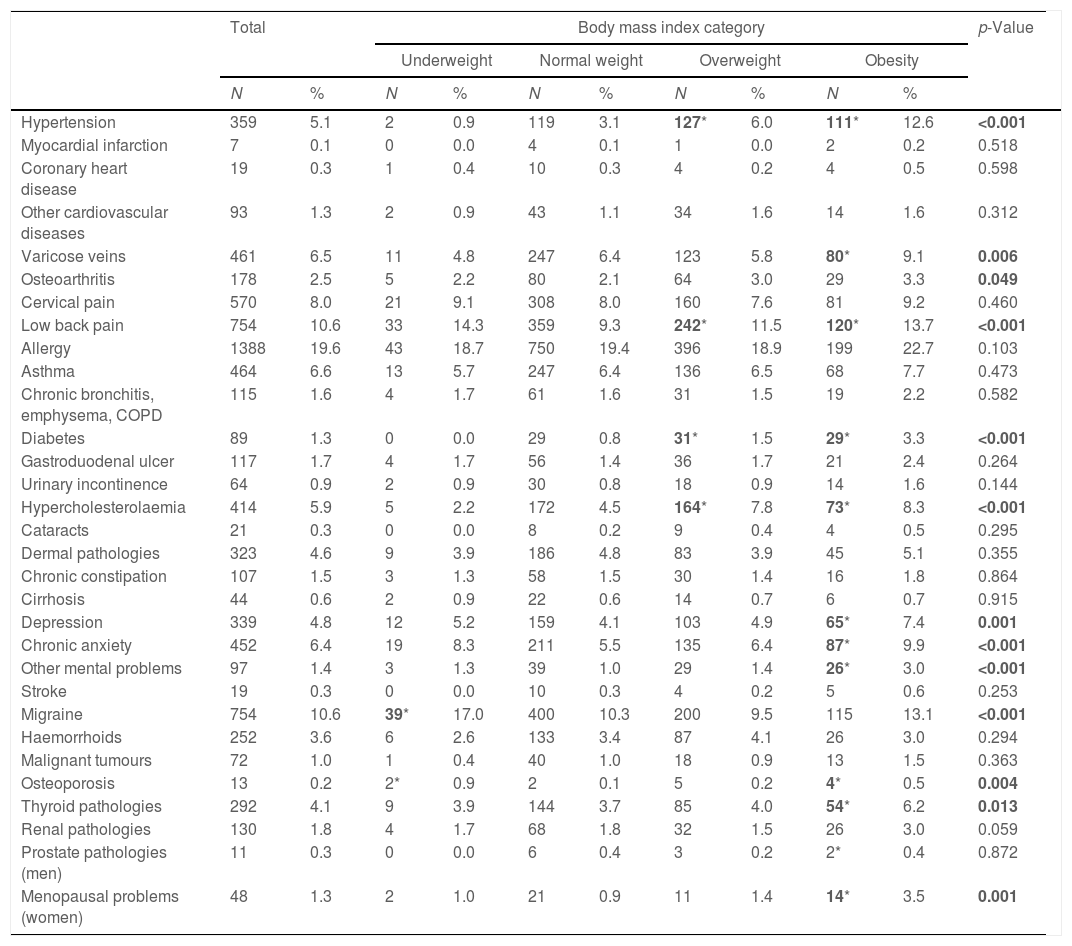
Table 2 shows the prevalence of comorbidities found in each BMI category analysed. People with overweight had a significantly higher proportion of hypertension, diabetes, hypercholesterolaemia and low back pain than normal individuals. Obesity was significantly associated with varicose veins, osteoporosis, thyroid gland pathologies, depression, anxiety and other mental problems, compared to the normal weight category. Likewise, people with low weight had a higher percentage of migraine and osteoporosis than people with normal weight.
Number and proportion of morbidities reported by Spanish adults aged 18–45 surveyed in the National Health Survey by body mass index categories.
| Total | Body mass index category | p-Value | |||||||||
|---|---|---|---|---|---|---|---|---|---|---|---|
| Underweight | Normal weight | Overweight | Obesity | ||||||||
| N | % | N | % | N | % | N | % | N | % | ||
| Hypertension | 359 | 5.1 | 2 | 0.9 | 119 | 3.1 | 127* | 6.0 | 111* | 12.6 | <0.001 |
| Myocardial infarction | 7 | 0.1 | 0 | 0.0 | 4 | 0.1 | 1 | 0.0 | 2 | 0.2 | 0.518 |
| Coronary heart disease | 19 | 0.3 | 1 | 0.4 | 10 | 0.3 | 4 | 0.2 | 4 | 0.5 | 0.598 |
| Other cardiovascular diseases | 93 | 1.3 | 2 | 0.9 | 43 | 1.1 | 34 | 1.6 | 14 | 1.6 | 0.312 |
| Varicose veins | 461 | 6.5 | 11 | 4.8 | 247 | 6.4 | 123 | 5.8 | 80* | 9.1 | 0.006 |
| Osteoarthritis | 178 | 2.5 | 5 | 2.2 | 80 | 2.1 | 64 | 3.0 | 29 | 3.3 | 0.049 |
| Cervical pain | 570 | 8.0 | 21 | 9.1 | 308 | 8.0 | 160 | 7.6 | 81 | 9.2 | 0.460 |
| Low back pain | 754 | 10.6 | 33 | 14.3 | 359 | 9.3 | 242* | 11.5 | 120* | 13.7 | <0.001 |
| Allergy | 1388 | 19.6 | 43 | 18.7 | 750 | 19.4 | 396 | 18.9 | 199 | 22.7 | 0.103 |
| Asthma | 464 | 6.6 | 13 | 5.7 | 247 | 6.4 | 136 | 6.5 | 68 | 7.7 | 0.473 |
| Chronic bronchitis, emphysema, COPD | 115 | 1.6 | 4 | 1.7 | 61 | 1.6 | 31 | 1.5 | 19 | 2.2 | 0.582 |
| Diabetes | 89 | 1.3 | 0 | 0.0 | 29 | 0.8 | 31* | 1.5 | 29* | 3.3 | <0.001 |
| Gastroduodenal ulcer | 117 | 1.7 | 4 | 1.7 | 56 | 1.4 | 36 | 1.7 | 21 | 2.4 | 0.264 |
| Urinary incontinence | 64 | 0.9 | 2 | 0.9 | 30 | 0.8 | 18 | 0.9 | 14 | 1.6 | 0.144 |
| Hypercholesterolaemia | 414 | 5.9 | 5 | 2.2 | 172 | 4.5 | 164* | 7.8 | 73* | 8.3 | <0.001 |
| Cataracts | 21 | 0.3 | 0 | 0.0 | 8 | 0.2 | 9 | 0.4 | 4 | 0.5 | 0.295 |
| Dermal pathologies | 323 | 4.6 | 9 | 3.9 | 186 | 4.8 | 83 | 3.9 | 45 | 5.1 | 0.355 |
| Chronic constipation | 107 | 1.5 | 3 | 1.3 | 58 | 1.5 | 30 | 1.4 | 16 | 1.8 | 0.864 |
| Cirrhosis | 44 | 0.6 | 2 | 0.9 | 22 | 0.6 | 14 | 0.7 | 6 | 0.7 | 0.915 |
| Depression | 339 | 4.8 | 12 | 5.2 | 159 | 4.1 | 103 | 4.9 | 65* | 7.4 | 0.001 |
| Chronic anxiety | 452 | 6.4 | 19 | 8.3 | 211 | 5.5 | 135 | 6.4 | 87* | 9.9 | <0.001 |
| Other mental problems | 97 | 1.4 | 3 | 1.3 | 39 | 1.0 | 29 | 1.4 | 26* | 3.0 | <0.001 |
| Stroke | 19 | 0.3 | 0 | 0.0 | 10 | 0.3 | 4 | 0.2 | 5 | 0.6 | 0.253 |
| Migraine | 754 | 10.6 | 39* | 17.0 | 400 | 10.3 | 200 | 9.5 | 115 | 13.1 | <0.001 |
| Haemorrhoids | 252 | 3.6 | 6 | 2.6 | 133 | 3.4 | 87 | 4.1 | 26 | 3.0 | 0.294 |
| Malignant tumours | 72 | 1.0 | 1 | 0.4 | 40 | 1.0 | 18 | 0.9 | 13 | 1.5 | 0.363 |
| Osteoporosis | 13 | 0.2 | 2* | 0.9 | 2 | 0.1 | 5 | 0.2 | 4* | 0.5 | 0.004 |
| Thyroid pathologies | 292 | 4.1 | 9 | 3.9 | 144 | 3.7 | 85 | 4.0 | 54* | 6.2 | 0.013 |
| Renal pathologies | 130 | 1.8 | 4 | 1.7 | 68 | 1.8 | 32 | 1.5 | 26 | 3.0 | 0.059 |
| Prostate pathologies (men) | 11 | 0.3 | 0 | 0.0 | 6 | 0.4 | 3 | 0.2 | 2* | 0.4 | 0.872 |
| Menopausal problems (women) | 48 | 1.3 | 2 | 1.0 | 21 | 0.9 | 11 | 1.4 | 14* | 3.5 | 0.001 |
N: number of subjects; %: percentage; COPD: chronic obstructive pulmonary desease; p-value in bold: statistically significant differences between the four BMI categories; in bold with *: statistically significant differences when comparing each BMI category with the normal weight group.
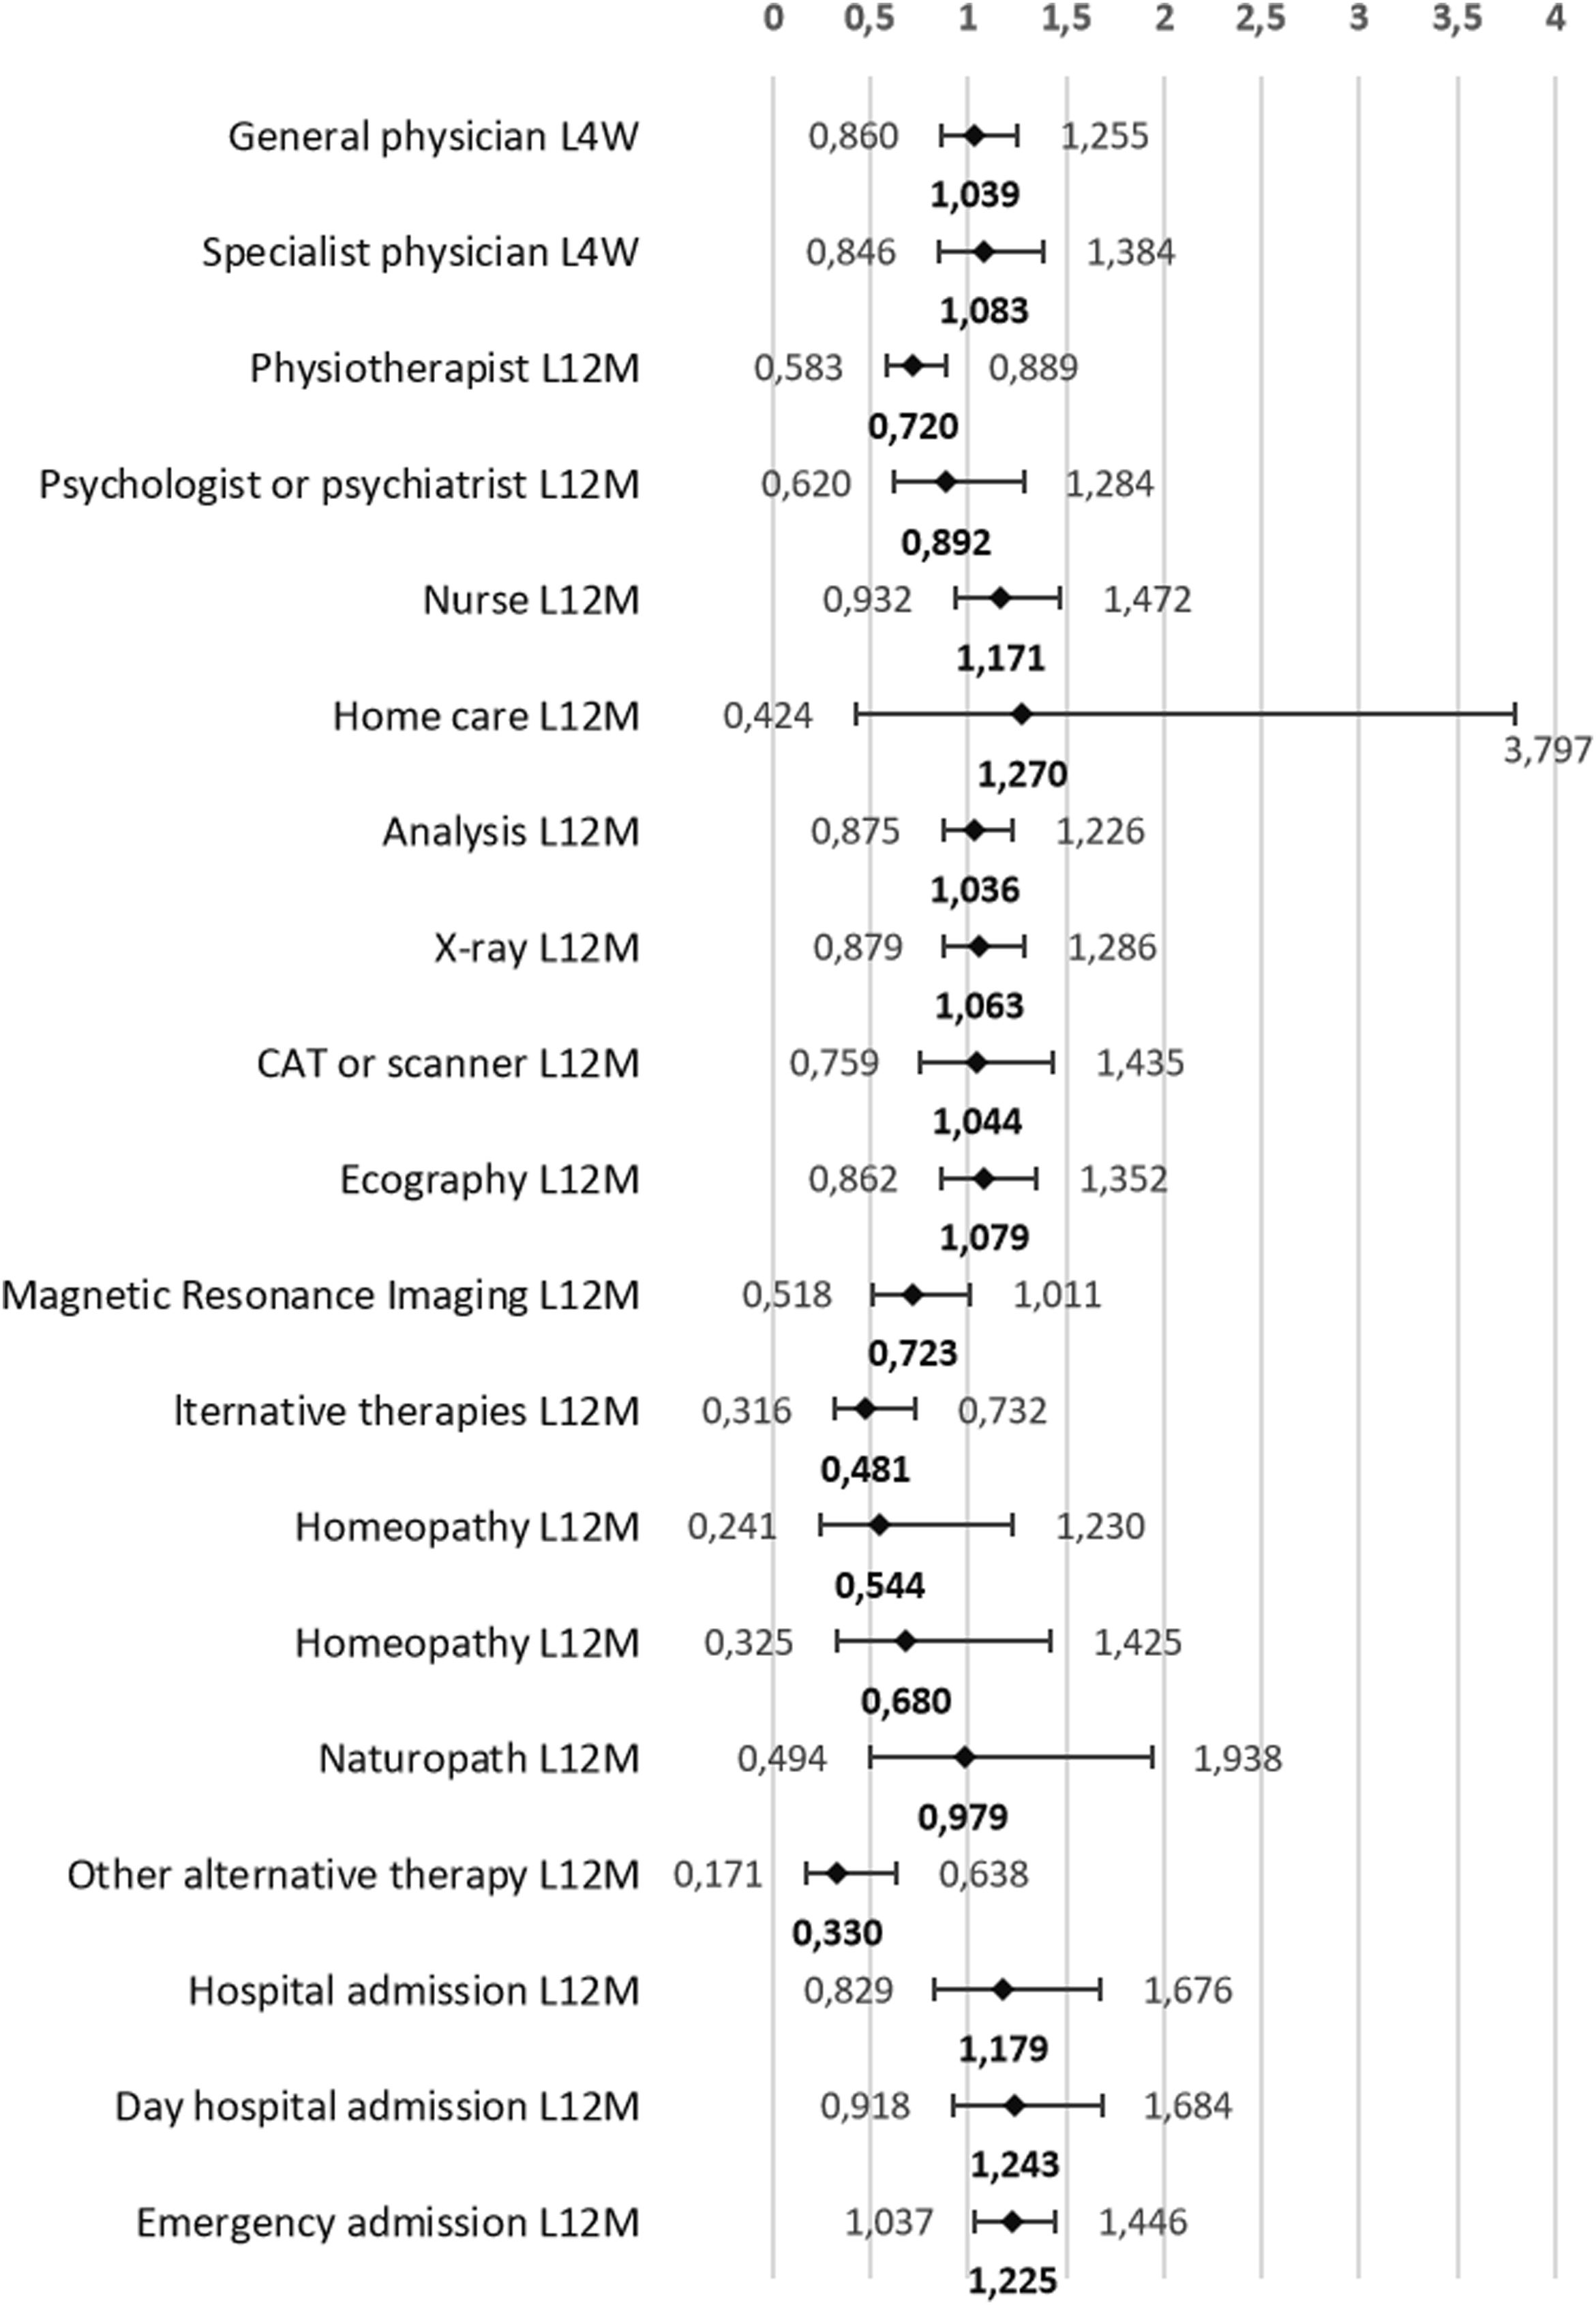
Fig. 3 shows the probability of healthcare services use by people with obesity, controlling for the sociodemographic characteristics and the presence of comorbidities. In all cases, the statistical significance found in the partial model adjusted for socioeconomic variables (Fig. 2) was also maintained when adjusting for pathologies (Fig. 3). The regression coefficients did not differ much between the two models. It should be noted that, in both models, the result related to in-home nursing care showed a vast confidence interval that would indicate that the BMI category is not a good explanatory variable for it.
 that adults aged 18–45 years with obesity use health services compared to their normal-weight peers. Model adjusted for sex, age group, educational level, social class, current economic activity, perceived health status in the last 12 months and the presence of pathologies (arterial hypertension, diabetes, hypercholesterolaemia, migraine, low back pain, osteoarthritis, depression and anxiety). Footnote: L4W: last four weeks; L12M: last twelve months; CAT: computerised axial tomography.")
Probability (odds ratio) that adults aged 18–45 years with obesity use health services compared to their normal-weight peers. Model adjusted for sex, age group, educational level, social class, current economic activity, perceived health status in the last 12 months and the presence of pathologies (arterial hypertension, diabetes, hypercholesterolaemia, migraine, low back pain, osteoarthritis, depression and anxiety). Footnote: L4W: last four weeks; L12M: last twelve months; CAT: computerised axial tomography.
The present study results show that the proportion of people with obesity seeing their GP in the last four weeks was significantly higher than those with normal weight. However, other studies carried out in the general adult population,10,12 and specifically in adults of a similar age to that of this study,13 have found significant differences of greater magnitude. Obesity among adults up to 45 years of age was not a predictor of the need for other health services, such as consultations with specialist physicians, home visits by nursing staff, or laboratory or diagnostic imaging services, except radiology. The association disappears when socioeconomic variables and pathologies are considered. In contrast, another study including the whole Spanish adult population found that overweight was associated with a greater number of nursing consultations and laboratory tests, general obesity with an increase in consultations with a specialist physician, home care and diagnostic tests (radiology, MRI and CAT), and type II obesity with an increase in mental health services.10 This discrepancy may be due to the age range studied and that, at this point, obesity has not yet been maintained long enough to develop other comorbidities. Other studies have also found that the longer people with obesity lived, the more health services they used in old age. Those with a higher initial BMI and greater weight gain experienced a significantly greater decline in health with age compared to normal-weight individuals.14 In addition, the costs of consultations with internal medicine physicians are significantly higher in patients with overweight who develop obesity than in those who remain overweight.15
When examining the relationship between the use of health services and BMI categories, people with obesity aged 18–45 years were more likely to use emergency services than individuals with normal weight. This difference was maintained after adjusting for sex, age group, educational level, social class, current economic activity, perceived health status and the presence of comorbidities (arterial hypertension, diabetes, hypercholesterolaemia, migraine, back pain, osteoarthritis, depression and anxiety). These findings are consistent with studies based on previous NHS in Spain9,10 considering the whole adult population. In the United States, it was found that people aged 18–44 with type III obesity were more likely to visit the emergency department and made a greater number of visits.13
Likewise, Spanish adults aged 18–45 with obesity show a higher frequency of hospital admission than those with normal weight. However, studies searching for a possible association between BMI and greater use of hospital services obtain contradictory results. Other Spanish10 and international16,17 studies reaffirm this association in the general adult population18–20 and young adults.13 In contrast, some others do not show this relationship with the BMI status12,21; in others, the association disappears when controlling for chronic diseases and socioeconomic status.16,18,19,22 It is postulated that the discrepancies found among studies are because they usually include different sample sizes, ages and follow-up periods.21 Over a lifetime, sustained obesity will likely lead to a higher prevalence of various comorbidities leading to increased hospital admissions. This is supported by Schafer et al.,20 who found that adults older than 45 already suffering from obesity at age 25 had a higher risk and frequency of avoidable hospital admissions.
The increased use of emergency services and hospitalisations could be related to the stigma associated with obesity. Some studies have shown that, sometimes, health professionals (including physicians, nurses, psychologists and dietitians) might manifest negative attitudes and stereotypes towards patients with obesity23 that can affect their care. These negative attitudes can cause stress and mistrust towards professionals on the part of people with obesity who perceive this stigma and experience or expect to experience inadequate treatment, causing them to renounce preventive health services23 or delay in obtaining necessary medical care.13,24 This is relevant because it interrupts the continuity of care in managing chronic and complex health problems and may lead to greater use of emergency services, which indicates the severity of the pathologies rather than the population's morbidity. Some studies show that hospitalisation costs in people with overweight or obesity are 40% higher than in normal-weight adults after adjusting for different covariates.25
Additionally, the present study shows that, after adjusting for confounding variables, a person with obesity is approximately 1.41 times less likely to go to a physiotherapist than a person of normal weight. However, according to the data found in this study, people with excess weight (both obesity and overweight) in the age range studied suffer more comorbidities such as low back pain, which can cause health problems for which a physiotherapist is usually consulted. This fact may have different explanations, one of which would be the aforementioned stigma perceived by people with obesity, which may be internal (when the person blames her/himself) or external, due to bad interactions with health personnel with little training in the management of patients with obesity.26 Several studies have shown that this is especially relevant in the case of physiotherapy.27,28 In addition, patients with obesity may feel uncomfortable due to the association of the discipline with the world of fitness and sport (injury recovery) and because of the close physical contact required between the professional and the patient.29 Another possible explanation is that physiotherapy is one of the medical services with low coverage by the Spanish public health system and, therefore, it is one of the most demanded private paid medical services.30 However, in the current Spanish context, obesity is significantly more prevalent among people in the lowest socioeconomic levels.31 Therefore, the lack of economic resources could be limiting access to this type of service. Nevertheless, this inverse association was significant in the present analysis after controlling for socioeconomic variables.
The present study has certain limitations. The Spanish NHS is based on self-reported data, including weight and height, and can recall bias in calculating BMI. It is generally considered that people overestimate their height and underestimate their weight. However, it has been observed that these misperceptions tend to occur more with the increasing age of the individuals,32 which would not be of great importance since it is based on a population aged 18–45. However, other Spanish studies have shown that the degree of agreement in nutritional classification between self-reported and actual data is theoretically good.32 Another limitation is that the selected disease report is provided directly by the individual surveyed and does not come from the patient's clinical history.
Furthermore, the study is based on cross-sectional data that provide information taken at a specific point in time, which precludes concluding the causal association between obesity and the use of health services. Among the strengths of this study is that it used the NHS, a nationally representative survey with a large sample size that provides many variables that allow adjustment of the multivariate analysis by controlling for factors known to modify the utilisation of health services. Meanwhile, the high response rate makes biases due to nonresponse unlikely. Moreover, in contrast to most studies, this one focuses on the young adult group to detect critical points for early prevention of excess weight and better utilisation of limited healthcare resources.
In conclusion, the study shows that Spanish people aged 18–45 who suffer from obesity are more likely than the healthy weight group to use some health resources, such as GP consultations, emergency services and hospitalisation. On the other hand, they are less likely to visit a physiotherapist, and this difference is maintained after adjusting for socioeconomic variables and pathologies. Further studies in the older adult population reveal more differences between those with obesity and those with adequate weight. Therefore, it is shown that this stage of life is a window of opportunity for promoting lifestyles that promote a healthy weight to prevent chronic diseases, reduce associated direct and indirect costs, and allow better management of health resources in the country.
FundingThis research has not received specific grant aid from any funding agency in the public, commercial or not-for-profit sectors.
Conflicts of interestThe authors declare that they have no conflicts of interest.