

Previous studies suggest that there are individual differences that affect the way that people fake their responses on personality measures to varying degrees. These factors should be taken into account to obtain more accurate information regarding faking behavior. This study demonstrated an analysis technique that can accommodate individual differences in an experimentally induced faking study. This mixed-design experiment used two randomized groups (honest vs. faking condition), who each completed a five-factor personality measure twice. This study analyzed data using the generalized ANCOVA (g-ANCOVA) as an alternative to the traditional ANCOVA, since the g-ANCOVA can accommodate both individual differences in prior manipulation (covariates) and interaction, estimating the effects of inducement to fake. We also demonstrated the use of EffectLite, a program for the univariate and multivariate analysis of unconditional, conditional, and average mean differences between groups, and which supported the present study by providing analysis using g-ANCOVA.
Estudios anteriores sugieren que existen diferencias individuales que afectan a la forma en que las personas falsifican sus respuestas en las medidas de personalidad en diversos grados. Estos factores deben tenerse en cuenta para obtener información más precisa sobre el comportamiento falso. Este estudio mostró una técnica de análisis que puede adaptar las diferencias individuales en un estudio de la falsificación inducida experimentalmente. Este experimento de diseño mixto contó con 2 grupos aleatorios (forma honrada frente a falsa), cada uno de los cuales cumplimentó una medida de personalidad de 5 factores 2 veces. Este estudio analizó los datos utilizando el ANCOVA generalizado (g-ANCOVA) como una alternativa al ANCOVA tradicional ya que el g-ANCOVA puede adaptar tanto las diferencias individuales con manipulación previa (covariables) como la interacción, estimando los efectos de la inducción a la falsificación. También mostramos el uso de EffectLite, un programa para el análisis univariable y multivariable de las diferencias de medias incondicionales, condicionales y medias entre los grupos, que respaldó el presente estudio proporcionando un análisis que utilizó el g-ANCOVA.
Experimentally induced faking using different sets of instructions has been widely employed in many studies about faking (Griffith, Chmielowski, & Yoshita, 2007; Ziegler, Schmidt-Atzert, Bühner, & Krumm, 2007). These studies have followed a range of designs, including asking participants to respond to measures according to different instructions, to respond as honestly possible, to fake good or bad responses, and to respond as if they were job applicants. Comparing the obtained scores under different sets of instructions can explain the extent to which individuals could successfully fake their answers, thereby indicating the extent to which personality measures are fakable. There are two methods to examine faking: within-subject and between-subjects designs. Both designs contribute to understanding faking in different ways. Within-subject designs reveal how individuals can enhance their obtained score by faking, and between-subjects designs reveal how individuals fake their responses more under certain circumstances. Both designs confirm that people can fake their answers to personality measures, as indicated by the significant score differences found by both within- and between-subjects measurements. However, findings are inconsistent with respect to the effects of the specific inducement for faking on individuals’ scores. One reason for these mixed results may be due to the limitations of study designs, or in the analyses used to compare individual differences in faking (McFarland & Ryan, 2000). Comparing the scores from different conditions (e.g., honest vs. faking) is less informative if the individuals who are faking do so to different degrees.
Previous studies found evidence for the presence of individual differences in faking, with varying faking intensity scores on personality measures (Brown & Cothern, 2002; McFarland & Ryan, 2000; Rosse, Stecher, Miller, & Levin, 1998; Widhiarso & Suhapti, 2009). Individual difference in faking can be identified by several parameters, such as effect sizes and pre-test×group interactions (Viswesvaran & Ones, 1999), correlation between individuals’ scores under honest and faking conditions (Brown & Cothern, 2002; Longstaff & Jurgensen, 1953; Mersman & Shultz, 1998), rank order of individuals (Lautenschlager, 1986), and moderation processes in regression analysis (Holden, 2007; Krahé, Becker, & Zöllter, 2008). Based on these studies, both within and between-subjects designs, along with their analytical procedures (e.g., t-testing), tend to disregard individual differences in faking. A method of experimentally induced faking that can incorporate individual differences into the analysis is needed, because this factor misleads the mean score differences being examined.
A meta-analysis conducted by Viswesvaran and Ones (1999) compared findings from within- and between-subjects study designs. The authors also compared the effect sizes of the examined studies. They found that participants could elevate their scores by around .75 standard deviations (d=.47 to d=.93) in the within-subject studies, and by around .50 standard deviations (d=.48 to d=.65) in the between-subjects studies. The authors suggested that the larger effect sizes for the within-subject designs as compared to the between-subjects designs are evidence of individual variations in faking. Differences in study design and analytical procedures across faking studies are therefore a possible reason explaining their different results.
Experimentally induced faking using sets of instructions typically uses either a within- (e.g. Griffith et al., 2007) or a between-subjects design (e.g. Ferrando & Anguiano-Carrasco, 2009). Recently, a few studies have used a mixed design combining within- and between-subjects designs. In the current study, we use a mixed-design method to examine faking behavior. We demonstrate procedure analysis using generalized analysis of covariance (g-ANCOVA) as a methodology to investigate individual differences in faking in an experimentally induced faking study. This study follows the theoretical framework established by Lubinski (2000), who stated that causal models of a phenomena that do not incorporate individual differences in variables are likely to be underdetermined. This means that the framework for interpreting individual faking behavior cannot be completely justified because there is particular variation within that individual that might bias the interpretation. We will first review methodological issues associated with within- and between-subjects faking studies, and then introduce our proposed design and analysis procedure.
Within- and between-subjects designsIn the within-subject design, faking is operationally defined as a difference in scores between normal and faking conditions (e.g., instructions to answer honestly or to fake responses to achieve a specific goal). Measuring the same individual under different conditions facilitates the researchers’ ability to estimate the individual effects of faking. This design answer the question of whether participants can successfully fake the measure, as evidenced by higher scores under induced faking than at baseline (e.g., pre-test). One of the advantages of the within-subject design is that it can show whether faking actually occurred. In a real-world setting, comparing the mean scores between incumbents and job applicants, for example, will usually show job applicants to obtain higher mean scores. Such a finding allows researchers to logically assume that at least some applicants do fake, but it is difficult to draw general conclusions from this analysis (Griffith et al., 2007). With regard to statistical power, given an equal number of participants, the within-subject design is more powerful than the between-subjects design. However, given an equal number of tests, the between-subjects design is also powerful because of the slight gain in the degrees of freedom (Viswesvaran & Ones, 1999).
Within-subject designs help researchers to make detailed examinations of faking behavior at the individual level. Since the level of response distortion varies across individuals, detailed examination is considered necessary to assess dispositional factors that might affect faking variability. This advantage motivates some studies to categorize individuals based on how much their score changed relative to measurement error (Griffith et al., 2007; Peterson, Griffith, Converse, & Gammon, 2011). For instance, individuals’ responses could be flagged as likely to be fake if the change in their score between the honest and the faking condition exceeded the interval confidence that could be expected based on the measurement error derived from the honest condition.
However, conclusions drawn from studies with within-subject design might be weak because individuals can develop due to maturation, learning, experience, and historical change (Shadish, Cook, & Campbell, 2002). Therefore, to provide the strongest evidence, researchers must demonstrate that none of these confounders took place, or that, if they did, they have a certain structure that can be corrected for (Steyer, Partchev, Kroehne, Nagengast, & Fiege, 2011). Another issue related to the within-subject design in faking studies is the order in which instructions are given. If participants take the test only twice (i.e., honest then faking condition), the study is limited due to its inability to detect if results would be the same if the order of instruction was reversed. Score differences between the two test administrations are also prone to be impacted by situation-driven fluctuations (Ziegler, MacCann, & Roberts, 2011). Thus, a higher score for the faking as compared to the honest condition reflects a natural event, because the situation facilitates individuals’ ability to do so. A true-change model proposed by Steyer (2005), which serves as an extension on latent state-trait models, can be adopted to address this issue.
In the between-subjects design, researchers compare score differences between two random groups of participants, for example, honest vs. faking or job applicants vs. incumbents. This design assumes that participants who receive specific instructions to fake their responses are willing and able to do so. This design also assumes that participants who do not receive specific instructions to fake their responses are not motivated to distort their responses. The between-subjects design has the advantage of simplicity. This simplicity has made the between-subjects design increasingly popular among researchers. This design also facilitates researchers’ ability to use advanced procedures to examine faking, such as differential item functioning (Stark, Chernyshenko, Chan, Lee, & Drasgow, 2001), Mixed Rasch Modeling (Eid & Zickar, 2007) or multiple group analysis structural equation modeling (SEM; Frei, Griffith, Snell, McDaniel, & Douglas, 1997).
Under quasi-experimental designs, the mean differences between groups are more systematic than random (Shadish et al., 2002). Between-subjects designs are vulnerable to the influence of third variables or confounders due to group-level inequalities in characteristics. These factors may lead to inadequate conclusions, as the heterogeneity of variance across groups is substantial (Bryk & Raudenbush, 1988). Heterogeneity occurs when inducement to fake has an effect on some participants but not on others; this may be caused by technical problems such unclear instructions, as well as by differential participant responsiveness. Individual differences can affect faking variance, as participants may react differently to instructions to fake. Previous authors suggested that individual differences associated with faking might be quite complex, since this phenomenon combines both willingness (e.g., motivation) and ability to fake one's responses (Ferrando & Anguiano-Carrasco, 2011; McFarland & Ryan, 2000).
Two other interesting issues regarding the between-group design are interaction (sets of instructions×individual trait or ability) and measurement invariance. If interaction occurs, the interpretation of mean differences between groups becomes problematic (Viswesvaran & Ones, 1999); measurement invariance of the measure across two groups makes mean score differences meaningless (Peterson, Griffith, O’Connell, & Isaacson, 2008). Evidence of an interaction would suggest that the findings from previous research on inventory distortion that use repeated measure designs should not be generalized to a non-pre-tested population. For example, previous faking research may not be applicable to selection generalization, since it is commonly assumed that job applicants have no previous experience with the personality inventory being used in the employment procedure (Schwab, 1971).
Mixed designs and generalized ANCOVAIdeally, a design that includes both a within and a between-subjects design (mixed-design) can generate the most useful and interpretable results. The within-subject design is appropriate for examining faking at an individual level, while the between-subjects design allows researchers to compare groups. In the mixed design, participants are randomly assigned to one of two groups. The first group (control) completes the scale twice, both times under honest instruction, while the second group (manipulated) completes the measure first under honest, and then under faking instruction. While a within-subject design would eliminate sequence effects and a between-subjects design would eliminate period effects (Putt, 2005), a mixed design can remove both of these limitations.
The way in which faking is operationalized determines the experimental design, as well as the analytical procedure. For instance, faking that is operationalized as the change in scores between the honest and the faking condition uses a within-subject design, and applies t-testing to examine the change in scores. Ideally, even when faking is defined in different ways and examined using studies with different designs, the analysis will produce similar results. This similarity can be indicated when the effect sizes of inducement to fake for both within and between-subjects designs are approximately equal. This goal can be achieved by sampling participants by perfect random. Theoretically, perfectly random sampling ensures that study participants have the same characteristics, making their responses under given inducements homogeneous. Hence, the average total effect of inducement to fake across individuals will be the main effect of the treatment factor in orthogonal analysis of variance. For further discussion of this issue, the interested reader can consult Steyer.
However, completely randomized designs are limited due to the inability of researchers to eliminate the effect of confounding variables on the outcome. Steyer demonstrated how the effect sizes of treatments can reverse signs when prior treatment variables are involved in the analysis, despite the fact that the data are obtained from randomized experiments. Involving prior treatment variables is the same as including a pre-test in the analysis when examining post-test mean differences between manipulated and control groups. Therefore, including pre-tests in ANCOVA tests of post-test differences between groups has become popular among researchers.
Mixed designs are recommended because they support empirical tests of interaction effects, which cannot be employed on either within- or between-subjects designs. Although interaction effects in research on faking have been assumed not to exist, as randomized designs were implemented (Viswesvaran & Ones, 1999), at a certain point interactions will impact substantive meaning (see Steyer & Partchev, 2008). Interactions refer to all constellations in which the effect of manipulation on faking behavior is not constant across different levels of individual attributes. Interactions are difficult to avoid because there are individual differences in faking, caused by situational factors and differences in ability and motivation. In experimentally induced faking, participants may react differently to instructions; some participants are motivated to fake a great deal, while others may not fake at all (Corr & Gray, 1995).
We recommend mixed designs because they strengthen the conclusions that can be made regarding individual faking, providing the strongest interpretation (Griffith et al., 2007). Previous research on faking has employed various partial approaches. Two studies simply focused on score comparisons within individuals asked to respond honestly and to fake (within-subject design; (e.g. Lautenschlager, 1986; Peterson, Griffith, & Converse, 2009) while others focused on comparisons between groups under different instructions (between-subjects design; (e.g. Holden, 2008; Martin, Bowen, & Hunt, 2002). Several studies have already employed mixed designs. For example, McFarland and Ryan (2000) and Scherbaum (2003) used a 2×2 mixed-design with two instruction conditions (honest vs. fake) as the within-subject factor, and the order of instructions as the between-subjects factor. Our design in the current study is similar to Ferrando and Anguiano-Carrasco's (2011) design, which employed a 2×2 mixed design with two groups (control and manipulated) as the between-subjects factor.
As discussed earlier, ANCOVA is a recommended procedure for analyzing the data from mixed-design studies. This procedure examines the post-test difference between means for two groups using pre-test scores as a covariate. However, this method does not allow for interactions (pre-test×groups), and instead assumes the regression slopes across the groups to be homogeneous. Consequently, an interaction is defined as a variation that is not explained by ANCOVA because it is unmodeled. A method of analysis that can examine mean differences even when an interaction is present is required. To resolve this problem, Steyer, Partchev, Kröhne, Nagengast, and Fiege (2008) showed how traditional ANCOVA models can be generalized to allow interactions between groups and the covariates: generalized analysis of covariance (g-ANCOVA).
In g-ANCOVA, covariate treatment interactions are taken into account, allowing treatment effects to be larger or smaller depending on the values of the covariate(s). For example, if researchers were examining faking using a mixed-design study, they would divide the participants into two groups (control and manipulated). Both groups would be pre-tested under the same honest instruction, and then post-tested after receiving different instructions: the manipulated group would be instructed in such a way as to induce faking. In this example, the researchers could contrast the manipulated (X=1) to the control group (X=0) to estimate the effects of inducement to fake. Using the pre-test (Z) as a covariate, the regression model estimating the effects of inducement can be expressed as E(Y|X,Z)=g0(Z)+g1(Z)·X. Using regression modeling terms, g0(Z) refers to intercept function and g1(Z) refers to slope or effect function.
Since the covariate Z is continuous (z1, z2, …, zk), the effects gx(z) of X may be different for different values of the covariate. Thus, there are several effect functions g1(Z) regarding the range of covariate values. Taking the average of these functions gives E[g1(Z)], which refers to the average effects of inducement to fake. Another part of the model, g1(Z)·X, can also be derived regarding the number of groups (X=1 and X=0). Hence, E[g1(Z)|X=1] is the average effect of inducement to fake that would be estimated if everyone in the manipulated group received instructions to fake, compared with if participants in this group did not receive an inducement to fake. Moreover, E[g1(Z)|X=0] is the average effect of inducement to fake on the control group if the participants in this group received the treatment, as compared to if no participants in this group received instructions to fake. When average effects and average effects given a treatment condition are estimated, then two effect sizes are produced. One effect size is estimated for average effects E[g1(Z)] and two effect sizes are estimated for average effects given a treatment condition (E[g1(Z)|X=1] and E[g1(Z)|X=0]). According to this approach, the effect sizes are estimated by dividing the effect by the standard deviation of the outcome variable in the control group.
Purposes of the present studyThe aim of the present study is to demonstrate the use of an analysis technique that can accommodate individual differences in a study on experimentally induced faking. We demonstrate that using g-ANCOVA as an alternative to traditional ANCOVA can handle interaction terms to estimate the effect of inducement to fake. We examine two primary coefficients that describe the effect of inducement to fake: average effect and conditional effect. EffectLite (Steyer & Partchev, 2008), a program for the univariate and multivariate analysis of unconditional, conditional, and average mean differences between groups, supports our endeavor, since this program can provide analysis using g-ANCOVA.
MethodParticipantsParticipants were students enrolled in undergraduate courses through the Faculty of Psychology, Universitas Gadjah Mada, Indonesia. After removing cases with missing data, the total number of remaining participants was 182 (54% female and 46% male; ages 19–26 years old).
MeasuresThis study employed the Big Five Inventory (BFI-44; John & Srivastava, 1999) to measure the five personality traits of extraversion, emotional stability, agreeableness, conscientiousness, and openness to experience. This measure consists of 44 Likert-type items on a 5-point scale. The alpha coefficients for the measures of the aforementioned five traits were .88, .84, .79, .82, and .81, respectively.
ProceduresThe current study employed a 2×2 mixed design with two groups who each completed the assessment twice (two weeks apart). Participants were randomly assigned to the control (honest group) or the manipulated group (faking group). Participants in the control group completed the measure twice, both times under standard instructions. Participants in the faking group completed the measure twice, but under two different sets of instructions, standard instructions and instructions to fake. Under the standard instructions, participants were asked to complete the scale as honestly as possible, while under the instructions to fake, participants were asked to make as good an impression as possible; i.e., to respond as if they were applying for a job. To make the job offered relevant to the participants’ field of study (psychology), we chose clinical psychologist as the job being offered. Since this study employed an experimental design, the term treatment is sometimes used in this paper to refer to inducement to fake (the manipulation variable) and pre-test and post-test refer to the first and second times, respectively, that participants completed the assessment.
Data analysisg-ANCOVA was analyzed using EffectLite v.3.1.2 (Steyer & Partchev, 2008), a statistical package for integrated analysis, to estimate average and conditional effects. EffectLite has been developed especially for the analysis of covariate treatment-outcome designs with treatment and control groups. The advantages of this program are that it does not require homogeneity of variances or covariance matrices; it can handle several manifest and latent outcome variables, even if outcomes are mixed; it facilitates the analysis of conditional and average effects; and it estimates and tests the average effects for non-orthogonal analysis of variance designs for qualitative covariates. The analysis was performed five times, corresponding to the number of personality factors, using post-test as the dependent variable; different instruction condition as group; and pre-test score of the five personality measures, gender, and social desirability measure as the covariates. We used fully stochastic sampling models in EffectLite because this study employs a randomized design.
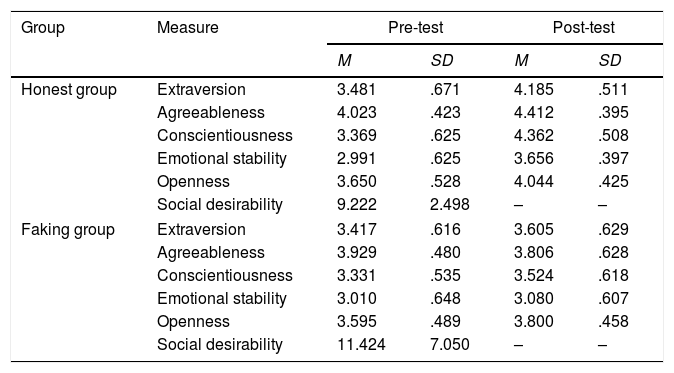
ResultsDescriptive statisticsDescriptive statistics of the data are presented in Table 1. Personality factor scores were computed from summed scores divided by the number of items for that factor. Since possible item scores range from 1 to 5, with the exception of the social desirability measure, the hypothetical mean score of each factor is 3. Means scores for the personality measure exceeded three for both the honest and the faking condition, meaning that participants’ scores for both conditions were above average. Participants’ mean scores for those in the faking condition were higher than for those in the honest condition for all five factors of the assessment.
Comparison of means and standard deviations of the measures for honest and faking groups (pre-test and post-test).
| Group | Measure | Pre-test | Post-test | ||
|---|---|---|---|---|---|
| M | SD | M | SD | ||
| Honest group | Extraversion | 3.481 | .671 | 4.185 | .511 |
| Agreeableness | 4.023 | .423 | 4.412 | .395 | |
| Conscientiousness | 3.369 | .625 | 4.362 | .508 | |
| Emotional stability | 2.991 | .625 | 3.656 | .397 | |
| Openness | 3.650 | .528 | 4.044 | .425 | |
| Social desirability | 9.222 | 2.498 | – | – | |
| Faking group | Extraversion | 3.417 | .616 | 3.605 | .629 |
| Agreeableness | 3.929 | .480 | 3.806 | .628 | |
| Conscientiousness | 3.331 | .535 | 3.524 | .618 | |
| Emotional stability | 3.010 | .648 | 3.080 | .607 | |
| Openness | 3.595 | .489 | 3.800 | .458 | |
| Social desirability | 11.424 | 7.050 | – | – | |
M, mean; SD, standard deviation. Participants in the honest group were instructed to complete the measure honestly, while the faking group was only instructed to complete the measure honestly the first time (Time 1).
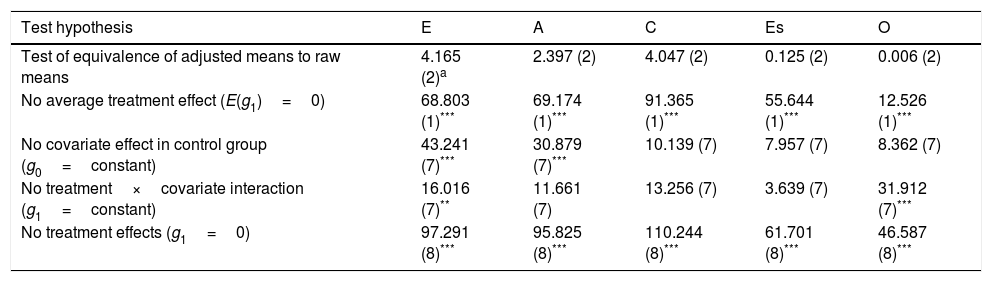
This section will present the results of the analysis in accordance with the flow of the analysis provided by EffectLite. The initial part of the output analysis was a simultaneous test as to whether covariate means were equal between treatment groups. This information is useful for initial screening to ensure that randomization does not fail due to, for example, systematic attrition. This allows researchers to be sure that participants are comparable, so that the total effect of the intervention on the outcome variable can be confidently estimated (Steyer, Fiege, & Rose, 2010). A simultaneous test of the equivalence of covariate means between groups yielded a non-significant result (χ2=10.094; p<0.05). This result confirms that randomization in this study was comparable to a perfectly randomized experiment, meaning that average treatment effects (after adjusting for the covariates) will remain close to the unconditional mean differences (Steyer & Partchev, 2008). Similarly, a simultaneous test of whether all adjusted means were equal to the corresponding raw means also yielded non-significant results for all five analyses (see second row of Table 2). These results indicate an equivalence between the adjusted and corresponding raw means scores, indicating that an analysis without covariates is sufficient to make inferences about the effect of inducement to fake. However, we still included these covariates in additional analyses as this may increase the power of statistical tests, or shed light on possible interactions between covariates and the treatment variable (Steyer & Partchev, 2008).
Simultaneous tests using chi-squared for all faking groups and all dependent variables.
| Test hypothesis | E | A | C | Es | O |
|---|---|---|---|---|---|
| Test of equivalence of adjusted means to raw means | 4.165 (2)a | 2.397 (2) | 4.047 (2) | 0.125 (2) | 0.006 (2) |
| No average treatment effect (E(g1)=0) | 68.803 (1)*** | 69.174 (1)*** | 91.365 (1)*** | 55.644 (1)*** | 12.526 (1)*** |
| No covariate effect in control group (g0=constant) | 43.241 (7)*** | 30.879 (7)*** | 10.139 (7) | 7.957 (7) | 8.362 (7) |
| No treatment×covariate interaction (g1=constant) | 16.016 (7)** | 11.661 (7) | 13.256 (7) | 3.639 (7) | 31.912 (7)*** |
| No treatment effects (g1=0) | 97.291 (8)*** | 95.825 (8)*** | 110.244 (8)*** | 61.701 (8)*** | 46.587 (8)*** |
E, extraversion; A, agreeableness; C, conscientiousness; Es, emotional stability; O, openness.
*p<0.05; **p<0.01; ***p<0.001.
Table 2 also presents simultaneous tests for groups and dependent variables. The null hypothesis test – that there will be no average treatment effect and no treatment effects – was rejected for all five-factor measures. For example, the average effect of inducement to fake was significant for extraversion (χ2=68.803; p<0.001), which describes the effect of inducement to fake in the participants (Steyer et al., 2011). The magnitude effect of inducement to fake was significant (χ2=117.059; p<0.001), in term that the effect is far from zero effect as labeled by g1=0. EffectLite also indicated that the intercept remained constant (g0=constant), indicating there was no covariate effect in either the control group or the constancy slope (g1=constant), indicating the presence of treatment×covariate interaction.
Regarding both statistics, significant covariate effects existed for the control group for both extraversion (χ2=43.241; p<0.001) and openness (χ2=30.879; p<0.001), indicating that an individual's performance on the second test administration would, under normal conditions (i.e., no instructions to fake) depend on his or her previous performances (e.g., social desirability score). This information is important in making causal inferences, because it explains that this effect – subsequent performances being affected by prior performances – might also occur in the faking group. Thus, participants’ scores on subsequent measures were not only affected by inducement to fake, but also by their prior performance. We also found significant interactions between treatment group and covariates in extraversion (χ2=16.016; p<0.05) and openness (χ2=31.912; p<0.001); these findings indicate that individuals with particular characteristics, as specified by their scores on the covariate variables, fake their response to a greater degree than others.
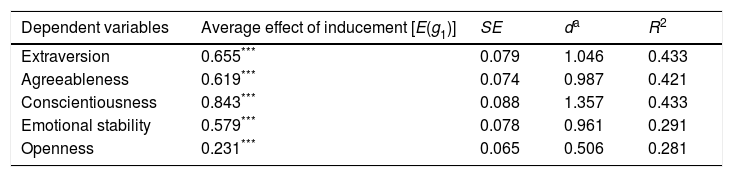
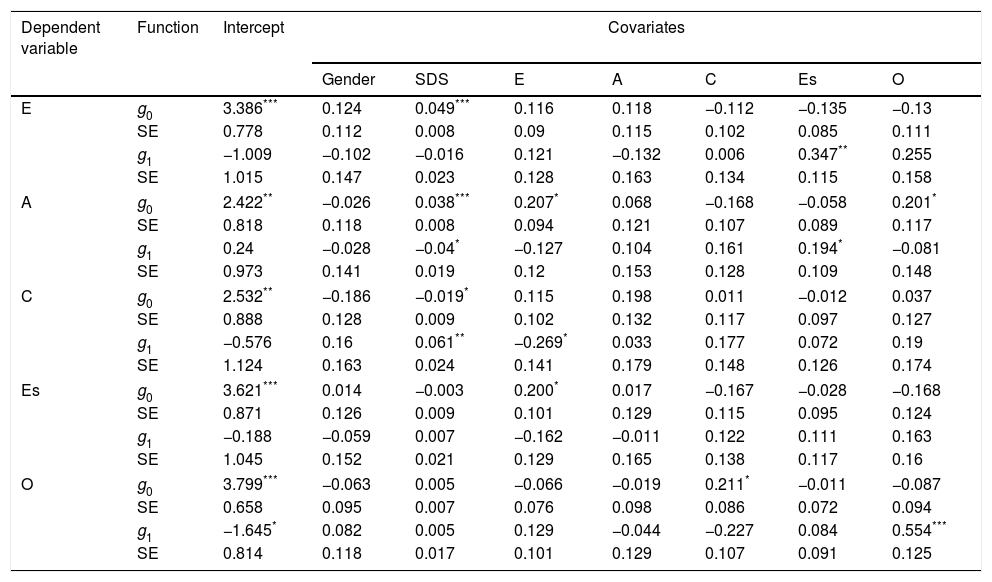
Average and conditional effect analysisThis section present the results of analyses related to significance testing of the estimated coefficients. Applying g-ANCOVA using EffectLite yielded a significant average effect of inducement to fake for all five-factor personality measures (Table 3). The coefficient values of the average effect ranged from .231 to .843, indicating that inducement to fake successfully motivated participants to fake their responses. The two highest effects were found for conscientiousness (estimated effect=.843; p<0.001; d=1.357) and extraversion (estimated effect=.655; p<0.001; d=1.046). Table 4 presents the effect of inducement to fake, taking into account gender, social desirability, and five-factor personality measure scores as covariates. The significant effects of the covariates on faking behavior were found in several measures. For example, social desirability (estimated effect=−0.04; p<0.05) and emotional stability (estimated effect=0.194; p<0.001), both significantly affected individual faking on the agreeableness. Significant effects of covariates on faking were also found for extraversion (covariated by emotional stability), conscientiousness (covariated by social desirability and extraversion), and openness (covariated by openness in pre-test).
Effect of inducement to fake on treatment group estimated by a generalized analysis of covariance using EffectLite.
| Dependent variables | Average effect of inducement [E(g1)] | SE | da | R2 |
|---|---|---|---|---|
| Extraversion | 0.655*** | 0.079 | 1.046 | 0.433 |
| Agreeableness | 0.619*** | 0.074 | 0.987 | 0.421 |
| Conscientiousness | 0.843*** | 0.088 | 1.357 | 0.433 |
| Emotional stability | 0.579*** | 0.078 | 0.961 | 0.291 |
| Openness | 0.231*** | 0.065 | 0.506 | 0.281 |
SE, standard error; [E(g1)], average effect.
The intercept function (g0) and effect function (g1) of inducement to fake on the five factors of personality.
| Dependent variable | Function | Intercept | Covariates | ||||||
|---|---|---|---|---|---|---|---|---|---|
| Gender | SDS | E | A | C | Es | O | |||
| E | g0 | 3.386*** | 0.124 | 0.049*** | 0.116 | 0.118 | −0.112 | −0.135 | −0.13 |
| SE | 0.778 | 0.112 | 0.008 | 0.09 | 0.115 | 0.102 | 0.085 | 0.111 | |
| g1 | −1.009 | −0.102 | −0.016 | 0.121 | −0.132 | 0.006 | 0.347** | 0.255 | |
| SE | 1.015 | 0.147 | 0.023 | 0.128 | 0.163 | 0.134 | 0.115 | 0.158 | |
| A | g0 | 2.422** | −0.026 | 0.038*** | 0.207* | 0.068 | −0.168 | −0.058 | 0.201* |
| SE | 0.818 | 0.118 | 0.008 | 0.094 | 0.121 | 0.107 | 0.089 | 0.117 | |
| g1 | 0.24 | −0.028 | −0.04* | −0.127 | 0.104 | 0.161 | 0.194* | −0.081 | |
| SE | 0.973 | 0.141 | 0.019 | 0.12 | 0.153 | 0.128 | 0.109 | 0.148 | |
| C | g0 | 2.532** | −0.186 | −0.019* | 0.115 | 0.198 | 0.011 | −0.012 | 0.037 |
| SE | 0.888 | 0.128 | 0.009 | 0.102 | 0.132 | 0.117 | 0.097 | 0.127 | |
| g1 | −0.576 | 0.16 | 0.061** | −0.269* | 0.033 | 0.177 | 0.072 | 0.19 | |
| SE | 1.124 | 0.163 | 0.024 | 0.141 | 0.179 | 0.148 | 0.126 | 0.174 | |
| Es | g0 | 3.621*** | 0.014 | −0.003 | 0.200* | 0.017 | −0.167 | −0.028 | −0.168 |
| SE | 0.871 | 0.126 | 0.009 | 0.101 | 0.129 | 0.115 | 0.095 | 0.124 | |
| g1 | −0.188 | −0.059 | 0.007 | −0.162 | −0.011 | 0.122 | 0.111 | 0.163 | |
| SE | 1.045 | 0.152 | 0.021 | 0.129 | 0.165 | 0.138 | 0.117 | 0.16 | |
| O | g0 | 3.799*** | −0.063 | 0.005 | −0.066 | −0.019 | 0.211* | −0.011 | −0.087 |
| SE | 0.658 | 0.095 | 0.007 | 0.076 | 0.098 | 0.086 | 0.072 | 0.094 | |
| g1 | −1.645* | 0.082 | 0.005 | 0.129 | −0.044 | −0.227 | 0.084 | 0.554*** | |
| SE | 0.814 | 0.118 | 0.017 | 0.101 | 0.129 | 0.107 | 0.091 | 0.125 | |
SDS, social desirability; E, extraversion; A, agreeableness; C, conscientiousness; Es, emotional stability; O, openness.
Concerns regarding the effect of social desirability on faking are still strong in research on faking (Anguiano-Carrasco, Vigil-Colet, & Ferrando, 2013). We therefore compared the results from analyzing the data using a different method. The first procedure employed g-ANCOVA, while the second used traditional ANCOVA, which assumes no interaction between pre-test and group; this latter analysis technique is commonly used in experimentally induced faking studies. We only analyzed faking with regard to extraversion, emotional stability, and openness, since our results had shown that social desirability did not affect faking on those measures. This analysis yielded different results, similar to our previous result, g-ANCOVA consistently found a no significant effect of social desirability on faking on extraversion, emotional stability, and openness, while ANCOVA found a non-significant effect of social desirability only on emotional stability. However, the purpose of this comparison was only to demonstrate that the use of different analytical techniques can produce different findings; this needs to be explored further in later studies.
DiscussionThe aim of this study was to demonstrate the use of analysis techniques that can accommodate individual differences in experimentally induced faking studies. In this design, the term treatment refers to the use of modified instructions to stimulate participants to fake their responses. We used g-ANCOVA can handle interaction terms to estimate the effect of inducement to fake as an alternative to the traditional ANCOVA. We examined two primary coefficients that describe the effect of inducement to fake: average effect and conditional effect. EffectLite supported our goals, since this program can estimate the average effect of treatment on the total sample, as well as the conditional treatment effects given specific treatment conditions.
In the initial analysis, we found that the means of all variables that were treated as covariates were equal between participant groups. This means that the randomization for this study fulfilled one of the requirements for perfectly randomized experiments. Another analysis (testing for equivalence between adjusted means and the corresponding raw means) was conducted for all five-factor measures separately have supported this finding. This finding indicates that an analysis without covariates is sufficient to make inferences regarding the effect of inducement to fake. Theoretically, in this situation, the average treatment effects, after adjusting for the covariates, will be close to the unconditional mean differences. Both tests (equivalence of covariates between faking and honest groups and equivalence between adjusted means and the corresponding raw means) are the first screening tests to provide important information about the appropriate use of the covariates involved in the analysis. However, the covariates were still included in subsequent analyses. Further, more detailed analyses indicated that several covariates significantly affected both intercept (g0) and effect function (g1). For example, for extraversion, social desirability increased the intercept function, while emotional stability increased the effect function. These results indicate that the inclusion of a covariate in the analysis of inducement to fake can produce interesting findings even the experiment conducts random assignment.
Study findings supported the expectations regarding the effectiveness of inducement to fake, as mean scores for the faking group were higher than means scores for the honest group for all five personality measures. These results indicate that the effort to induce participants to fake their responses was quite successful. Since analyses incorporated several covariates, the average effect in this context refers to averages of the conditional mean differences. Hence, this effect differs with regard to the effect of inducement to fake reported by research that did not include an analysis of a covariate or covariates; compared with the results of previous studies, the effect sizes reported in the current study are higher. For example, the magnitude of the effect sizes using the set of covariates in the present study was larger than the effect sizes for Viswesvaran and Ones’ (1999) study, which yielded effect sizes ranging from over .66 (agreeableness) to .96 (conscientiousness); in contrast, our analyses yielded effect sizes ranging from .506 (openness) to 1.357 (conscientiousness).
One possible cause of these differences is whether the covariate or covariates were included in the analysis. We found that, for measures that yielded a significant effect of a covariate on faking behavior, excluding that covariate in the analysis yielded a decreased effect size. For example, for extraversion, when this covariate was included in analysis, the effect size was 1.046; when this covariate was excluded from the analysis, the effect size was reduced to 0.921. Similar results were also found for agreeableness and emotional stability; in contrast, the effect size was stable for conscientiousness and openness. We assume that these findings are due to the capability of g-ANCOVA to include variation in faking, thus making the pooled standard deviation less contaminated by faking variance. Hence, although our analysis found that adjusted means were equal to raw means for all five personality measures, employing the covariates in the analysis is still suggested. Using covariates also allows researchers to examine possible interactions between covariates and the treatment, and employing covariates can increase the effect size, as demonstrated in this study. Zickar and Robie (1999) support this suggestion, as they found that the effect size of faking is always larger when the pooled standard deviation, which has less contamination, is used.
Result of analysis found interactions between covariates and participant group for extraversion and openness. This finding indicates that mean differences in post-test scores between the groups were different according to different values of the covariates; i.e., the relationship between the covariate and the post-test score differs between groups. The interaction term indicates heterogeneous slopes; thus, the difference between groups will depend on the value of the covariate (Engqvist, 2005). For example, different levels of emotional stability are associated with different levels of faking behavior on the extraversion measure. Individuals with higher emotional stability tended to fake on the extraversion measure more than individuals with lower emotional stability. This finding supports the interactional perspective on faking, which explains faking as a product of trait–situation interactions (Snell & Fluckinger, 2006). This perspective suggests that there are situational and dispositional factors that might influence individuals’ ability or intention to fake. As some individuals increase their scores more than others, an interaction between the propensity to fake and the set of instructions is likely to occur. The presence of interaction makes the interpretation of the estimates problematic. Interaction in faking studies is usually not assessed, but merely assumed as non-existent, because the effect size is assumed to be the same for all participants (Viswesvaran & Ones, 1999), despite the fact that they have different characteristics. The present study showed one way to address individual differences in faking by including covariates and accommodating interaction terms when examining faking on personality measure; using the g-ANCOVA as an alternative to the traditional ANCOVA.
Not all covariates included in the present study had significant influence on faking for all personality measures, and significant effect of covariates were found only for particular measures. Nevertheless, this study opens the opportunity for further research involving covariates. Previous research identified several variables that have potential for use as relevant covariates. For example, attitudes, personality traits, and demographic variables were reported as being correlated with faking behavior (Clark & Biderman, 2006; Goffin & Boyd, 2009). Individual ability to fake is related to cognitive ability, emotional intelligence, integrity, and social desirability. Individual motivation to fake might be influenced by demographics and perceptual factors (Snell, Sydell, & Lueke, 1999). Another study reported that an individual's intention to fake his or her responses is related to his or her beliefs toward faking. These beliefs are influenced by several variables, including values, morals, religion, and personality traits; these beliefs toward faking would influence the subsequent prevalence of faking behavior (McFarland & Ryan, 2000). We suggest that involving a covariate or covariates in analysis will isolate the variance due to individual differences in faking. This idea is supported by several models of faking behavior, for example, the trait activation model (Tett & Simonet, 2011), the faking decision-tree model (Goffin & Boyd, 2009), and the integrated model of applicant faking behavior (McFarland & Ryan, 2006). These models have also proposed that faking is affected by dispositional factors (e.g., traits, motivation, and ability). Since these factors indicate individual differences that might affect faking variance, any research examining the fakability of a measure should take these factors into account and consider them as covariates. Taking individual traits or prior experience into account is crucial in faking research. Schwab (Schwab, 1971) argues that faking research is not generalizable if it assumes that participants have no previous experience with the personality measures being used.
The present study demonstrated the use of EffectLite in research on faking. Although not all features of the analysis of EffectLite were reported in this paper, one of the most interesting features was the software's ability to predict the average treatment effect for the control group. First, EffectLite can be used to predict the outcome if everyone in the treatment group received the intervention versus if no one in that group received the intervention. Second, the software was used to predict the outcome if participants in the treatment group received the treatment, compared to if no participants this group received the treatment (Kirchmann et al., 2011). For example, the present study found that participants in the control group would fake more than the manipulated group on the measure of conscientiousness if the control group was also induced to fake. This might be because participants in the control group possessed higher levels of characteristics that support faking on a measure of conscientiousness than participants in the manipulated group. However, this information could only be obtained if researchers were to involve a covariate or covariates in the analysis. Research in faking usually compares faking behavior between job applicants vs. job incumbents (Stokes, Hogan, & Snell, 1993) or between patients and non-patients (Bagby, Gillis, Toner, & Goldberg, 1991). Job applicants were found to obtain higher scores than job incumbents, meaning that job applicants are more likely to fake their responses. However, it is possible that the analysis would find an opposite result if the participants in the job applicants’ group were instead job incumbents. If this were to happen, it would indicate that the higher faking scores for applicants rather than incumbents were due to participants’ traits, as opposed to being part of the faking group. EffectLite can address this issue by estimating the average effects, given a treatment condition and the conditional expectations. Other interesting features of EffectLite that can be utilized in research on faking are its capability to handle latent variable modeling, which is rarely applied in this area (Biderman, 2006).
