


This study assessed the generalizability of Bowman's paradox across 12,235 firms from 28 countries. Cross-sectional and longitudinal relationships between risk and return provided broad support for the presence of Bowman's paradox in diverse country settings (Asia, Europe, and South Africa), except India, Japan, and South Korea, where the relationship was positive. This replication confirms that Bowman's paradox generally holds across diverse institutional and cultural settings and supports prior studies on Bowman's paradox based on US samples.
Risk is generally expected to be positively associated with returns. However, Bowman (1980) observed an interesting phenomenon in a sample of 387 firms from 11 industries (from 1955 to 1973) and in a sample of 1572 firms from 85 industries (from 1968 to 1976). He found a negative correlation between accounting risk and return at the industry level. This phenomenon has since been referred to as Bowman's risk paradox, or the negative correlation between accounting based performance and the variance of accounting-based performance.
Bowman's paradox is considered a phenomenon and not a theoretical framework because it is counterintuitive to the generally accepted logic in financial economics – higher risk must accompany higher returns. Since Bowman's initial findings in 1980, strategy literature has addressed Bowman's paradox in a series of studies (Andersen & Bettis, 2015; Andersen, Denrell, & Bettis, 2007; Núñez Nickel & Rodriguez, 2002). Broadly, explanations for Bowman's paradox have focused on prospect theory or behavioral theory of the firm, statistical artifacts, and good management conduct (Andersen & Bettis, 2014, page 63). Drawing on prospect theory (Kahneman & Tversky, 1979), researchers have argued that low performing firms had a negative risk–return relationship and high performing firms had a positive risk–return relationship (Fiegenbaum & Thomas, 1988). Others have found a curvilinear relation between risk and return (Chang & Thomas, 1989). Relatedly, drawing on behavioral theory of the firm (Bromiley, 1991a), researchers have found that, when performance is below (above) aspiration levels, managers take more (less) risks, resulting in a negative (positive) cross-sectional relationship between risk and return (Bromiley, 1991b; Miller & Leiblein, 1996; Palmer & Wiseman, 1999). Others have proposed that the negative relationship is more likely among firms with high levels of unrelated diversification (Bettis & Hall, 1982; Chang & Thomas, 1989; Kim, Hwang, & Burgers, 1993), among firms with high market power who have lower variation in sales (Cool, Dierickx, and Jemison, 1989; Woo, 1987), or among firms with high risk in the previous period (Miller & Leiblein, 1996). Furthermore, as firms get closer to bankruptcy, the relationship between risk and return becomes increasingly negative (Miller & Bromiley, 1990).
Interest in Bowman's paradox has continued in recent years. Although studies have traditionally used ROA as a measure of return, For instance, Brick, Palmon, and Venezia (2015) conclude that “positive relationship between mean ROE and its standard deviation is far more likely than a negative one” (page 99). In another study, Brick, Palmon, and Venezia (2012) conclude that the risk–return relationship is positive or non-significant after adjustments to beginning of year, instead of end of year, for equity and reported net income of accruals. To resolve Bowman's paradox using computational simulations, Andersen and Bettis, 2014 find that “both imperfect learning and a mindless random walk can lead to the inverse longitudinal risk–return relationships observed empirically” (page 1135), and others support for a U-shaped relationship (Pan & Zhou, 2015). Recent theoretical focus include behavioral theory of the firm (Xiaodong, Fan, & Zhang, 2014), managerial myopia (Holder, Petkevich, & Moore, 2016), and adaptive systems (Song, An, Yang, & Huang, 2012). Bowman's paradox was recently used as a backdrop to understand variations in risk preferences among female executives (Perryman, Fernando, & Tripathy, 2016).
In addition to theoretical explanations, others have pointed to potential statistical issues such as the use of accounting-based performance data (Marsh & Swanson, 1984), lack of lags (Miller & Leiblein, 1996), outliers and spurious correlation, and non-normal distribution of performance at the industry level (Henkel, 2009). A review of studies on Bowman's risk paradox also reveals that virtually all studies have drawn on US based samples, using Compustat, Fortune 500 firms, Value line, Census of Manufacturing, Arbitron, and PIMS [except for Jegers (1991) who drew on a sample of 3250 Belgian firms] (Andersen & Bettis, 2015; Núñez Nickel & Rodriguez, 2002).
The above discussion suggests that despite focus on mostly US based samples and correcting for statistical artifacts, Bowman's paradox continues to be supported in studies over the years. However, to extend the validity of this phenomenon, whether the relationship can be replicated in a cross-country context is essential to further build this framework.
The strategic management literature increasingly seeks to improve generalizability of management phenomena and scholars have called for a greater need for replication in different contexts (Harzing & Harzing, 2016; Hubbard, Vetter, & Little, 1998). Testing Bowman's risk paradox in a cross-country context is theoretically important and practically relevant as risk preferences, the mainstay of prospect theory and behavioral theory of the firm, are known to be culture specific or influenced by institutional factors (Rieger, Wang, & Hens, 2014). As risk–return relationship is influenced by cross-country differences, Bowman's risk paradox could vary across countries. Indeed, if Bowman's paradox were inconsistent across different countries, future research could further explore boundary conditions based on variations in cultural and institutional factors. In contrast, if the relationship were less variable across countries, firm- or industry-specific effects would be stronger in driving the relationship, and culture and institutional factors would be less influential. The proposed framework could help practitioners further understand the drivers of risk–return relationship.
This study assesses the generalizability of Bowman's risk paradox through a replication across 28 countries. It attempts to increase generalizability of the past findings by: (a) replicating past findings for US firms using a different time period (1998–2012); (b) generalizing Bowman's paradox by drawing on a sample 12,235 firms from 28 countries (excluding the US) from 1998 to 2012; (c) assessing robustness of findings by using proposed corrections of statistical artifacts by using lags, and splitting firms above and below median industry performance; and (d) correcting for potential spuriousness due to right skewness in performance of firms in the industry as recommended by Henkel (2009). Overall, our study contributes to the literature at the intersection between strategy and international business management by replicating the generalizability of Bowman's paradox in different countries around the world.
Background on Bowman's risk paradoxInvestors require higher returns for undertaking higher levels of risk. Unlike investors who can generally mitigate financial risk through diversification, firm managers must manage multiple forms of business risks that cannot be diversified easily. Considering a broader set of risks, Miller and Bromiley (1990) propose three types of risks – income stream risk, stock returns risk, and strategic risk. Although the three forms of risks are interrelated, managers are concerned about long-term strategic risk and variations in income over time. As investors can diversify stock return risk, stock return risk may not fully capture the total risk faced by the firm. Due to variegated notions of both income and strategic risks, literature on Bowman's paradox has proposed a variety of accounting-based measures of performance and alternate specifications of variation in accounting-based measures of performance. Studies have found broad support for a negative relationship between cross-sectional accounting performance and variance of performance (Andersen & Bettis, 2015; Núñez Nickel & Rodriguez, 2002).
To provide a theoretical lens to explain the negative association between risk and return, scholars have drawn on prospect theory (Fiegenbaum & Thomas, 1988; Kahneman & Tversky, 1979) and behavioral theory of the firm (Bromiley, 1991b). Through the lens of behavioral theory of the firm, managers undertake more risk when performance is below aspiration, and they take low risk when performance is above aspirations. Due to contemporaneous association between risk-taking and low performance, contemporaneous relationship could be negative; as lower performance and higher risk are observed in cross-sectional accounting data, or lagging effects of risk and performance would continue in the short-term in longitudinal accounting data. Through the lens of prospect theory (Kahneman & Tversky, 1979), studies have argued that managers in low performing firms face negatively framed prospects and are thus more likely to undertake high risk. In contrast, managers in high performing firms face positively framed prospects and take low risk, resulting in negative correlation between high performance and low risk. Thus, prospect theory and behavioral theory of the firm provide possible explanations for the negative relationship between risk and return. Comeig, Holt, and Jaramillo-Gutiérrez (2015) further elucidate the joint mechanisms of prospect theory and behavioral theory of the firm in the context of Bowman's risk paradox by identifying reference points (of relative performance) and probability weights (of payoffs from risk). That is, when performance is below aspirations, decisions are framed negatively and managers undertake more risk. In evaluating such risky actions, managers underweigh downside of lower payoffs from increased risk. Similarly, when performance is above aspirations, managers undertake lower risk and assign low probability to higher payoff and thereby avoid risky actions.1
In addition, studies have shown that the negative relationship is also driven by adaptation capabilities, nature of diversification, distance from bankruptcy, and market power. Firms with high adaptation capabilities realize higher returns despite taking lower risks (Andersen et al., 2007). Adaptation capabilities allow firms to meet challenges of the changing environment, thus lowering variance in performance. Firms with high levels of unrelated diversification have lower variation in returns, and thus have negative correlation between variance in performance and mean performance (Chang & Thomas, 1989). As higher market power is negatively related to variance in performance, the negative risk–return relationship is likely to be higher in such firms. Finally, firms closer to bankruptcy could also have a negative risk–return relationship.
In addition to the theoretical explanations, several studies attribute the negative relationship to statistical artifacts. First, prior studies have often measured risk contemporaneously with returns. As mean return and variance in return are derived from the same underlying distribution of returns, the negative correlation may not be based on a theoretically meaningful relationship but on statistical artifacts resulting from model specification. However, Bowman's risk paradox is robust under lagged models (Andersen & Bettis, 2015) or under alternate measures of risk (based on survey questionnaire or managerial risk aversion coefficient obtained from utility function) or prospective and non-accounting measure of ex-ante level of risk – variability in stock analyst forecasts (for a review refer to Núñez Nickel & Rodriguez, 2002).
Second, others indicate that managers take multifaceted and multi-contextual view of risk. Managers focus more on downside risk than on upside risk and therefore their assessment of risk must be distinct from the theoretically espoused understanding of risk. However, studies using alternate measures of risk have found support for Bowman's paradox (Núñez Nickel & Rodriguez, 2002).
Third, and more importantly, critics have highlighted the endogenous relationship between return and variance in returns, non-normality in distribution of returns (Marsh & Swanson, 1984), and choice of aggregation periods (Ruefli & Wiggins, 1994; Ruefli, 1990, 1991). While studies have relied on shorter time periods to lower effects of non-stationarity in returns, estimates from such specifications are sensitive to outliers.
Finally, focusing on different time periods to understand the risk–return relationship could also bias the findings (Bromiley, 1991a). Furthermore, due to different strategic and competitive goals over the life-cycle of a firm, and changing industry characteristics over time could influence risk–return relationship. Therefore, relying on longitudinal samples or lowering survivor bias could help provide more robust inferences. As an example of where longitudinal data with industry controls could offer different inferences, Henkel (2009) shows that the negative correlation could be an artifact of right skewness in distribution of return among firms in the industry, and proposed a methodology to correct for such spuriousness.
Overall, past research has proposed different theoretical rationales for explaining the negative correlations, or has suggested that negative correlation could be an artifact of sampling criteria or statistical artifacts in measurement and analyses.
The need for replicationWe undertake the replication with multiple objectives in mind. First, most studies on Bowman's risk paradox have drawn on US firms. We do not know whether Bowman's paradox is generalizable across different countries. It is possible that different country – and country×industry-specific unobserved heterogeneity could show a positive, negative, or non-significant association. Therefore, the primary aim of this study is to replicate Bowman's paradox in firms across 28 countries (excluding US firms).
Second, past studies have found different relationships based on different specifications of time periods used to analyze the data. To address this issue, we also conduct a split sample analysis by including different periods for generalizing cross-sectional (1998–2002; 2003–2007; 2008–2012) and lagged relationship (1998–2007; 2007–2012).
A criticism of studies on Bowman's risk paradox is the contemporaneous measurement of risk. Based on Andersen and Bettis (2015), we also test for longitudinal relationship between risk and return. Moreover, as most US based studies of Bowman's paradox have relied on samples of US firms from 1970s to mid-1990s, we also replicate these findings using US firms from a more recent time period – from 1998 to 2012.
Third, to assess generalizability of prospect theory or behavioral theory of the firm explanations, following Andersen et al. (2007), we test for differences in correlation for firms with performance below and above median industry performance.
Fourth, in response to Henkel (2009) call for correction for potential spuriousness in risk–return correlation driven by skewness in performance of firms in the industry, we include correction for spuriousness.
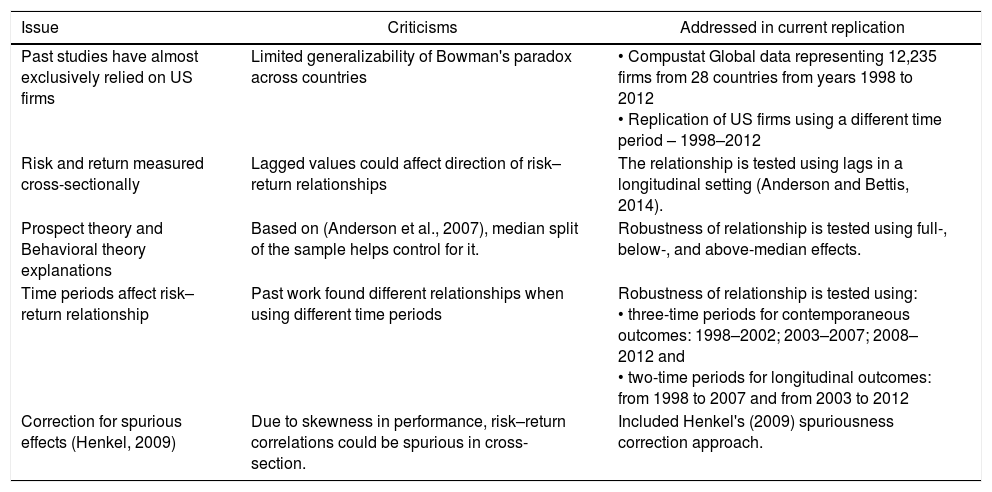
Table 1 provides a summary of theoretical and empirical issues incorporated from past work into this replication study.
Basis of replication.
| Issue | Criticisms | Addressed in current replication |
|---|---|---|
| Past studies have almost exclusively relied on US firms | Limited generalizability of Bowman's paradox across countries | • Compustat Global data representing 12,235 firms from 28 countries from years 1998 to 2012 • Replication of US firms using a different time period – 1998–2012 |
| Risk and return measured cross-sectionally | Lagged values could affect direction of risk–return relationships | The relationship is tested using lags in a longitudinal setting (Anderson and Bettis, 2014). |
| Prospect theory and Behavioral theory explanations | Based on (Anderson et al., 2007), median split of the sample helps control for it. | Robustness of relationship is tested using full-, below-, and above-median effects. |
| Time periods affect risk–return relationship | Past work found different relationships when using different time periods | Robustness of relationship is tested using: • three-time periods for contemporaneous outcomes: 1998–2002; 2003–2007; 2008–2012 and • two-time periods for longitudinal outcomes: from 1998 to 2007 and from 2003 to 2012 |
| Correction for spurious effects (Henkel, 2009) | Due to skewness in performance, risk–return correlations could be spurious in cross-section. | Included Henkel's (2009) spuriousness correction approach. |
To replicate the testing of Bowman risk paradox in non-US sample, we obtained data from Global COMPUSTAT, which provides data items similar to the North American COMPUSTAT. In their review of the literature, Núñez Nickel and Rodriguez (2002) identify ROA and ROE as widely used outcome measures (as reviewed in Table 2 of their article). However, as equity levels are subject to different regulations in different countries and firms use different policies to value equity, we use ROA that is subject to lesser biases on differences in equity valuation practices in cross-country settings. Following previous studies (Andersen et al., 2007; Fiegenbaum & Thomas, 1988; Henkel, 2009; Núñez Nickel & Rodriguez, 2002), we used return on asset (ROA) as the measure for firm performance and to ensure reliability of aggregated correlations we only included industries with more than 25 firms in the sample.
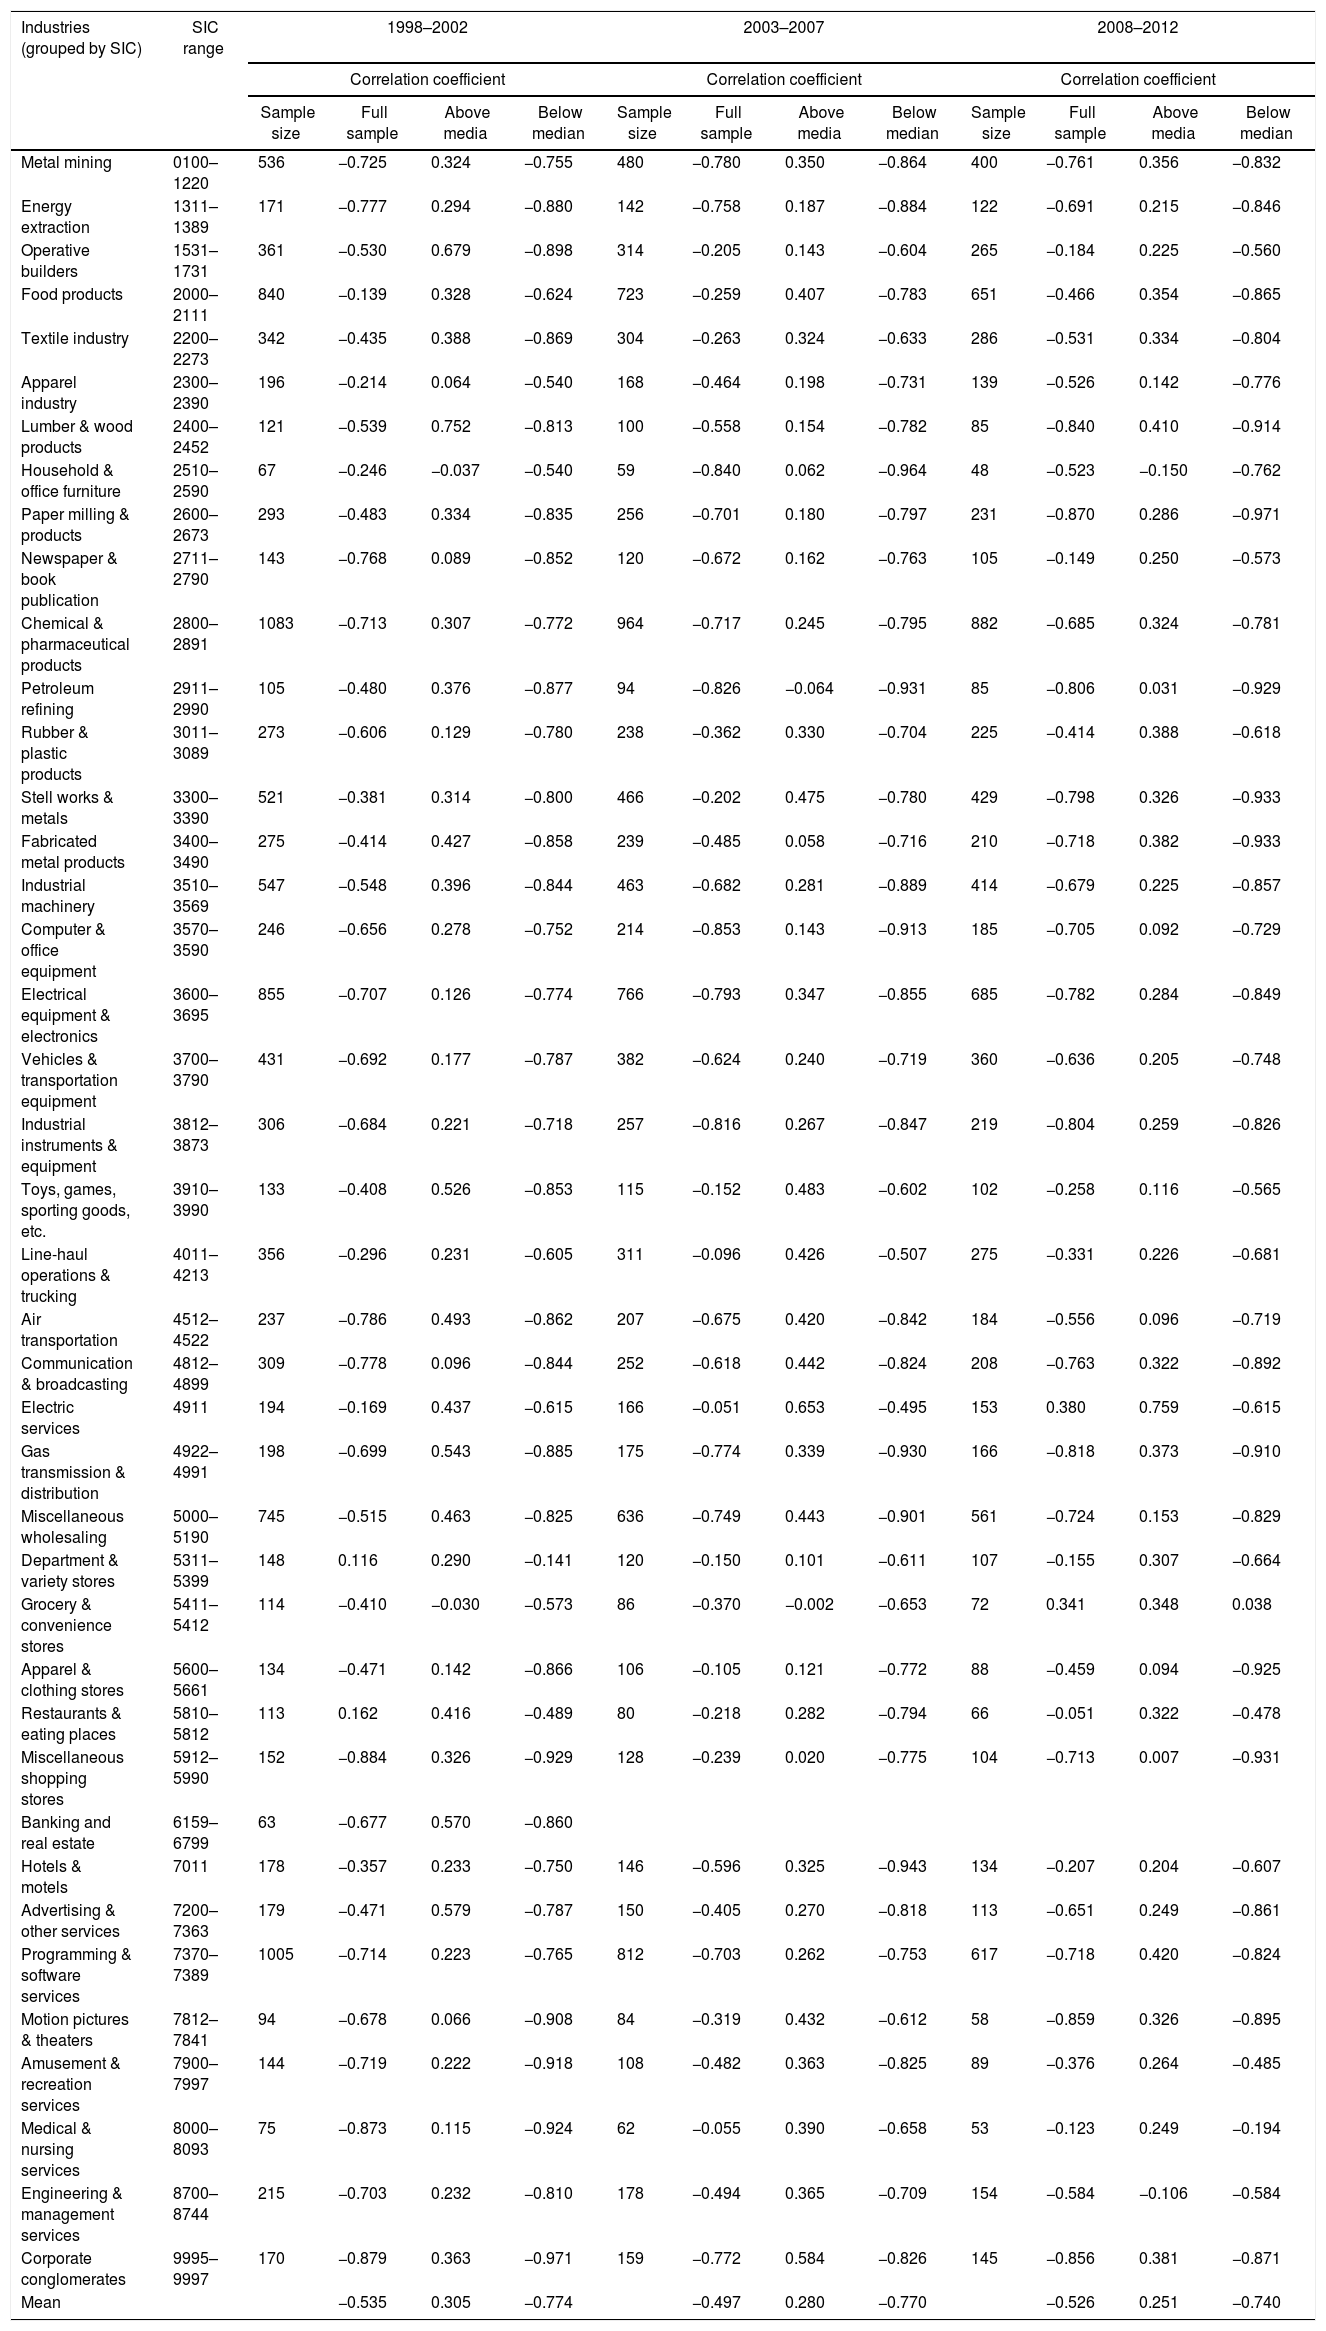
Empirically observed cross-sectional risk–return relationship for non-US sample.
| Industries (grouped by SIC) | SIC range | 1998–2002 | 2003–2007 | 2008–2012 | |||||||||
|---|---|---|---|---|---|---|---|---|---|---|---|---|---|
| Correlation coefficient | Correlation coefficient | Correlation coefficient | |||||||||||
| Sample size | Full sample | Above media | Below median | Sample size | Full sample | Above media | Below median | Sample size | Full sample | Above media | Below median | ||
| Metal mining | 0100–1220 | 536 | −0.725 | 0.324 | −0.755 | 480 | −0.780 | 0.350 | −0.864 | 400 | −0.761 | 0.356 | −0.832 |
| Energy extraction | 1311–1389 | 171 | −0.777 | 0.294 | −0.880 | 142 | −0.758 | 0.187 | −0.884 | 122 | −0.691 | 0.215 | −0.846 |
| Operative builders | 1531–1731 | 361 | −0.530 | 0.679 | −0.898 | 314 | −0.205 | 0.143 | −0.604 | 265 | −0.184 | 0.225 | −0.560 |
| Food products | 2000–2111 | 840 | −0.139 | 0.328 | −0.624 | 723 | −0.259 | 0.407 | −0.783 | 651 | −0.466 | 0.354 | −0.865 |
| Textile industry | 2200–2273 | 342 | −0.435 | 0.388 | −0.869 | 304 | −0.263 | 0.324 | −0.633 | 286 | −0.531 | 0.334 | −0.804 |
| Apparel industry | 2300–2390 | 196 | −0.214 | 0.064 | −0.540 | 168 | −0.464 | 0.198 | −0.731 | 139 | −0.526 | 0.142 | −0.776 |
| Lumber & wood products | 2400–2452 | 121 | −0.539 | 0.752 | −0.813 | 100 | −0.558 | 0.154 | −0.782 | 85 | −0.840 | 0.410 | −0.914 |
| Household & office furniture | 2510–2590 | 67 | −0.246 | −0.037 | −0.540 | 59 | −0.840 | 0.062 | −0.964 | 48 | −0.523 | −0.150 | −0.762 |
| Paper milling & products | 2600–2673 | 293 | −0.483 | 0.334 | −0.835 | 256 | −0.701 | 0.180 | −0.797 | 231 | −0.870 | 0.286 | −0.971 |
| Newspaper & book publication | 2711–2790 | 143 | −0.768 | 0.089 | −0.852 | 120 | −0.672 | 0.162 | −0.763 | 105 | −0.149 | 0.250 | −0.573 |
| Chemical & pharmaceutical products | 2800–2891 | 1083 | −0.713 | 0.307 | −0.772 | 964 | −0.717 | 0.245 | −0.795 | 882 | −0.685 | 0.324 | −0.781 |
| Petroleum refining | 2911–2990 | 105 | −0.480 | 0.376 | −0.877 | 94 | −0.826 | −0.064 | −0.931 | 85 | −0.806 | 0.031 | −0.929 |
| Rubber & plastic products | 3011–3089 | 273 | −0.606 | 0.129 | −0.780 | 238 | −0.362 | 0.330 | −0.704 | 225 | −0.414 | 0.388 | −0.618 |
| Stell works & metals | 3300–3390 | 521 | −0.381 | 0.314 | −0.800 | 466 | −0.202 | 0.475 | −0.780 | 429 | −0.798 | 0.326 | −0.933 |
| Fabricated metal products | 3400–3490 | 275 | −0.414 | 0.427 | −0.858 | 239 | −0.485 | 0.058 | −0.716 | 210 | −0.718 | 0.382 | −0.933 |
| Industrial machinery | 3510–3569 | 547 | −0.548 | 0.396 | −0.844 | 463 | −0.682 | 0.281 | −0.889 | 414 | −0.679 | 0.225 | −0.857 |
| Computer & office equipment | 3570–3590 | 246 | −0.656 | 0.278 | −0.752 | 214 | −0.853 | 0.143 | −0.913 | 185 | −0.705 | 0.092 | −0.729 |
| Electrical equipment & electronics | 3600–3695 | 855 | −0.707 | 0.126 | −0.774 | 766 | −0.793 | 0.347 | −0.855 | 685 | −0.782 | 0.284 | −0.849 |
| Vehicles & transportation equipment | 3700–3790 | 431 | −0.692 | 0.177 | −0.787 | 382 | −0.624 | 0.240 | −0.719 | 360 | −0.636 | 0.205 | −0.748 |
| Industrial instruments & equipment | 3812–3873 | 306 | −0.684 | 0.221 | −0.718 | 257 | −0.816 | 0.267 | −0.847 | 219 | −0.804 | 0.259 | −0.826 |
| Toys, games, sporting goods, etc. | 3910–3990 | 133 | −0.408 | 0.526 | −0.853 | 115 | −0.152 | 0.483 | −0.602 | 102 | −0.258 | 0.116 | −0.565 |
| Line-haul operations & trucking | 4011–4213 | 356 | −0.296 | 0.231 | −0.605 | 311 | −0.096 | 0.426 | −0.507 | 275 | −0.331 | 0.226 | −0.681 |
| Air transportation | 4512–4522 | 237 | −0.786 | 0.493 | −0.862 | 207 | −0.675 | 0.420 | −0.842 | 184 | −0.556 | 0.096 | −0.719 |
| Communication & broadcasting | 4812–4899 | 309 | −0.778 | 0.096 | −0.844 | 252 | −0.618 | 0.442 | −0.824 | 208 | −0.763 | 0.322 | −0.892 |
| Electric services | 4911 | 194 | −0.169 | 0.437 | −0.615 | 166 | −0.051 | 0.653 | −0.495 | 153 | 0.380 | 0.759 | −0.615 |
| Gas transmission & distribution | 4922–4991 | 198 | −0.699 | 0.543 | −0.885 | 175 | −0.774 | 0.339 | −0.930 | 166 | −0.818 | 0.373 | −0.910 |
| Miscellaneous wholesaling | 5000–5190 | 745 | −0.515 | 0.463 | −0.825 | 636 | −0.749 | 0.443 | −0.901 | 561 | −0.724 | 0.153 | −0.829 |
| Department & variety stores | 5311–5399 | 148 | 0.116 | 0.290 | −0.141 | 120 | −0.150 | 0.101 | −0.611 | 107 | −0.155 | 0.307 | −0.664 |
| Grocery & convenience stores | 5411–5412 | 114 | −0.410 | −0.030 | −0.573 | 86 | −0.370 | −0.002 | −0.653 | 72 | 0.341 | 0.348 | 0.038 |
| Apparel & clothing stores | 5600–5661 | 134 | −0.471 | 0.142 | −0.866 | 106 | −0.105 | 0.121 | −0.772 | 88 | −0.459 | 0.094 | −0.925 |
| Restaurants & eating places | 5810–5812 | 113 | 0.162 | 0.416 | −0.489 | 80 | −0.218 | 0.282 | −0.794 | 66 | −0.051 | 0.322 | −0.478 |
| Miscellaneous shopping stores | 5912–5990 | 152 | −0.884 | 0.326 | −0.929 | 128 | −0.239 | 0.020 | −0.775 | 104 | −0.713 | 0.007 | −0.931 |
| Banking and real estate | 6159–6799 | 63 | −0.677 | 0.570 | −0.860 | ||||||||
| Hotels & motels | 7011 | 178 | −0.357 | 0.233 | −0.750 | 146 | −0.596 | 0.325 | −0.943 | 134 | −0.207 | 0.204 | −0.607 |
| Advertising & other services | 7200–7363 | 179 | −0.471 | 0.579 | −0.787 | 150 | −0.405 | 0.270 | −0.818 | 113 | −0.651 | 0.249 | −0.861 |
| Programming & software services | 7370–7389 | 1005 | −0.714 | 0.223 | −0.765 | 812 | −0.703 | 0.262 | −0.753 | 617 | −0.718 | 0.420 | −0.824 |
| Motion pictures & theaters | 7812–7841 | 94 | −0.678 | 0.066 | −0.908 | 84 | −0.319 | 0.432 | −0.612 | 58 | −0.859 | 0.326 | −0.895 |
| Amusement & recreation services | 7900–7997 | 144 | −0.719 | 0.222 | −0.918 | 108 | −0.482 | 0.363 | −0.825 | 89 | −0.376 | 0.264 | −0.485 |
| Medical & nursing services | 8000–8093 | 75 | −0.873 | 0.115 | −0.924 | 62 | −0.055 | 0.390 | −0.658 | 53 | −0.123 | 0.249 | −0.194 |
| Engineering & management services | 8700–8744 | 215 | −0.703 | 0.232 | −0.810 | 178 | −0.494 | 0.365 | −0.709 | 154 | −0.584 | −0.106 | −0.584 |
| Corporate conglomerates | 9995–9997 | 170 | −0.879 | 0.363 | −0.971 | 159 | −0.772 | 0.584 | −0.826 | 145 | −0.856 | 0.381 | −0.871 |
| Mean | −0.535 | 0.305 | −0.774 | −0.497 | 0.280 | −0.770 | −0.526 | 0.251 | −0.740 | ||||
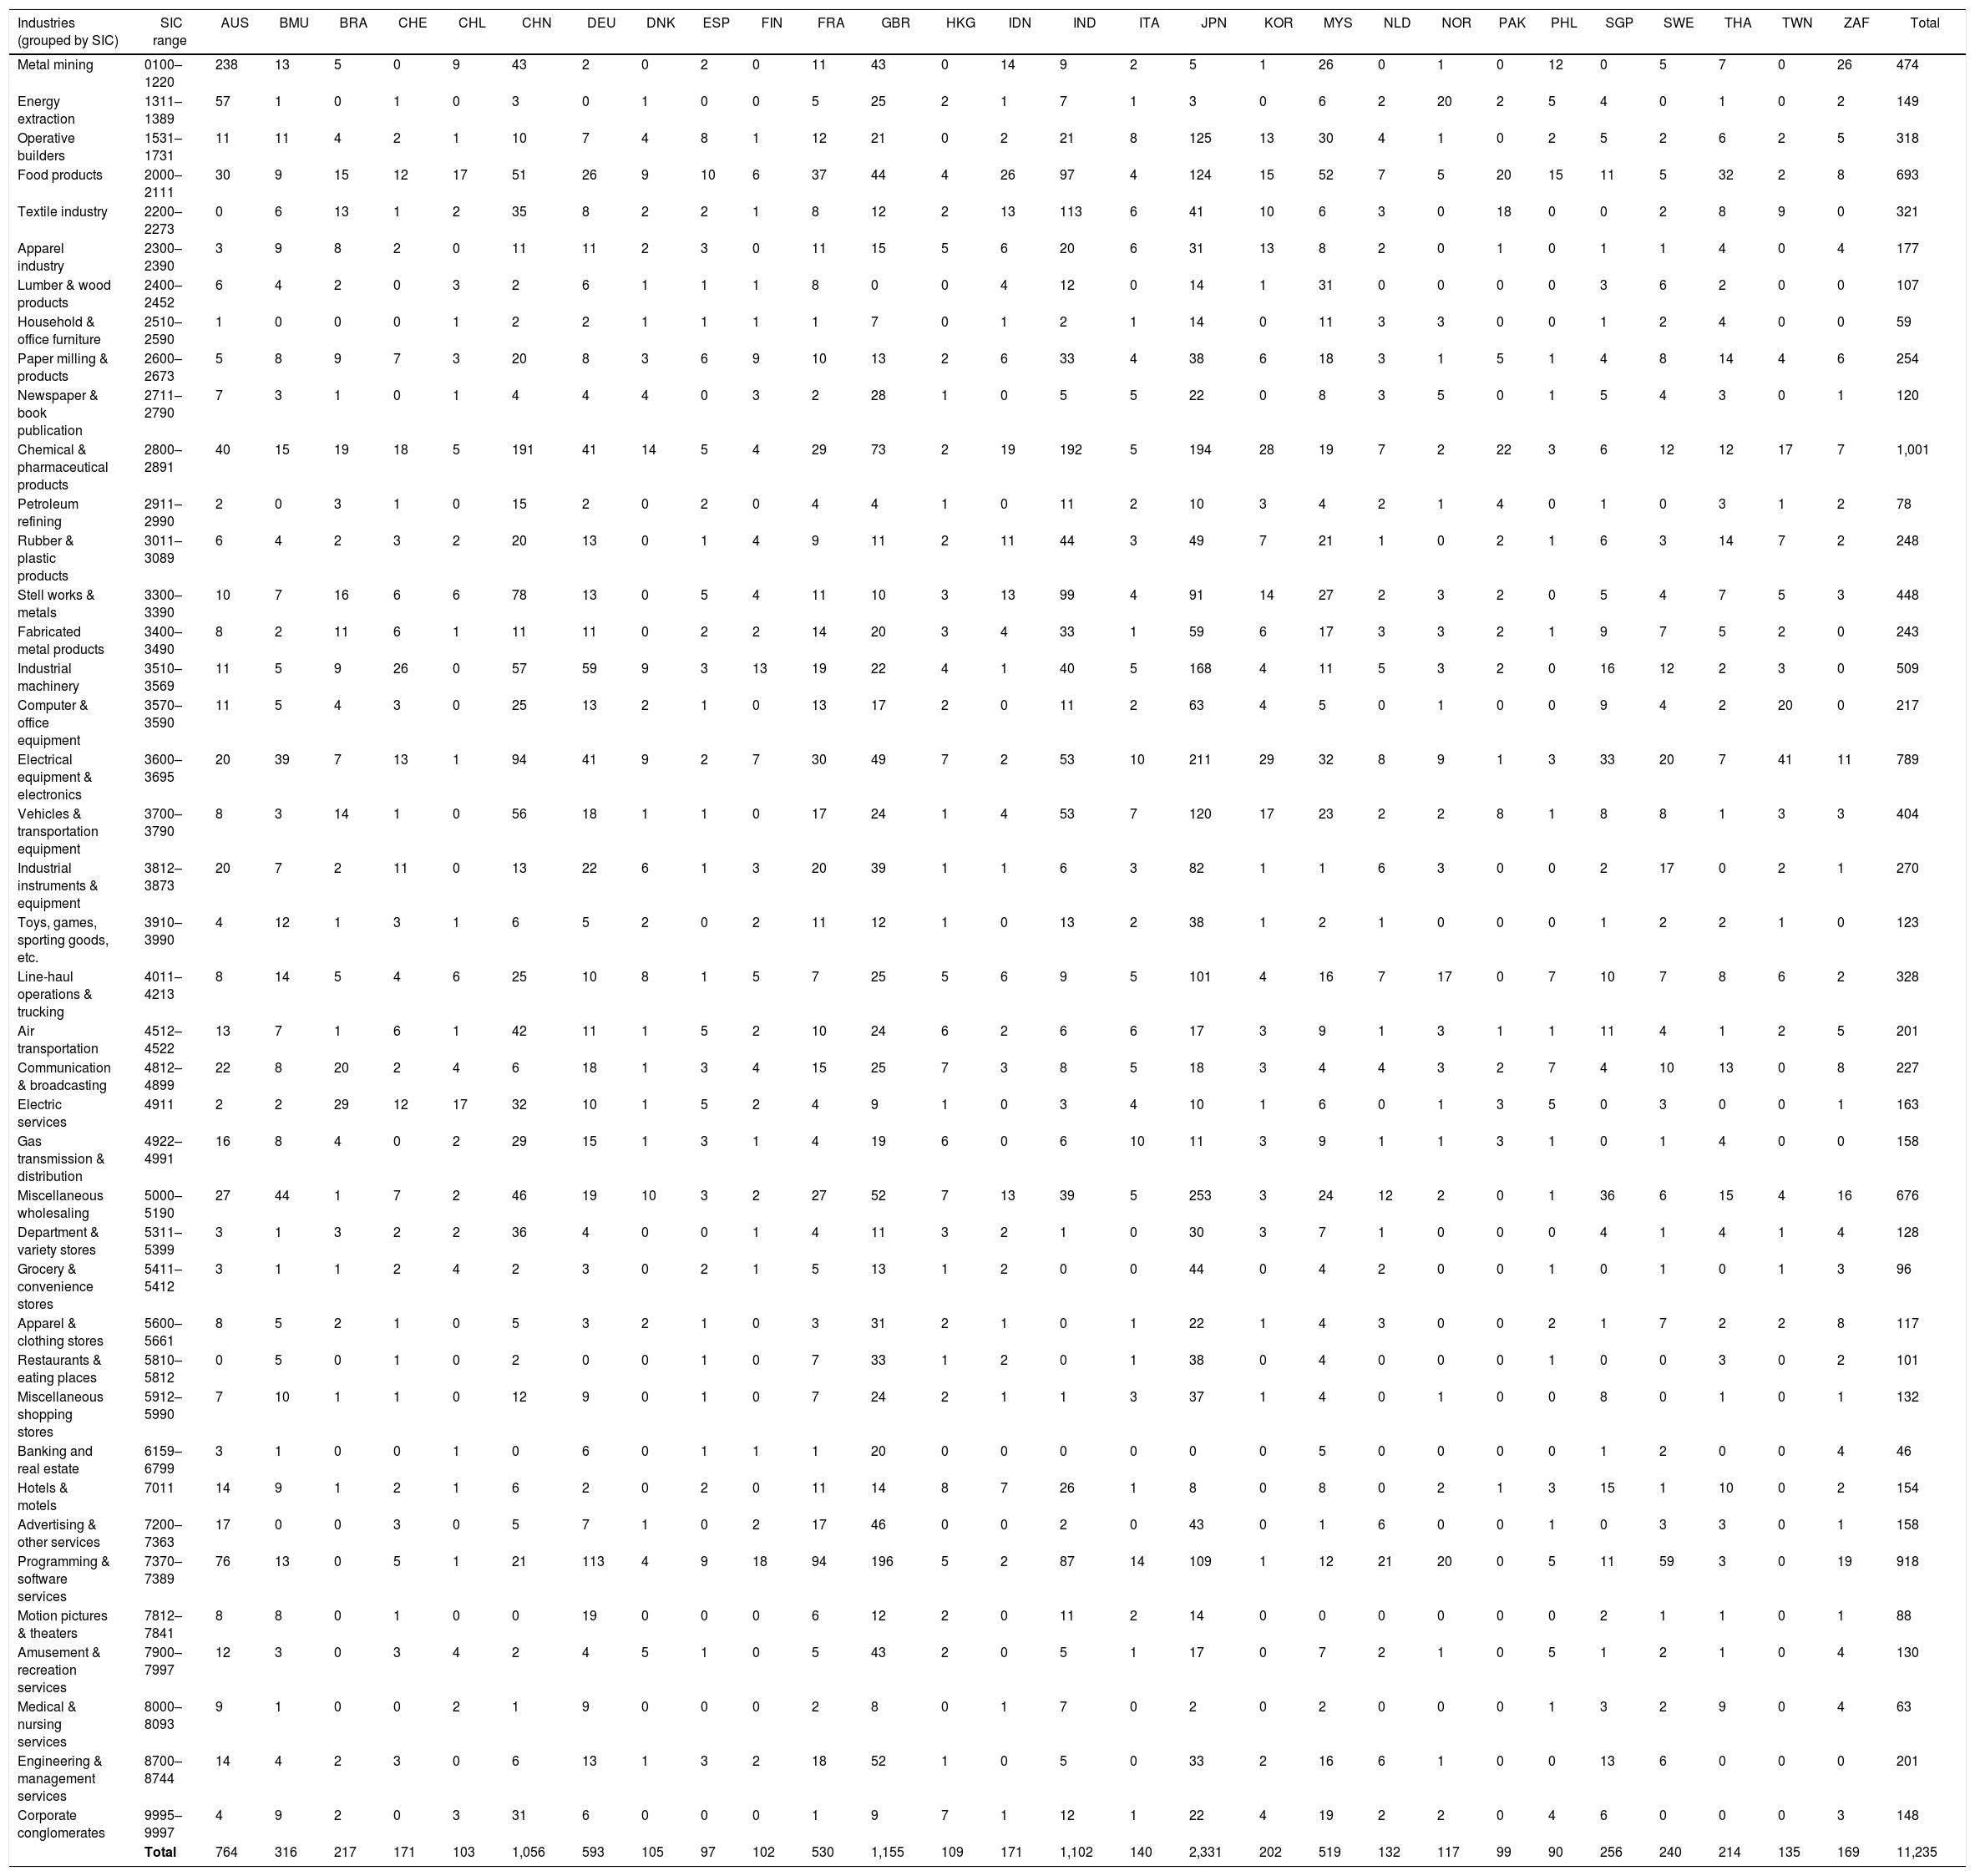
We focused on a 15-year period from 1998 to 2012. This allows us to calculate three concurrent risk–return relationship (consecutive 5-year periods: 1998–2002; 2003–2007; 2008–2012) and two sets of longitudinal risk–return relationship (the first ten year period from 1998 to 2007 and the second ten year period from 2003 to 2012). The final sample from COMPUSTAT Global data consisted of 12,235 firms from 28 countries from years 1998 to 2012. We list country-industry distribution of firms in Table A.1 in Appendix.
AnalysesWe first computed concurrent risk–return correlation using the correlation between ROA and standard deviation of ROA. Table 2 summarizes results for concurrent risk–return relationship for the three time periods.
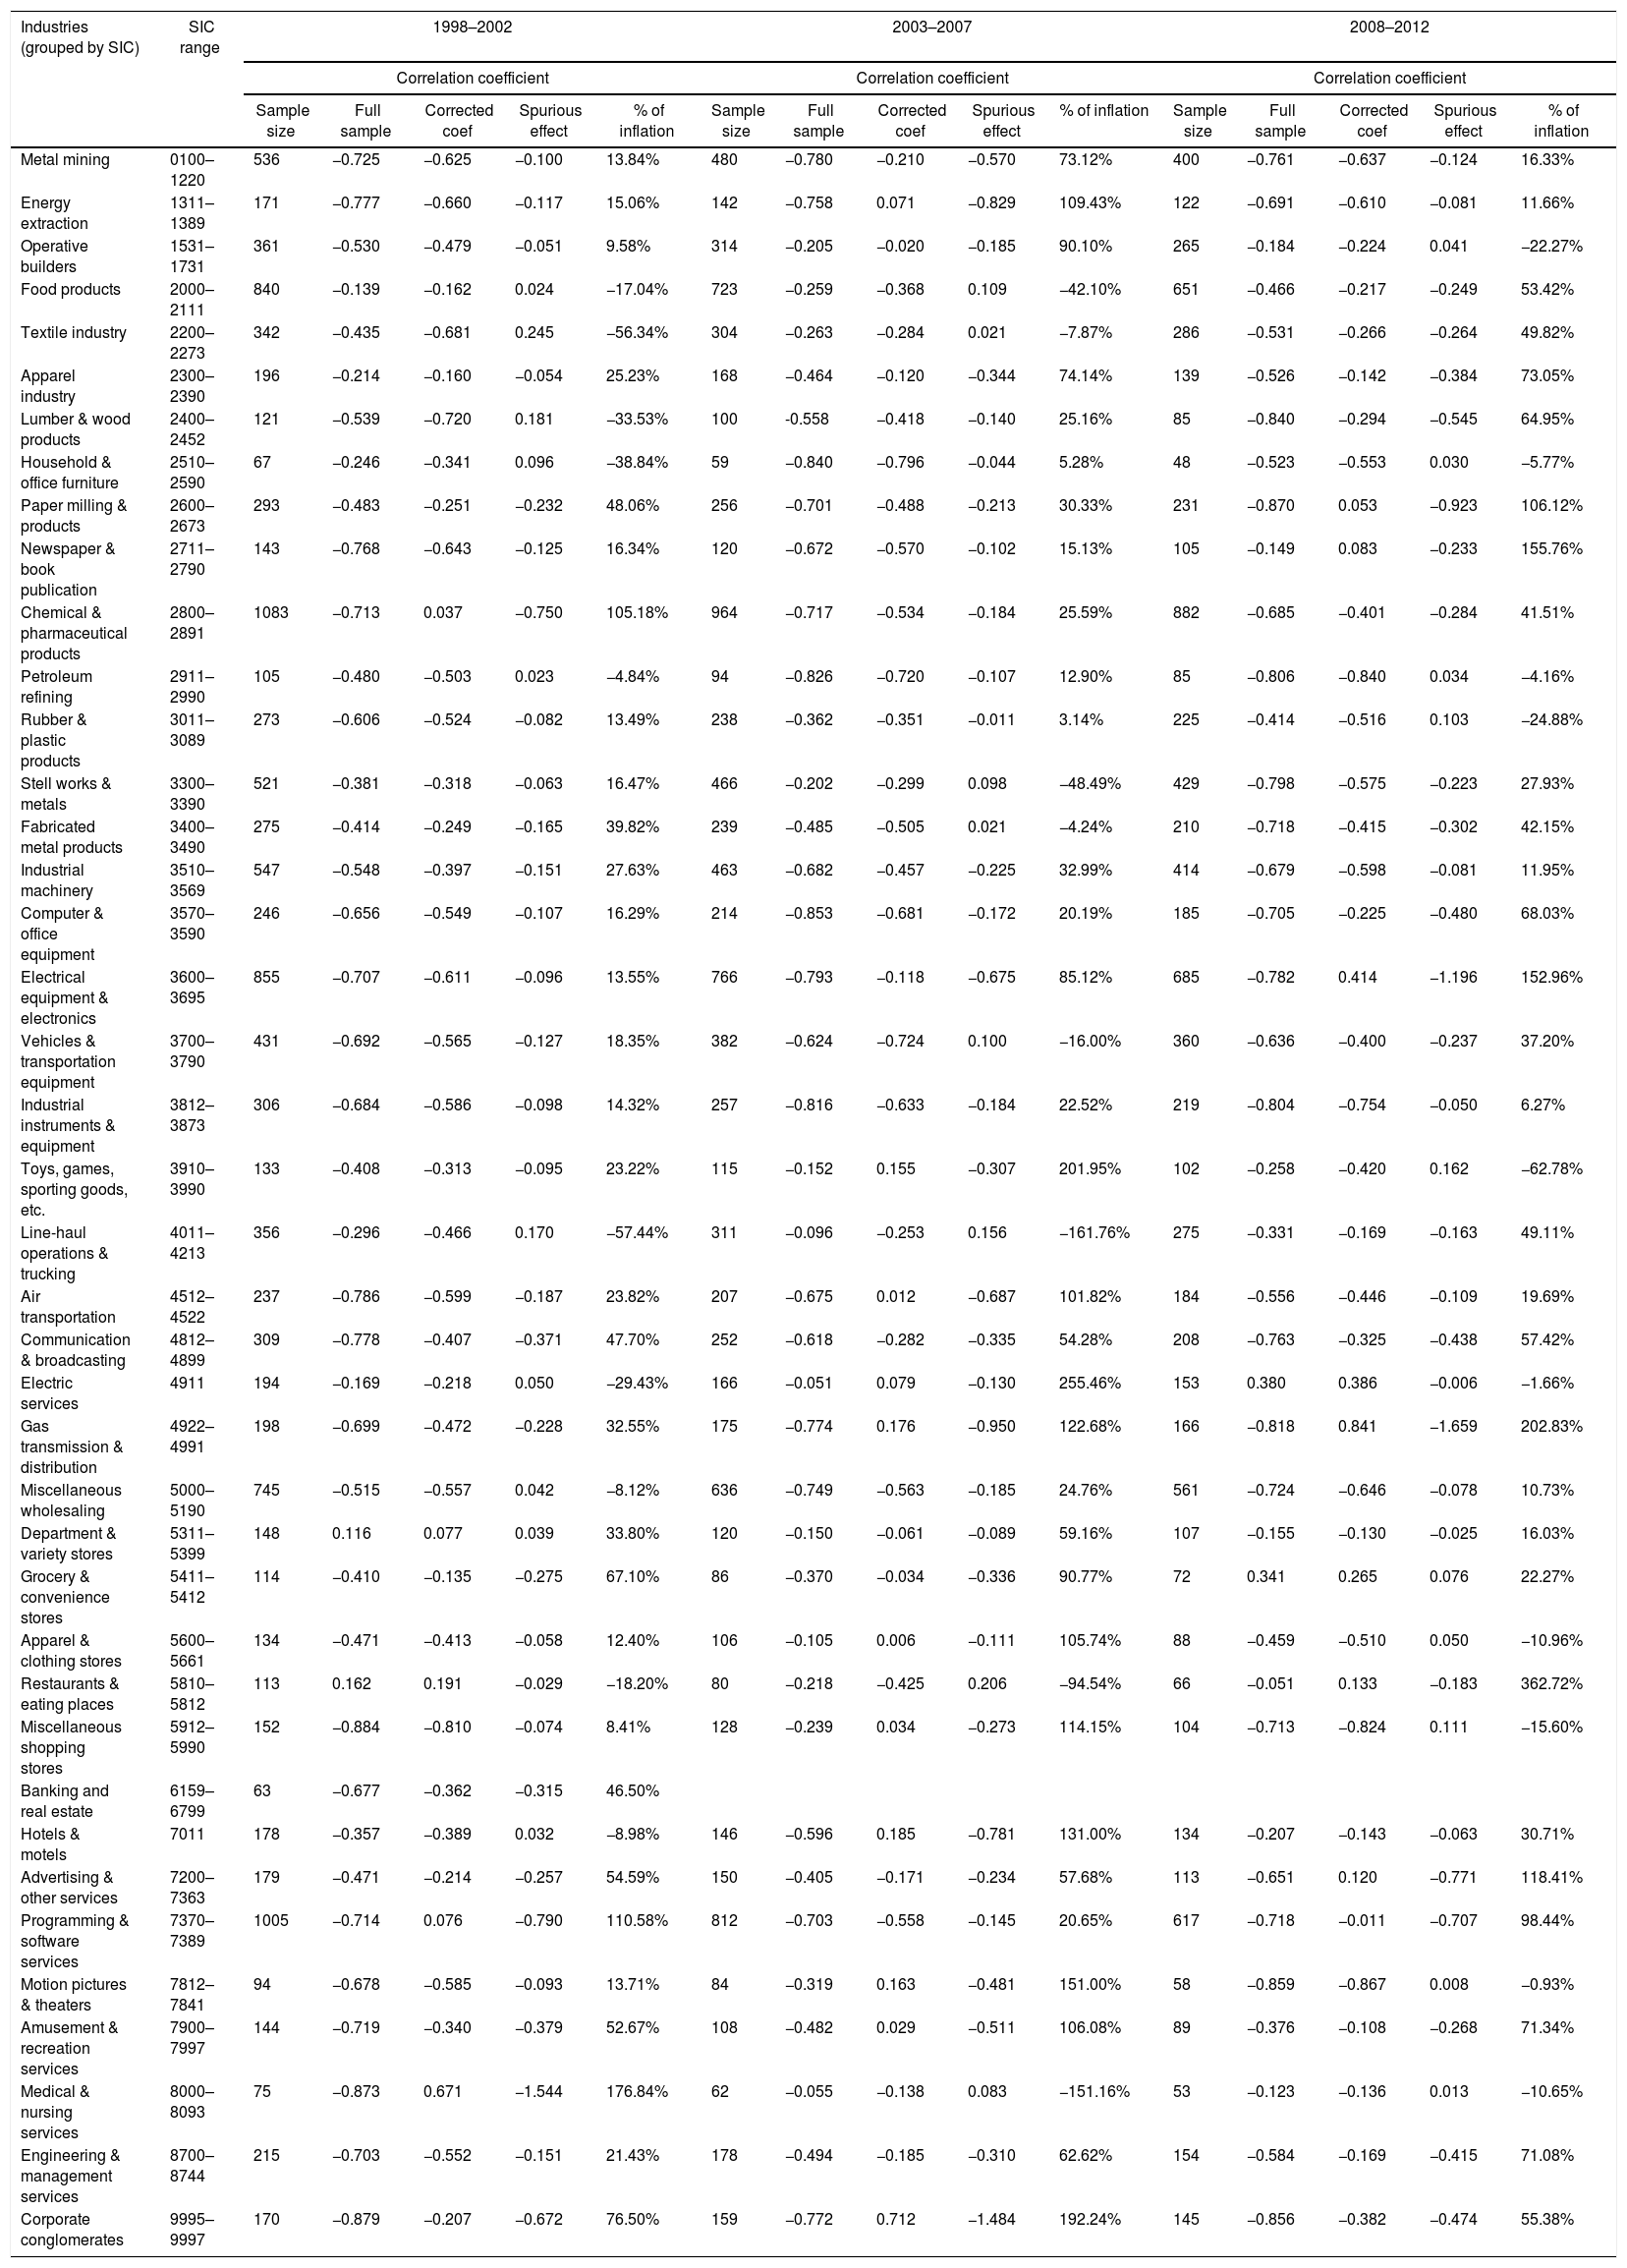
Table 3 summarizes results for concurrent risk–return relationship with Henkel's (2009) spuriousness corrections for the three time periods. It is clear from the tables that the negative risk–return correlation broadly exist in countries other than the US. Related to Table 2, for years between 1998 and 2002, only two out of 41 industries had a positive risk–return correlation. For years between 2003 and 2007, no industry had a positive relation between risk and return. For years between 2008 and 2012, only two industries have positive risk and return relationship. These statistics strongly suggest that negative risk–return relationship is independent of country differences. In addition, we also found that average risk–return relationships are very stable for these three 5-year periods (average correlations for these three periods are −0.535, −0.497, and −0.526 for 1998–2002; 2003–2007; 2008–2012, respectively). Similar patterns are observed with Henkel's (2009) correction in Table 3.
Correction for spuriousness (Henkel, 2009) – Empirically observed cross-sectional risk–return relationship for non-US sample.
| Industries (grouped by SIC) | SIC range | 1998–2002 | 2003–2007 | 2008–2012 | ||||||||||||
|---|---|---|---|---|---|---|---|---|---|---|---|---|---|---|---|---|
| Correlation coefficient | Correlation coefficient | Correlation coefficient | ||||||||||||||
| Sample size | Full sample | Corrected coef | Spurious effect | % of inflation | Sample size | Full sample | Corrected coef | Spurious effect | % of inflation | Sample size | Full sample | Corrected coef | Spurious effect | % of inflation | ||
| Metal mining | 0100–1220 | 536 | −0.725 | −0.625 | −0.100 | 13.84% | 480 | −0.780 | −0.210 | −0.570 | 73.12% | 400 | −0.761 | −0.637 | −0.124 | 16.33% |
| Energy extraction | 1311–1389 | 171 | −0.777 | −0.660 | −0.117 | 15.06% | 142 | −0.758 | 0.071 | −0.829 | 109.43% | 122 | −0.691 | −0.610 | −0.081 | 11.66% |
| Operative builders | 1531–1731 | 361 | −0.530 | −0.479 | −0.051 | 9.58% | 314 | −0.205 | −0.020 | −0.185 | 90.10% | 265 | −0.184 | −0.224 | 0.041 | −22.27% |
| Food products | 2000–2111 | 840 | −0.139 | −0.162 | 0.024 | −17.04% | 723 | −0.259 | −0.368 | 0.109 | −42.10% | 651 | −0.466 | −0.217 | −0.249 | 53.42% |
| Textile industry | 2200–2273 | 342 | −0.435 | −0.681 | 0.245 | −56.34% | 304 | −0.263 | −0.284 | 0.021 | −7.87% | 286 | −0.531 | −0.266 | −0.264 | 49.82% |
| Apparel industry | 2300–2390 | 196 | −0.214 | −0.160 | −0.054 | 25.23% | 168 | −0.464 | −0.120 | −0.344 | 74.14% | 139 | −0.526 | −0.142 | −0.384 | 73.05% |
| Lumber & wood products | 2400–2452 | 121 | −0.539 | −0.720 | 0.181 | −33.53% | 100 | -0.558 | −0.418 | −0.140 | 25.16% | 85 | −0.840 | −0.294 | −0.545 | 64.95% |
| Household & office furniture | 2510–2590 | 67 | −0.246 | −0.341 | 0.096 | −38.84% | 59 | −0.840 | −0.796 | −0.044 | 5.28% | 48 | −0.523 | −0.553 | 0.030 | −5.77% |
| Paper milling & products | 2600–2673 | 293 | −0.483 | −0.251 | −0.232 | 48.06% | 256 | −0.701 | −0.488 | −0.213 | 30.33% | 231 | −0.870 | 0.053 | −0.923 | 106.12% |
| Newspaper & book publication | 2711–2790 | 143 | −0.768 | −0.643 | −0.125 | 16.34% | 120 | −0.672 | −0.570 | −0.102 | 15.13% | 105 | −0.149 | 0.083 | −0.233 | 155.76% |
| Chemical & pharmaceutical products | 2800–2891 | 1083 | −0.713 | 0.037 | −0.750 | 105.18% | 964 | −0.717 | −0.534 | −0.184 | 25.59% | 882 | −0.685 | −0.401 | −0.284 | 41.51% |
| Petroleum refining | 2911–2990 | 105 | −0.480 | −0.503 | 0.023 | −4.84% | 94 | −0.826 | −0.720 | −0.107 | 12.90% | 85 | −0.806 | −0.840 | 0.034 | −4.16% |
| Rubber & plastic products | 3011–3089 | 273 | −0.606 | −0.524 | −0.082 | 13.49% | 238 | −0.362 | −0.351 | −0.011 | 3.14% | 225 | −0.414 | −0.516 | 0.103 | −24.88% |
| Stell works & metals | 3300–3390 | 521 | −0.381 | −0.318 | −0.063 | 16.47% | 466 | −0.202 | −0.299 | 0.098 | −48.49% | 429 | −0.798 | −0.575 | −0.223 | 27.93% |
| Fabricated metal products | 3400–3490 | 275 | −0.414 | −0.249 | −0.165 | 39.82% | 239 | −0.485 | −0.505 | 0.021 | −4.24% | 210 | −0.718 | −0.415 | −0.302 | 42.15% |
| Industrial machinery | 3510–3569 | 547 | −0.548 | −0.397 | −0.151 | 27.63% | 463 | −0.682 | −0.457 | −0.225 | 32.99% | 414 | −0.679 | −0.598 | −0.081 | 11.95% |
| Computer & office equipment | 3570–3590 | 246 | −0.656 | −0.549 | −0.107 | 16.29% | 214 | −0.853 | −0.681 | −0.172 | 20.19% | 185 | −0.705 | −0.225 | −0.480 | 68.03% |
| Electrical equipment & electronics | 3600–3695 | 855 | −0.707 | −0.611 | −0.096 | 13.55% | 766 | −0.793 | −0.118 | −0.675 | 85.12% | 685 | −0.782 | 0.414 | −1.196 | 152.96% |
| Vehicles & transportation equipment | 3700–3790 | 431 | −0.692 | −0.565 | −0.127 | 18.35% | 382 | −0.624 | −0.724 | 0.100 | −16.00% | 360 | −0.636 | −0.400 | −0.237 | 37.20% |
| Industrial instruments & equipment | 3812–3873 | 306 | −0.684 | −0.586 | −0.098 | 14.32% | 257 | −0.816 | −0.633 | −0.184 | 22.52% | 219 | −0.804 | −0.754 | −0.050 | 6.27% |
| Toys, games, sporting goods, etc. | 3910–3990 | 133 | −0.408 | −0.313 | −0.095 | 23.22% | 115 | −0.152 | 0.155 | −0.307 | 201.95% | 102 | −0.258 | −0.420 | 0.162 | −62.78% |
| Line-haul operations & trucking | 4011–4213 | 356 | −0.296 | −0.466 | 0.170 | −57.44% | 311 | −0.096 | −0.253 | 0.156 | −161.76% | 275 | −0.331 | −0.169 | −0.163 | 49.11% |
| Air transportation | 4512–4522 | 237 | −0.786 | −0.599 | −0.187 | 23.82% | 207 | −0.675 | 0.012 | −0.687 | 101.82% | 184 | −0.556 | −0.446 | −0.109 | 19.69% |
| Communication & broadcasting | 4812–4899 | 309 | −0.778 | −0.407 | −0.371 | 47.70% | 252 | −0.618 | −0.282 | −0.335 | 54.28% | 208 | −0.763 | −0.325 | −0.438 | 57.42% |
| Electric services | 4911 | 194 | −0.169 | −0.218 | 0.050 | −29.43% | 166 | −0.051 | 0.079 | −0.130 | 255.46% | 153 | 0.380 | 0.386 | −0.006 | −1.66% |
| Gas transmission & distribution | 4922–4991 | 198 | −0.699 | −0.472 | −0.228 | 32.55% | 175 | −0.774 | 0.176 | −0.950 | 122.68% | 166 | −0.818 | 0.841 | −1.659 | 202.83% |
| Miscellaneous wholesaling | 5000–5190 | 745 | −0.515 | −0.557 | 0.042 | −8.12% | 636 | −0.749 | −0.563 | −0.185 | 24.76% | 561 | −0.724 | −0.646 | −0.078 | 10.73% |
| Department & variety stores | 5311–5399 | 148 | 0.116 | 0.077 | 0.039 | 33.80% | 120 | −0.150 | −0.061 | −0.089 | 59.16% | 107 | −0.155 | −0.130 | −0.025 | 16.03% |
| Grocery & convenience stores | 5411–5412 | 114 | −0.410 | −0.135 | −0.275 | 67.10% | 86 | −0.370 | −0.034 | −0.336 | 90.77% | 72 | 0.341 | 0.265 | 0.076 | 22.27% |
| Apparel & clothing stores | 5600–5661 | 134 | −0.471 | −0.413 | −0.058 | 12.40% | 106 | −0.105 | 0.006 | −0.111 | 105.74% | 88 | −0.459 | −0.510 | 0.050 | −10.96% |
| Restaurants & eating places | 5810–5812 | 113 | 0.162 | 0.191 | −0.029 | −18.20% | 80 | −0.218 | −0.425 | 0.206 | −94.54% | 66 | −0.051 | 0.133 | −0.183 | 362.72% |
| Miscellaneous shopping stores | 5912–5990 | 152 | −0.884 | −0.810 | −0.074 | 8.41% | 128 | −0.239 | 0.034 | −0.273 | 114.15% | 104 | −0.713 | −0.824 | 0.111 | −15.60% |
| Banking and real estate | 6159–6799 | 63 | −0.677 | −0.362 | −0.315 | 46.50% | ||||||||||
| Hotels & motels | 7011 | 178 | −0.357 | −0.389 | 0.032 | −8.98% | 146 | −0.596 | 0.185 | −0.781 | 131.00% | 134 | −0.207 | −0.143 | −0.063 | 30.71% |
| Advertising & other services | 7200–7363 | 179 | −0.471 | −0.214 | −0.257 | 54.59% | 150 | −0.405 | −0.171 | −0.234 | 57.68% | 113 | −0.651 | 0.120 | −0.771 | 118.41% |
| Programming & software services | 7370–7389 | 1005 | −0.714 | 0.076 | −0.790 | 110.58% | 812 | −0.703 | −0.558 | −0.145 | 20.65% | 617 | −0.718 | −0.011 | −0.707 | 98.44% |
| Motion pictures & theaters | 7812–7841 | 94 | −0.678 | −0.585 | −0.093 | 13.71% | 84 | −0.319 | 0.163 | −0.481 | 151.00% | 58 | −0.859 | −0.867 | 0.008 | −0.93% |
| Amusement & recreation services | 7900–7997 | 144 | −0.719 | −0.340 | −0.379 | 52.67% | 108 | −0.482 | 0.029 | −0.511 | 106.08% | 89 | −0.376 | −0.108 | −0.268 | 71.34% |
| Medical & nursing services | 8000–8093 | 75 | −0.873 | 0.671 | −1.544 | 176.84% | 62 | −0.055 | −0.138 | 0.083 | −151.16% | 53 | −0.123 | −0.136 | 0.013 | −10.65% |
| Engineering & management services | 8700–8744 | 215 | −0.703 | −0.552 | −0.151 | 21.43% | 178 | −0.494 | −0.185 | −0.310 | 62.62% | 154 | −0.584 | −0.169 | −0.415 | 71.08% |
| Corporate conglomerates | 9995–9997 | 170 | −0.879 | −0.207 | −0.672 | 76.50% | 159 | −0.772 | 0.712 | −1.484 | 192.24% | 145 | −0.856 | −0.382 | −0.474 | 55.38% |
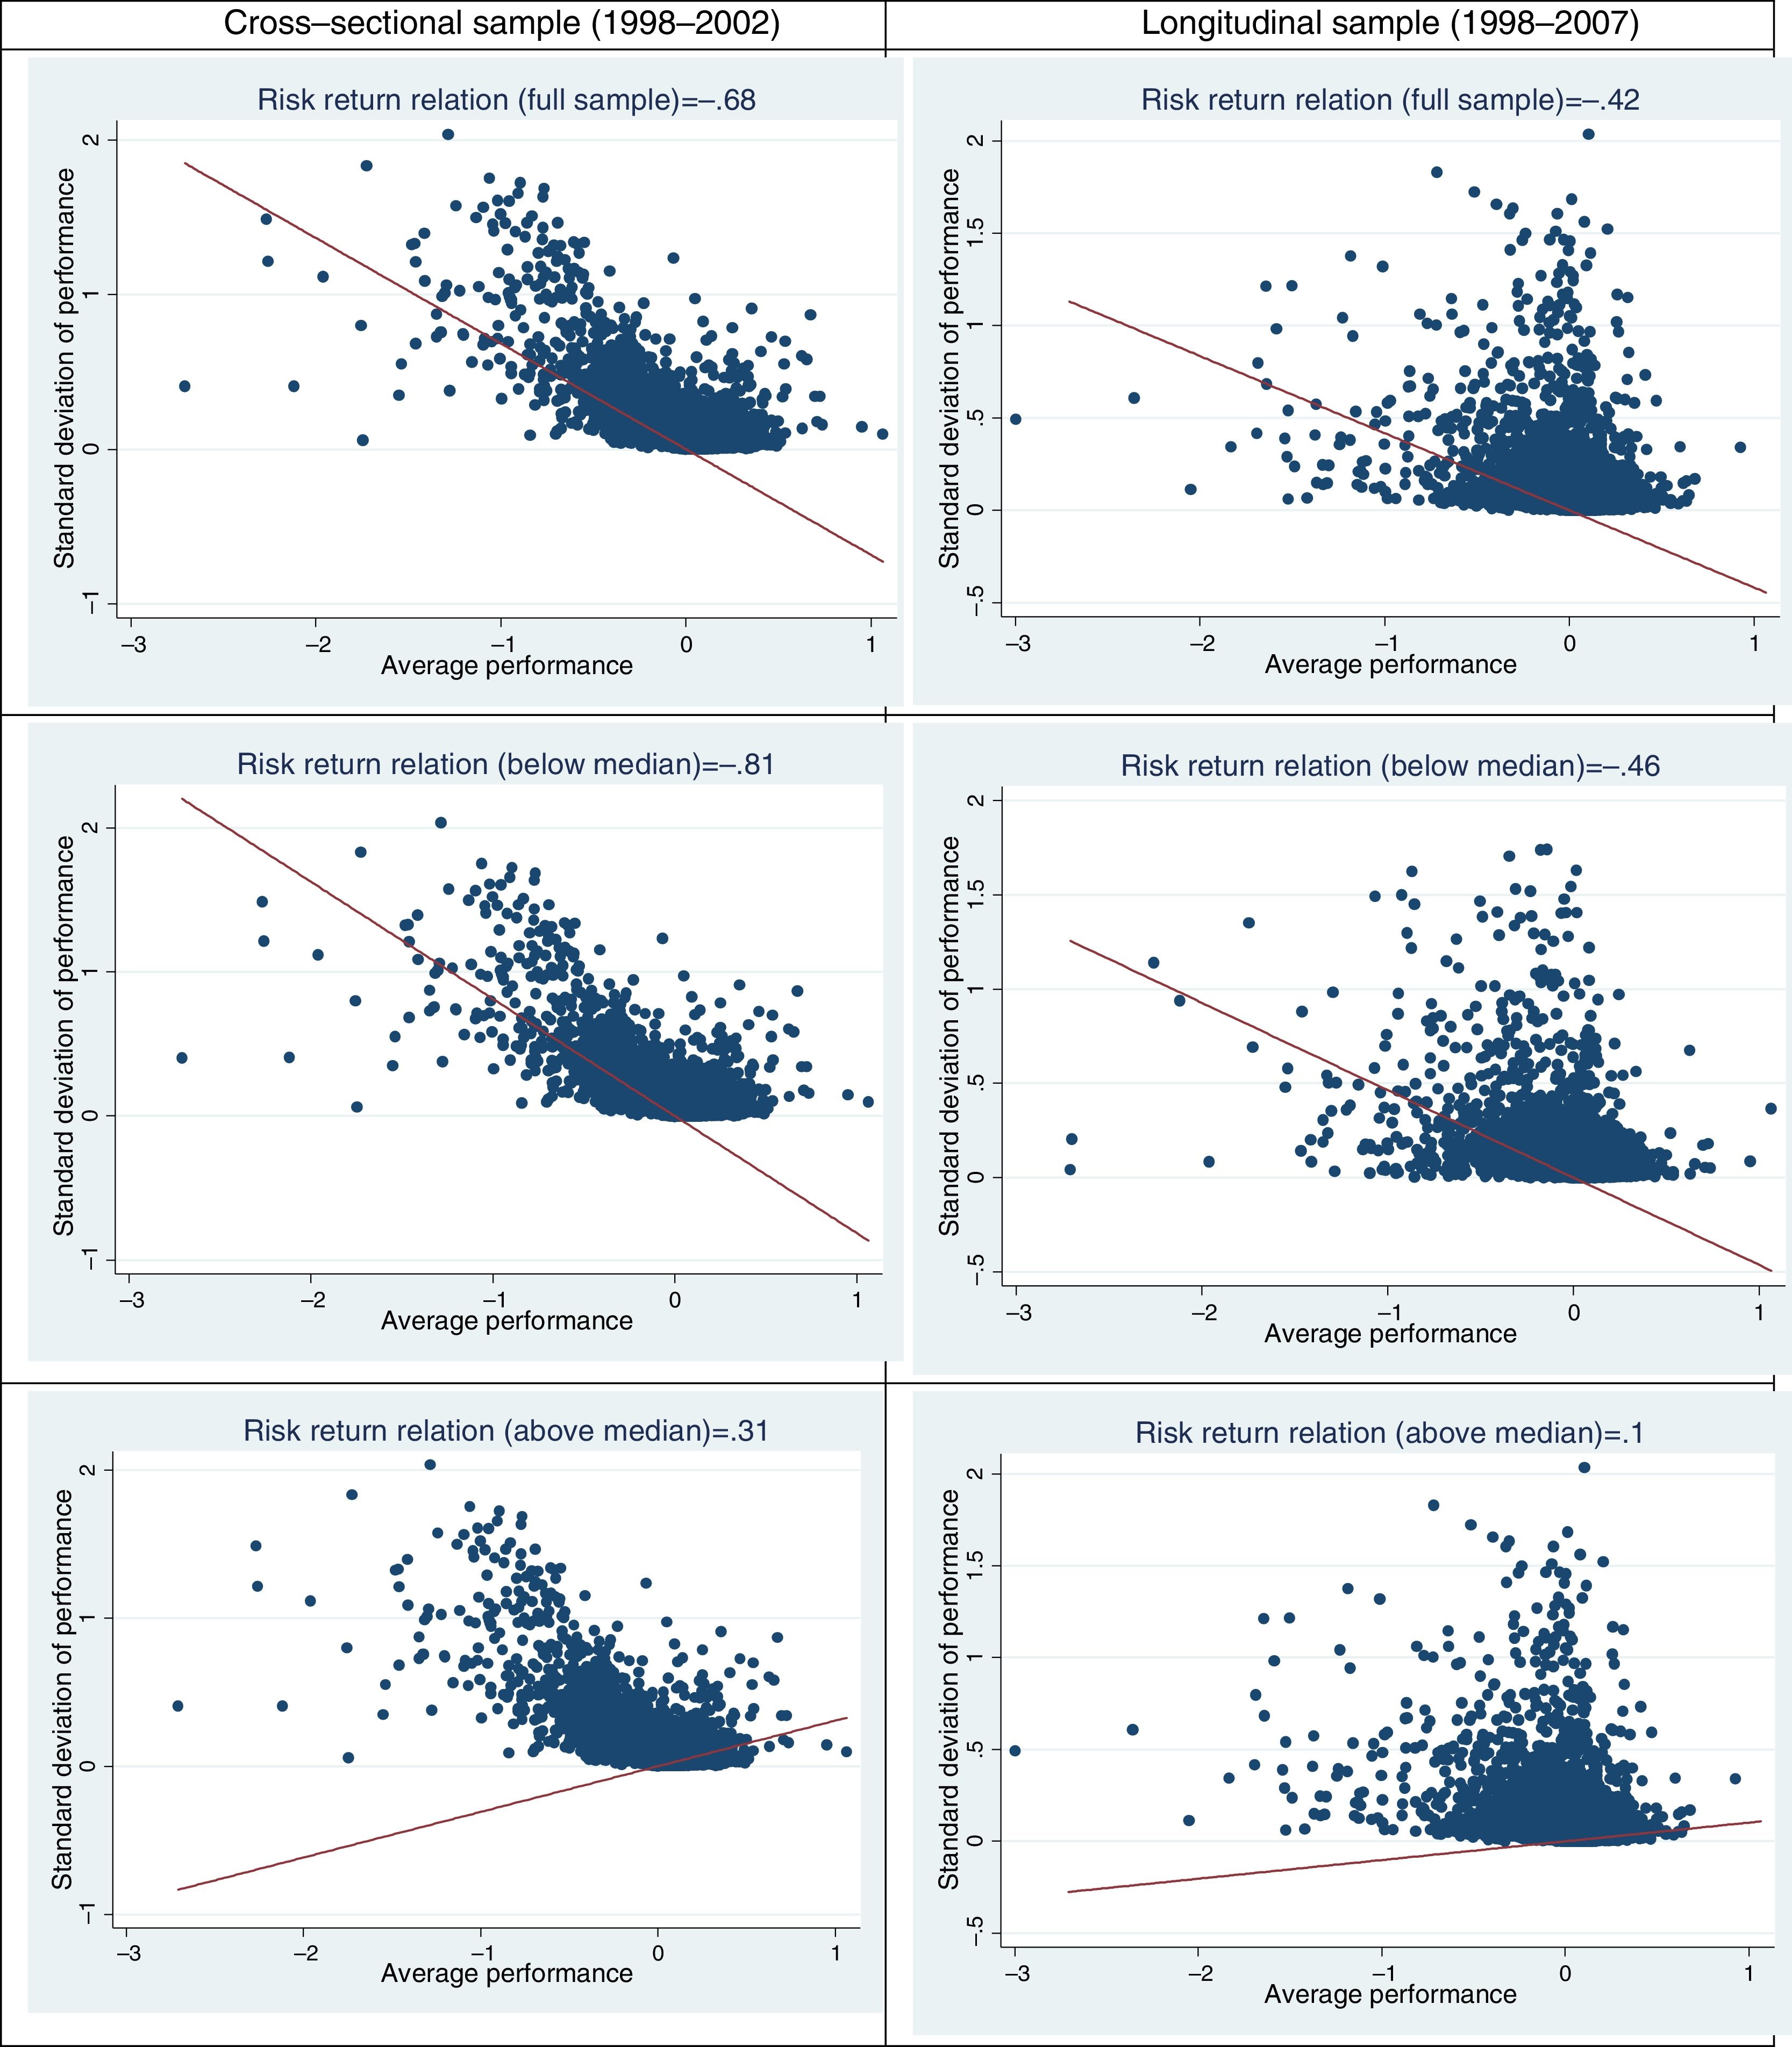
To assess support for prospect theory or behavioral theory of firm explanations, we split the sample using the median performance of the industry following Andersen et al. (2007) approach. In years between 1998 and 2002, only two industries had a negative risk and return relationship among firms with performance above industry median. Therefore, for firms with performance above industry median the contemporaneous risk–return relationship is mainly positive. In contrast, risk and return relationship is broadly negative for firms performing below the industry median. Similar pattern carries on to the samples in years between 2003 and 2007 and years between 2008 and 2012. As such, we conclude that across 28 countries, firms performing below industry median generally have a negative correlation between risk and return, whereas firms performing above industry median generally have a positive correlation between risk and return.
The contemporaneous correlation between risk and return has been criticized by prior studies (e.g. Andersen & Bettis, 2015). Empirical evidence has shown that correlation between average performance and standard deviation of subsequent period tends to be less negative than the cross-sectional risk–return relationship (Miller & Chen, 2004). To replicate these results, we used longitudinal risk–return correlation suggested by Andersen and Bettis (2015). Their computation of longitudinal risk–return relationship is calculated as the correlation between the average ROA over the first five period and the standard deviation of ROA over the next five year period. As such, our first set of risk–return relationship was calculated as correlation between the mean ROA over year 1998–2002 and the standard deviation of ROA over years 2003–2007. Our second set of risk–return relationship was computed as the correlation between the mean ROA over year 2003–2007 and the standard deviation of ROA over years 2008–2012. Table 4 summarizes our findings.
Empirically observed longitudinala risk–return relationship for non-US sample.
| Industries (grouped by SIC) | SIC range | 1998–2007 | 2003–2012 | ||||||
|---|---|---|---|---|---|---|---|---|---|
| Correlation coefficient | Correlation coefficient | ||||||||
| Sample size | Full sample | Above media | Below median | Sample size | Full sample | Above media | Below median | ||
| Metal mining | 0100–1220 | 480 | −0.380 | 0.144 | −0.268 | 397 | −0.336 | 0.138 | −0.244 |
| Energy extraction | 1311–1389 | 142 | −0.448 | −0.114 | −0.368 | 122 | −0.414 | 0.260 | −0.359 |
| Operative builders | 1531–1731 | 314 | −0.119 | 0.055 | −0.235 | 263 | −0.117 | 0.044 | −0.459 |
| Food products | 2000–2111 | 723 | −0.262 | 0.136 | −0.467 | 643 | −0.228 | 0.300 | −0.527 |
| Textile industry | 2200–2273 | 304 | −0.275 | 0.109 | −0.415 | 275 | −0.016 | −0.035 | −0.009 |
| Apparel industry | 2300–2390 | 168 | −0.092 | −0.077 | −0.168 | 138 | −0.161 | −0.062 | −0.193 |
| Lumber & wood products | 2400–2452 | 100 | −0.516 | 0.435 | −0.727 | 85 | −0.361 | −0.075 | −0.558 |
| Household & office furniture | 2510–2590 | 59 | −0.397 | 0.112 | −0.593 | 48 | −0.272 | 0.155 | −0.665 |
| Paper milling & products | 2600–2673 | 256 | −0.280 | 0.109 | −0.314 | 229 | −0.664 | 0.105 | −0.724 |
| Newspaper & book publication | 2711–2790 | 120 | −0.404 | 0.265 | −0.513 | 104 | −0.539 | 0.247 | −0.734 |
| Chemical & pharmaceutical products | 2800–2891 | 964 | −0.591 | 0.114 | −0.631 | 872 | −0.413 | 0.169 | −0.421 |
| Petroleum refining | 2911–2990 | 94 | −0.526 | 0.151 | −0.611 | 84 | −0.235 | 0.085 | −0.223 |
| Rubber & plastic products | 3011–3089 | 238 | −0.231 | 0.256 | −0.320 | 219 | −0.340 | 0.104 | −0.506 |
| Stell works & metals | 3300–3390 | 466 | −0.026 | 0.427 | −0.291 | 426 | −0.277 | 0.182 | −0.541 |
| Fabricated metal products | 3400–3490 | 239 | −0.266 | 0.037 | −0.461 | 207 | −0.415 | 0.063 | −0.655 |
| Industrial machinery | 3510–3569 | 463 | −0.438 | 0.084 | −0.714 | 412 | −0.557 | 0.189 | −0.728 |
| Computer & office equipment | 3570–3590 | 214 | −0.553 | 0.187 | −0.573 | 185 | −0.467 | 0.088 | −0.482 |
| Electrical equipment & electronics | 3600–3695 | 766 | −0.416 | −0.031 | −0.438 | 680 | −0.438 | 0.053 | −0.489 |
| Vehicles & transportation equipment | 3700–3790 | 382 | −0.389 | 0.242 | −0.421 | 357 | −0.544 | 0.156 | −0.709 |
| Industrial instruments & equipment | 3812–3873 | 257 | −0.518 | 0.117 | −0.489 | 219 | −0.551 | 0.090 | −0.547 |
| Toys, games, sporting goods, etc. | 3910–3990 | 115 | −0.056 | 0.278 | −0.320 | 102 | −0.044 | 0.268 | −0.187 |
| Line-haul operations & trucking | 4011–4213 | 311 | 0.011 | 0.152 | −0.271 | 273 | 0.073 | 0.497 | −0.255 |
| Air transportation | 4512–4522 | 207 | −0.546 | 0.248 | −0.691 | 181 | −0.672 | −0.067 | −0.807 |
| Communication & broadcasting | 4812–4899 | 252 | −0.283 | 0.006 | −0.247 | 207 | −0.375 | 0.566 | −0.498 |
| Electric services | 4911 | 166 | −0.179 | 0.164 | −0.212 | 151 | 0.189 | 0.530 | −0.306 |
| Gas transmission & distribution | 4922–4991 | 175 | −0.431 | 0.634 | −0.504 | 164 | −0.431 | 0.282 | −0.465 |
| Miscellaneous wholesaling | 5000–5190 | 636 | −0.303 | 0.054 | −0.382 | 555 | −0.475 | 0.095 | −0.512 |
| Department & variety stores | 5311–5399 | 120 | −0.067 | 0.028 | −0.301 | 105 | −0.105 | 0.249 | −0.289 |
| Grocery & convenience stores | 5411–5412 | 86 | −0.044 | 0.138 | −0.104 | 72 | 0.063 | −0.088 | −0.219 |
| Apparel & clothing stores | 5600–5661 | 106 | −0.142 | 0.282 | −0.502 | 87 | −0.063 | 0.198 | −0.088 |
| Restaurants & eating places | 5810–5812 | 80 | −0.243 | 0.343 | −0.539 | 63 | −0.025 | 0.351 | −0.273 |
| Miscellaneous shopping stores | 5912–5990 | 128 | −0.432 | 0.431 | −0.448 | 103 | −0.195 | 0.315 | −0.522 |
| Banking and real estate | 6159–6799 | 21 | −0.584 | 0.827 | −0.759 | 8 | −0.482 | 0.909 | −0.878 |
| Hotels & motels | 7011 | 146 | 0.014 | 0.052 | −0.206 | 133 | −0.545 | 0.376 | −0.909 |
| Advertising & other services | 7200–7363 | 150 | −0.110 | 0.607 | −0.448 | 111 | −0.512 | 0.367 | −0.909 |
| Programming & software services | 7370–7389 | 812 | −0.380 | 0.013 | −0.320 | 612 | −0.389 | 0.159 | −0.447 |
| Motion pictures & theaters | 7812–7841 | 84 | −0.069 | 0.321 | −0.236 | 58 | −0.263 | 0.213 | −0.113 |
| Amusement & recreation services | 7900–7997 | 108 | −0.503 | 0.202 | −0.567 | 89 | −0.317 | 0.103 | −0.473 |
| Medical & nursing services | 8000–8093 | 62 | −0.383 | 0.046 | −0.652 | 53 | −0.290 | 0.544 | −0.404 |
| Engineering & management services | 8700–8744 | 178 | −0.545 | −0.028 | −0.598 | 152 | −0.233 | 0.143 | −0.289 |
| Corporate conglomerates | 9995–9997 | 159 | −0.594 | 0.266 | −0.636 | 144 | −0.728 | 0.288 | −0.752 |
| Mean | −0.317 | 0.191 | −0.438 | −0.321 | 0.209 | −0.472 | |||
We continue to find negative risk and return relationship. For instance, in the first ten year period (1998–2007), only two industries show weak positive risk and return relationship (r<0.015). Over the next ten-year period (2003–2012), three industries show positive risk and return relationship. Again, such relationship is relatively stable (average correlations are −0.317 and −0.321 for the two periods). As expected, the average correlations are weaker than the cross-sectional correlations. Of these, electric services (SIC=4911) in 2003–2012 shows moderate positive relationship (r=0.189). Similarly, when we only considered firms with performance above median, we did detect most industries experience positive risk and return relationship for both periods. Again, when we exclusively focused on firm performance below median, we did find broad support for positive risk and return correlations. Overall, both cross-sectional and longitudinal calculations provide strong support for the existence of inverse risk and return relationship across 28 countries. Fig. 1 presents the cross-sectional (Table 2), and longitudinal (Table 4) relationship between performance and variance in performance and the risk–return relationship for firms with performance above or below industry median (Table 4).
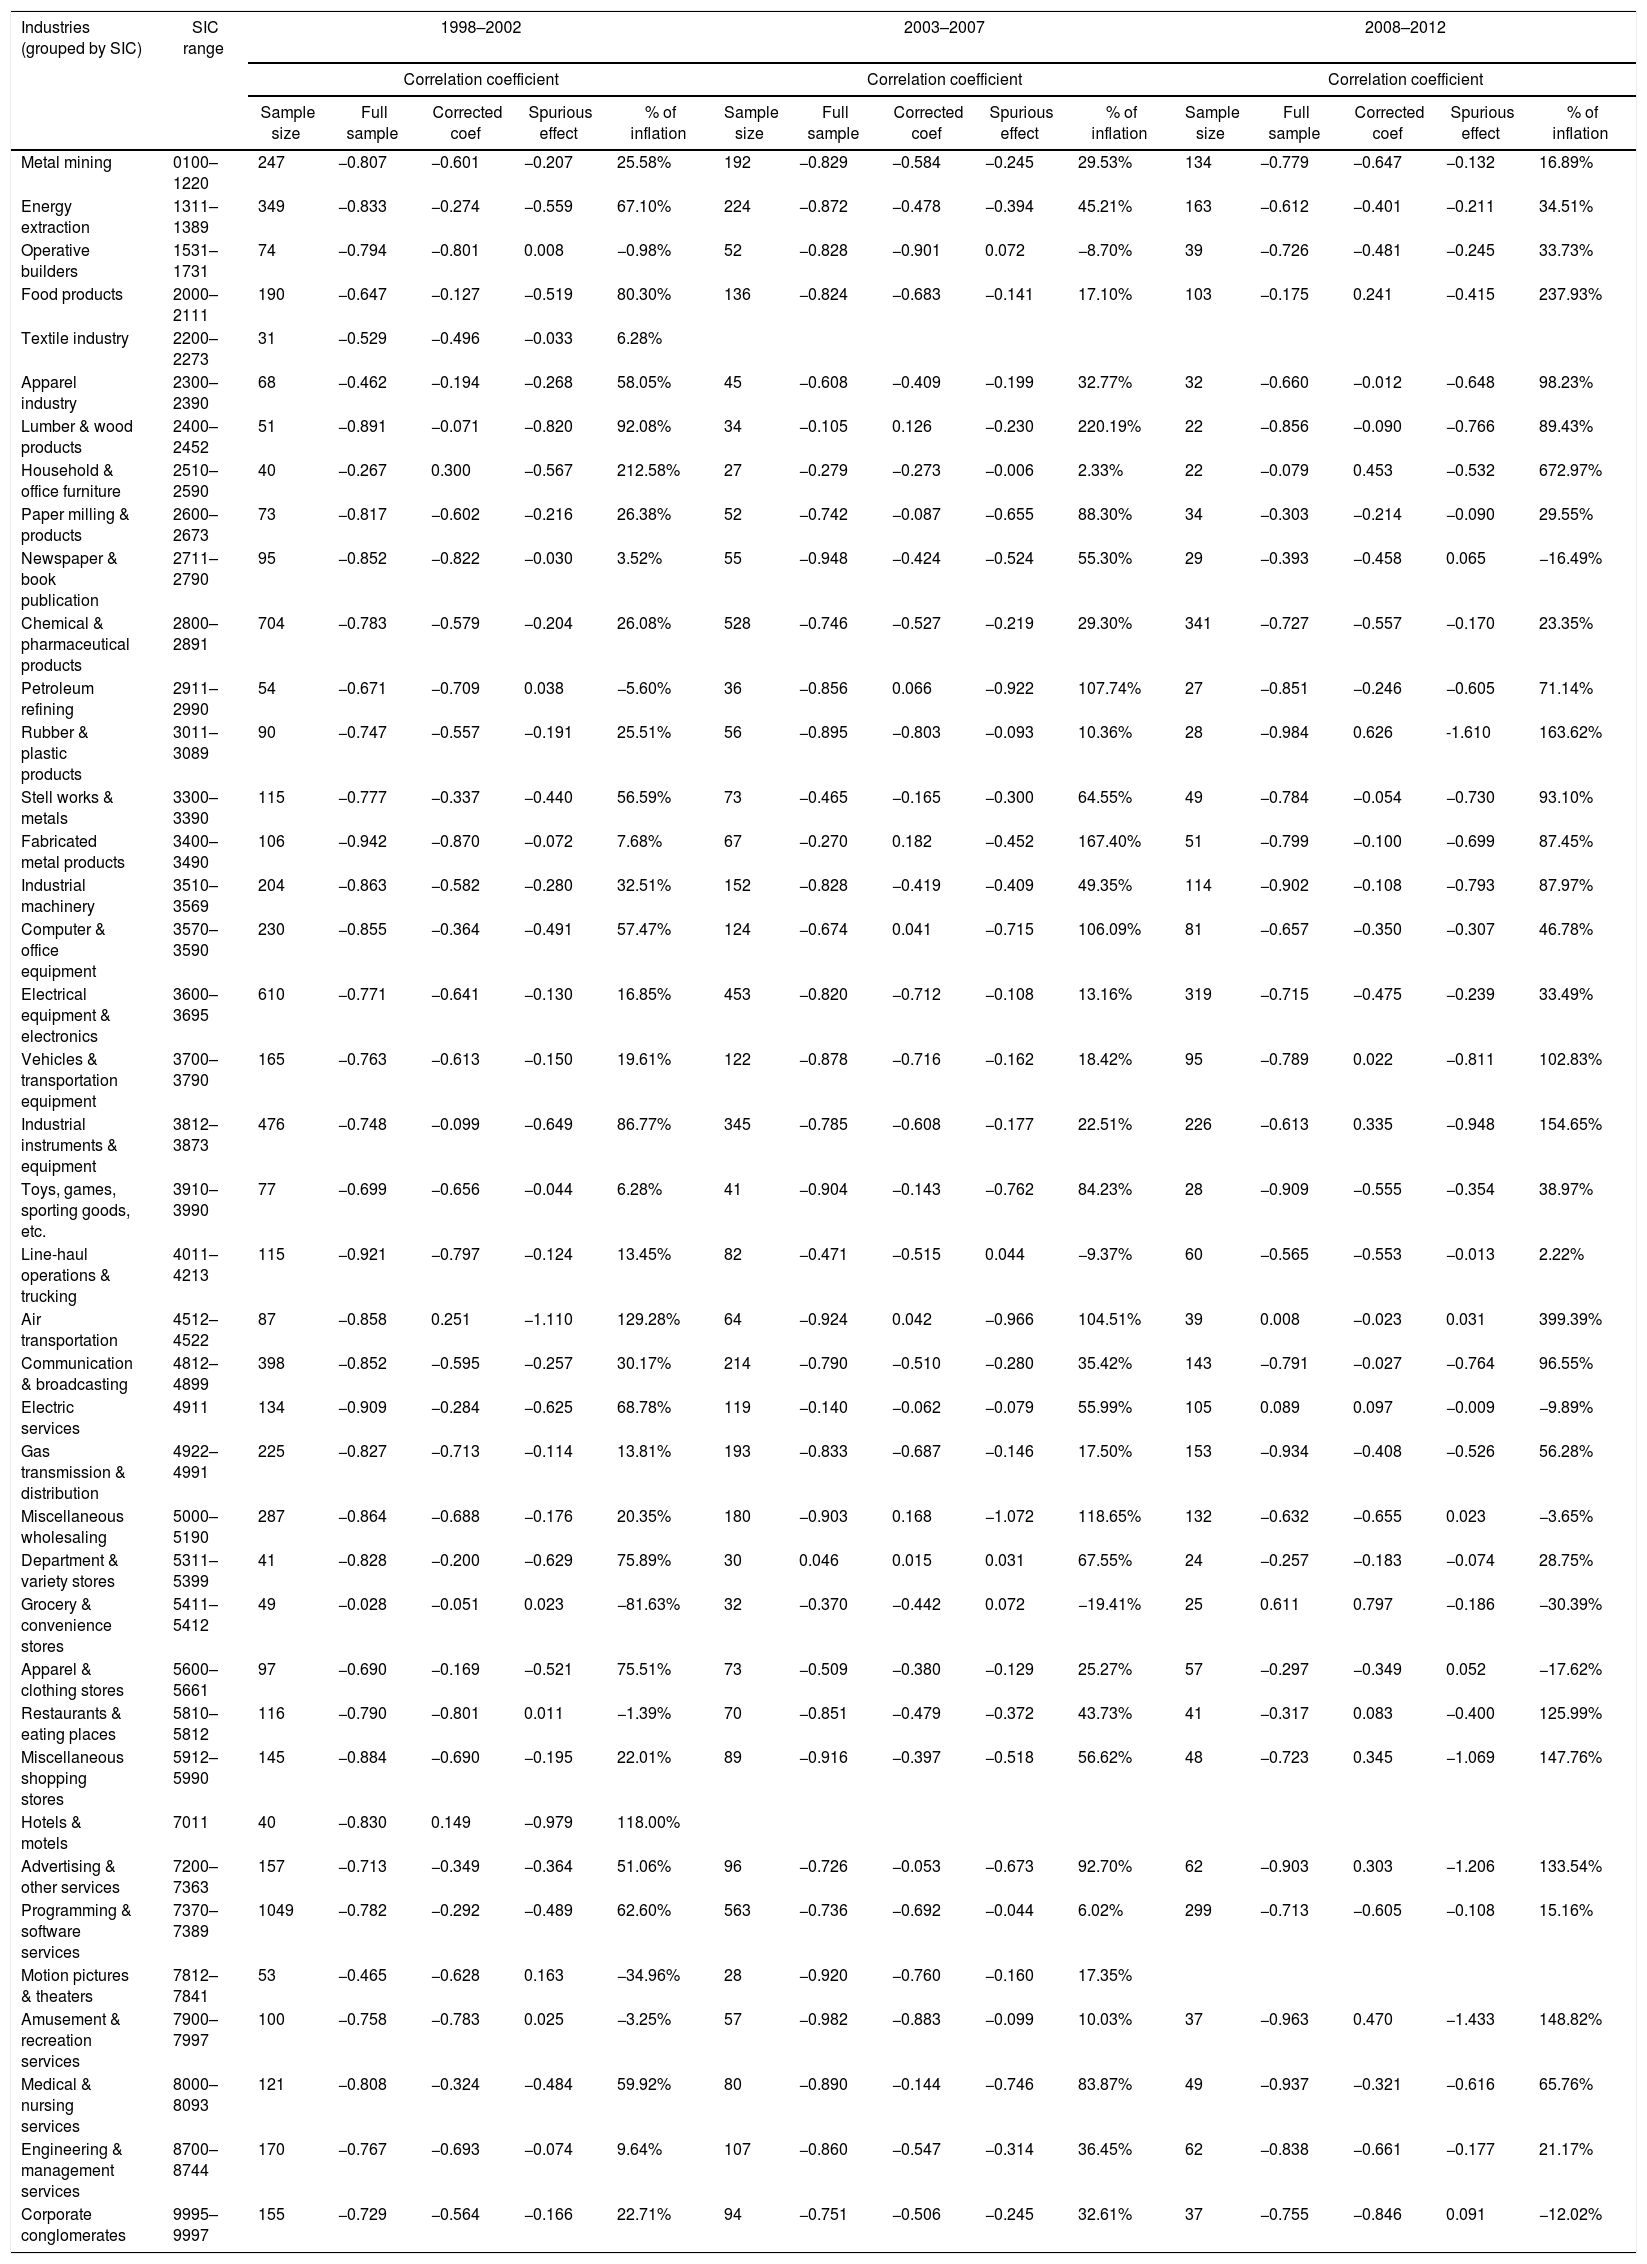
Robustness check with the US sample
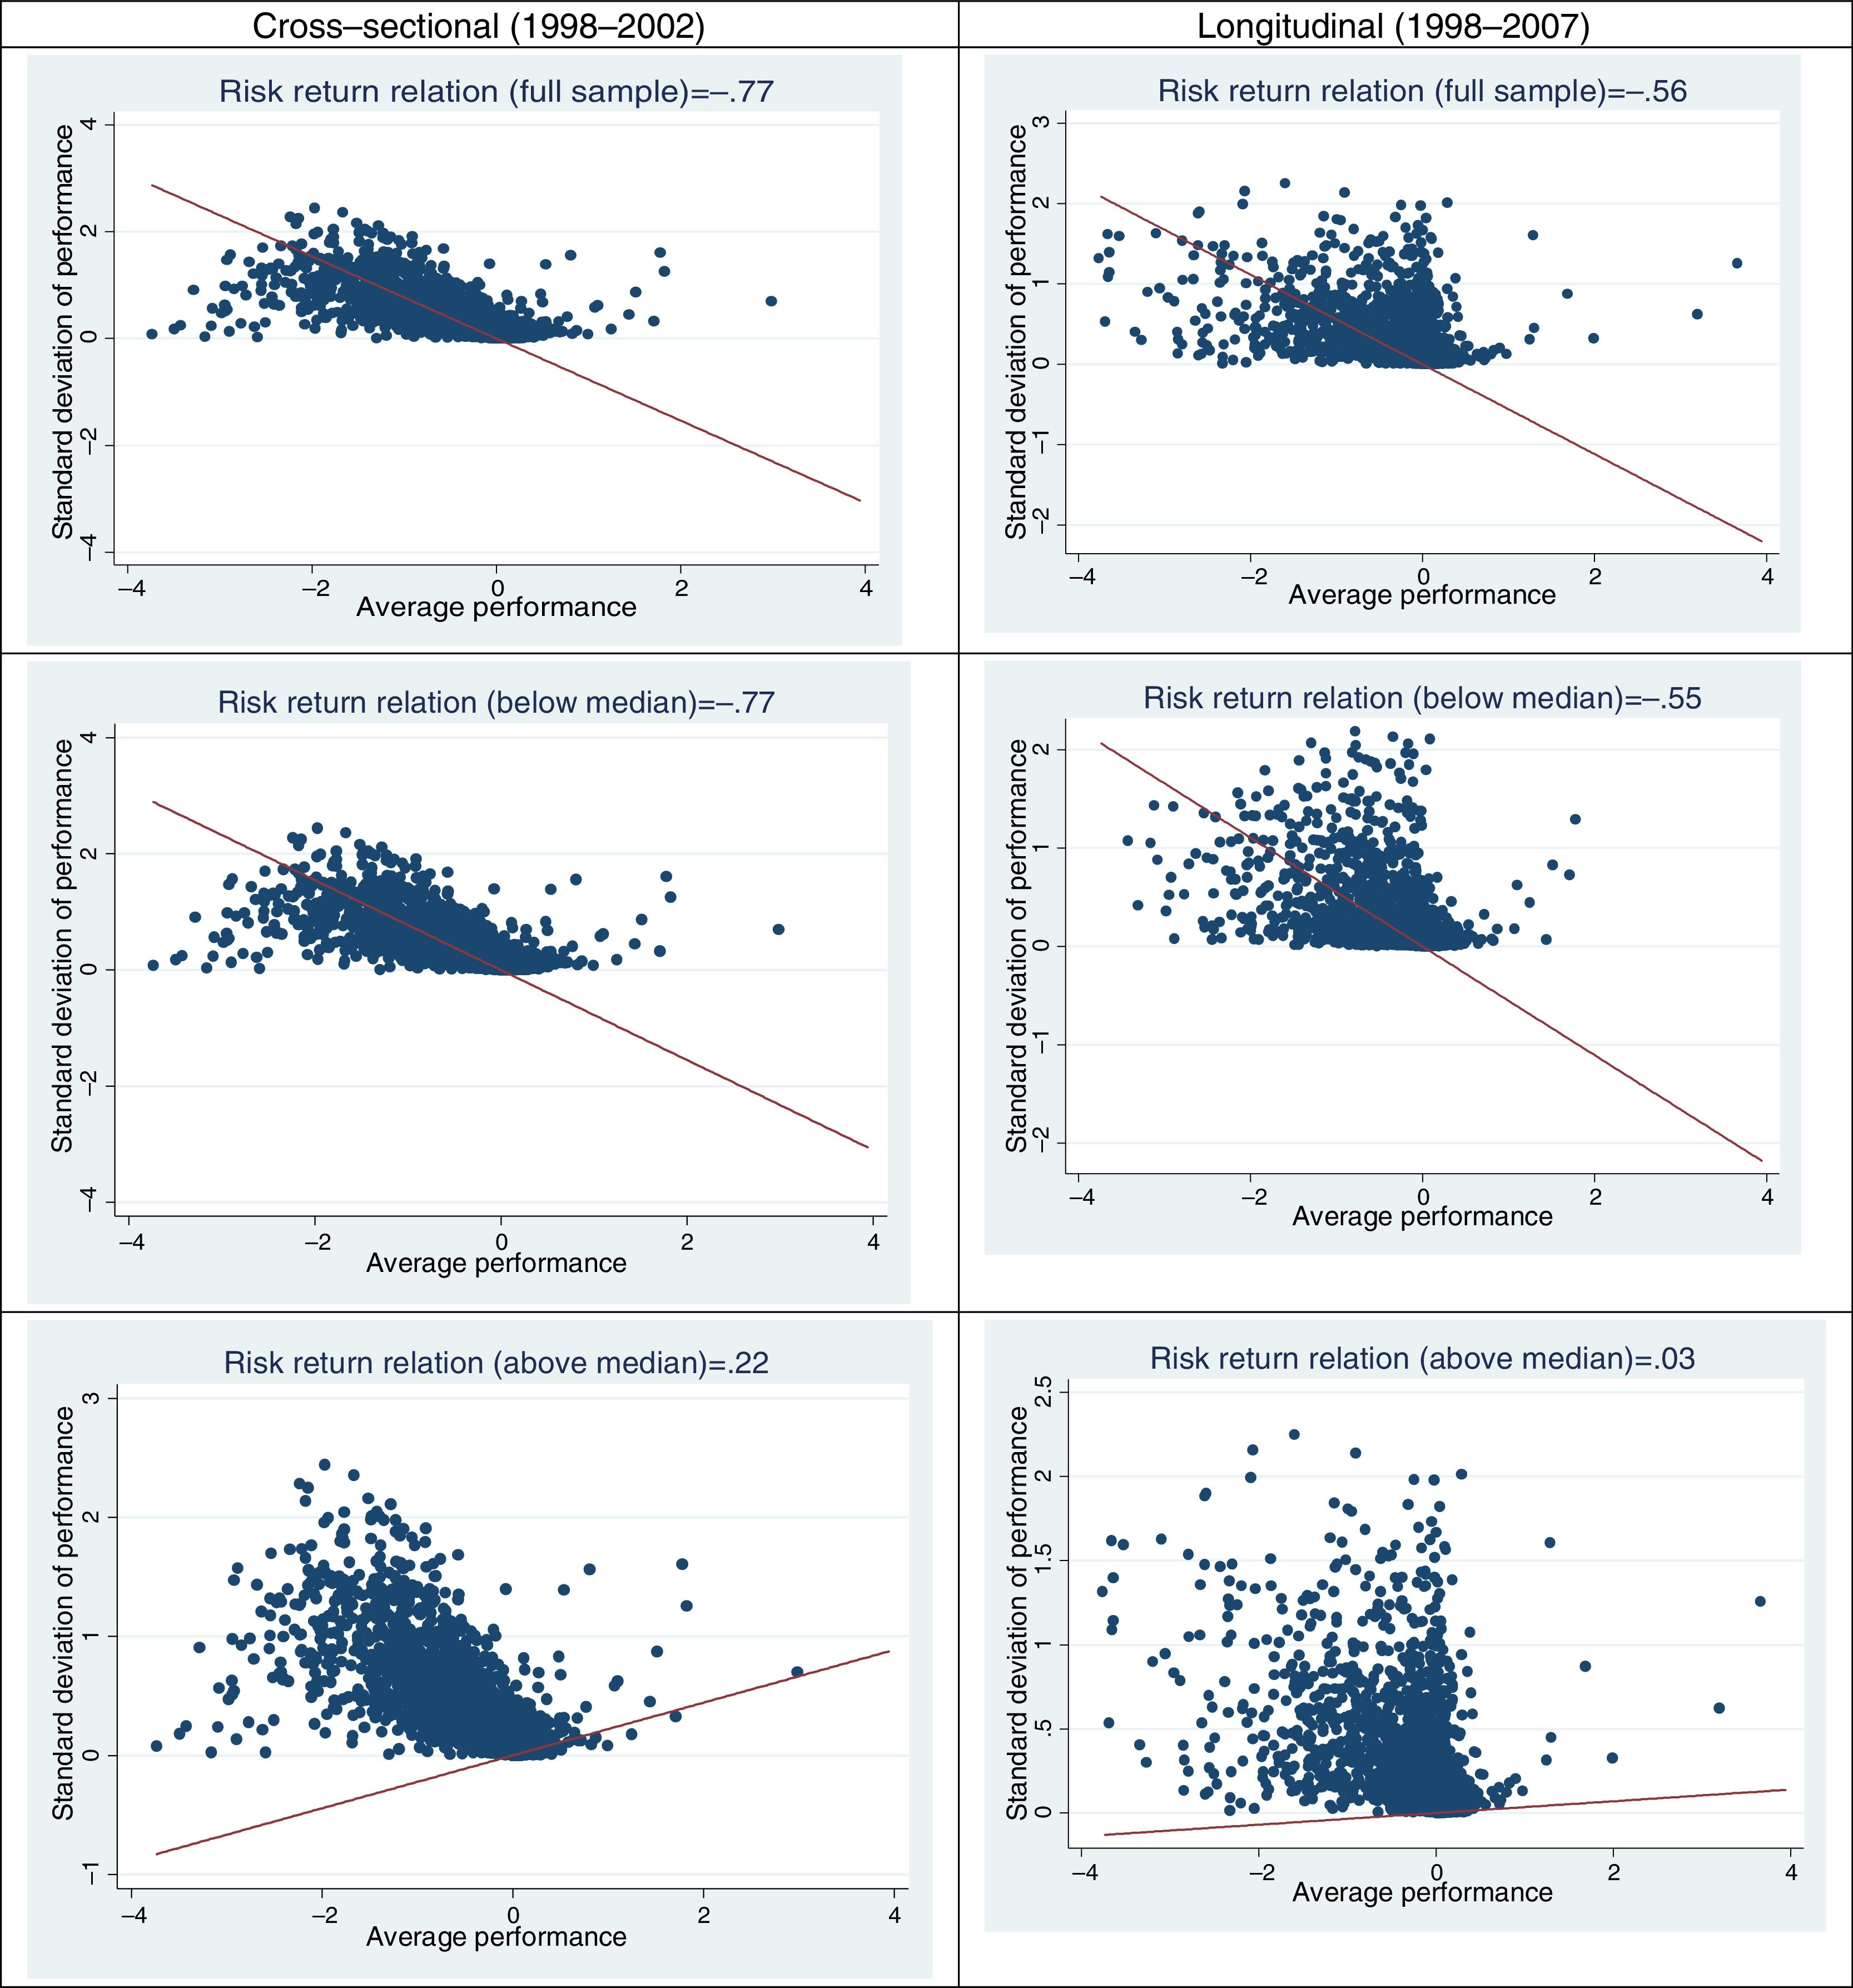
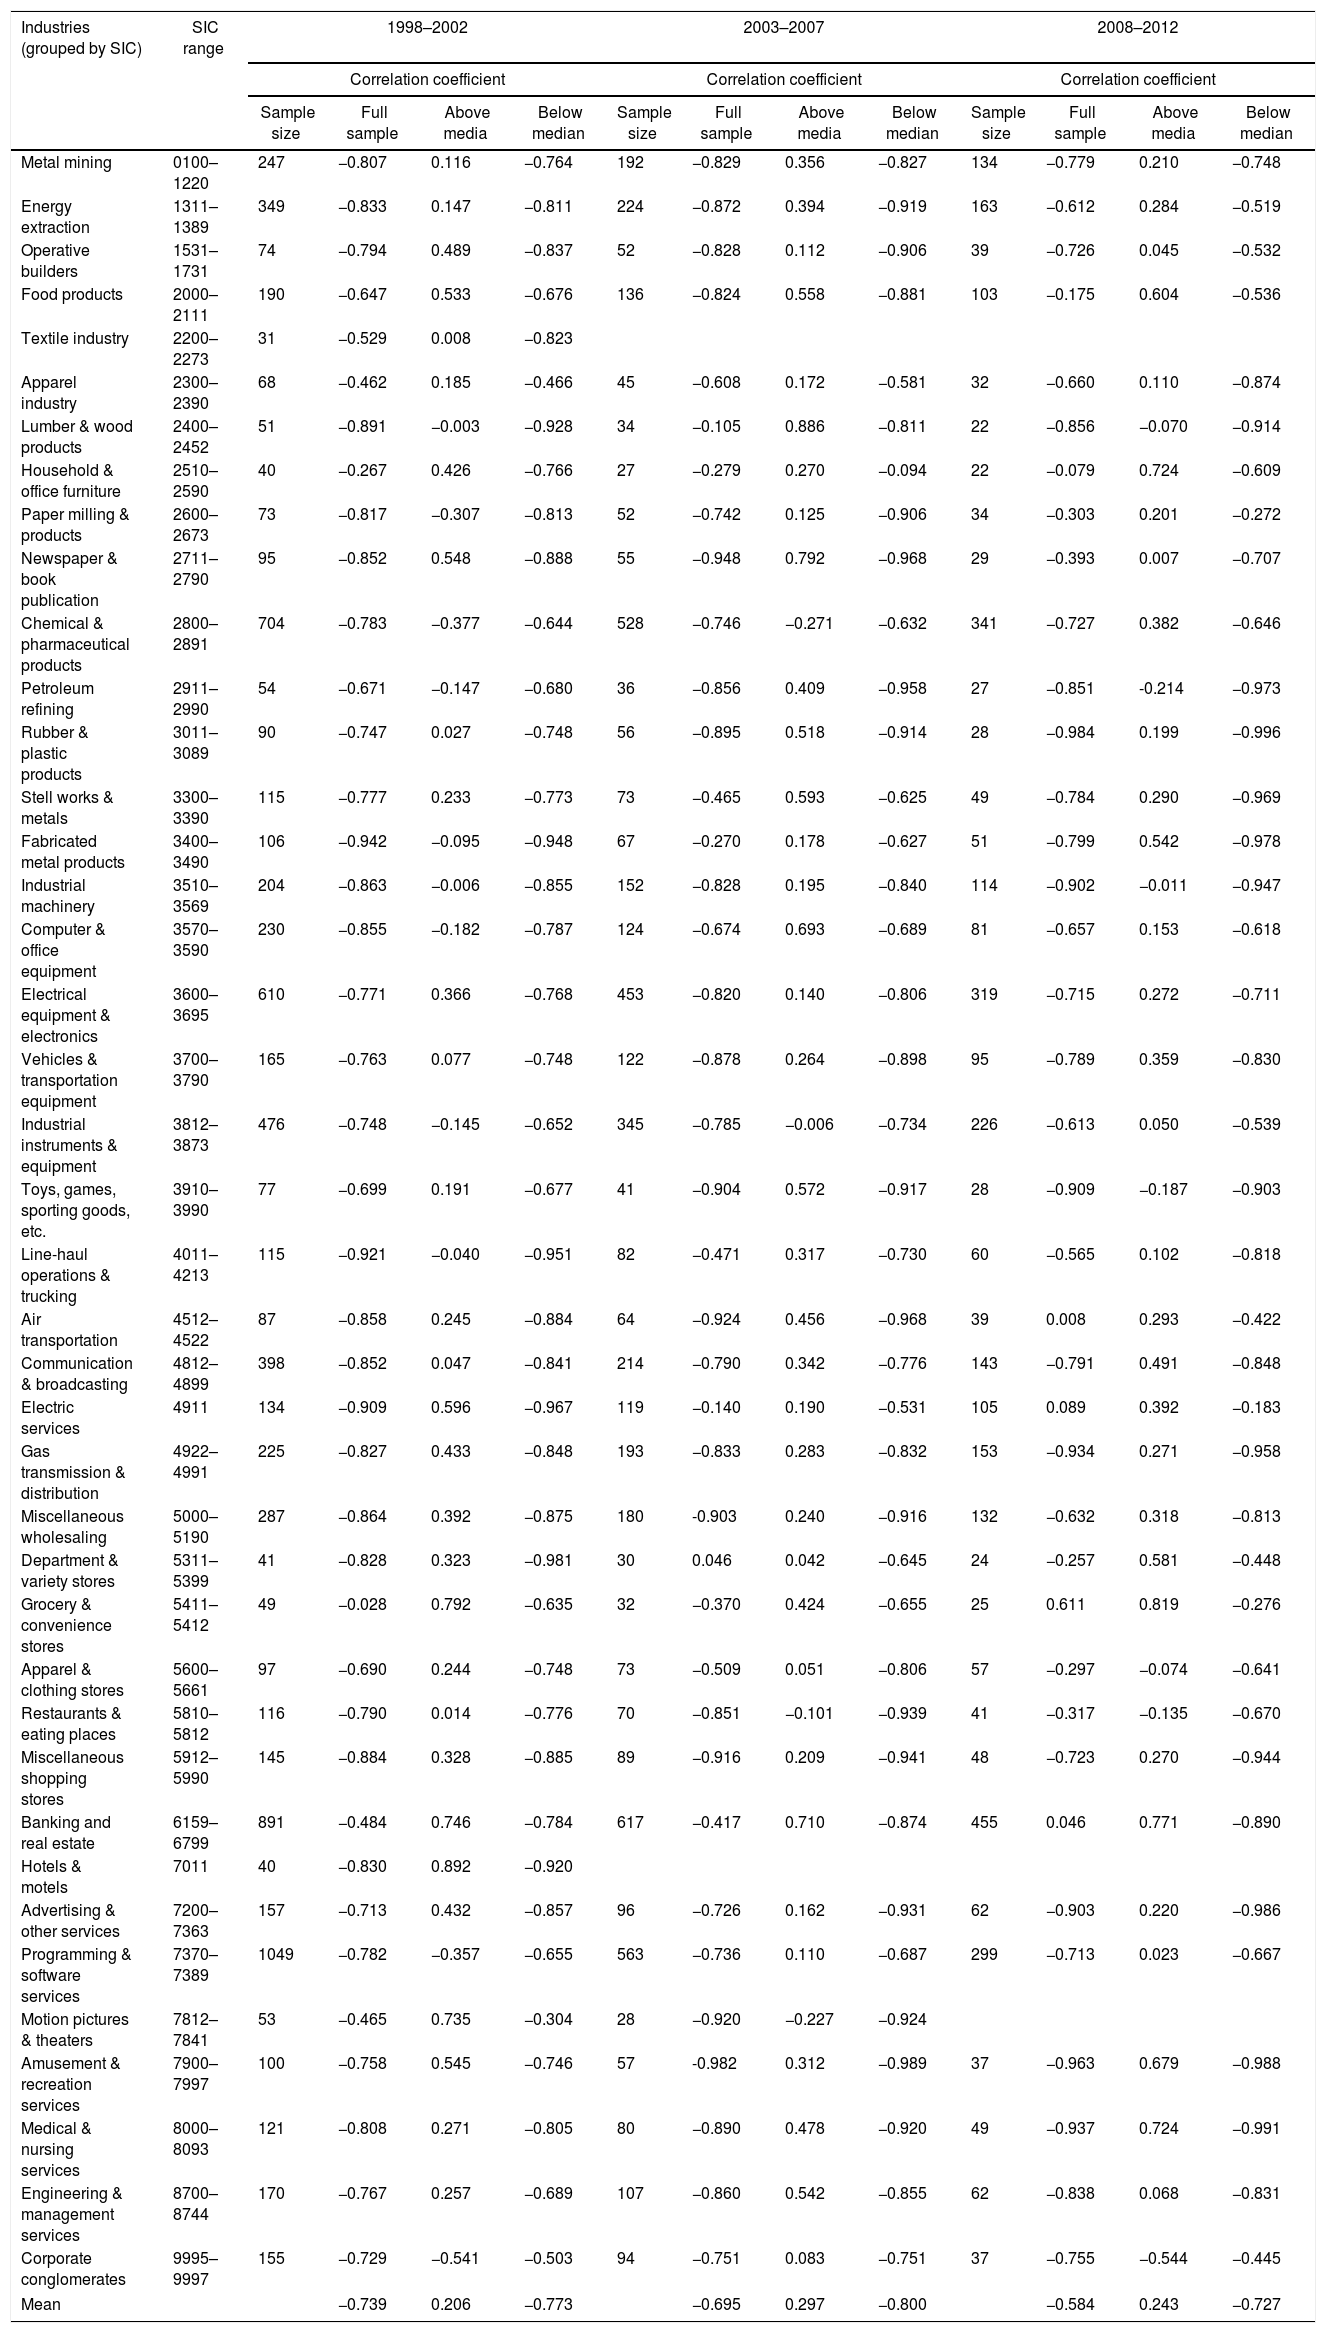
Our replication using Global COMPUSTAT provides results consistent with previous studies (e.g. Andersen & Bettis, 2015; Andersen et al., 2007). However, one might question whether our results will hold in the US sample for period that we used. Hence, we replicated our study using US COMPUSTAT for years between 1998 and 2012. We replicated Tables 2 and 4 in Tables 5 and 7, respectively, for the US sample between 1998 and 2012. The US sample shows a similar pattern.
Empirically observed cross-sectional risk–return relationship for the US sample.
| Industries (grouped by SIC) | SIC range | 1998–2002 | 2003–2007 | 2008–2012 | |||||||||
|---|---|---|---|---|---|---|---|---|---|---|---|---|---|
| Correlation coefficient | Correlation coefficient | Correlation coefficient | |||||||||||
| Sample size | Full sample | Above media | Below median | Sample size | Full sample | Above media | Below median | Sample size | Full sample | Above media | Below median | ||
| Metal mining | 0100–1220 | 247 | −0.807 | 0.116 | −0.764 | 192 | −0.829 | 0.356 | −0.827 | 134 | −0.779 | 0.210 | −0.748 |
| Energy extraction | 1311–1389 | 349 | −0.833 | 0.147 | −0.811 | 224 | −0.872 | 0.394 | −0.919 | 163 | −0.612 | 0.284 | −0.519 |
| Operative builders | 1531–1731 | 74 | −0.794 | 0.489 | −0.837 | 52 | −0.828 | 0.112 | −0.906 | 39 | −0.726 | 0.045 | −0.532 |
| Food products | 2000–2111 | 190 | −0.647 | 0.533 | −0.676 | 136 | −0.824 | 0.558 | −0.881 | 103 | −0.175 | 0.604 | −0.536 |
| Textile industry | 2200–2273 | 31 | −0.529 | 0.008 | −0.823 | ||||||||
| Apparel industry | 2300–2390 | 68 | −0.462 | 0.185 | −0.466 | 45 | −0.608 | 0.172 | −0.581 | 32 | −0.660 | 0.110 | −0.874 |
| Lumber & wood products | 2400–2452 | 51 | −0.891 | −0.003 | −0.928 | 34 | −0.105 | 0.886 | −0.811 | 22 | −0.856 | −0.070 | −0.914 |
| Household & office furniture | 2510–2590 | 40 | −0.267 | 0.426 | −0.766 | 27 | −0.279 | 0.270 | −0.094 | 22 | −0.079 | 0.724 | −0.609 |
| Paper milling & products | 2600–2673 | 73 | −0.817 | −0.307 | −0.813 | 52 | −0.742 | 0.125 | −0.906 | 34 | −0.303 | 0.201 | −0.272 |
| Newspaper & book publication | 2711–2790 | 95 | −0.852 | 0.548 | −0.888 | 55 | −0.948 | 0.792 | −0.968 | 29 | −0.393 | 0.007 | −0.707 |
| Chemical & pharmaceutical products | 2800–2891 | 704 | −0.783 | −0.377 | −0.644 | 528 | −0.746 | −0.271 | −0.632 | 341 | −0.727 | 0.382 | −0.646 |
| Petroleum refining | 2911–2990 | 54 | −0.671 | −0.147 | −0.680 | 36 | −0.856 | 0.409 | −0.958 | 27 | −0.851 | -0.214 | −0.973 |
| Rubber & plastic products | 3011–3089 | 90 | −0.747 | 0.027 | −0.748 | 56 | −0.895 | 0.518 | −0.914 | 28 | −0.984 | 0.199 | −0.996 |
| Stell works & metals | 3300–3390 | 115 | −0.777 | 0.233 | −0.773 | 73 | −0.465 | 0.593 | −0.625 | 49 | −0.784 | 0.290 | −0.969 |
| Fabricated metal products | 3400–3490 | 106 | −0.942 | −0.095 | −0.948 | 67 | −0.270 | 0.178 | −0.627 | 51 | −0.799 | 0.542 | −0.978 |
| Industrial machinery | 3510–3569 | 204 | −0.863 | −0.006 | −0.855 | 152 | −0.828 | 0.195 | −0.840 | 114 | −0.902 | −0.011 | −0.947 |
| Computer & office equipment | 3570–3590 | 230 | −0.855 | −0.182 | −0.787 | 124 | −0.674 | 0.693 | −0.689 | 81 | −0.657 | 0.153 | −0.618 |
| Electrical equipment & electronics | 3600–3695 | 610 | −0.771 | 0.366 | −0.768 | 453 | −0.820 | 0.140 | −0.806 | 319 | −0.715 | 0.272 | −0.711 |
| Vehicles & transportation equipment | 3700–3790 | 165 | −0.763 | 0.077 | −0.748 | 122 | −0.878 | 0.264 | −0.898 | 95 | −0.789 | 0.359 | −0.830 |
| Industrial instruments & equipment | 3812–3873 | 476 | −0.748 | −0.145 | −0.652 | 345 | −0.785 | −0.006 | −0.734 | 226 | −0.613 | 0.050 | −0.539 |
| Toys, games, sporting goods, etc. | 3910–3990 | 77 | −0.699 | 0.191 | −0.677 | 41 | −0.904 | 0.572 | −0.917 | 28 | −0.909 | −0.187 | −0.903 |
| Line-haul operations & trucking | 4011–4213 | 115 | −0.921 | −0.040 | −0.951 | 82 | −0.471 | 0.317 | −0.730 | 60 | −0.565 | 0.102 | −0.818 |
| Air transportation | 4512–4522 | 87 | −0.858 | 0.245 | −0.884 | 64 | −0.924 | 0.456 | −0.968 | 39 | 0.008 | 0.293 | −0.422 |
| Communication & broadcasting | 4812–4899 | 398 | −0.852 | 0.047 | −0.841 | 214 | −0.790 | 0.342 | −0.776 | 143 | −0.791 | 0.491 | −0.848 |
| Electric services | 4911 | 134 | −0.909 | 0.596 | −0.967 | 119 | −0.140 | 0.190 | −0.531 | 105 | 0.089 | 0.392 | −0.183 |
| Gas transmission & distribution | 4922–4991 | 225 | −0.827 | 0.433 | −0.848 | 193 | −0.833 | 0.283 | −0.832 | 153 | −0.934 | 0.271 | −0.958 |
| Miscellaneous wholesaling | 5000–5190 | 287 | −0.864 | 0.392 | −0.875 | 180 | -0.903 | 0.240 | −0.916 | 132 | −0.632 | 0.318 | −0.813 |
| Department & variety stores | 5311–5399 | 41 | −0.828 | 0.323 | −0.981 | 30 | 0.046 | 0.042 | −0.645 | 24 | −0.257 | 0.581 | −0.448 |
| Grocery & convenience stores | 5411–5412 | 49 | −0.028 | 0.792 | −0.635 | 32 | −0.370 | 0.424 | −0.655 | 25 | 0.611 | 0.819 | −0.276 |
| Apparel & clothing stores | 5600–5661 | 97 | −0.690 | 0.244 | −0.748 | 73 | −0.509 | 0.051 | −0.806 | 57 | −0.297 | −0.074 | −0.641 |
| Restaurants & eating places | 5810–5812 | 116 | −0.790 | 0.014 | −0.776 | 70 | −0.851 | −0.101 | −0.939 | 41 | −0.317 | −0.135 | −0.670 |
| Miscellaneous shopping stores | 5912–5990 | 145 | −0.884 | 0.328 | −0.885 | 89 | −0.916 | 0.209 | −0.941 | 48 | −0.723 | 0.270 | −0.944 |
| Banking and real estate | 6159–6799 | 891 | −0.484 | 0.746 | −0.784 | 617 | −0.417 | 0.710 | −0.874 | 455 | 0.046 | 0.771 | −0.890 |
| Hotels & motels | 7011 | 40 | −0.830 | 0.892 | −0.920 | ||||||||
| Advertising & other services | 7200–7363 | 157 | −0.713 | 0.432 | −0.857 | 96 | −0.726 | 0.162 | −0.931 | 62 | −0.903 | 0.220 | −0.986 |
| Programming & software services | 7370–7389 | 1049 | −0.782 | −0.357 | −0.655 | 563 | −0.736 | 0.110 | −0.687 | 299 | −0.713 | 0.023 | −0.667 |
| Motion pictures & theaters | 7812–7841 | 53 | −0.465 | 0.735 | −0.304 | 28 | −0.920 | −0.227 | −0.924 | ||||
| Amusement & recreation services | 7900–7997 | 100 | −0.758 | 0.545 | −0.746 | 57 | -0.982 | 0.312 | −0.989 | 37 | −0.963 | 0.679 | −0.988 |
| Medical & nursing services | 8000–8093 | 121 | −0.808 | 0.271 | −0.805 | 80 | −0.890 | 0.478 | −0.920 | 49 | −0.937 | 0.724 | −0.991 |
| Engineering & management services | 8700–8744 | 170 | −0.767 | 0.257 | −0.689 | 107 | −0.860 | 0.542 | −0.855 | 62 | −0.838 | 0.068 | −0.831 |
| Corporate conglomerates | 9995–9997 | 155 | −0.729 | −0.541 | −0.503 | 94 | −0.751 | 0.083 | −0.751 | 37 | −0.755 | −0.544 | −0.445 |
| Mean | −0.739 | 0.206 | −0.773 | −0.695 | 0.297 | −0.800 | −0.584 | 0.243 | −0.727 | ||||
Similar patterns are observed with Henkel's (2009) correction in Table 6. Consistent with past work, we find a negative risk–return relationship and such relationship is more pronounced in samples with relatively lower performance. Furthermore, longitudinal correlations are weaker than cross-sectional correlations. Similar to Fig. 1, for US firms, Fig. 2 presents the cross-sectional (Table 5) and longitudinal (Table 7) relationship between performance and variance in performance and the risk–return relationship for firms with performance above or below industry median (Table 7).
Correction for spuriousness (Henkel, 2009) – Empirically observed cross-sectional risk–return relationship for the US sample.
| Industries (grouped by SIC) | SIC range | 1998–2002 | 2003–2007 | 2008–2012 | ||||||||||||
|---|---|---|---|---|---|---|---|---|---|---|---|---|---|---|---|---|
| Correlation coefficient | Correlation coefficient | Correlation coefficient | ||||||||||||||
| Sample size | Full sample | Corrected coef | Spurious effect | % of inflation | Sample size | Full sample | Corrected coef | Spurious effect | % of inflation | Sample size | Full sample | Corrected coef | Spurious effect | % of inflation | ||
| Metal mining | 0100–1220 | 247 | −0.807 | −0.601 | −0.207 | 25.58% | 192 | −0.829 | −0.584 | −0.245 | 29.53% | 134 | −0.779 | −0.647 | −0.132 | 16.89% |
| Energy extraction | 1311–1389 | 349 | −0.833 | −0.274 | −0.559 | 67.10% | 224 | −0.872 | −0.478 | −0.394 | 45.21% | 163 | −0.612 | −0.401 | −0.211 | 34.51% |
| Operative builders | 1531–1731 | 74 | −0.794 | −0.801 | 0.008 | −0.98% | 52 | −0.828 | −0.901 | 0.072 | −8.70% | 39 | −0.726 | −0.481 | −0.245 | 33.73% |
| Food products | 2000–2111 | 190 | −0.647 | −0.127 | −0.519 | 80.30% | 136 | −0.824 | −0.683 | −0.141 | 17.10% | 103 | −0.175 | 0.241 | −0.415 | 237.93% |
| Textile industry | 2200–2273 | 31 | −0.529 | −0.496 | −0.033 | 6.28% | ||||||||||
| Apparel industry | 2300–2390 | 68 | −0.462 | −0.194 | −0.268 | 58.05% | 45 | −0.608 | −0.409 | −0.199 | 32.77% | 32 | −0.660 | −0.012 | −0.648 | 98.23% |
| Lumber & wood products | 2400–2452 | 51 | −0.891 | −0.071 | −0.820 | 92.08% | 34 | −0.105 | 0.126 | −0.230 | 220.19% | 22 | −0.856 | −0.090 | −0.766 | 89.43% |
| Household & office furniture | 2510–2590 | 40 | −0.267 | 0.300 | −0.567 | 212.58% | 27 | −0.279 | −0.273 | −0.006 | 2.33% | 22 | −0.079 | 0.453 | −0.532 | 672.97% |
| Paper milling & products | 2600–2673 | 73 | −0.817 | −0.602 | −0.216 | 26.38% | 52 | −0.742 | −0.087 | −0.655 | 88.30% | 34 | −0.303 | −0.214 | −0.090 | 29.55% |
| Newspaper & book publication | 2711–2790 | 95 | −0.852 | −0.822 | −0.030 | 3.52% | 55 | −0.948 | −0.424 | −0.524 | 55.30% | 29 | −0.393 | −0.458 | 0.065 | −16.49% |
| Chemical & pharmaceutical products | 2800–2891 | 704 | −0.783 | −0.579 | −0.204 | 26.08% | 528 | −0.746 | −0.527 | −0.219 | 29.30% | 341 | −0.727 | −0.557 | −0.170 | 23.35% |
| Petroleum refining | 2911–2990 | 54 | −0.671 | −0.709 | 0.038 | −5.60% | 36 | −0.856 | 0.066 | −0.922 | 107.74% | 27 | −0.851 | −0.246 | −0.605 | 71.14% |
| Rubber & plastic products | 3011–3089 | 90 | −0.747 | −0.557 | −0.191 | 25.51% | 56 | −0.895 | −0.803 | −0.093 | 10.36% | 28 | −0.984 | 0.626 | -1.610 | 163.62% |
| Stell works & metals | 3300–3390 | 115 | −0.777 | −0.337 | −0.440 | 56.59% | 73 | −0.465 | −0.165 | −0.300 | 64.55% | 49 | −0.784 | −0.054 | −0.730 | 93.10% |
| Fabricated metal products | 3400–3490 | 106 | −0.942 | −0.870 | −0.072 | 7.68% | 67 | −0.270 | 0.182 | −0.452 | 167.40% | 51 | −0.799 | −0.100 | −0.699 | 87.45% |
| Industrial machinery | 3510–3569 | 204 | −0.863 | −0.582 | −0.280 | 32.51% | 152 | −0.828 | −0.419 | −0.409 | 49.35% | 114 | −0.902 | −0.108 | −0.793 | 87.97% |
| Computer & office equipment | 3570–3590 | 230 | −0.855 | −0.364 | −0.491 | 57.47% | 124 | −0.674 | 0.041 | −0.715 | 106.09% | 81 | −0.657 | −0.350 | −0.307 | 46.78% |
| Electrical equipment & electronics | 3600–3695 | 610 | −0.771 | −0.641 | −0.130 | 16.85% | 453 | −0.820 | −0.712 | −0.108 | 13.16% | 319 | −0.715 | −0.475 | −0.239 | 33.49% |
| Vehicles & transportation equipment | 3700–3790 | 165 | −0.763 | −0.613 | −0.150 | 19.61% | 122 | −0.878 | −0.716 | −0.162 | 18.42% | 95 | −0.789 | 0.022 | −0.811 | 102.83% |
| Industrial instruments & equipment | 3812–3873 | 476 | −0.748 | −0.099 | −0.649 | 86.77% | 345 | −0.785 | −0.608 | −0.177 | 22.51% | 226 | −0.613 | 0.335 | −0.948 | 154.65% |
| Toys, games, sporting goods, etc. | 3910–3990 | 77 | −0.699 | −0.656 | −0.044 | 6.28% | 41 | −0.904 | −0.143 | −0.762 | 84.23% | 28 | −0.909 | −0.555 | −0.354 | 38.97% |
| Line-haul operations & trucking | 4011–4213 | 115 | −0.921 | −0.797 | −0.124 | 13.45% | 82 | −0.471 | −0.515 | 0.044 | −9.37% | 60 | −0.565 | −0.553 | −0.013 | 2.22% |
| Air transportation | 4512–4522 | 87 | −0.858 | 0.251 | −1.110 | 129.28% | 64 | −0.924 | 0.042 | −0.966 | 104.51% | 39 | 0.008 | −0.023 | 0.031 | 399.39% |
| Communication & broadcasting | 4812–4899 | 398 | −0.852 | −0.595 | −0.257 | 30.17% | 214 | −0.790 | −0.510 | −0.280 | 35.42% | 143 | −0.791 | −0.027 | −0.764 | 96.55% |
| Electric services | 4911 | 134 | −0.909 | −0.284 | −0.625 | 68.78% | 119 | −0.140 | −0.062 | −0.079 | 55.99% | 105 | 0.089 | 0.097 | −0.009 | −9.89% |
| Gas transmission & distribution | 4922–4991 | 225 | −0.827 | −0.713 | −0.114 | 13.81% | 193 | −0.833 | −0.687 | −0.146 | 17.50% | 153 | −0.934 | −0.408 | −0.526 | 56.28% |
| Miscellaneous wholesaling | 5000–5190 | 287 | −0.864 | −0.688 | −0.176 | 20.35% | 180 | −0.903 | 0.168 | −1.072 | 118.65% | 132 | −0.632 | −0.655 | 0.023 | −3.65% |
| Department & variety stores | 5311–5399 | 41 | −0.828 | −0.200 | −0.629 | 75.89% | 30 | 0.046 | 0.015 | 0.031 | 67.55% | 24 | −0.257 | −0.183 | −0.074 | 28.75% |
| Grocery & convenience stores | 5411–5412 | 49 | −0.028 | −0.051 | 0.023 | −81.63% | 32 | −0.370 | −0.442 | 0.072 | −19.41% | 25 | 0.611 | 0.797 | −0.186 | −30.39% |
| Apparel & clothing stores | 5600–5661 | 97 | −0.690 | −0.169 | −0.521 | 75.51% | 73 | −0.509 | −0.380 | −0.129 | 25.27% | 57 | −0.297 | −0.349 | 0.052 | −17.62% |
| Restaurants & eating places | 5810–5812 | 116 | −0.790 | −0.801 | 0.011 | −1.39% | 70 | −0.851 | −0.479 | −0.372 | 43.73% | 41 | −0.317 | 0.083 | −0.400 | 125.99% |
| Miscellaneous shopping stores | 5912–5990 | 145 | −0.884 | −0.690 | −0.195 | 22.01% | 89 | −0.916 | −0.397 | −0.518 | 56.62% | 48 | −0.723 | 0.345 | −1.069 | 147.76% |
| Hotels & motels | 7011 | 40 | −0.830 | 0.149 | −0.979 | 118.00% | ||||||||||
| Advertising & other services | 7200–7363 | 157 | −0.713 | −0.349 | −0.364 | 51.06% | 96 | −0.726 | −0.053 | −0.673 | 92.70% | 62 | −0.903 | 0.303 | −1.206 | 133.54% |
| Programming & software services | 7370–7389 | 1049 | −0.782 | −0.292 | −0.489 | 62.60% | 563 | −0.736 | −0.692 | −0.044 | 6.02% | 299 | −0.713 | −0.605 | −0.108 | 15.16% |
| Motion pictures & theaters | 7812–7841 | 53 | −0.465 | −0.628 | 0.163 | −34.96% | 28 | −0.920 | −0.760 | −0.160 | 17.35% | |||||
| Amusement & recreation services | 7900–7997 | 100 | −0.758 | −0.783 | 0.025 | −3.25% | 57 | −0.982 | −0.883 | −0.099 | 10.03% | 37 | −0.963 | 0.470 | −1.433 | 148.82% |
| Medical & nursing services | 8000–8093 | 121 | −0.808 | −0.324 | −0.484 | 59.92% | 80 | −0.890 | −0.144 | −0.746 | 83.87% | 49 | −0.937 | −0.321 | −0.616 | 65.76% |
| Engineering & management services | 8700–8744 | 170 | −0.767 | −0.693 | −0.074 | 9.64% | 107 | −0.860 | −0.547 | −0.314 | 36.45% | 62 | −0.838 | −0.661 | −0.177 | 21.17% |
| Corporate conglomerates | 9995–9997 | 155 | −0.729 | −0.564 | −0.166 | 22.71% | 94 | −0.751 | −0.506 | −0.245 | 32.61% | 37 | −0.755 | −0.846 | 0.091 | −12.02% |

Empirically observed longitudinala risk–return relationship for US sample.
| Industries (grouped by SIC) | SIC range | 1998–2007 | 2003–2012 | ||||||
|---|---|---|---|---|---|---|---|---|---|
| Correlation coefficient | Correlation coefficient | ||||||||
| Sample size | Full sample | Above media | Below median | Sample size | Full sample | Above media | Below median | ||
| Metal mining | 0100–1220 | 192 | −0.470 | −0.113 | −0.362 | 132 | −0.354 | −0.161 | −0.169 |
| Energy extraction | 1311–1389 | 224 | −0.408 | −0.143 | −0.316 | 162 | −0.393 | −0.005 | −0.413 |
| Operative builders | 1531–1731 | 52 | −0.399 | 0.330 | −0.470 | 39 | −0.060 | −0.201 | 0.041 |
| Food products | 2000–2111 | 136 | −0.798 | 0.249 | −0.842 | 103 | −0.209 | 0.366 | −0.506 |
| Apparel industry | 2300–2390 | 45 | −0.595 | 0.013 | −0.724 | 32 | −0.120 | 0.503 | 0.027 |
| Lumber & wood products | 2400–2452 | 34 | −0.764 | 0.433 | −0.922 | 25 | −0.807 | 0.103 | −0.940 |
| Household & office furniture | 2510–2590 | 27 | 0.304 | 0.275 | −0.064 | 27 | 0.390 | 0.740 | 0.134 |
| Paper milling & products | 2600–2673 | 52 | −0.773 | −0.040 | −0.779 | 34 | −0.560 | −0.352 | −0.737 |
| Newspaper & book publication | 2711–2790 | 55 | −0.876 | 0.785 | −0.913 | 29 | −0.551 | −0.067 | −0.877 |
| Chemical & pharmaceutical products | 2800–2891 | 528 | −0.514 | −0.316 | −0.313 | 341 | −0.485 | −0.241 | −0.186 |
| Petroleum refining | 2911–2990 | 36 | −0.724 | −0.018 | −0.733 | 27 | −0.843 | −0.311 | −0.969 |
| Rubber & plastic products | 3011–3089 | 56 | −0.436 | −0.087 | −0.343 | 28 | −0.869 | 0.334 | −0.851 |
| Stell works & metals | 3300–3390 | 73 | −0.492 | −0.404 | −0.385 | 48 | −0.424 | 0.588 | −0.716 |
| Fabricated metal products | 3400–3490 | 67 | −0.586 | −0.204 | −0.560 | 51 | −0.176 | 0.378 | −0.150 |
| Industrial machinery | 3510–3569 | 152 | −0.899 | −0.120 | −0.906 | 114 | −0.895 | 0.182 | −0.935 |
| Computer & office equipment | 3570–3590 | 124 | −0.609 | −0.104 | −0.450 | 81 | −0.500 | −0.105 | −0.416 |
| Electrical equipment & electronics | 3600–3695 | 453 | −0.526 | −0.016 | −0.458 | 319 | −0.611 | 0.028 | −0.585 |
| Vehicles & transportation equipment | 3700–3790 | 122 | −0.728 | 0.181 | −0.728 | 95 | −0.496 | 0.290 | −0.522 |
| Industrial instruments & equipment | 3812–3873 | 345 | −0.630 | −0.314 | −0.520 | 226 | −0.549 | −0.152 | −0.448 |
| Toys, games, sporting goods, etc. | 3910–3990 | 41 | −0.311 | 0.590 | −0.212 | 28 | −0.985 | −0.157 | −0.992 |
| Line-haul operations & trucking | 4011–4213 | 82 | −0.552 | 0.088 | −0.566 | 60 | 0.217 | 0.285 | 0.130 |
| Air transportation | 4512–4522 | 64 | −0.470 | 0.207 | −0.437 | 39 | 0.123 | 0.683 | 0.056 |
| Communication & broadcasting | 4812–4899 | 214 | −0.692 | 0.240 | −0.655 | 143 | −0.842 | 0.582 | −0.871 |
| Electric services | 4911 | 119 | −0.225 | 0.017 | −0.175 | 105 | 0.048 | 0.282 | −0.219 |
| Gas transmission & distribution | 4922–4991 | 193 | −0.732 | 0.427 | −0.755 | 153 | −0.769 | 0.368 | −0.774 |
| Miscellaneous wholesaling | 5000–5190 | 180 | −0.641 | 0.053 | −0.616 | 132 | −0.649 | 0.097 | −0.679 |
| Department & variety stores | 5311–5399 | 30 | −0.616 | 0.541 | −0.974 | 24 | 0.083 | −0.185 | −0.216 |
| Grocery & convenience stores | 5411–5412 | 32 | 0.110 | 0.297 | 0.021 | 25 | 0.316 | 0.652 | −0.826 |
| Apparel & clothing stores | 5600–5661 | 73 | −0.021 | −0.032 | −0.170 | 57 | 0.012 | 0.080 | −0.391 |
| Restaurants & eating places | 5810–5812 | 70 | −0.753 | 0.165 | −0.908 | 41 | −0.192 | 0.122 | −0.308 |
| Miscellaneous shopping stores | 5912–5990 | 89 | −0.648 | −0.089 | −0.680 | 48 | −0.139 | 0.112 | 0.017 |
| Banking and real estate | 6159–6799 | 617 | −0.313 | 0.719 | −0.544 | 455 | 0.232 | 0.839 | −0.491 |
| Advertising & other services | 7200–7363 | 96 | −0.222 | 0.247 | −0.202 | 62 | −0.327 | 0.327 | −0.768 |
| Programming & software services | 7370–7389 | 563 | −0.531 | −0.199 | −0.399 | 298 | −0.572 | −0.067 | −0.500 |
| Motion pictures & theaters | 7812–7841 | 28 | −0.405 | 0.135 | −0.169 | ||||
| Amusement & recreation services | 7900–7997 | 57 | −0.581 | −0.085 | −0.864 | 35 | −0.587 | −0.040 | −0.450 |
| Medical & nursing services | 8000–8093 | 80 | −0.657 | 0.327 | −0.642 | 48 | −0.595 | 0.432 | −0.753 |
| Engineering & management services | 8700–8744 | 107 | −0.704 | 0.215 | −0.594 | 62 | −0.888 | 0.243 | −0.884 |
| Corporate conglomerates | 9995–9997 | 94 | −0.500 | −0.303 | −0.321 | 36 | −0.458 | −0.440 | −0.576 |
| Mean | −0.523 | 0.101 | −0.529 | −0.381 | 0.161 | −0.492 | |||
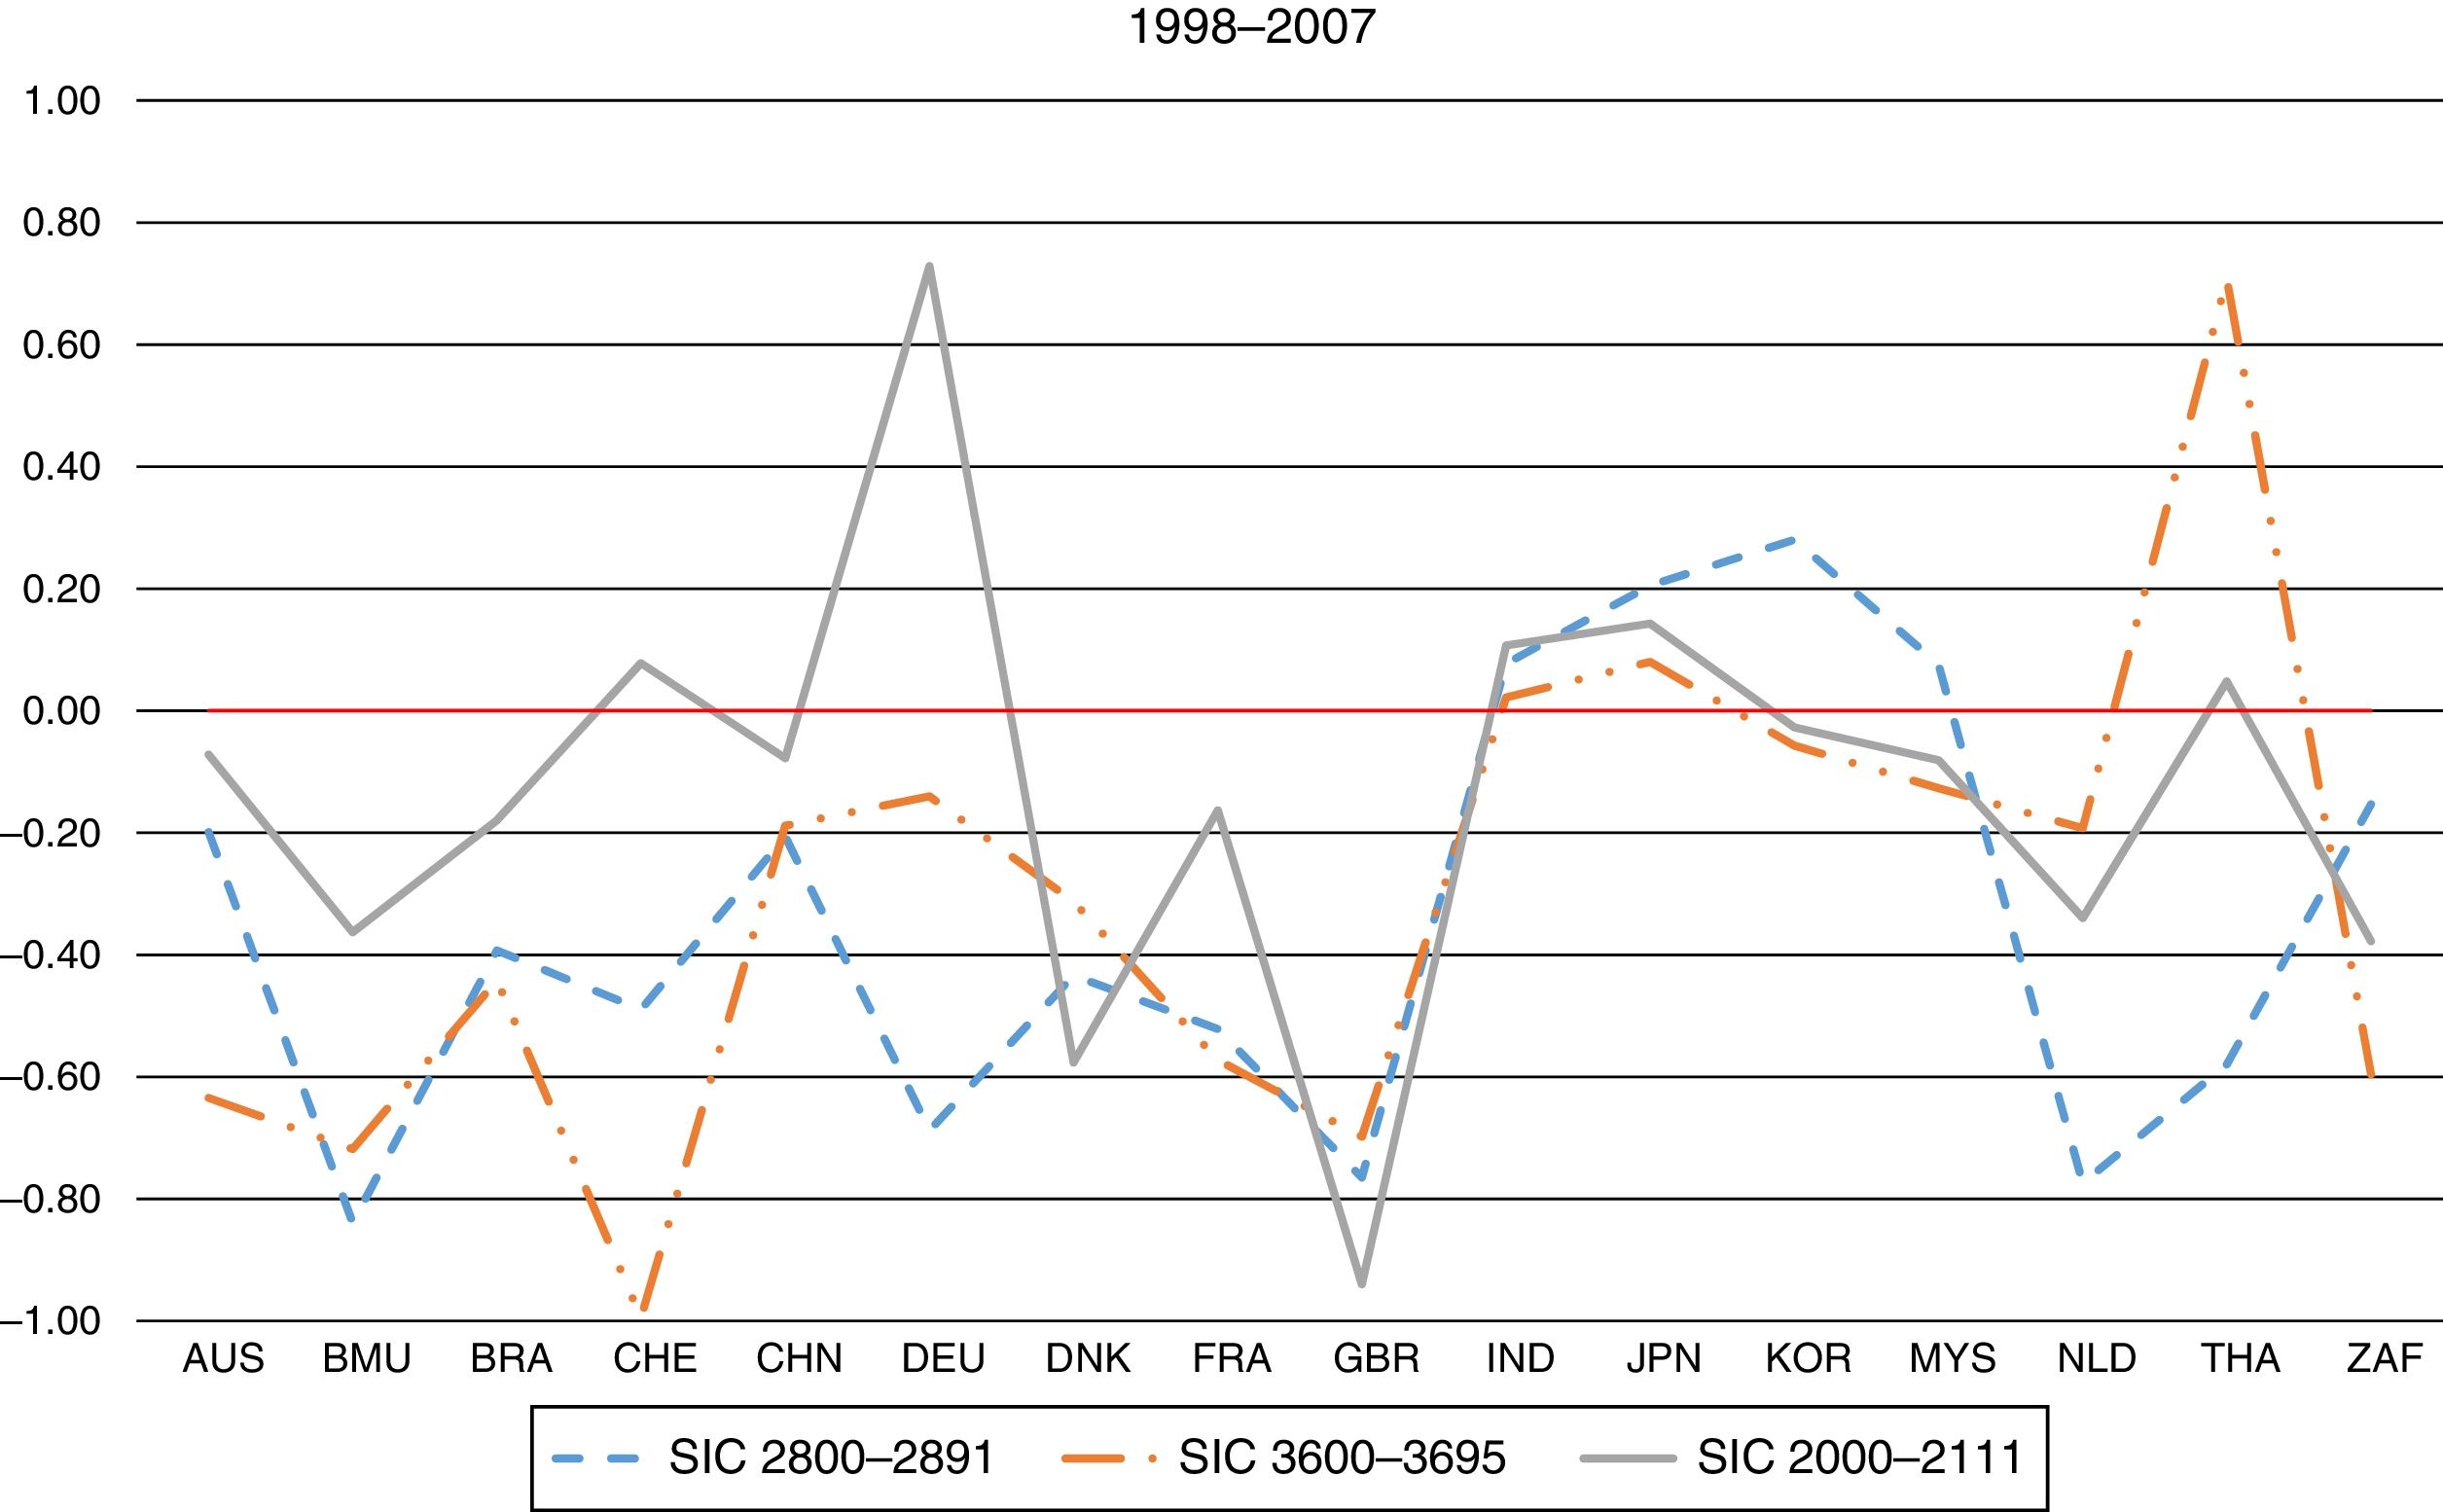
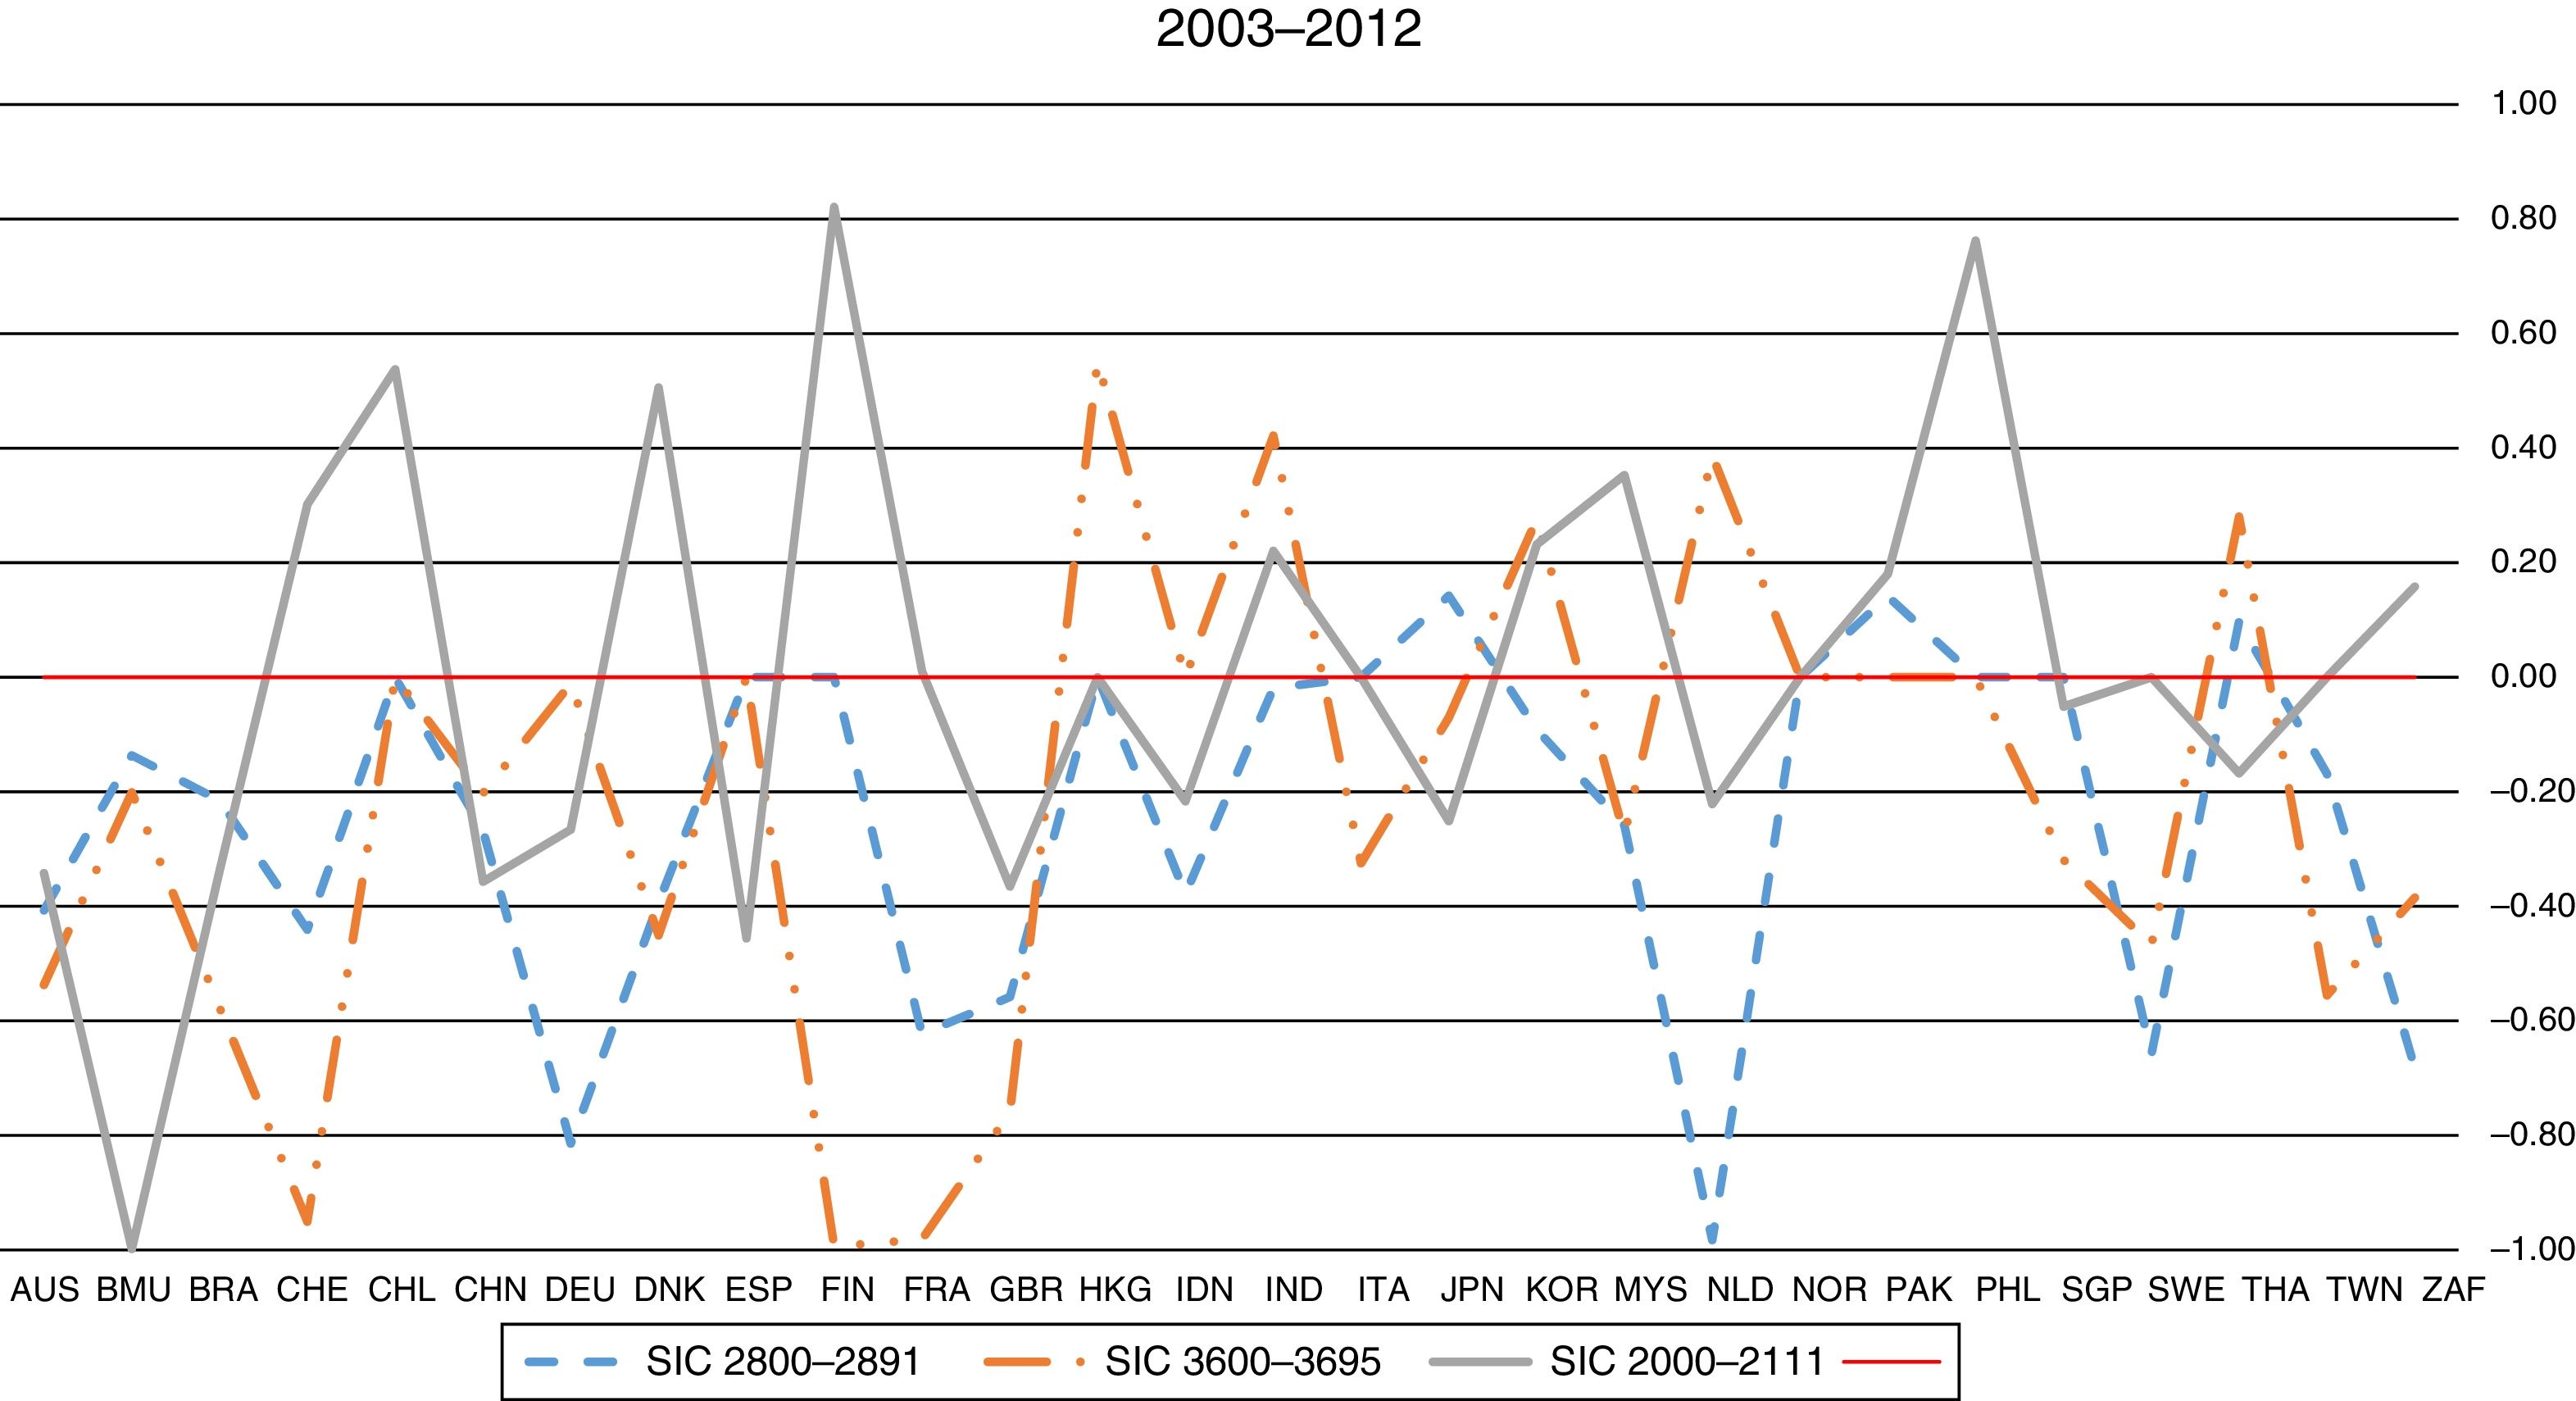
We further checked our analyses for country-specific heterogeneity. Given some countries covered relatively few cases (e.g., 100 cases), we focused on countries with relatively large sample size to calculate longitudinal risk–return relationship. Overall, countries like Australia, England, and most others showed that most industries have negative risk–return relationship. In AppendixFigs. A.1 and A.2, we present country-level results related to for longitudinal risk–return relationships between 1998 and 2007 and between 2003 and 2012. Figs. A.1 and A.2 show that most of correlations are below zero. In certain countries and in certain industries, the correlation is positive. Specifically, India, Japan and Korea have positive risk–return correlation for most of the periods and across industries, but the remaining countries have negative correlation across industries. For example, in Japan 19 out of 37 industries showed positive risk return relationships. Future research might consider the country-specific difference in affecting the risk–return relationship. Overall, Bowman's paradox is broadly supported under different sample and statistical specifications.
ConclusionThe phenomenon of Bowman's risk paradox has for long intrigued strategic management scholars. Bowman's risk paradox refers to the negative relationship between mean and variance in accounting performance. To ascertain the boundary conditions of this phenomenon, predominantly studied in the US context, we replicated Bowman's risk paradox across 12,235 firms from 28 countries in Asia, Europe, and South Africa during the period between 1998 and 2012. We assessed risk–return relationship using contemporaneous (1998–2002; 2003–2007; 2008–2012) and longitudinal (from 1998 to 2007 and from 2003 to 2012) sampling frames. Based on recent work, we also corrected for spuriousness, resulting from right skewness in performance, in risk–return relationship.
In diverse country settings, firms performing below industry median have negative relationship between risk and return, whereas firms performing above industry median have positive relationship between risk and return. These findings are consistent with prospect theory and behavioral theory explanations, and do not support variation in the relationship based on country-related factors, The replication indicates that Bowman's risk paradox phenomenon is broadly supported across a wide range of countries. However, there are some exceptions to the overall results. For instance, many industries in India, Japan, and Korea show positive correlations between risk and return. Future studies could take a closer look at why such differences arise. We hope that our study serves to deepen our understanding in explaining the relationship between accounting based risk and return.
Distribution of firms across countries and industries.
| Industries (grouped by SIC) | SIC range | AUS | BMU | BRA | CHE | CHL | CHN | DEU | DNK | ESP | FIN | FRA | GBR | HKG | IDN | IND | ITA | JPN | KOR | MYS | NLD | NOR | PAK | PHL | SGP | SWE | THA | TWN | ZAF | Total |
|---|---|---|---|---|---|---|---|---|---|---|---|---|---|---|---|---|---|---|---|---|---|---|---|---|---|---|---|---|---|---|
| Metal mining | 0100–1220 | 238 | 13 | 5 | 0 | 9 | 43 | 2 | 0 | 2 | 0 | 11 | 43 | 0 | 14 | 9 | 2 | 5 | 1 | 26 | 0 | 1 | 0 | 12 | 0 | 5 | 7 | 0 | 26 | 474 |
| Energy extraction | 1311–1389 | 57 | 1 | 0 | 1 | 0 | 3 | 0 | 1 | 0 | 0 | 5 | 25 | 2 | 1 | 7 | 1 | 3 | 0 | 6 | 2 | 20 | 2 | 5 | 4 | 0 | 1 | 0 | 2 | 149 |
| Operative builders | 1531–1731 | 11 | 11 | 4 | 2 | 1 | 10 | 7 | 4 | 8 | 1 | 12 | 21 | 0 | 2 | 21 | 8 | 125 | 13 | 30 | 4 | 1 | 0 | 2 | 5 | 2 | 6 | 2 | 5 | 318 |
| Food products | 2000–2111 | 30 | 9 | 15 | 12 | 17 | 51 | 26 | 9 | 10 | 6 | 37 | 44 | 4 | 26 | 97 | 4 | 124 | 15 | 52 | 7 | 5 | 20 | 15 | 11 | 5 | 32 | 2 | 8 | 693 |
| Textile industry | 2200–2273 | 0 | 6 | 13 | 1 | 2 | 35 | 8 | 2 | 2 | 1 | 8 | 12 | 2 | 13 | 113 | 6 | 41 | 10 | 6 | 3 | 0 | 18 | 0 | 0 | 2 | 8 | 9 | 0 | 321 |
| Apparel industry | 2300–2390 | 3 | 9 | 8 | 2 | 0 | 11 | 11 | 2 | 3 | 0 | 11 | 15 | 5 | 6 | 20 | 6 | 31 | 13 | 8 | 2 | 0 | 1 | 0 | 1 | 1 | 4 | 0 | 4 | 177 |
| Lumber & wood products | 2400–2452 | 6 | 4 | 2 | 0 | 3 | 2 | 6 | 1 | 1 | 1 | 8 | 0 | 0 | 4 | 12 | 0 | 14 | 1 | 31 | 0 | 0 | 0 | 0 | 3 | 6 | 2 | 0 | 0 | 107 |
| Household & office furniture | 2510–2590 | 1 | 0 | 0 | 0 | 1 | 2 | 2 | 1 | 1 | 1 | 1 | 7 | 0 | 1 | 2 | 1 | 14 | 0 | 11 | 3 | 3 | 0 | 0 | 1 | 2 | 4 | 0 | 0 | 59 |
| Paper milling & products | 2600–2673 | 5 | 8 | 9 | 7 | 3 | 20 | 8 | 3 | 6 | 9 | 10 | 13 | 2 | 6 | 33 | 4 | 38 | 6 | 18 | 3 | 1 | 5 | 1 | 4 | 8 | 14 | 4 | 6 | 254 |
| Newspaper & book publication | 2711–2790 | 7 | 3 | 1 | 0 | 1 | 4 | 4 | 4 | 0 | 3 | 2 | 28 | 1 | 0 | 5 | 5 | 22 | 0 | 8 | 3 | 5 | 0 | 1 | 5 | 4 | 3 | 0 | 1 | 120 |
| Chemical & pharmaceutical products | 2800–2891 | 40 | 15 | 19 | 18 | 5 | 191 | 41 | 14 | 5 | 4 | 29 | 73 | 2 | 19 | 192 | 5 | 194 | 28 | 19 | 7 | 2 | 22 | 3 | 6 | 12 | 12 | 17 | 7 | 1,001 |
| Petroleum refining | 2911–2990 | 2 | 0 | 3 | 1 | 0 | 15 | 2 | 0 | 2 | 0 | 4 | 4 | 1 | 0 | 11 | 2 | 10 | 3 | 4 | 2 | 1 | 4 | 0 | 1 | 0 | 3 | 1 | 2 | 78 |
| Rubber & plastic products | 3011–3089 | 6 | 4 | 2 | 3 | 2 | 20 | 13 | 0 | 1 | 4 | 9 | 11 | 2 | 11 | 44 | 3 | 49 | 7 | 21 | 1 | 0 | 2 | 1 | 6 | 3 | 14 | 7 | 2 | 248 |
| Stell works & metals | 3300–3390 | 10 | 7 | 16 | 6 | 6 | 78 | 13 | 0 | 5 | 4 | 11 | 10 | 3 | 13 | 99 | 4 | 91 | 14 | 27 | 2 | 3 | 2 | 0 | 5 | 4 | 7 | 5 | 3 | 448 |
| Fabricated metal products | 3400–3490 | 8 | 2 | 11 | 6 | 1 | 11 | 11 | 0 | 2 | 2 | 14 | 20 | 3 | 4 | 33 | 1 | 59 | 6 | 17 | 3 | 3 | 2 | 1 | 9 | 7 | 5 | 2 | 0 | 243 |
| Industrial machinery | 3510–3569 | 11 | 5 | 9 | 26 | 0 | 57 | 59 | 9 | 3 | 13 | 19 | 22 | 4 | 1 | 40 | 5 | 168 | 4 | 11 | 5 | 3 | 2 | 0 | 16 | 12 | 2 | 3 | 0 | 509 |
| Computer & office equipment | 3570–3590 | 11 | 5 | 4 | 3 | 0 | 25 | 13 | 2 | 1 | 0 | 13 | 17 | 2 | 0 | 11 | 2 | 63 | 4 | 5 | 0 | 1 | 0 | 0 | 9 | 4 | 2 | 20 | 0 | 217 |
| Electrical equipment & electronics | 3600–3695 | 20 | 39 | 7 | 13 | 1 | 94 | 41 | 9 | 2 | 7 | 30 | 49 | 7 | 2 | 53 | 10 | 211 | 29 | 32 | 8 | 9 | 1 | 3 | 33 | 20 | 7 | 41 | 11 | 789 |
| Vehicles & transportation equipment | 3700–3790 | 8 | 3 | 14 | 1 | 0 | 56 | 18 | 1 | 1 | 0 | 17 | 24 | 1 | 4 | 53 | 7 | 120 | 17 | 23 | 2 | 2 | 8 | 1 | 8 | 8 | 1 | 3 | 3 | 404 |
| Industrial instruments & equipment | 3812–3873 | 20 | 7 | 2 | 11 | 0 | 13 | 22 | 6 | 1 | 3 | 20 | 39 | 1 | 1 | 6 | 3 | 82 | 1 | 1 | 6 | 3 | 0 | 0 | 2 | 17 | 0 | 2 | 1 | 270 |
| Toys, games, sporting goods, etc. | 3910–3990 | 4 | 12 | 1 | 3 | 1 | 6 | 5 | 2 | 0 | 2 | 11 | 12 | 1 | 0 | 13 | 2 | 38 | 1 | 2 | 1 | 0 | 0 | 0 | 1 | 2 | 2 | 1 | 0 | 123 |
| Line-haul operations & trucking | 4011–4213 | 8 | 14 | 5 | 4 | 6 | 25 | 10 | 8 | 1 | 5 | 7 | 25 | 5 | 6 | 9 | 5 | 101 | 4 | 16 | 7 | 17 | 0 | 7 | 10 | 7 | 8 | 6 | 2 | 328 |
| Air transportation | 4512–4522 | 13 | 7 | 1 | 6 | 1 | 42 | 11 | 1 | 5 | 2 | 10 | 24 | 6 | 2 | 6 | 6 | 17 | 3 | 9 | 1 | 3 | 1 | 1 | 11 | 4 | 1 | 2 | 5 | 201 |
| Communication & broadcasting | 4812–4899 | 22 | 8 | 20 | 2 | 4 | 6 | 18 | 1 | 3 | 4 | 15 | 25 | 7 | 3 | 8 | 5 | 18 | 3 | 4 | 4 | 3 | 2 | 7 | 4 | 10 | 13 | 0 | 8 | 227 |
| Electric services | 4911 | 2 | 2 | 29 | 12 | 17 | 32 | 10 | 1 | 5 | 2 | 4 | 9 | 1 | 0 | 3 | 4 | 10 | 1 | 6 | 0 | 1 | 3 | 5 | 0 | 3 | 0 | 0 | 1 | 163 |
| Gas transmission & distribution | 4922–4991 | 16 | 8 | 4 | 0 | 2 | 29 | 15 | 1 | 3 | 1 | 4 | 19 | 6 | 0 | 6 | 10 | 11 | 3 | 9 | 1 | 1 | 3 | 1 | 0 | 1 | 4 | 0 | 0 | 158 |
| Miscellaneous wholesaling | 5000–5190 | 27 | 44 | 1 | 7 | 2 | 46 | 19 | 10 | 3 | 2 | 27 | 52 | 7 | 13 | 39 | 5 | 253 | 3 | 24 | 12 | 2 | 0 | 1 | 36 | 6 | 15 | 4 | 16 | 676 |
| Department & variety stores | 5311–5399 | 3 | 1 | 3 | 2 | 2 | 36 | 4 | 0 | 0 | 1 | 4 | 11 | 3 | 2 | 1 | 0 | 30 | 3 | 7 | 1 | 0 | 0 | 0 | 4 | 1 | 4 | 1 | 4 | 128 |
| Grocery & convenience stores | 5411–5412 | 3 | 1 | 1 | 2 | 4 | 2 | 3 | 0 | 2 | 1 | 5 | 13 | 1 | 2 | 0 | 0 | 44 | 0 | 4 | 2 | 0 | 0 | 1 | 0 | 1 | 0 | 1 | 3 | 96 |
| Apparel & clothing stores | 5600–5661 | 8 | 5 | 2 | 1 | 0 | 5 | 3 | 2 | 1 | 0 | 3 | 31 | 2 | 1 | 0 | 1 | 22 | 1 | 4 | 3 | 0 | 0 | 2 | 1 | 7 | 2 | 2 | 8 | 117 |
| Restaurants & eating places | 5810–5812 | 0 | 5 | 0 | 1 | 0 | 2 | 0 | 0 | 1 | 0 | 7 | 33 | 1 | 2 | 0 | 1 | 38 | 0 | 4 | 0 | 0 | 0 | 1 | 0 | 0 | 3 | 0 | 2 | 101 |
| Miscellaneous shopping stores | 5912–5990 | 7 | 10 | 1 | 1 | 0 | 12 | 9 | 0 | 1 | 0 | 7 | 24 | 2 | 1 | 1 | 3 | 37 | 1 | 4 | 0 | 1 | 0 | 0 | 8 | 0 | 1 | 0 | 1 | 132 |
| Banking and real estate | 6159–6799 | 3 | 1 | 0 | 0 | 1 | 0 | 6 | 0 | 1 | 1 | 1 | 20 | 0 | 0 | 0 | 0 | 0 | 0 | 5 | 0 | 0 | 0 | 0 | 1 | 2 | 0 | 0 | 4 | 46 |
| Hotels & motels | 7011 | 14 | 9 | 1 | 2 | 1 | 6 | 2 | 0 | 2 | 0 | 11 | 14 | 8 | 7 | 26 | 1 | 8 | 0 | 8 | 0 | 2 | 1 | 3 | 15 | 1 | 10 | 0 | 2 | 154 |
| Advertising & other services | 7200–7363 | 17 | 0 | 0 | 3 | 0 | 5 | 7 | 1 | 0 | 2 | 17 | 46 | 0 | 0 | 2 | 0 | 43 | 0 | 1 | 6 | 0 | 0 | 1 | 0 | 3 | 3 | 0 | 1 | 158 |
| Programming & software services | 7370–7389 | 76 | 13 | 0 | 5 | 1 | 21 | 113 | 4 | 9 | 18 | 94 | 196 | 5 | 2 | 87 | 14 | 109 | 1 | 12 | 21 | 20 | 0 | 5 | 11 | 59 | 3 | 0 | 19 | 918 |
| Motion pictures & theaters | 7812–7841 | 8 | 8 | 0 | 1 | 0 | 0 | 19 | 0 | 0 | 0 | 6 | 12 | 2 | 0 | 11 | 2 | 14 | 0 | 0 | 0 | 0 | 0 | 0 | 2 | 1 | 1 | 0 | 1 | 88 |
| Amusement & recreation services | 7900–7997 | 12 | 3 | 0 | 3 | 4 | 2 | 4 | 5 | 1 | 0 | 5 | 43 | 2 | 0 | 5 | 1 | 17 | 0 | 7 | 2 | 1 | 0 | 5 | 1 | 2 | 1 | 0 | 4 | 130 |
| Medical & nursing services | 8000–8093 | 9 | 1 | 0 | 0 | 2 | 1 | 9 | 0 | 0 | 0 | 2 | 8 | 0 | 1 | 7 | 0 | 2 | 0 | 2 | 0 | 0 | 0 | 1 | 3 | 2 | 9 | 0 | 4 | 63 |
| Engineering & management services | 8700–8744 | 14 | 4 | 2 | 3 | 0 | 6 | 13 | 1 | 3 | 2 | 18 | 52 | 1 | 0 | 5 | 0 | 33 | 2 | 16 | 6 | 1 | 0 | 0 | 13 | 6 | 0 | 0 | 0 | 201 |
| Corporate conglomerates | 9995–9997 | 4 | 9 | 2 | 0 | 3 | 31 | 6 | 0 | 0 | 0 | 1 | 9 | 7 | 1 | 12 | 1 | 22 | 4 | 19 | 2 | 2 | 0 | 4 | 6 | 0 | 0 | 0 | 3 | 148 |
| Total | 764 | 316 | 217 | 171 | 103 | 1,056 | 593 | 105 | 97 | 102 | 530 | 1,155 | 109 | 171 | 1,102 | 140 | 2,331 | 202 | 519 | 132 | 117 | 99 | 90 | 256 | 240 | 214 | 135 | 169 | 11,235 |
.")
.")