


This study examined the non-linear relationship between financial development and innovation using generalized method of moments (GMM) estimators for a panel data model. The sample comprised data for 75 developed and developing countries for the period 1996 to 2010. An inverted U-shaped non-linear relationship between finance and innovation was observed. This finding implies that finance enhances innovation only up to a certain level. Beyond that level, further development of finance tends to affect innovation adversely. The institution interaction term was included to examine its role in the relationship between finance and innovation. The results suggest that the finance-innovation curve varies with different settings of institutional quality. Specifically, the finance-innovation relationships followed an inverted U curve only for countries with high institutional quality. Hence, sound institutional quality is a prerequisite for financial development to benefit innovation.
In Schumpeterian economics, innovation performs an important function in economic growth, particularly through its role in promoting a creative destruction process. Nevertheless, a well-developed financial system is required to efficiently allocate finances to productive innovation activities. By definition, financial development occurs when financial instruments, markets, and intermediaries ameliorate in terms of the effects of information, enforcement and transaction cost. Thus, developed financial markets provide the ground for efficient allocation of credit that is put to the most productive use. Efficient financial allocation then funds efficient research and development and, hence, stimulates economic growth. Furthermore, greater access to external finance also encourages the entry of venture firms and their post-entry growth, which encourages market competition and forces old firms to innovate to survive.1
Numerous studies have attempted to challenge the positive finance-innovation relationship by suggesting that financial development might hinder innovative activities (Hellwig, 1991; Morck & Nakamura, 1999; Rajan, 1992; Stiglitz, 1985; Weinstein & Yafeh, 1998). In their perspective, credit markets favor investment in reputable and well-established firms rather than new or innovative firms because the risk of capital loss is lower. This behavior is then amplified by well-developed financial systems in which a firm's information is easy to acquire. As a result, developed financial markets contribute to the forming of a monopoly and discourage competition. These contradicting views on the finance-innovation relationship highlight the need for economists to review the theory beyond conventional wisdom and methods (e.g., the possibilities of a non-linear relationship between financial development and innovation). Brown, Earle, and Lup (2005) find that access to external credit substantially increases both employment and sales growth in Romanian new small enterprises but technical assistance has no clear association with firm growth.
Hence, the above discussion leads to the following research questions: First, does a non-linear relationship exist between financial development and innovation? Second, if it exists, does institutional quality play an important role in governing such relationship?
In this study, we formulated two research objectives to answer the proposed questions. First, we construct a non-linear finance-innovation framework to explain the current dispute in finance-innovation relationship. Second, we examine the role of institutions in influencing the financial-innovation nexus by imposing conditional hypothesis on finance-innovation relationship. Here, we hypothesize that the finance-innovation relationship is non-linear and that its variation across countries depends on the level and influence of institutional quality where it plays a role in governing the finance-innovation non-linear relationship. Specifically, reputable institutions in a country (e.g., efficient bureaucracy, sound legal system, low corruption) reduce risk and uncertainty in investment. Thus, better financial development promotes research and development (R&D) investment and, hence, innovative activity. In contrast, countries with weak institutions increase the risk of contract repudiation and uncertainty. Therefore, financial development might not significantly affect innovation activities in these countries. Nevertheless, as we hypothesize this relationship to be non-linear, the shape of the finance-innovation curve might vary with different settings of institutional quality.
This study contributes to the literature in four ways. First, we develop a non-linear model to explain the finance-innovation nexus, which is currently unexplored in this line of work. Second, we use the dynamic panel system generalized method of moments (GMM) to estimate the impact of institutional quality on the finance-innovation relationship. The use of lagged level regressors as the instrument resolves the possible endogeneity problem in the model. Third, this study uses the Lind and Mehlum (2010) U-test to validate the non-linear relationship. Currently, the conventional method for validating a non-linear regression is known to falsely infer a non-linear relationship when the true relationship is convex but monotone. Lind and Mehlum's (2010) U-test jointly tests whether the relationship between the dependent and threshold variable is increasing at low values and decreasing at high values within samples. Thus, it avoids misleading inference if the estimated extremum point is too close to the end point of the data range.
The rest of the paper is structured as follows: Section 2 describes the related literature and theoretical framework for this study. Section 3 presents the methodology and economic modeling used in the analysis. Section 4 specifies the data employed in the analysis and their sources. Section 5 presents the empirical results and their interpretation. Finally, section 6 concludes with main findings and policy implications from this study.
Literature reviewFinance-innovation relationshipMost literature on the financial-innovation relationship supports the idea that financial development promotes innovation. For example, Aghion and Howitt (2005) highlight the importance of financial development in frontier technological convergence. They suggest that financial development helps to facilitate the adoption of new products or processes and leads to the improvement in efficiency that is essential for countries to converge to frontier technology. Additionally, they propose that an innovator can defraud creditors by hiding the outcomes of a successful innovation. However, the hiding cost increases with level of financial development. Thus, they conclude that underdeveloped financial systems increase the risk of contract repudiation and hinder innovation activity.
This work is extended by Aghion and Howitt (2009), particularly in analyzing the issue of possible contract repudiation by the innovator. To maximize profit, a bank or investor must pay a cost to screen loan applications to account for the risk of an infeasible project. Additionally, the investor needs to monitor the progress of the financed project to ensure that the entrepreneur complies with the loan agreement (e.g., repayment of the loan). Financial development lowers screening and monitoring costs, thus mitigating agency problems and increasing the frequency of innovation. Aghion, Comin, Howitt, and Tecu (2009) further evaluate the influence of savings on innovation. They suggest that saving is crucial for countries that are far from the technology frontier. This is because relatively poor countries require higher savings to increase the number of projects that can be co-financed by local entrepreneurs to mitigate agency problems and attract foreign investors. However, countries that are close to the technology frontier do not need to attract foreign investment because they possess the skill and technology to undertake an ex ante profitable innovation project. As a result, firms in these countries will engage in innovation regardless of the level of domestic savings.2
In addition, de la Fuente and Marin (1996) examine the influence of finance in innovation through the moral hazard problem. The combination of risk aversion and private information in innovation generates a moral hazard problem. The existence of moral hazard requires that a contract between financial intermediaries and entrepreneurs be structured to induce optimal effort through a combination of incentive provision and monitoring. As intermediaries monitor the cost to determine the cost of borrowing, this in turn determines entrepreneurs’ R&D investment decisions. However, development of a financial system allows financial intermediaries to diversify among large numbers of projects and thus reduce delegation costs (Blackburn & Hung, 1998). Lower costs of monitoring then indirectly reduce borrowing costs and encourage innovative activity. Furthermore, Buera, Kaboski, and Shin (2011) argue that an underdeveloped financial system distorts the allocation of capital among incumbents and potential innovative firms. An underdeveloped financial system misallocates innovative activities by delaying the entry of poor but productive entrepreneurs. As a result, wealthy but unproductive entrepreneurs stay in business, while poor potential entrepreneurs face barriers to enter until they have sufficient venture capital.
Meierrieks (2014) examines the effect of financial development on innovation for 51 developed and emerging countries from 1993 to 2008. The empirical results indicate that higher levels of financial development coincide with stronger innovation activity, which is consistent with expectations from Schumpeterian models of finance, entrepreneurship and economic growth. The financial system is an important component of a nation's innovation infrastructure and may therefore favorably determine national innovative capacity. The banking crises, however, do not have a significant impact on the finance-innovation nexus. In short, the finding suggests that financial intermediaries indeed encourage investment in innovation entrepreneurial activity. Therefore, economic policies that strengthen a country's financial system may also improve its innovation capacity. Using a rich firm-level dataset, Dabla-Norris, Kersting, and Verdier (2012) note that innovation is crucial for firm performance. Moreover, its effects on productivity are mediated through the financial sectors, especially for firms in high-tech sectors that have higher external financing needs.
So far, the above discussion shows that financial development tends to have a positive impact on innovation. However, the effect of financial development on innovation might be contingent on the type of financial systems. Hsu, Tian, and Xu (2014) investigate how financial market development affects technological innovation, using a large dataset that consists of 32 developed and emerging countries and a fixed effects identification strategy. They also compare how the development of equity markets and credit markets affects technological innovation. Their findings indicate that industries that are more dependent on external finance and that are more tech-intensive exhibit a disproportionally higher innovation level in countries with better-developed equity markets. Nevertheless, the development of credit markets appears to discourage innovation in industries with these characteristics.
However, that is not necessarily true, as credit markets may discourage innovation. Using the data from the Morocco census of manufacturing enterprises and information from a commune survey, Fafchamps and Schundeln (2013) find that local bank availability is statistically significant determinant of small and medium-size firms’ growth, lower likelihood of firm exit and a higher likelihood of investment. They also highlight that access to credit is used by firms to invest in labor saving technology so as to increase value added by reducing labor costs. On the other hand, Brown, Fazzari, and Petersen (2009) point out five reasons why young high-tech firms obtain little to no debt finance. First, the structure of a debt contract is not well suited for innovative firms with uncertain and volatile returns (Stiglitz, 1985). Second, adverse selection problems are more likely to appear in young innovative firms because of the inherent riskiness of investment (Stiglitz & Weiss, 1981). Third, debt financing can lead to ex post changes in behavior (moral hazard). This is more severe in innovative firms because they can easily substitute high-risk for low-risk projects. Fourth, the expected marginal cost of financial distress increases rapidly with leverage for young entrepreneurial firms because their market value depends on future growth options that rapidly depreciate if they face financial distress (Cornell & Shapiro, 1988).
Finally, the limited collateral value of intangible assets greatly restricts firms from accessing debt finance. This is more significant for risky firms, which must pledge collateral to obtain debt finance (Berger & Udell, 1990). The five reasons imply that young innovative firms do not benefit more than others from financial development. However, Hellwig (1991) and Rajan (1992) argue that not only does financial development not help significantly to encourage innovative activity, but it actually discourages it. They suggest that powerful banks frequently stifle innovation by extracting informational rents and protecting established firms. By acquiring private information about firms, powerful banks can extract informational rents and a large share of the profits from firms. This later reduces firms’ incentive to invest in long-term innovative projects. Financial development that improves the acquisition of financial information will then expose the weak financial strength of new entrepreneurial firms. This worsens the adverse selection problem, which motivates financial intermediaries to finance well-established firms rather than risky innovative firms (Akerlof, 1970).
To better understand the mechanisms of financial development in technology innovation, Ang and Madsen (2012) analyze the link between these variables. In their study, private credit and risk capital innovation are significant determinants of innovation. This implies that a developed financial system helps to facilitate technology innovation in terms of cost reductions. These costs include the imperfect information that creditors gather prior to financing the potential investment. Therefore, improved financial structure will reduce the cost of acquiring information and enforcing the contract, which will promote technology innovation that requires large sums of venture capital. Their robustness checks also find that venture capital and initial public offerings (IPOs) are significant determinants of innovation. Ang and Kumar (2014) also demonstrate that cultural barriers to the diffusion of financial technology3 across borders impact financial development by influencing the follower countries’ ability to adopt and adapt innovations from the frontier.
The role of institutional quality in the finance-innovation relationshipThe earliest work on establishing a link between institutions and financial development can be traced to the work of La Porta, Lopez-de-Silanes, Shleifer, and Vishny (1997). They relate countries’ legal systems to financial intermediary development. By comparing the legal rules across 49 countries, they find that the legal environment as described by both legal rules and enforcement influences the development of a country's capital market in terms of size and extent. Legal rules protect investors, and the quality of their enforcement differs across countries. Specifically, a reputable legal environment protects potential financiers against expropriation by entrepreneurs. Thus, it increases the willingness to finance in exchange for securities and, hence, expands the scope of capital markets. Similarly, Levine (1998) also investigates the connection between legal environment and financial development. He finds that the legal and regulatory environment matters to financial development. That is, countries with a legal system that emphasizes creditor rights and rigorously enforces contracts have better-developed banks than countries where laws do not give high priority to creditors.4
While the above literature emphasizes the influence of the legal system on financial intermediaries, Marcelin and Mathur (2014) have a different view. They argue that the type of institution and market reform are more relevant to financial intermediation than legal systems. First, weak formal institutions in contract enforcement may be complemented by an informal institution or social convention. Thus, when formal institutions are inefficient, the flow of private credit may be facilitated by private arrangement. Second, institutions reflect risk, values, and national consensus. Other institution indicators such as culture of corruption are also part of the lender risk that restricts the growth of financial intermediaries. Third, the established statutory legal system is meaningless without enforcement efficiency. Safavian and Sharma (2007) also find that effectiveness of creditor rights is strongly linked to the efficiency of contract enforcement. Finally, informational reform is vital for financial development. This is because improvement in information sharing within the financial sector helps to reduce transaction costs and adverse selection problems. However, information sharing might serve a limited purpose if implemented in countries that suffer from poor institutions. Overall, Marcelin and Mathur (2014) emphasize that the influence of institutions on financial development involves interaction between institutional components rather than the legal institution alone.
As for empirical analysis, Miletkov and Wintoki (2012) investigate the role of financial development in the evolution of property rights and legal institutions. Employing panel data of 129 countries, they find a positive causal relationship between the level of financial development and the quality of property rights institutions. This relationship is especially strong in an emerging economy. Furthermore, Law and Azman-Saini (2012) examine the impact of institutional quality on financial development. In their study, the dynamic panel GMM analysis suggests that institutional quality significantly enhances financial development. Specifically, they find that the rule of law, political stability and government effectiveness matter most in promoting banking sector development. Interestingly, they also find evidence of a non-linear relationship between regulatory quality and financial development.
Overall, there seems to be an ambiguous understanding of the finance-innovation relationship. First, financial development (e.g., lowering information acquisition costs) encourages financial intermediaries to fund risky innovation projects, as the monitoring cost is relatively lower. Second, financial development reduces innovation activity, as financial intermediaries tend to favor financing well-established firms versus high-risk entrepreneurs.
With respect to economic system, Guan and Yam (2015) indicate that the centrally planned funding system of the 1990s in China was ineffective in enhancing technological progress for Chinese manufacturing firms. Their empirical findings imply that the Chinese government should further increase the role of market force in its reforms. A more market-driven model is recommended by developing more Science & Technology (S&T) initiatives to match the strategic directions of different enterprises, particularly state owned enterprises (SOEs). In the case of South Korea, Doh and Kim (2015) investigate the impact of governmental support policies (using the technological development assistance funds as a proxy) on the innovation of small and medium enterprises (SMEs) in the regional strategic industries. They find a positive relationship among the technological development assistance, patent acquisitions and new design registrations of regional SMEs. Networks with universities also have a positive relationship with patent acquisitions and new design registrations of regional SMEs. Their results suggest that governmental financial aids are important for regional SME innovations.
Given that institutional quality and governance play an important role in financial development (Law & Azman-Saini, 2012), some degree of influence may govern the relationship between financial development and innovation. In the investor perspective, profitability is the key factor that motivates the creditor to finance an innovation. Hence, a country with weak institutional quality (weak contract enforcement) increases the risk of uncertainty in terms of securing the investment if the debtor is tempted to break the contract. Given that the degree of successful innovation is uncertain, weak institutional quality increases the risk of such investment and, hence, discourages financial institutions from financing such innovation.
Model specificationIn this section onward, the study tests the non-linear finance-innovation model. To do this, the study adopts a standard quadratic relationship between innovation and financial development that can be written as:
where the subscripts i and t refer to cross section unit and time period, respectively, A is innovation measured by pattern application per labor, FD is financial development, X is the set of control variables, αi is the country-specific effect, β1, β2, and β3 are the coefficients to be estimated, and ¿it is the error term. In this model, the lagged dependent variable is included to represent the innovation activity as an accumulative process. Additionally, γ and β3 are expected to be positive because income, trade openness and foreign direct investment promote innovation activity. The major focus will be the magnitude and significance of β1 and β2. From previous literature, β1 is suggested to be positive or negative. However, we extend this view by suggesting a non-linear relationship between financial development and innovation. Thus, we hypothesize that such relationship can be U-shaped or inverted U-shaped depending on the sign for β1 and β2. If finance-innovation follows a U-shaped non-linear relationship, β1 is negative and β2 is positive. In contrast, if it follows an inverted U-shaped non-linear relationship, then β1 is positive and β2 is negative. As for the control variables used in this study, GDP per capita, trade openness, and foreign direct investment are suggested by previous literature as determinants of innovation and all of these variables are expected to have positive impact on innovation (Cheung & Lin, 2004; Dahlman, 1994; Romer, 1992; Wang, 2013). From Eq. (1), the financial development turning point can be estimated as:

Furthermore, Eq. (1) assumes a homogenous pattern in the finance-innovation relationship across all countries. This assumption is very restrictive, as the relationship is likely to vary across countries. For that reason, we extend our specification to incorporate institutional quality as a potential determining factor of the difference in the finance-innovation relationship. Here, we extend Eq. (1) by incorporating the institutional quality interaction term with financial development and squared financial development, as follows:
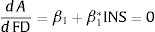
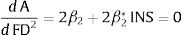
where INSit is the measure of institutional quality for country i and time series t. Based on Eq. (3), the non-linear relationship between financial development and innovation is supported when β1+(β1*×INSit) is positive and β2+(β2*×INSit) is negative. Furthermore, Eq. (3) imposes a conditional hypothesis where the interaction effect only exists when INS ≠ 0. Thus, the marginal effect of the concerned variable on innovation from Eq. (3) will be:where the total marginal effect of the lower bound financial development and institutional quality will be β1+β1* INS, and the total marginal effect of the upper bound financial development and institutional quality will be 2β2+2β2* INS. Hence, from Eq. (2), the financial development turning point is as follows: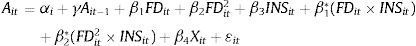

From Eqs. (3) and (6), the institutional quality significantly influences the shape of the finance-innovation relationship if β1* or β2* or both are statistically significant. Specifically, if β1* is significantly positive, an increase in institutional quality will shift the finance-innovation relationship upward. This suggests that development in institutional quality promotes financing in innovation activity. In addition, the financial development turning point is higher with a higher level of institutional quality if β2* is also positively significant. However, if β2* is negative, whether institutional quality decreases or increases, the financial development turning point depends on the relative magnitude of β1* and β2*. Hence, Eq. (3) is our baseline model. As a robustness test, this study employs two different measurements of financial development: private sector credit and domestic credit.
Estimation methodPanel system GMMThe econometric method employed in this study is based on the dynamic panel system GMM estimators suggested by Arellano and Bond (1991) and further developed by Blundell and Bond (1998).5 This estimator was chosen for at least three reasons. The first is to control the country-specific effect. Second, macroeconomic variables in the model, such as financial development, foreign direct investment (FDI), and even institutional quality, are assumed to be endogenous. Third, the presence of the lagged dependent variable in the model gives rise to autocorrelation problems. For the first problem, Arellano and Bond (1991) propose transforming the level equation into first differences to eliminate the unobserved country-specific effect. In accounting for the possible simultaneous bias of explanatory variables and the correlation between the lagged dependent variable and disturbance terms, Arellano and Bond (1991) propose the use of a lagged level of regressors as the instrument. However, use of the instrument is only valid when the error term is not serially correlated and the lags of the explanatory variable are weakly exogenous. The proposed first-differences procedure is also known as the difference GMM estimation.
The advantage of first-difference GMM is its ability to control simultaneity bias and the country-specific effect. Nevertheless, there is one major shortcoming. Blundell and Bond (1998) show that when explanatory variables are persistent, the lagged levels of the variables become weak instruments, as these instruments are weak predictors of endogenous changes. As a consequence, weak instruments may lead to biased and poor precision in parameter estimates in finite samples. For this, Blundell and Bond (1998) propose an alternative system estimator that combines the difference equation and level equation. In this technique, Blundell and Bond (1998) use extra moment conditions that rely on the stationary conditions of the initial observation. The additional moment conditions then serve as the instrument for the first part of the system (regression in difference) and the lagged level of regressors as the instrument for the second part of the system (regression in level). In this study, the macroeconomic variables, such as financial development, FDI, trade openness and gross domestic product (GDP) per capita, are quite persistent. Hence, panel system GMM is chosen for estimation.
Two specification tests prove the consistency of GMM estimators. The first is the Hansen (1982)J-test of over-identifying restrictions. Under the null hypothesis of joint validity of all instruments, all moments have an expectation equal to zero. Hence, the distribution of the J statistic converges to a chi-squared distribution with a degree of freedom equal to the number of over-identification. The second test is used to search for the presence of second-order serial correlation in the error term of the first-difference equation. Acceptance of the null hypothesis for the second-order serial correlation test provides evidence of the validity of the instrument used in panel system GMM estimators.
First-difference and system GMM estimators are typically applied in one-step and two-step variants. The one-step parameters are estimated based on an initial weight matrix that is independent of estimated parameters. On the other hand, two-step GMM obtains parameter estimates from the initial weight matrix and computes a new weight matrix based on those estimates. It then re-estimates the parameters based on that weight matrix. In this case, the moment conditions are weighted by a consistent estimate of their co-variance matrix. This makes the two-step estimator asymptotically more efficient than one-step estimators. Therefore, this study uses the two-step system GMM in the analysis.
Lind and Mehlum (2010) U-testIn a conventional non-linear model estimation, the non-linear relationship is validated by a rejection of the null hypothesis for both original and squared variables with different signs to determine the shape of the relationship. However, a problem arises when the true relationship is convex but monotone, which yields an extreme point and implies a false quadratic U-shaped curve. In response, Lind and Mehlum (2010) develop a test to avoid mis-inferring the true non-linear relationship by extending the work of Sasabuschi (1980). The procedure is performed by testing for the presence of a U-shape on some interval values, where the relationship decreases at low values and increases at high values within the interval. This is achieved by testing the following conditions in Eq. (1):

The procedure jointly tests whether the relationship between innovation and financial development is increasing at low values and decreasing at high values of financial development within samples, and it is implemented in Stata by the command UTEST.
Data, measurement and sourcesAs an empirical analysis, data are collected from various sources. First, we employ two measurements of innovation, namely total patent application denoted as total patent application per labor (PA/L) and total patent grants per labor (PG/L) extracted from the World Intellectual Property Organization (WIPO).6 The used of both patent application and patent grant as measurement of innovation have been widely adopted among researchers such as Jaffe (1986), Bottazzi and Peri (2003), and Tebaldi and Elmslie (2013). The sample covers 75 developed and developing countries from 1996 to 2010.7
The measurement of financial development contains two banking sector development indicators: private sector credit and domestic credit. Private sector credit is defined as the value of financial intermediary credit to the private sector, while domestic credit comprises both private credit and credit to the public sector. Both sets of data are from the World Development Indicators (WDI).
The source for institutional quality is the International Countries Risk Guide (ICRG) assembled by the Political Risk Services (PRS) group. Five ICRG indicators are used to measure overall institutional quality: (i) democratic accountability, (ii) government stability, (iii) bureaucratic quality, (iv) corruption control and (v) law and order. An overall institution variable is constructed by summing the five ICRG indicators. These five variables are scaled from 0 to 10, where a higher value implies better institutional quality.
As for the choice of control variables, GDP per capita, trade openness and FDI are selected, as they are the important determinants for innovation. As for the data sources, the GDP per capita and trade openness (imports + exports over GDP ratio) are obtained from the World Development Indicators. FDI is foreign direct investment inflow, and the data are gathered from the United Nations Conference on Trade and Development (UNCTAD).
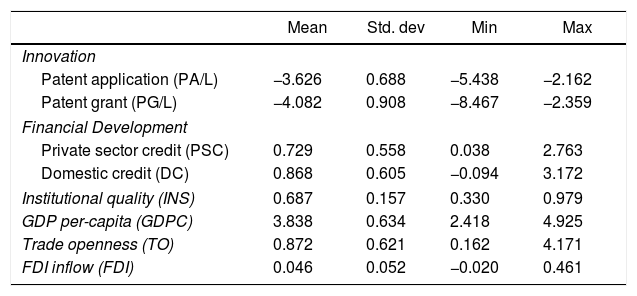
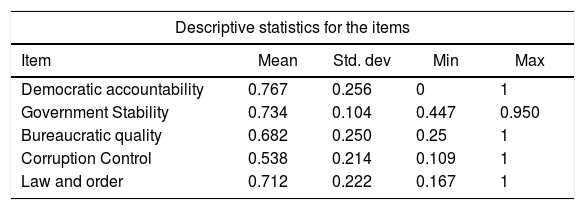
Table 1 presents the descriptive statistics for the data used in this study. The negative value of innovation (P/L and G/L) are due to the data transformation process which is in natural logarithm form. Most variables exhibit high cross-country variation, as the high standard deviation indicates that the data points are quite spread out around the means. Specifically, this suggests that variation in financial development and innovation is quite resilient across our cross-sectional sample. The divergence in innovation and financial development leads us to investigate whether a non-linear relationship between these two variables exists in empirical analysis. In addition, the Cronbach alphas for the items in institutional quality index are presented in Table 2. The estimated overall value of alphas is 0.776 which is acceptable internal consistency among the items used to construct the institutional quality index.
Descriptive statistic.
| Mean | Std. dev | Min | Max | |
|---|---|---|---|---|
| Innovation | ||||
| Patent application (PA/L) | −3.626 | 0.688 | −5.438 | −2.162 |
| Patent grant (PG/L) | −4.082 | 0.908 | −8.467 | −2.359 |
| Financial Development | ||||
| Private sector credit (PSC) | 0.729 | 0.558 | 0.038 | 2.763 |
| Domestic credit (DC) | 0.868 | 0.605 | −0.094 | 3.172 |
| Institutional quality (INS) | 0.687 | 0.157 | 0.330 | 0.979 |
| GDP per-capita (GDPC) | 3.838 | 0.634 | 2.418 | 4.925 |
| Trade openness (TO) | 0.872 | 0.621 | 0.162 | 4.171 |
| FDI inflow (FDI) | 0.046 | 0.052 | −0.020 | 0.461 |
Notes: PA is measured by patent application divided by labor force (PA/L). PG is measured by patent grant divided by labor force (PG/L). PSC, DC and FDI are measured in percentage of GDP. GDPC and TO are measured in level. ICRG are the overall measures of relevant sub-component of institutions indicators.
Item-analysis for institutional quality.
| Descriptive statistics for the items | ||||
|---|---|---|---|---|
| Item | Mean | Std. dev | Min | Max |
| Democratic accountability | 0.767 | 0.256 | 0 | 1 |
| Government Stability | 0.734 | 0.104 | 0.447 | 0.950 |
| Bureaucratic quality | 0.682 | 0.250 | 0.25 | 1 |
| Corruption Control | 0.538 | 0.214 | 0.109 | 1 |
| Law and order | 0.712 | 0.222 | 0.167 | 1 |
| Cronbach's Alpha for the computation of institutional quality | |||||
|---|---|---|---|---|---|
| Item | Obs | Sign | Item-test correlation | Item-rest correlation | Alpha |
| Democratic accountability | 375 | + | 0.699 | 0.562 | 0.775 |
| Government Stability | 375 | + | 0.659 | 0.527 | 0.839 |
| Bureaucratic quality | 375 | + | 0.889 | 0.780 | 0.642 |
| Corruption Control | 375 | + | 0.882 | 0.792 | 0.649 |
| Law and order | 375 | + | 0.807 | 0.665 | 0.694 |
| Test scale | 0.776 | ||||
Notes: The Cronbach's Alpha test is obtained using the STATA alpha command. The ranges between 0.7 and 0.8 are acceptable in social science research (Source: Stata Journal).
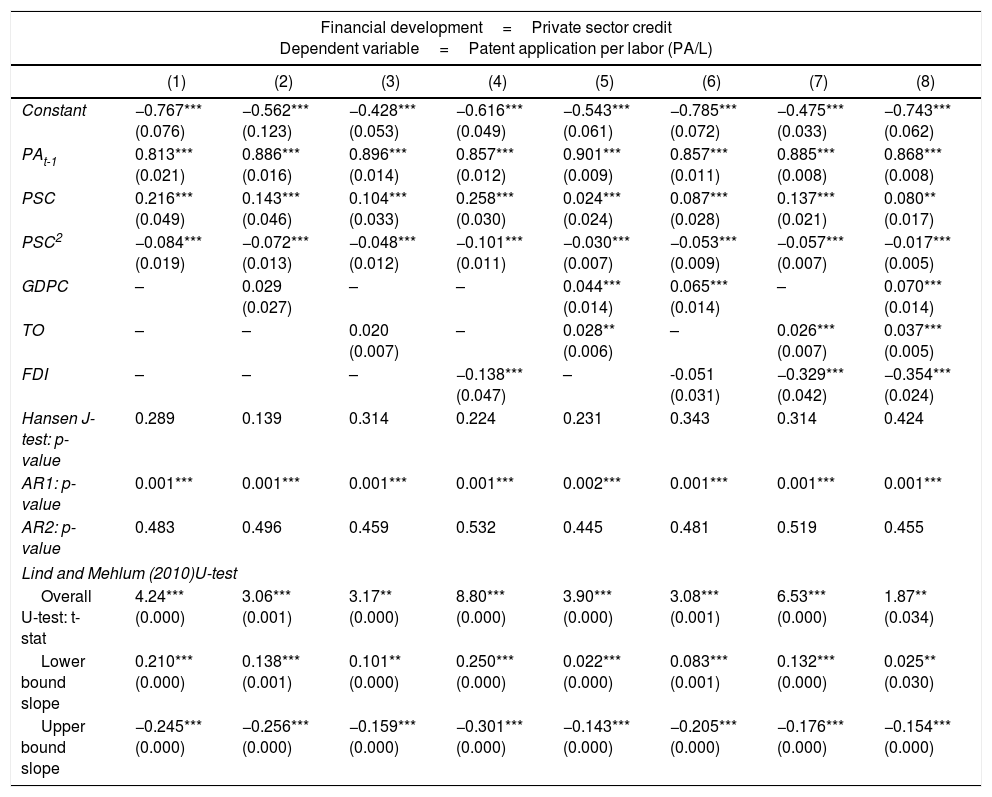
Table 3 presents the baseline specification without institutional quality, using system GMM estimators and private sector credit as proxies for financial development. In addition, other control variables, namely GDP per capita (GDPC), trade openness (TO), and foreign direct investment (FDI), are included in our baseline model in Table 3. The Hansen J-test does not reject the null hypothesis of over-identification restriction, suggesting that the instruments are valid. Furthermore, the serial correlation test fails to reject the null of no second-order autocorrelation but rejects the null of no first-order autocorrelation.
Baseline result.
| Financial development=Private sector credit Dependent variable=Patent application per labor (PA/L) | ||||||||
|---|---|---|---|---|---|---|---|---|
| (1) | (2) | (3) | (4) | (5) | (6) | (7) | (8) | |
| Constant | −0.767*** (0.076) | −0.562*** (0.123) | −0.428*** (0.053) | −0.616*** (0.049) | −0.543*** (0.061) | −0.785*** (0.072) | −0.475*** (0.033) | −0.743*** (0.062) |
| PAt-1 | 0.813*** (0.021) | 0.886*** (0.016) | 0.896*** (0.014) | 0.857*** (0.012) | 0.901*** (0.009) | 0.857*** (0.011) | 0.885*** (0.008) | 0.868*** (0.008) |
| PSC | 0.216*** (0.049) | 0.143*** (0.046) | 0.104*** (0.033) | 0.258*** (0.030) | 0.024*** (0.024) | 0.087*** (0.028) | 0.137*** (0.021) | 0.080** (0.017) |
| PSC2 | −0.084*** (0.019) | −0.072*** (0.013) | −0.048*** (0.012) | −0.101*** (0.011) | −0.030*** (0.007) | −0.053*** (0.009) | −0.057*** (0.007) | −0.017*** (0.005) |
| GDPC | – | 0.029 (0.027) | – | – | 0.044*** (0.014) | 0.065*** (0.014) | – | 0.070*** (0.014) |
| TO | – | – | 0.020 (0.007) | – | 0.028** (0.006) | – | 0.026*** (0.007) | 0.037*** (0.005) |
| FDI | – | – | – | −0.138*** (0.047) | – | -0.051 (0.031) | −0.329*** (0.042) | −0.354*** (0.024) |
| Hansen J-test: p-value | 0.289 | 0.139 | 0.314 | 0.224 | 0.231 | 0.343 | 0.314 | 0.424 |
| AR1: p-value | 0.001*** | 0.001*** | 0.001*** | 0.001*** | 0.002*** | 0.001*** | 0.001*** | 0.001*** |
| AR2: p-value | 0.483 | 0.496 | 0.459 | 0.532 | 0.445 | 0.481 | 0.519 | 0.455 |
| Lind and Mehlum (2010)U-test | ||||||||
| Overall U-test: t-stat | 4.24*** (0.000) | 3.06*** (0.001) | 3.17** (0.000) | 8.80*** (0.000) | 3.90*** (0.000) | 3.08*** (0.001) | 6.53*** (0.000) | 1.87** (0.034) |
| Lower bound slope | 0.210*** (0.000) | 0.138*** (0.001) | 0.101** (0.000) | 0.250*** (0.000) | 0.022*** (0.000) | 0.083*** (0.001) | 0.132*** (0.000) | 0.025** (0.030) |
| Upper bound slope | −0.245*** (0.000) | −0.256*** (0.000) | −0.159*** (0.000) | −0.301*** (0.000) | −0.143*** (0.000) | −0.205*** (0.000) | −0.176*** (0.000) | −0.154*** (0.000) |
Notes: All models are estimated using the Arellano and Bover (1995) dynamic panel system GMM estimations. Numbers in parentheses are standard errors, except for Hansen test, AR(1), AR(2) and Lind and Mehlum U-test, which are p-values. *** and ** indicate significance at 1% and 5% levels, respectively. Significant time dummies are included in the model specification but the results are not reported to save space.
The results from Table 3 conform to our hypothesis that innovation level tends to depend on previous innovation level, implying innovation activity as an accumulative process. These findings strengthen our view on dynamic specifications of the innovation model. In addition, an inverted U-shaped non-linear relationship is suggested to exist between innovation and financial development with a significant positive sign of private sector credit and a significant negative sign of private sector credit squared. Based on model (1) in Table 3, the financial development threshold point is 128.6% of GDP.8 Specifically, financial development hinders innovation activity when it is developed beyond the suggested threshold value. To confirm that the relationship between financial development and innovation is non-linear, we also perform the Lind and Mehlum (2010)U-test; the results indicate that the test statistics are significant, which highlights that both variables indeed are non-linear.
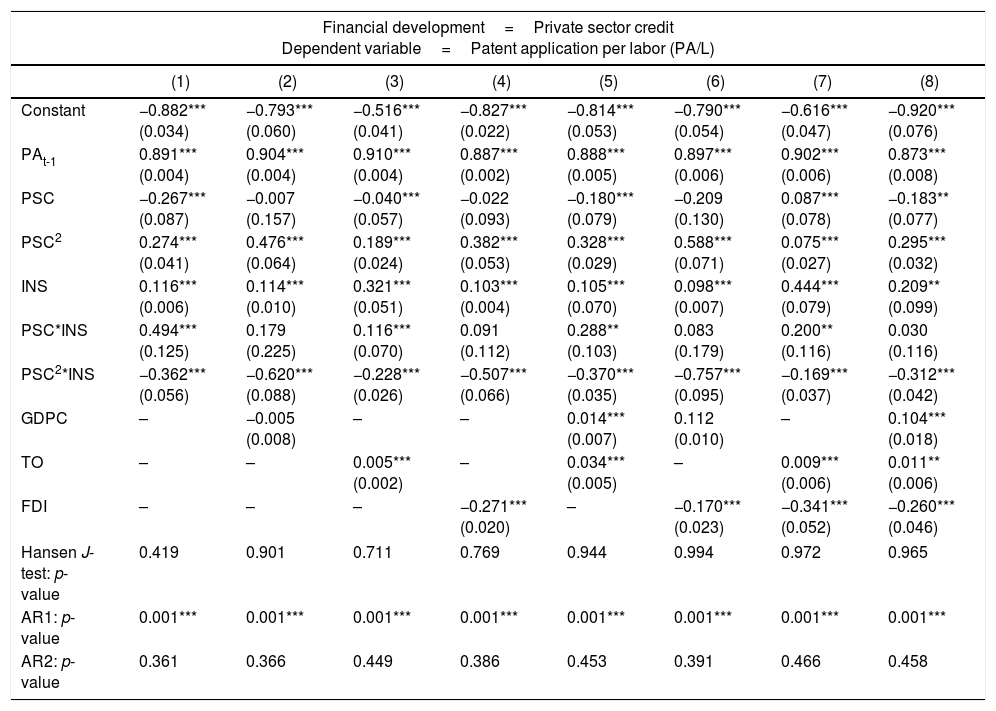
Next, we estimate the specified innovation model with the presence of the interaction term (i.e., institutional quality) to address our belief that institutional quality is relevant in determining the pattern of the finance-innovation non-linear relationship. The empirical result is presented in Table 4. The coefficient of financial development is −0.267+(0.494×INSit). Meanwhile, the coefficient estimated for financial development squared is 0.274–(0.362×INSit). These findings suggest several meaningful interpretations. First, the shape of the finance-innovation relationship depends on the level of institutional quality. Second, the significance of both interaction terms at conventional levels of significance reflects the important role of institutional quality in influencing the finance-innovation relationship. Third, the significant positive coefficient of the interaction between financial development and institutional quality suggests that innovation is higher for a country with higher institutional quality, given the level of financial development. In other words, an increase in the country's institutional quality level will shift the finance-innovation relationship upward. Finally, the negative coefficient of the interaction between financial development squared and institutional quality (PSC2×INS) suggests that the threshold point can be lower or higher for a country with a higher level of institutional quality depending on the magnitude of the positive coefficient finance-institution interaction terms (PSC×INS).
System GMM estimation with interaction term.
| Financial development=Private sector credit Dependent variable=Patent application per labor (PA/L) | ||||||||
|---|---|---|---|---|---|---|---|---|
| (1) | (2) | (3) | (4) | (5) | (6) | (7) | (8) | |
| Constant | −0.882*** (0.034) | −0.793*** (0.060) | −0.516*** (0.041) | −0.827*** (0.022) | −0.814*** (0.053) | −0.790*** (0.054) | −0.616*** (0.047) | −0.920*** (0.076) |
| PAt-1 | 0.891*** (0.004) | 0.904*** (0.004) | 0.910*** (0.004) | 0.887*** (0.002) | 0.888*** (0.005) | 0.897*** (0.006) | 0.902*** (0.006) | 0.873*** (0.008) |
| PSC | −0.267*** (0.087) | −0.007 (0.157) | −0.040*** (0.057) | −0.022 (0.093) | −0.180*** (0.079) | −0.209 (0.130) | 0.087*** (0.078) | −0.183** (0.077) |
| PSC2 | 0.274*** (0.041) | 0.476*** (0.064) | 0.189*** (0.024) | 0.382*** (0.053) | 0.328*** (0.029) | 0.588*** (0.071) | 0.075*** (0.027) | 0.295*** (0.032) |
| INS | 0.116*** (0.006) | 0.114*** (0.010) | 0.321*** (0.051) | 0.103*** (0.004) | 0.105*** (0.070) | 0.098*** (0.007) | 0.444*** (0.079) | 0.209** (0.099) |
| PSC*INS | 0.494*** (0.125) | 0.179 (0.225) | 0.116*** (0.070) | 0.091 (0.112) | 0.288** (0.103) | 0.083 (0.179) | 0.200** (0.116) | 0.030 (0.116) |
| PSC2*INS | −0.362*** (0.056) | −0.620*** (0.088) | −0.228*** (0.026) | −0.507*** (0.066) | −0.370*** (0.035) | −0.757*** (0.095) | −0.169*** (0.037) | −0.312*** (0.042) |
| GDPC | – | −0.005 (0.008) | – | – | 0.014*** (0.007) | 0.112 (0.010) | – | 0.104*** (0.018) |
| TO | – | – | 0.005*** (0.002) | – | 0.034*** (0.005) | – | 0.009*** (0.006) | 0.011** (0.006) |
| FDI | – | – | – | −0.271*** (0.020) | – | −0.170*** (0.023) | −0.341*** (0.052) | −0.260*** (0.046) |
| Hansen J-test: p-value | 0.419 | 0.901 | 0.711 | 0.769 | 0.944 | 0.994 | 0.972 | 0.965 |
| AR1: p-value | 0.001*** | 0.001*** | 0.001*** | 0.001*** | 0.001*** | 0.001*** | 0.001*** | 0.001*** |
| AR2: p-value | 0.361 | 0.366 | 0.449 | 0.386 | 0.453 | 0.391 | 0.466 | 0.458 |
Notes: All models are estimated using the Arellano and Bover (1995) dynamic panel system GMM estimations. Numbers in parentheses are standard errors, except for Hansen test, AR(1) and AR(2), which are p-values. *** and ** indicate significance at 1% and 5% levels, respectively. Significant time dummies are included in the model specification but the results are not reported to save space.
To further explain the estimated result, we simulate two different scenarios for the institutional quality level. Accordingly, we select two alternative levels of institutional quality in interpreting the results from Table 4. These are (i) INS=0.33 and (ii) INS=0.979, which correspond, respectively, to the lowest and highest level of institutional quality in our sample. For the first scenario, the suggested coefficient of financial development is −0.104, financial development squared is 0.155, and the financial development threshold point is suggested to be 33.6% of GDP.9 The result suggests a U-shaped non-linear relationship between financial development and innovation; this U-shaped finance-innovation curve exists for countries with low institutional quality. The initial negative relationship between finance and innovation implies that financial development hinders innovation activity, as investors are unwilling to channel funds to risky innovation projects with relatively weak institutional quality frameworks to protect their profits. However, as the financial sector develops, ease of information gathering helps investors reduce adverse selection and moral hazard problems. Thus, financial development positively impacts countries’ innovation after the suggested threshold value.
For the second scenario, the suggested coefficient of financial development is 0.217, and for financial development squared, it is −0.080. The threshold point is suggested to be 135.6% of GDP.10 These figures indicate that the finance-innovation framework follows an inverted U-shaped relationship for countries with high institutional quality. The initial positive impact of financial development on innovation suggests that financial development promotes innovation activity for countries with high institutional quality. Nevertheless, further financial development will encourage monopolies and hinder competition. Thus, a negative impact is found after financial development reaches numbers beyond 135.6% of GDP. Overall, the above simulation suggests that the finance-innovation relationship depends on the countries’ initial institutional quality. Specifically, countries with weak institutional quality tend to follow a U-shaped finance-innovation relationship; countries with strong institutional quality tend to follow an inverted U-shaped finance-innovation relationship.
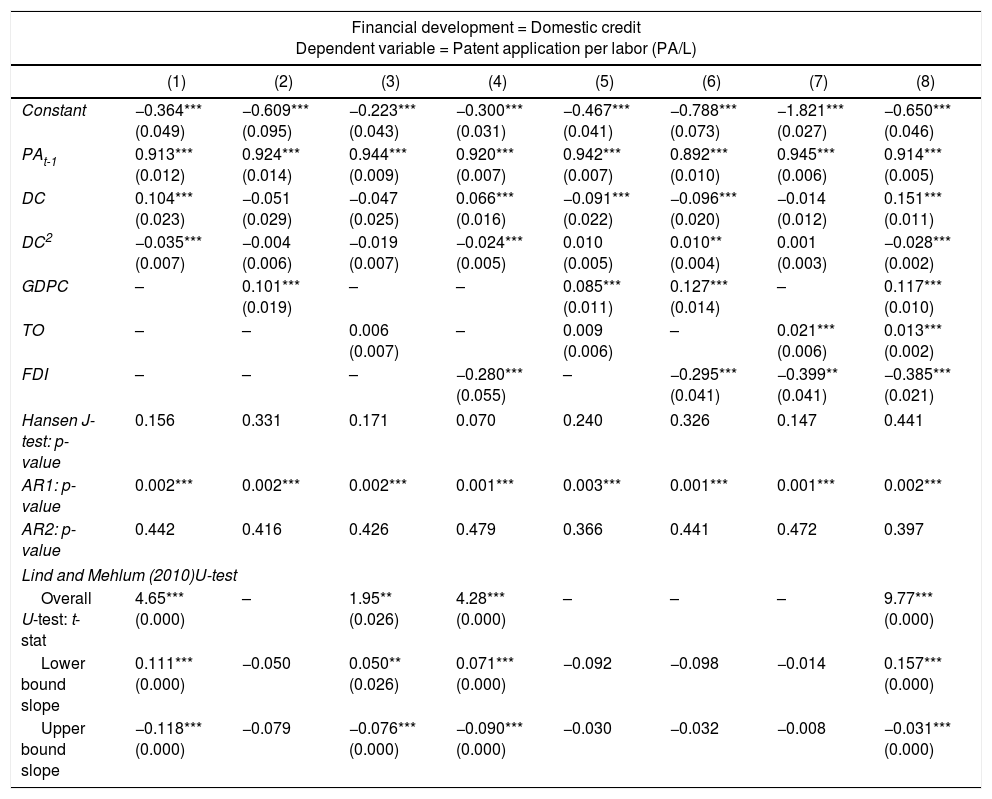
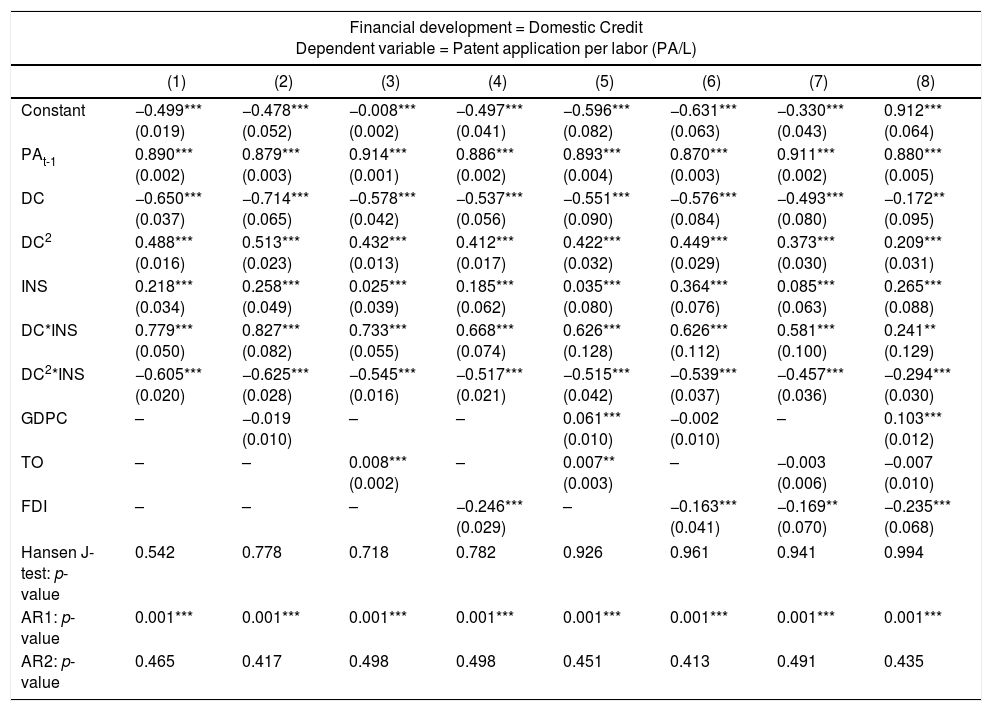
Robustness testIn this section, we employ a different measure of financial development and innovation to test the robustness of our estimated result. First, we use domestic credit as an alternative measurement for financial development. The results are reported in Tables 5 and 6. In Table 5, model 1 shows significant signs of a non-linear relationship between domestic credit and innovation. The empirical result soundly supports our earlier conclusion that the finance-innovation framework follows an inverted U-shaped relationship. However, this result is unattainable after the inclusion of control variables, except in models 3, 4 and 8. In Table 6, a similar pattern in the finance-innovation relationship with the presence of institutional quality is detected. To be precise, countries with weak institutional quality follow a U-shaped finance-innovation relationship, whereas an inverted U-shaped finance-innovation relationship is suggested for countries with high institutional quality.
Robustness Checks using Domestic Credit (DC) as Financial Development.
| Financial development = Domestic credit Dependent variable = Patent application per labor (PA/L) | ||||||||
|---|---|---|---|---|---|---|---|---|
| (1) | (2) | (3) | (4) | (5) | (6) | (7) | (8) | |
| Constant | −0.364*** (0.049) | −0.609*** (0.095) | −0.223*** (0.043) | −0.300*** (0.031) | −0.467*** (0.041) | −0.788*** (0.073) | −1.821*** (0.027) | −0.650*** (0.046) |
| PAt-1 | 0.913*** (0.012) | 0.924*** (0.014) | 0.944*** (0.009) | 0.920*** (0.007) | 0.942*** (0.007) | 0.892*** (0.010) | 0.945*** (0.006) | 0.914*** (0.005) |
| DC | 0.104*** (0.023) | −0.051 (0.029) | −0.047 (0.025) | 0.066*** (0.016) | −0.091*** (0.022) | −0.096*** (0.020) | −0.014 (0.012) | 0.151*** (0.011) |
| DC2 | −0.035*** (0.007) | −0.004 (0.006) | −0.019 (0.007) | −0.024*** (0.005) | 0.010 (0.005) | 0.010** (0.004) | 0.001 (0.003) | −0.028*** (0.002) |
| GDPC | – | 0.101*** (0.019) | – | – | 0.085*** (0.011) | 0.127*** (0.014) | – | 0.117*** (0.010) |
| TO | – | – | 0.006 (0.007) | – | 0.009 (0.006) | – | 0.021*** (0.006) | 0.013*** (0.002) |
| FDI | – | – | – | −0.280*** (0.055) | – | −0.295*** (0.041) | −0.399** (0.041) | −0.385*** (0.021) |
| Hansen J-test: p-value | 0.156 | 0.331 | 0.171 | 0.070 | 0.240 | 0.326 | 0.147 | 0.441 |
| AR1: p-value | 0.002*** | 0.002*** | 0.002*** | 0.001*** | 0.003*** | 0.001*** | 0.001*** | 0.002*** |
| AR2: p-value | 0.442 | 0.416 | 0.426 | 0.479 | 0.366 | 0.441 | 0.472 | 0.397 |
| Lind and Mehlum (2010)U-test | ||||||||
| Overall U-test: t-stat | 4.65*** (0.000) | – | 1.95** (0.026) | 4.28*** (0.000) | – | – | – | 9.77*** (0.000) |
| Lower bound slope | 0.111*** (0.000) | −0.050 | 0.050** (0.026) | 0.071*** (0.000) | −0.092 | −0.098 | −0.014 | 0.157*** (0.000) |
| Upper bound slope | −0.118*** (0.000) | −0.079 | −0.076*** (0.000) | −0.090*** (0.000) | −0.030 | −0.032 | −0.008 | −0.031*** (0.000) |
Notes: All models are estimated using the Arellano and Bover (1995) dynamic panel system GMM estimations. Numbers in parentheses are standard errors, except for Hansen test, AR(1), AR(2) and Lind and Mehlum U-test, which are p-values. *** and ** indicate significance at 1% and 5% levels, respectively. Significant time dummies are included in the model specification but the results are not reported to save space.
Robustness checks using domestic credit (DC) as financial development (with interaction term).
| Financial development = Domestic Credit Dependent variable = Patent application per labor (PA/L) | ||||||||
|---|---|---|---|---|---|---|---|---|
| (1) | (2) | (3) | (4) | (5) | (6) | (7) | (8) | |
| Constant | −0.499*** (0.019) | −0.478*** (0.052) | −0.008*** (0.002) | −0.497*** (0.041) | −0.596*** (0.082) | −0.631*** (0.063) | −0.330*** (0.043) | 0.912*** (0.064) |
| PAt-1 | 0.890*** (0.002) | 0.879*** (0.003) | 0.914*** (0.001) | 0.886*** (0.002) | 0.893*** (0.004) | 0.870*** (0.003) | 0.911*** (0.002) | 0.880*** (0.005) |
| DC | −0.650*** (0.037) | −0.714*** (0.065) | −0.578*** (0.042) | −0.537*** (0.056) | −0.551*** (0.090) | −0.576*** (0.084) | −0.493*** (0.080) | −0.172** (0.095) |
| DC2 | 0.488*** (0.016) | 0.513*** (0.023) | 0.432*** (0.013) | 0.412*** (0.017) | 0.422*** (0.032) | 0.449*** (0.029) | 0.373*** (0.030) | 0.209*** (0.031) |
| INS | 0.218*** (0.034) | 0.258*** (0.049) | 0.025*** (0.039) | 0.185*** (0.062) | 0.035*** (0.080) | 0.364*** (0.076) | 0.085*** (0.063) | 0.265*** (0.088) |
| DC*INS | 0.779*** (0.050) | 0.827*** (0.082) | 0.733*** (0.055) | 0.668*** (0.074) | 0.626*** (0.128) | 0.626*** (0.112) | 0.581*** (0.100) | 0.241** (0.129) |
| DC2*INS | −0.605*** (0.020) | −0.625*** (0.028) | −0.545*** (0.016) | −0.517*** (0.021) | −0.515*** (0.042) | −0.539*** (0.037) | −0.457*** (0.036) | −0.294*** (0.030) |
| GDPC | – | −0.019 (0.010) | – | – | 0.061*** (0.010) | −0.002 (0.010) | – | 0.103*** (0.012) |
| TO | – | – | 0.008*** (0.002) | – | 0.007** (0.003) | – | −0.003 (0.006) | −0.007 (0.010) |
| FDI | – | – | – | −0.246*** (0.029) | – | −0.163*** (0.041) | −0.169** (0.070) | −0.235*** (0.068) |
| Hansen J-test: p-value | 0.542 | 0.778 | 0.718 | 0.782 | 0.926 | 0.961 | 0.941 | 0.994 |
| AR1: p-value | 0.001*** | 0.001*** | 0.001*** | 0.001*** | 0.001*** | 0.001*** | 0.001*** | 0.001*** |
| AR2: p-value | 0.465 | 0.417 | 0.498 | 0.498 | 0.451 | 0.413 | 0.491 | 0.435 |
Notes: All models are estimated using the Arellano and Bover (1995) dynamic panel system GMM estimations. Numbers in parentheses are standard errors, except for Hansen test, AR(1) and AR(2), which are p-values. *** and ** indicate significance at 1% and 5% levels, respectively. Significant time dummies are included in the model specification but the results are not reported to save space.
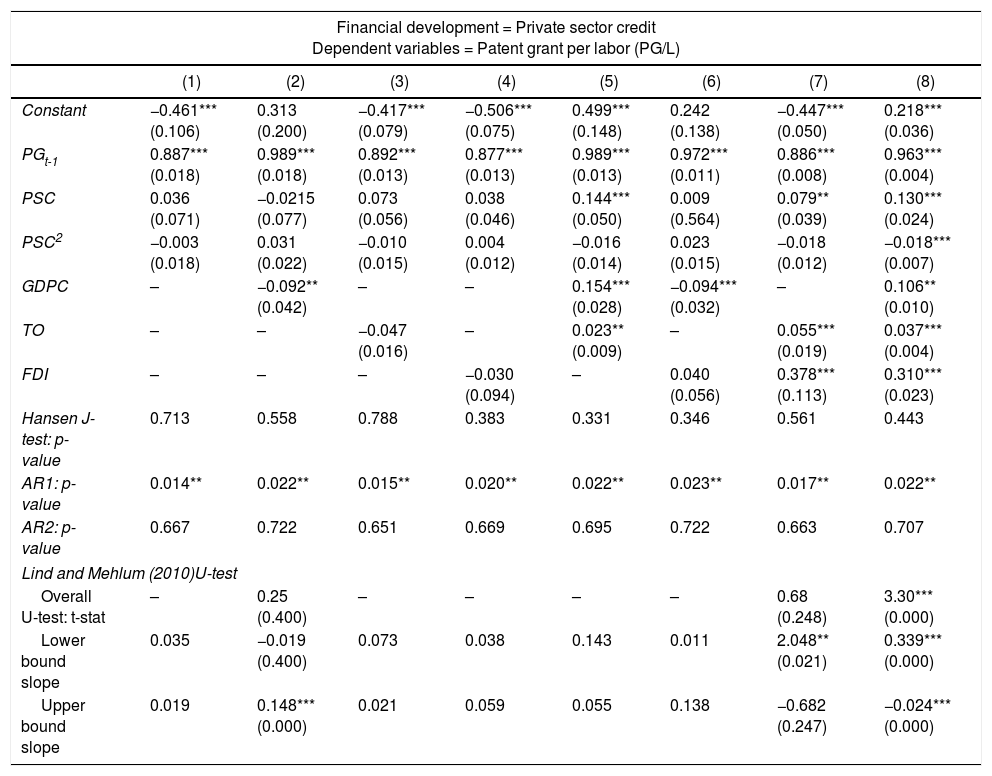
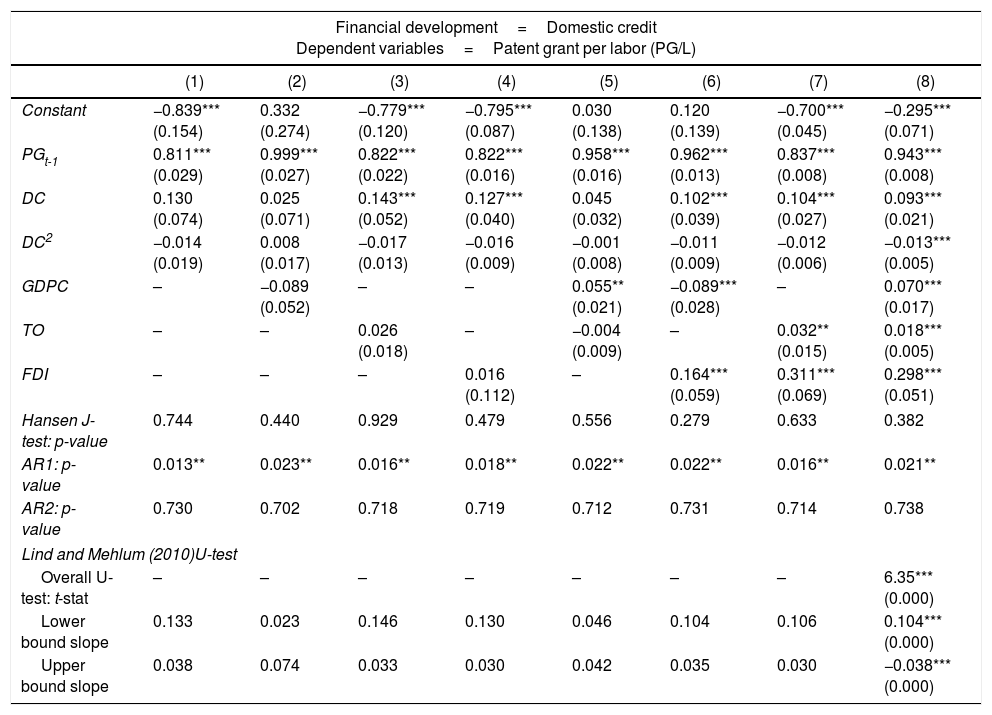
An alternative innovation measurement, patent grant per labor (G/P), is also used in this study as an alternative dependent variable for innovation, and the empirical results are presented in Tables 7 and 8. However, the finance-innovation nexus is only present after the inclusion of control variables and is found to be inverted U-shaped.
Robustness checks using patent grant (PG) as innovation.
| Financial development = Private sector credit Dependent variables = Patent grant per labor (PG/L) | ||||||||
|---|---|---|---|---|---|---|---|---|
| (1) | (2) | (3) | (4) | (5) | (6) | (7) | (8) | |
| Constant | −0.461*** (0.106) | 0.313 (0.200) | −0.417*** (0.079) | −0.506*** (0.075) | 0.499*** (0.148) | 0.242 (0.138) | −0.447*** (0.050) | 0.218*** (0.036) |
| PGt-1 | 0.887*** (0.018) | 0.989*** (0.018) | 0.892*** (0.013) | 0.877*** (0.013) | 0.989*** (0.013) | 0.972*** (0.011) | 0.886*** (0.008) | 0.963*** (0.004) |
| PSC | 0.036 (0.071) | −0.0215 (0.077) | 0.073 (0.056) | 0.038 (0.046) | 0.144*** (0.050) | 0.009 (0.564) | 0.079** (0.039) | 0.130*** (0.024) |
| PSC2 | −0.003 (0.018) | 0.031 (0.022) | −0.010 (0.015) | 0.004 (0.012) | −0.016 (0.014) | 0.023 (0.015) | −0.018 (0.012) | −0.018*** (0.007) |
| GDPC | – | −0.092** (0.042) | – | – | 0.154*** (0.028) | −0.094*** (0.032) | – | 0.106** (0.010) |
| TO | – | – | −0.047 (0.016) | – | 0.023** (0.009) | – | 0.055*** (0.019) | 0.037*** (0.004) |
| FDI | – | – | – | −0.030 (0.094) | – | 0.040 (0.056) | 0.378*** (0.113) | 0.310*** (0.023) |
| Hansen J-test: p-value | 0.713 | 0.558 | 0.788 | 0.383 | 0.331 | 0.346 | 0.561 | 0.443 |
| AR1: p-value | 0.014** | 0.022** | 0.015** | 0.020** | 0.022** | 0.023** | 0.017** | 0.022** |
| AR2: p-value | 0.667 | 0.722 | 0.651 | 0.669 | 0.695 | 0.722 | 0.663 | 0.707 |
| Lind and Mehlum (2010)U-test | ||||||||
| Overall U-test: t-stat | – | 0.25 (0.400) | – | – | – | – | 0.68 (0.248) | 3.30*** (0.000) |
| Lower bound slope | 0.035 | −0.019 (0.400) | 0.073 | 0.038 | 0.143 | 0.011 | 2.048** (0.021) | 0.339*** (0.000) |
| Upper bound slope | 0.019 | 0.148*** (0.000) | 0.021 | 0.059 | 0.055 | 0.138 | −0.682 (0.247) | −0.024*** (0.000) |
Notes: All models are estimated using the Arellano and Bover (1995) dynamic panel system GMM estimations. Numbers in parentheses are standard errors, except for Hansen test, AR(1), AR(2) and Lind and Mehlum U-test, which are p-values. *** and ** indicate significance at 1% and 5% levels, respectively. Significant time dummies are included in the model specification but the results are not reported to save space.
Robustness checks using patent grant (PG) as innovation.
| Financial development=Domestic credit Dependent variables=Patent grant per labor (PG/L) | ||||||||
|---|---|---|---|---|---|---|---|---|
| (1) | (2) | (3) | (4) | (5) | (6) | (7) | (8) | |
| Constant | −0.839*** (0.154) | 0.332 (0.274) | −0.779*** (0.120) | −0.795*** (0.087) | 0.030 (0.138) | 0.120 (0.139) | −0.700*** (0.045) | −0.295*** (0.071) |
| PGt-1 | 0.811*** (0.029) | 0.999*** (0.027) | 0.822*** (0.022) | 0.822*** (0.016) | 0.958*** (0.016) | 0.962*** (0.013) | 0.837*** (0.008) | 0.943*** (0.008) |
| DC | 0.130 (0.074) | 0.025 (0.071) | 0.143*** (0.052) | 0.127*** (0.040) | 0.045 (0.032) | 0.102*** (0.039) | 0.104*** (0.027) | 0.093*** (0.021) |
| DC2 | −0.014 (0.019) | 0.008 (0.017) | −0.017 (0.013) | −0.016 (0.009) | −0.001 (0.008) | −0.011 (0.009) | −0.012 (0.006) | −0.013*** (0.005) |
| GDPC | – | −0.089 (0.052) | – | – | 0.055** (0.021) | −0.089*** (0.028) | – | 0.070*** (0.017) |
| TO | – | – | 0.026 (0.018) | – | −0.004 (0.009) | – | 0.032** (0.015) | 0.018*** (0.005) |
| FDI | – | – | – | 0.016 (0.112) | – | 0.164*** (0.059) | 0.311*** (0.069) | 0.298*** (0.051) |
| Hansen J-test: p-value | 0.744 | 0.440 | 0.929 | 0.479 | 0.556 | 0.279 | 0.633 | 0.382 |
| AR1: p-value | 0.013** | 0.023** | 0.016** | 0.018** | 0.022** | 0.022** | 0.016** | 0.021** |
| AR2: p-value | 0.730 | 0.702 | 0.718 | 0.719 | 0.712 | 0.731 | 0.714 | 0.738 |
| Lind and Mehlum (2010)U-test | ||||||||
| Overall U-test: t-stat | – | – | – | – | – | – | – | 6.35*** (0.000) |
| Lower bound slope | 0.133 | 0.023 | 0.146 | 0.130 | 0.046 | 0.104 | 0.106 | 0.104*** (0.000) |
| Upper bound slope | 0.038 | 0.074 | 0.033 | 0.030 | 0.042 | 0.035 | 0.030 | −0.038*** (0.000) |
Notes: All models are estimated using the Arellano and Bover (1995) dynamic panel system GMM estimations. Numbers in parentheses are standard errors, except for Hansen test, AR(1), AR(2) and Lind and Mehlum U-test, which are p-values. *** and ** indicate significance at 1% and 5% levels, respectively. Significant time dummies are included in the model specification but the results are not reported to save space.
This paper aims to extend the current understanding of the finance-innovation relationship beyond linear specifications. Using system GMM estimators, our results validate the inverted U-shaped finance-innovation relationship in the sample countries, as reflected by the significant positive coefficient of financial development and negative coefficient for its squared value. These findings are also supported by Lind and Mehlum's (2010) U-test. Furthermore, the relationship is robust for both measures of financial development as well as after we control for the effects of GDP per capita, for trade openness and foreign direct investment in innovation.
We then extend our study by incorporating institution interaction terms in our baseline model to examine the role of institutional quality in governing such a non-linear relationship. Interestingly, the shape of the finance-innovation relationship varies with different countries’ institutional quality. Specifically, a U-shaped finance-innovation curve is detected in countries with weak institutional quality in our samples. This implies that the innovation sector in countries with weak institutional quality suffers in the early stages of financial development. This phenomenon may be caused by weak institutional frameworks that stop investors from financing innovation activities.
However, financial development will enhance the innovation sector in these countries when the financial sector develops into a more mature stage. In contrast, an inverted U-shaped finance-innovation curve is detected when countries’ institutional quality is high. This implies that the innovation sector in countries with strong institutional quality benefits from the early stages of financial development. Financial development will hinder the innovation sector in these countries in the later stages of development because of an increase in the contractual interest rate on loans and financial institutions’ monopolization of the financial market. Thus, we conclude that different institutional settings require different policies to promote innovative activities.
The finding of this paper clearly established a theoretical framework on non-linear finance-innovation relationship. This has extended our current understanding on finance-innovation nexus which previously thought to be linear. However, this study merely opens a new area of research on finance-innovation relationship. The generalizability of these results is subject to certain limitations. For instance, the methodology used in this study. This study use panel system GMM to estimate the non-linear finance-innovation relationship. Although the use of panel system GMM in estimating non-linear model has been common in research, others non-linear estimation method is available to be tested empirically for validation such as Kremer, Bick, and Nautz (2014) dynamic panel threshold analysis. In addition, we examine the role of institutional quality in determining the shape of finance-innovation curve in this study. Still, there are more than one variable that mediating the finance-innovation relationship such as social capital, human capital, economic freedom, transparency and etc. Thus, it is recommended that further research be undertaken in the following areas.
| No. | Country | No. | Country | No. | Country |
|---|---|---|---|---|---|
| 1 | Albania | 32 | Indonesia | 63 | South Africa |
| 2 | Algeria | 33 | Ireland | 64 | Spain |
| 3 | Argentina | 34 | Israel | 65 | Sri Lanka |
| 4 | Armenia | 35 | Italy | 66 | Sweden |
| 5 | Australia | 36 | Jamaica | 67 | Switzerland |
| 6 | Austria | 37 | Japan | 68 | Syria |
| 7 | Bangladesh | 38 | Jordan | 69 | Thailand |
| 8 | Belarus | 39 | Kenya | 70 | Turkey |
| 9 | Belgium | 40 | Korea | 71 | Ukraine |
| 10 | Brazil | 41 | Latvia | 72 | United Kingdom |
| 11 | Bulgaria | 42 | Luxembourg | 73 | United State |
| 12 | Canada | 43 | Madagascar | 74 | Uruguay |
| 13 | Chile | 44 | Malaysia | 75 | Vietnam |
| 14 | China | 45 | Malta | ||
| 15 | Colombia | 46 | Mexico | ||
| 16 | Croatia | 47 | Moldova | ||
| 17 | Cyprus | 48 | Morocco | ||
| 18 | Czech Republic | 49 | Netherlands | ||
| 19 | Denmark | 50 | New Zealand | ||
| 20 | Ecuador | 51 | Norway | ||
| 21 | Egypt | 52 | Pakistan | ||
| 22 | Estonia | 53 | Panama | ||
| 23 | Finland | 54 | Paraguay | ||
| 24 | France | 55 | Peru | ||
| 25 | Germany | 56 | Philippines | ||
| 26 | Greece | 57 | Poland | ||
| 27 | Guatemala | 58 | Portugal | ||
| 28 | Hong Kong | 59 | Romania | ||
| 29 | Hungary | 60 | Russian Federation | ||
| 30 | Iceland | 61 | Saudi Arabia | ||
| 31 | India | 62 | Singapore |
The view of financial development helping to facilitate innovative activities is supported by works such as Rajan and Zingales (1998) and Aghion et al. (2007) and empirical analysis such as Ang and Madsen (2012).
Mavrotas and Son (2008) also suggest that financial development can influence innovation indirectly through domestic saving.
These barriers are measured using human genetic distance from the technology frontier.
Several additional papers also study the role of legal systems in financial development. See, in particular, Beck et al. (2001).
The use of dynamic panel system GMM in estimating a quadratic model is also applied in Mansor and Law (2014).
In this study, we used patent application per labor and patent grant per labor as measurements for innovation. This is due to limited data on R&D expenditure, especially for developing countries. In addition, we would like to highlight innovation output rather than input, as volume of R&D expenditure does not necessarily associate with successful innovation.
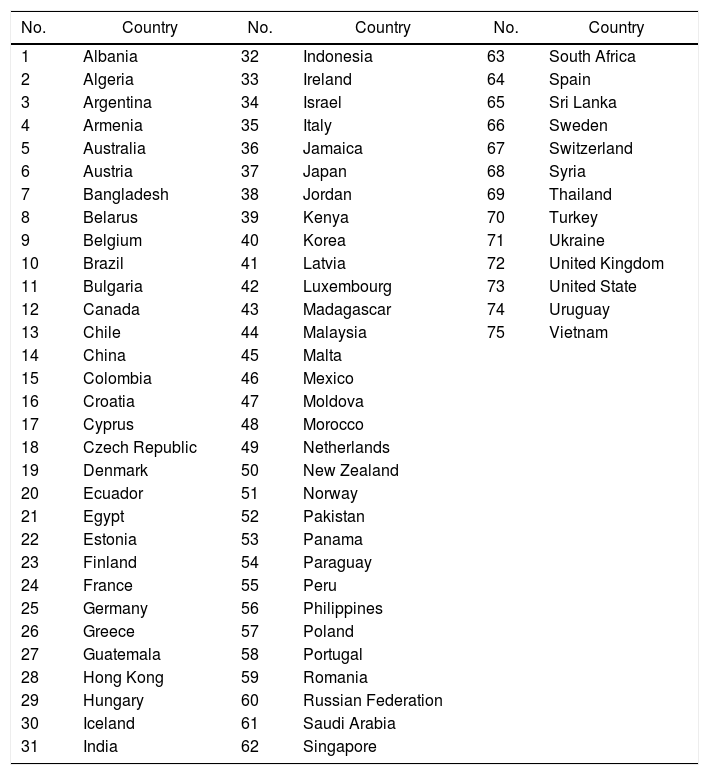
For a list of sample countries covered in this section, refer to Appendix.
The threshold point is estimated by −β12β2, which is −0.2162(−0.084)=1.286.
The threshold point is estimated by −β1+(β1*×INSit)/2β2+(β2*×INSit), which is −−0.267+(0.494×0.33)/20.274+(−0.362×0.33)=0.1042(0.155)=0.336.
The threshold point is estimated by −β1+(β1*×INSit)/2β2+(β2*×INSit), which is −−0.267+(0.494×0.979)/2[0.74+(−0.362×0.979)]=0.2170.080=1.356.