


This study seeks to explain why telecom customers would continue to use mobile value-added services (MVAS), including information, communication, entertainment, and transaction services. We developed a model based on the S-O-R paradigm and existing research on MVAS and mobile service quality, in which we hypothesize that customers' intention to continue using MVAS as a behavioural response (R) is a direct result of their satisfaction with the services and their perception of its value as affective and cognitive states (O), respectively. The developed model also recognizes the importance of mobile service quality (S) in terms of characteristics and features in developing customer satisfaction and perceived value. In this investigation, mobile service quality aspects: customer service, service content, and mobile network quality are utilized as stimuli. The data was collected from 371 respondents utilizing an online survey instrument. PLS-SEM with SmartPLS3 software was used for data analysis. While both customer satisfaction and perceived value have direct positive influences on continuance usage intention, the customer satisfaction effect is more significant, according to the structural findings. Moreover, customer service quality, service content quality, and mobile network quality were all discovered to be direct predictors of perceived value. In contrast, mobile network quality was not revealed to be a significant predictor of customer satisfaction. This paper is one of the few investigating the major factors contributing to the continued use of MVAS in the Arab world. This work adds to the growing knowledge on post-adoption in mobile services and business. This investigation provides crucial suggestions for decision-makers in the mobile telecommunications industry from a practical standpoint.
Mobile business is becoming increasingly omnipresent and pervasive. The progress and distribution of mobile services are now far more apparent and visible in this new era of digital business. Indeed, recent rapid advances in mobile communications (e.g., 3G and above) coupled with computing (e.g., Artificial intelligence (AI) techniques, Internet of Things (IoT), chatbots, and big data analytics) have noticeably changed people's lifestyles as well as business operations and practices (Mian et al., 2022; Sarker et al., 2021). Aside from the economic opportunities they create, such technological innovations enable widespread service delivery, which empowers societies and, as a result, improves their quality of life. Mobile technology also plays a vital role in bridging the digital divide and advancing socio-economic developments in many developing countries (Boakye, 2015; Ochoa et al., 2022), including Jordan, which serves as the context for this research.
Early generations of mobile business enabled users to make voice calls with mobility as an added value. Afterward, to effectively deal with the fierce competition and saturation of the voice market, providers of mobile telecommunications services (abbreviated to telecoms from now on) have begun developing value-added data services to increase their competitiveness as well as to create new revenue sources to improve profitability and increase their market shares (Garg et al., 2022). Indeed, recent advances on the Internet, as well as mobile telecommunications and computing, have shifted the focus of mobile business away from voice-centric services and toward data-centric value-added services (Al-Debei, Al-Lozi & Fitzgerald, 2013; Garg et al., 2022). This has resulted in the proliferation of mobile value-added services (MVAS), which are expected to be one of telecoms' main strategic revenue streams (Ojiaku & Osarenkhoe, 2018). Given the significant transformations that telecoms have undergone over the last decade, the importance of MVAS to telecoms is now apparent. Customers today are more enlightened, expecting advanced high-quality mobile services consistently. Their demands and preferences are also diverse, owing to transformations in the telecommunications industry. Furthermore, competition has become multifaceted and expanded to include other value chain/network players, such as content providers and social media companies, rather than being limited to direct competition with other telecoms (Al-Debei, Al-Lozi, & Papazafeiropoulou, 2013). Such changes have emphasized the significance of MVAS in mobile telecommunications and business.
In Jordan, it is estimated that 89% of people have access to the Internet, and 77% of them have smartphones, according to TRC (2019). Zain, Orange, and Umniah compete vigorously in Jordan's telecommunications market. In 2015, Jordan's youthful digital users could access 4G LTE. The Jordanian population was 98% covered by 4G by the end of 2019, thanks to the country's rapid technology adoption. The introduction and widespread use of 4G has increased revenue from value-added data services. Hence, mobile service providers in Jordan have put a lot of emphasis on MVAS.
Indeed, MVAS services are highly beneficial in stimulating and attracting new customers, retaining existing ones, and lowering churn rates (Wang, 2015; Zhou, 2011). This is essential because one critical factor for telecoms' success is their ability to retain and entice current customers to continue using MVAS as one of their critical sources of revenue (Kim et al., 2021). Nonetheless, maintaining existing customers, increasing market shares, and encouraging customers to continue using MVAS cannot be accomplished without discovering new innovative ways for telecom to differentiate itself from competitors. Furthermore, while telecoms view MVAS as an essential source of revenue, many MVAS services do not yield the anticipated profits (David-West et al., 2020; Wang, 2015). Thus, we believe that to successfully address the impediments to customer loyalty and telecoms profitability, telecoms must first understand the primary aspects that encourage customers to keep utilizing MVAS services. In other words, understanding what stimulus satisfies telecom customers, provides superior value, and ultimately determines their continued purchase and usage intention of MVAS is critical for telecoms to succeed in this challenging and demanding market. This is particularly significant in our context as this paper is one of the few that attempts to investigate the critical factors contributing to the continued use of MVAS in the Arab world.
This study uses the S-O-R paradigm to explore MVAS services continuation usage intentions. The authors also extensively draw on related literature about MVAS and service quality in mobile telecommunications. The authors presume that customers' cognitive (i.e., perceived value) and affective (i.e., customer satisfaction) states regarding MVAS influence their decisions about whether or not to continue using these services. As a result, a reasonable and logical assessment of MVAS's perceived value is combined with an estimate of consumers' reported feelings of satisfaction with MVAS when making such a decision. Because of this, the authors hypothesize that MVAS usage value as perceived by consumers and customer satisfaction levels are the two most important indicators of customers' behavioural responses to continuing MVAS use decisions (R). The authors also believe that customer perceptions of satisfaction and value, as organisms (O), are direct functions of mobile service quality (S), with stimuli such as mobile network quality, service content quality, and customer service quality. Thus, the present study addresses the following research questions: (1) Do mobile services quality dimensions, such as mobile network quality, service content quality, and customer service quality, influence customer satisfaction and perceived value? (2) What impact do customer satisfaction and perceived value have on MVAS continuance intention?
The following are the remaining sections of this study. The authors discuss pertinent literature in section 2 and create the study model and hypotheses. The research design and approach employed in this investigation are described in section 3. In section 4, the conducted analysis using PLS-SEM along with the study's results are presented, whereas the research's outcomes and findings are discussed in section 5. Consequently, in section 6, the implications for theory, research, and decision-makers, in addition to future research directions, are explained. Finally, section 7 presents the study's conclusions.
Theoretical framework and research modelMobile value-added services (MVAS)Mobile value-added services are a collection of pay-per-use data communication services -that excludes short and voice messaging services- which are conducted over mobile networks as well as accessed via smart devices such as smartphones, tablets, iPads, and smartwatches and thus add value to users due to mobility (Hong et al., 2008), along with the benefits associated with other related disruptive technologies such as real-time analytics (Sarker et al., 2021). From the standpoint of customers as users, this type of convergence between mobile communications, computing, and data services has enormous potential in allowing mobile users to communicate richer information and perform various tasks with unprecedented levels of convenience and flexibility. A wide variety of digital services, including communication services such as e-mail, social networking, mobile chatting, and mobile videophone services, are included in mobile value-added services; information services such as Internet browsing, information inquiry, news, location-based services, stock updates, and personalized content; transaction services such as m-banking, m-wallets, m-payments, and m-shopping services; to entertainment services such as video, music, sports live streaming, and games (Al-Debei & Al-Lozi, 2014). Value-added services, in general, attempt to deliver custom-tailored services to the market and assist telecoms in competing and surviving in turbulent business settings (Olya et al., 2018).
The S-O-R paradigmThere is great interest in the field of information systems in examining users' beliefs, attitudes, behavioural intentions, and actions toward various technologies and systems. Many theories and models have been developed and applied to this end. The following are some examples of these models and theories: “the unified theory of technology adoption and use”, “diffusion of innovation theory”, “technology acceptance model”, and “theory of planned behaviour”. Despite their efficacy and value, using such theories in examining non-organizational technologies such as MVAS are not advised (Al-Debei & Al-Lozi, 2014; Kim & Han, 2011; Kim et al., 2007). This is because MVAS services are pay-per-use and thus not free. Furthermore, the decision to purchase MVAS is entirely optional. As a result, whereas employees in businesses are considered technology users, users of MVAS are regarded consumers or customers (Al-Debei & Al-Lozi, 2014; Kim & Han, 2009).
The S-O-R paradigm, introduced in the environmental psychology field, is employed in this investigation (See Mehrabian & Russell, 1974) as part of its theoretical framework. The S-O-R paradigm is deemed very relevant and valuable in this study because it investigates a post-adoption phenomenon (i.e., continuance usage intention) for non-organizational pay-per-use technology (i.e., MVAS). The S-O-R model describes how environmental factors influence people's perceptions and behaviour. Environmental cues are referred to as stimuli (S) in S-O-R, and they arouse individuals' cognitive evaluations and affective judgments, which are referred to as organisms (O), and thus lead to the advancement of behavioural decisions and responses (R) (Mehrabian & Russell, 1974). In terms of MVAS, the stimuli (S) here manifests the factors that affect the efficacy of mobile value-added services (i.e., mobile network quality, service content quality, and customer service quality); the organism (O) reflects mobile customers' cognitive (i.e., perceived value) in addition to affective states (i.e., customer satisfaction). On the other hand, organisms serve as a platform that promotes a specific behavioural outcome, which in our case is continuance purchase intention (R).
The S-O-R paradigm has been employed in various investigations and contexts in information systems (for instance, Lee et al., 2021; Leong et al., 2018). For example, using the S-O-R theory, Chen & Yao (2018) studied how situational factors influence impulsive purchasing behaviour in mobile auctions. Besides that, Chopdar & Balakrishnan (2020) studied the variables that affect repurchase satisfaction and intention in m-commerce employing the S-O-R framework. Furthermore, Tak & Gupta (2021) examined the impact of travel mobile app features on customer engagement from an S-O-R perspective. Consequently, the authors appreciate that the Stimulus-Organism-Response (S-O-R) paradigm is appropriate and relevant for the ongoing investigation and offers a robust theoretical foundation, especially when combined with relevant literature related to MVAS and mobile service quality as in this study.
Mobile service qualityService quality (SQ) is a multidimensional notion that has grasped much attention in marketing and information systems. Because human attitudes and perceptions influence service quality, it is thought to be difficult to replicate (Zhou et al., 2021). Previous studies have identified service quality as a critical element determining the performance of service organizations such as telecoms, as well as their market shares and profitability (Kar, 2020; Wang;, 2015; Zeithaml, 2000). The SQ concept is expressed in different manners in the mobile business setting. According to Zhou et al. (2021), SQ refers to the functions of mobile services and apps that can meet the needs and requirements of their intended users. Shin and Kim (2008) define the concept as customers' overall perception of a telecom's relative efficiency. Ojiaku and Osarenkhoe (2018) describe the discrepancy between the service's performance and customer expectations as SQ.
However, service quality generally can be viewed from two perspectives (Zhao et al., 2012). From the first standpoint, SQ represents the difference between what customers anticipate and how they view a service's performance (Parasuraman et al., 1988). SQ, on the other hand, is characterized as “the customer's overall assessment of the service's superiority or excellence” (Zeithaml, 1988), or comparably as the overall opinion of customers regarding an organization along with its services' relative inferiority or superiority (Bitner & Hubbert, 1994). The second view of service quality was chosen for this study based on its fit with the current study's objectives.
Service quality includes a variety of dimensions and attributes that users or customers seek. This study contends that SQ dimensions differ across business domains, contexts, and individuals (Hsu & Tang, 2020; Zhou et al., 2021). Thus, the authors believe that SQ should be considered in this study in terms of quality attributes closely related to mobile business in general and MVAS in particular. There have been some attempts in the mobile business domain to define dimensions and attributes of service quality. For instance, Chae et al. (2002) proposed that quality attributes related to connection, context, content, and interaction are four main features for assessing the information quality of mobile Internet services.
Additionally, Kim et al. (2004) discovered that value-added services, call quality, and customer support are three significant measures for evaluating mobile SQ in South Korea. Aiming to explore the primary determinants of loyalty and satisfaction of mobile customers, Lim et al. (2006) argued that mobile SQ can be measured based on the billing systems and pricing plans available, as well as the quality of the mobile network and the nature of customer support and care. Kuo et al. (2009) investigated the SQ of MVAS and proposed four elements: visual design and navigation; content quality; connection and system reliability; the variety of mobile services, in addition to customer support. Furthermore, Lu et al. (2009) established a multidimensional and hierarchical model for assessing mobile SQ, arguing that the critical dimensions of SQ are interaction quality (reflected by expertise, attitude, and problem-solving), environment quality (reflected by the situation, equipment, and design), and outcome quality (reflected by tangibles, punctuality, and valence). Also, in cross-national research of mobile Internet services, Vlachos et al. (2011) proposed that SQ can be assessed based on efficiency quality (reflected by practicality and ease of use), outcome quality (reflected through the variety of content as well as aesthetics), and the quality of customer care (reflected by customer service, privacy, and customization). Huang et al. (2015) proposed a five-factor scale to evaluate m-commerce experiences: contact, fulfilment, responsiveness, privacy, and efficiency. Zhou et al. (2021) recently suggested that service quality in m-banking is driven by interface design, system quality, and security assurance.
The current study divides mobile service quality into three major dimensions relying on a former review of pertinent literature: service content quality, mobile network quality, and customer service quality. The technical quality of MVAS in terms of system reliability, availability, and performance (i.e., response time and latency) is captured by mobile network quality. Service content quality represents the appropriateness, accuracy, completeness, innovativeness, and aesthetics of mobile service content and design. Customer service quality reflects service variety, tariff variety, and telecom's overall support effectiveness.
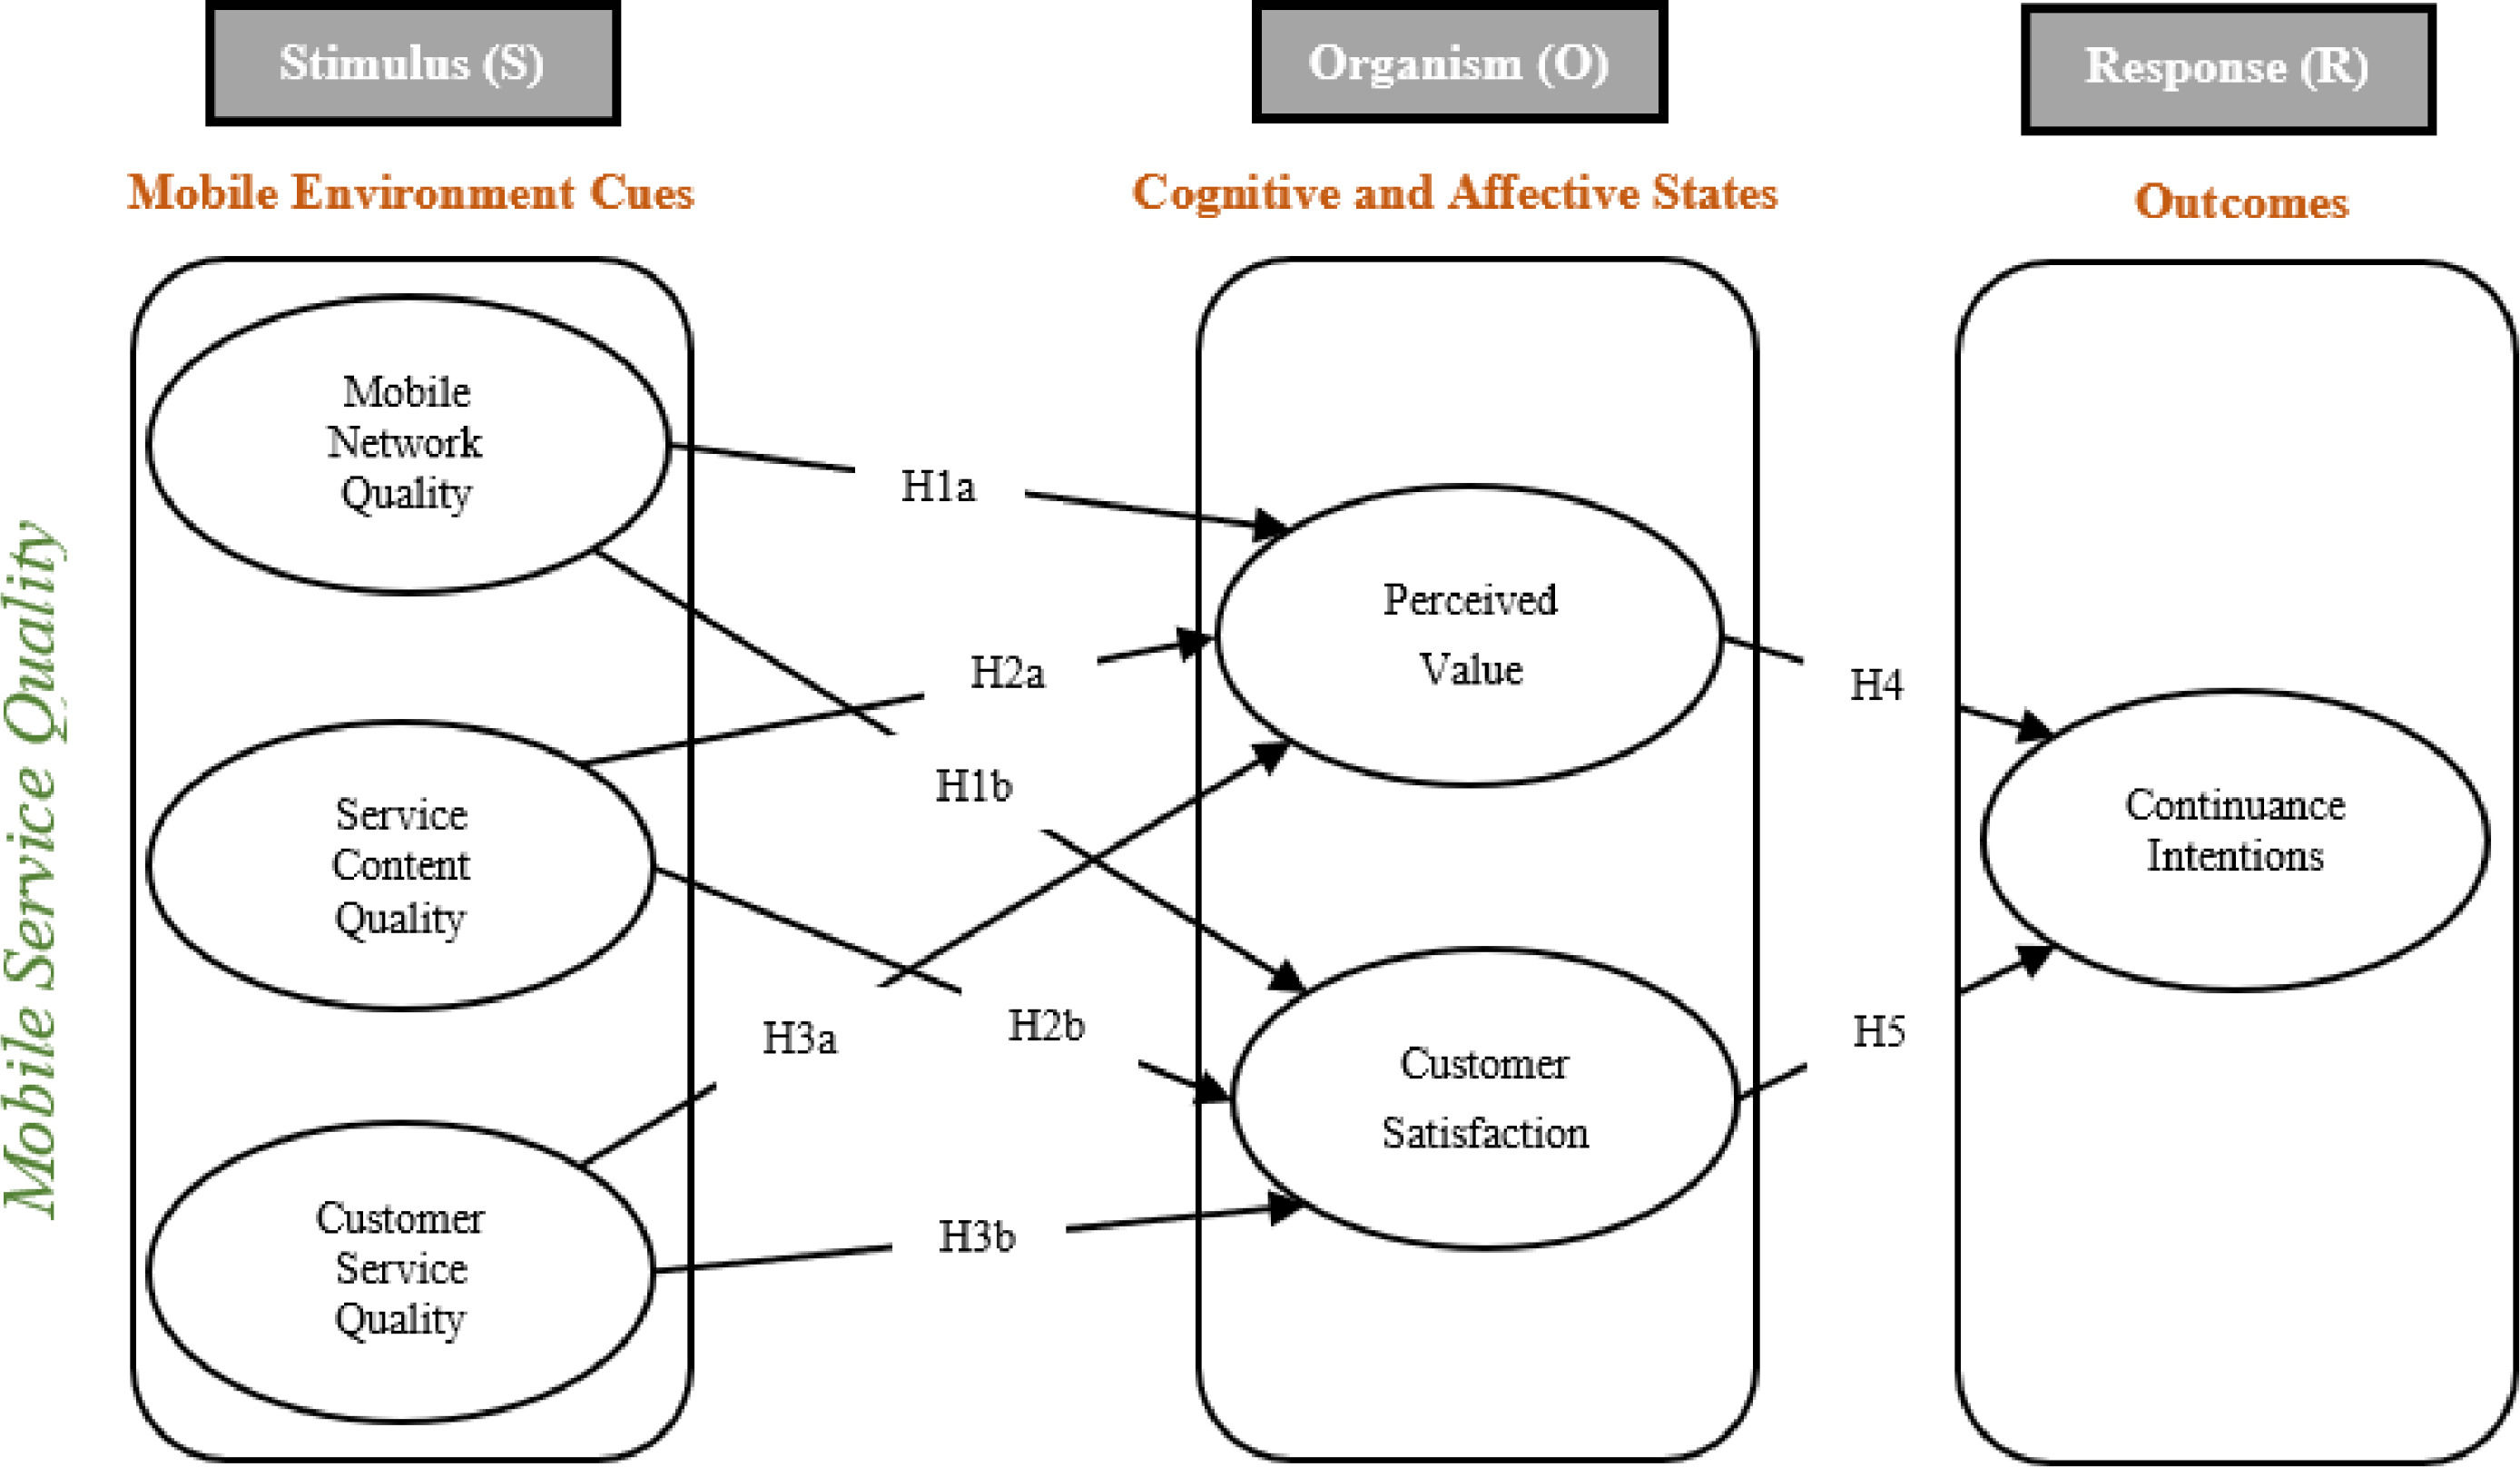
Hypotheses developmentThis study utilizes the S-O-R framework and relevant research on MVAS and mobile service quality to investigate MVAS customer-level continuance usage intentions. The current research recognizes the importance of service quality as a stimulus (S) in the formation of perceived value (i.e., cognitive states) and customer satisfaction (i.e., affective states) as organisms (O). Quality in the service domain, in our opinion, should be measured by what customers receive rather than what suppliers provide. The authors suppose that the choice regarding continuance usage intention (R) is an immediate function of customer satisfaction and perceived value. In other words, we consider that consumers are highly prone to keep utilizing MVAS services if they encounter appropriate levels of satisfaction and perceived value.
As a result, it is plausible to hypothesize that MVAS inducements are the outcome of continual advancements in the mobile network, service content, and customer service quality. These mobile service quality attributes (S) impact customer satisfaction and perceived value (O). Customers would experience certain benefits and gains from using MVAS while making sacrifices, such as paying the MVAS fee, and thus perceived value would be evaluated. Furthermore, using MVAS would shape consumer emotions such as satisfaction/dissatisfaction. If the perceived value is positive and consumers are satisfied, MVAS will be used repeatedly (R). Fig. 1 depicts the study model.
.")
The study model (Adapted after Al-Debei & Al-Lozi, 2014; Kim et al., 2007; Kuo et al., 2009).
Existing research concerning mobile business supports the notion that SQ impacts customers’ perceived value. Turel & Serenko (2006), for instance, discovered that mobile SQ had a favourable impact on perceived customer value in Canada. According to Kuo et al. (2009), the quality of mobile services positively influences Taiwanese mobile customers' perceived value. Also, in Taiwan, He & Li (2010) discovered that, in addition to network quality, mobile service quality dimensions impact perceived value. Shin (2014) also demonstrated that system quality, service quality, and content quality influence utilitarian and hedonic value elements. Recently, De Leon et al. (2020) found that SQ, as reflected by customization, convenience, design, fun, enjoyment, security, and assurance, positively impacts mobile banking's perceived value. Furthermore, Yang et al. (2021) found that portability and visual appeal, as environmental stimuli, influence customers' perceived value in mobile commerce settings. Accordingly, it is reasonable to hypothesize in this study that dimensions of mobile SQ are considered antecedents to perceived value. As mobile service quality improves, the overall value of MVAS as perceived by customers is likely to improve. As a result, we propose the following hypotheses.
H1a. Mobile network quality of MVAS positively impacts perceived value
H2a. Service content quality of MVAS positively impacts perceived value
H3a. Customer service quality of MVAS positively impacts perceived value
The favourable influence of SQ on customer satisfaction is also hypothesized in the study model. The notion is that perceptions of SQ are viewed as stimuli with positive or negative implications for mobile customer satisfaction. As a result, it suggested that as MVAS quality improves, so will the likelihood of customer satisfaction. Moreover, in the mobile business field, the positive impact of SQ on customer satisfaction is also supported. For instance, Kim et al. (2004) revealed that the dimensions of mobile SQ (i.e., value-added services, call quality, and customer support services) positively impact customers' satisfaction in South Korea. By evaluating data acquired from mobile customers in Canada, Turel & Serenko (2006) indicated that service quality is a significant predictor of customer satisfaction. According to Kuo et al. (2009), mobile service quality parameters directly and positively influence customer satisfaction. In addition, Zhou (2011) further demonstrated that mobile service quality directly impacts customer satisfaction.
Consequently, Zhao et al. (2012) found that the three aspects of mobile service quality (outcome quality, interaction quality, and environmental quality) have a substantial and favourable influence on overall satisfaction in China. Interestingly, Chen & Yao (2018) indicated that ubiquity (access to mobile services anytime and anywhere) has a positive effect only when the ubiquitous services do not fail to satisfy mobile customers. Besides that, Sharma & Sharma (2019) discovered that service quality and information quality impact satisfaction, but that system quality is not a strong predictor of customer satisfaction in m-banking services, based on the DeLone & McLean information systems success model. Further, Wang et al. (2019) specified that interaction quality (refers to the experience of customers interacting with the mobile service provider), as well as environment quality (pertains to the quality of the equipment and interface in addition to the appropriateness of content), are vital factors of continuance intention of mobile communication services, while outcome quality (e.g., punctuality, tangibles, and valences) is not. Recently, Kim et al. (2021) revealed that information quality (i.e., accuracy, timeliness, and relevancy), and service quality (in terms of convenience and accessibility) possess a direct and positive impact on the satisfaction of mobile shopping applications. We suggest the mentioned hypotheses relying on the preceding discussion.
H1b. Mobile network quality of MVAS positively impacts customer satisfaction
H2b. Service content quality of MVAS positively impacts customer satisfaction
H3b. Customer service quality of MVAS positively impacts customer satisfaction
Perceived value refers to consumers' overall assessments of the usefulness of a good or service based on what is purchased and what is provided (Zeithaml, 1988: p.14). Likewise, Monroe (1990) described value perceptions as a trade-off between the perceived cost/sacrifice of paying the cost and the perceived quality/benefits of the product/service. These descriptions are in line with behavioural decision theory's cost-benefit perspective (Johnson & Payne, 1985), which claims that a person's choice between various tactics is predicated on a trade-off between the costs, effort, and time needed to implement the strategy and the utility of the ensuing decision.
The value concept has primarily been borrowed from economics and marketing research (Akroush & Mahadin, 2019; Al-Debei, Al-Lozi & Papazafeiropoulou, 2013). In mobile business research, the idea of value is usually characterized as a cognitive assessment of a service's "give" and "get" elements. Consequently, value is created when a consumer obtains advantages surpassing the expense or compromise of utilizing mobile service. Perceived value is among the most crucial influencing variables for customers while making various decisions, as per available research (Al-Debei, Al-Lozi, & Papazafeiropoulou, 2013; Kim & Han, 2009; Loh et al., 2020; Sweeney & Soutar, 2001; Wang & Teo, 2020; Zheng et al., 2017). The perceived value construct has been utilized in past research to acknowledge its importance in the context of post-adoption regarding continuance usage of MVAS services and apps (for example, Chen & Fu, 2018; Chopdar & Balakrishnan, 2020; Karjaluoto et al., 2019; Shang & Wu, 2017). This was founded on the notion that customers' perceived value influences their decision-making procedure for pay-per-use services (Chen & Fu, 2018; Choi, 2018; Hsu & Tang, 2020; Kim & Han, 2011; Shaw & Sergueeva, 2019).
However, the use of the "value" construct in the information systems domain, in general, is relatively contemporary, and its application in the context of MVAS post-adoption is minimal. Indeed, only a few studies have been conducted on adopting a value-based strategy to justify the continuance usage intention utilizing mobile value-added applications and services. For instance, Kim et al. (2007) made an exception by using consumer choice and decision-making theory to clarify mobile Internet usage. In their study, perceived usefulness, perceived fee, perceived enjoyment, and technicality are all factors that influence perceived value. Further, Kim et al. (2007) discovered that perceived value significantly affects the intention to continue using the mobile Internet. Moreover, Kuo et al. (2009) supported that perceived value strongly predicts MVAS post-adoption intentions. Likewise, Chen & Fu (2018) highlighted the implications of hedonic, utilitarian, and sociability value elements on the continuance intentions of mobile image-based social networking.
Similarly, Karjaluoto et al. (2019) implied that the perceived value of mobile financial services strongly impacts customer commitment. In mobile commerce settings and relying on the S-O-R model, Chopdar & Balakrishnan (2020) revealed that perceived value positively influences repurchase intention. Depending on the preceding discussion, this research hypothesizes that the perceived value of MVAS has a direct and positive impact on consumers' continuance usage intention, as stated in the hypothesis below.
H4. Perceived value of MVAS positively influences continuance usage intention
Customer satisfaction may be described as an “emotional response” to the entire purchasing process (Spreng et al., 1996). Cumulative satisfaction and transactional satisfaction are the two types of customer satisfaction. Transactional satisfaction is a person's assessment of a given service experience at a particular time. Thus, it depends on the latest consumption experience with a service (Boulding et al., 1993). Cumulative satisfaction, on the other hand, is an overall assessment of all services encountered over time, and hence, it is based on the customer's overall consumption experience (Johnson et al., 1995). According to this distinction, the total accumulation of all transaction-specific satisfaction at various moments is known as cumulative satisfaction (Zhao et al., 2012). When measuring an organization's service performance, it has been rationally stated that cumulative satisfaction is more capable than transaction-specific satisfaction (Parasuraman et al., 1988). Moreover, the cumulative customer satisfaction perspective is considered more appropriate for information systems studies. As a result, it has been widely used in previous related literature to explain continuance intentions (e.g., Hsu & Lin, 2016; Karjaluoto et al., 2019). In this investigation, we apply the cumulative satisfaction viewpoint and characterize customer satisfaction as the extent to which a customer perceives total MVAS usage satisfactorily, relying on prior encounters. As a consequence, customer satisfaction, in our viewpoint, is essentially an affective evaluative condition (Hsu & Lin, 2016).
The role of customer satisfaction in explaining the continuance intentions of various technologies is critical. Indeed, it was proposed that if a person is satisfied with their prior first-hand encounters with technology, they are more likely to want to use it repeatedly (Boakye, 2015; Kalia et al., 2022). This is because using a particular technology reinforces an individual's positive attitude toward it (Al-Debei, Al-Lozi, & Papazafeiropoulou, 2013). In the mobile business, previous studies have also offered support and empirical validations on the influence of customer satisfaction on continuance adoption intention. For example, customer satisfaction in China is a strong predictor of the post-purchase intention of MVAS, according to Kuo et al. (2009). Customer satisfaction is also one of the primary determinants of mobile service continuance, according to Zhou (2011). Likewise, Zhao et al. (2012) found that cumulative satisfaction had a favourable impact on the continuance intention to utilize MVAS in the future. Consumers may not remain to use mobile payment services if they are dissatisfied, according to Zhou (2013). Customer satisfaction is a crucial determinant of continuance intentions in mobile communication apps and services, according to Wang et al. (2019). Kim et al. (2021) recently indicated that customer satisfaction in mobile shopping apps leads to the development of customer loyalty, which symbolizes continuance usage intentions. Hence, improved customer satisfaction is anticipated to increase the likelihood that customers will continue to use MVAS services. As a result, we propose the following hypothesis as follows.
H5. Customer satisfaction with MVAS positively influences continuance usage intention
Jordan's government recognizes the importance of information and communication technologies in significantly improving the country's economy and people's quality of life. Jordan's telecommunications sector is managed by two key institutions: the Ministry of Digital Economy and Entrepreneurship (MoDEE) and the Telecommunications Regulatory Commission (TRC). According to TRC (2019), Jordan has an Internet penetration rate of around 89%, with a mobile penetration rate of 77%. Jordan's telecommunications market is highly competitive, with fierce competition among the three leading operators: Zain, Orange, and Umniah.
Jordan is among the most technologically advanced countries in the Middle East regarding mobile telecommunications. Mobile operators in 2015 made 4G LTE services available to Jordan's young digital consumers. Jordan's adoption of 4G was rapid, with population coverage of 4G mobile networks reaching more than 99% by the end of 2019. Indeed, the launch and spread of 4G services have resulted in increased revenue from value-added data services. As a result, mobile value-added services have emerged as a critical focus area for Jordan's mobile operators.
Nowadays, telecoms in Jordan fully recognize that to make long-term progress; more emphasis must be placed on introducing new levels of value-added services to customers, as such services represent strategically essential revenue streams for them. Furthermore, the success of 4G mobile networks and the value-added services would encourage operators to begin the next wave of developments involving 5G and IoT services. Based on the preceding discussion, we find Jordan is an excellent setting for our investigation.
Research design and data collectionBecause this study is investigating the phenomenon of post-adoption, data from current customers who have had direct experience with MVAS must be collected. Early MVAS adopters are highly innovative, mainly from the younger generation (i.e., 18 to 30 years old). Individuals of this age group are principally students in the higher education institutions in Jordan. As a result, students in this age range were selected to reflect the research population. A well-structured and self-completion online survey was created based on previous relevant literature, and participation was voluntary. The data were gathered between July and October of 2021. Using an online questionnaire as a data collection method was thought to be positive, especially given the country's social distancing procedures aimed at controlling the spread of the COVID-19 pandemic. Google forms were used to design and host the online web-based questionnaire.
The questionnaire was created in two languages: Arabic and English. Sperber et al. (1994) back-translation procedure was used to ensure that both versions were accurately relevant. The first version, in particular, was created in English and then professionally translated into Arabic. Another professional translator then reverse-translated the Arabic version into English. Both versions were compared and refined as needed to ensure that the Arabic and English versions were highly consistent and error-free.
After that, a panel of five academics with experience in mobile business and communications, as well as three expert MVAS users, were asked to evaluate and review the relevance of each construct's items. Some changes were made to enhance the relevancy, comprehensibility, and readability of the questionnaire items relying on the constructive and instrumental comments received from the panel. Before it was sent out, the questionnaire was also pilot tested on 52 individuals. The goal was to achieve acceptable reliability and validity while eliminating ambiguities and thus increasing the credibility of the measurement items and their corresponding constructs (van Wijk & Harrison, 2013). The results of the pilot testing demonstrated all constructs possessed a Cronbach's α > 0.7, which confirms the presence of internal consistency and reliability for all constructs (Hair et al., 2019). The conducted pilot work establishes face validity in the current study. As for content validity, the present study demonstrates it by explaining the procedure used to develop the research questionnaire, which included: first, reviewing previous empirical and theoretical work on MVAS continuance usage intention; second, conducting a pilot study before starting the fieldwork.
This study's participants were chosen using snowball and convenience sampling techniques. A screening question was introduced at the start of the questionnaire to assure the involvement of individuals who have used MVAS in Jordan. A link to the online survey was sent to the majority of responders in e-mail, and it was also publicized on social media. As a consequence, 394 questionnaires were submitted. Due to missing values and frequent skipped questions, 23 questionnaires were rejected during the screening procedure. There were 371 entries (n=371) that may be utilized for data analysis.
Constructs and measurement itemsContinuance Usage Intention (CUI), Customer Satisfaction (SAT), Perceived Value (PV), Customer Service Quality (CSQ), Service Content Quality (SCQ), and Mobile Network Quality (MNQ) are the constructs of relevance in this research. The components covered in the suggested model were all operationally characterized by relying on existing literature. Table 1 displays the items on the questionnaire. Various researchers' studies, for instance, Chae et al. (2002), Kim et al. (2004), and Kuo et al. (2009), were employed to develop measurements for mobile SQ dimensions (CSQ, SCQ, and MNQ). PV measurements were derived from Kim et al. (2007) and Al-Debei and Al-Lozi (2014). As for SAT, measurements were borrowed from Bhattacherjee (2001). Finally, measurements of CUI were based on the work of Mathieson (1991) and Bhattacherjee (2001). All of the items were graded on a “five-point Likert scale”, with 1 indicating "strongly disagree" and 5 indicating "strongly agree." Customer satisfaction was measured utilizing a separate five-point Likert scale, as shown in Table 1.
Construct measurements.
| Construct | Items | Source |
|---|---|---|
| Mobile Network Quality (MNQ) | It does not take too much time to download the content I need | Chae et al. (2002); Kim et al. (2004); Kuo et al. (2009) |
| Error seldom occurs in MVAS system | ||
| MVAS system is stable and reliable | ||
| MVAS services can instantly react to the data I input | ||
| Service Content Quality (SCQ) | MVAS services provide complete content | Chae et al. (2002); Kim et al. (2004); Kuo et al. (2009) |
| MVAS services provide appropriate content | ||
| MVAS services provide regularly updated content | ||
| MVAS services are displayed in a harmonious way | ||
| Customer SupportQuality (CSQ) | This telecom company provides diversified MVAS | Chae et al. (2002); Kim et al. (2004); Kuo et al. (2009) |
| This telecom company provides multiple tariff options concerning MVAS | ||
| When any problem related to MVAS occurs, the telecom company can instantly cope with it | ||
| This telecom company provides a good service for MVAS | ||
| PerceivedValue (PV) | Compared to the fee I need to pay, the use of MVAS would offer a good value for the money. | Al-Debei and Al-Lozi (2014); Kim et al. (2007) |
| Compared to the effort I need to put in, the use of MVAS would be beneficial to me. | ||
| Compared to the time I need to spend, the use of MVAS would be worthwhile to me. | ||
| Overall, the use of MVAS would deliver me good value. | ||
| CustomerSatisfaction (SAT) | How do you feel about your overall experience of MVAS?use: Very dissatisfied/Very satisfied. | Bhattacherjee (2001) |
| How do you feel about your overall experience of MVAS?use: Very displeased/Very pleased. | ||
| How do you feel about your overall experience of MVAS?use: Very frustrated/Very contented. | ||
| How do you feel about your overall experience of MVAS?use: Absolutely terrible/Absolutely delighted. | ||
| Continuance Usage Intention (CUI) | I intend to continue using MVAS in the future rather than discontinue its use. | Mathieson (1991); Bhattacherjee (2001) |
| I will continue using MVAS in the future | ||
| I will regularly use MVAS in the future | ||
| If I could, I would like to discontinue my use of MVAS. |
According to the sample's descriptive statistics, 58% were males and 42% of the respondents were females. The sample's majority of respondents (56%) were between the ages of 18 and 21. Respondents between the ages of 22 and 25 made up approximately 29% of the sample, while those between the ages of 26 and 30 made up approximately 15% of the sample. Only 22% of respondents completed postgraduate degrees, whereas most (78%) were doing undergraduate degrees. Additionally, according to the sample's descriptive statistics, communication services are the most popular in Jordan, with nearly 67% of respondents using such services. Information content services were also popular in Jordan, albeit to a lesser extent than communication services, with descriptive statistics indicating that approximately 55% of respondents use this type of MVAS. On the other hand, entertainment services were discovered to be used less frequently than communication and information content services, with approximately 48% of respondents using this type of MVAS. Finally, transaction services are used only by a specific customer segment in Jordan (i.e., 23% of the respondents). The respondents of this study who are subscribers to Zain, Orange, and Umniah represent 42%, 34%, and 24% of the sample, respectively. The details for the study's respondents are shown in Table 2.
Sample description.
The analysis method employed in this work is structural equation modelling (SEM) using partial least squares (PLS). For theoretical testing and validation, PLS-SEM is widely employed (Sarstedt, Ringle & Hair, 2021). PLS-SEM is currently a commonly utilized research tool due to its capacity to predict complicated models without placing distributional assumptions on the data (Hair et al., 2019). PLS-SEM is also favoured since it supports a variety of advanced statistical tools for path model robustness checks (Hair et al., 2019). Data analysis in this study was carried out using SmartPLS3 software (Ringle et al., 2015) based on PLS-SEM Confirmatory Composite Analysis (CCA). First, as demonstrated in the preceding section, we addressed preliminary considerations related to operational definitions of constructs, sampling, survey development and data collection, pilot study and face validity, and finally, content validity as proposed by Hair et al. (2019). The two-phase strategy proposed by Gerbing and Anderson (1988) was subsequently implemented. The measurement model is the initial stage, which evaluates constructs' content convergent and discriminant validity. The structural model is the following step, in which the study model's provided hypotheses are evaluated, and path analysis is undertaken.
Measurement modelThe initial primary concern in PLS-SEM analysis is to determine whether the study model is a formative or reflective measurement model by examining the measurement items of the covered constructs (Hair et al., 2019). Indeed, it is critical to evaluate whether the link between the latent variable and the measurement items is formative or reflective before progressing with the PLS-SEM analysis since creating a measurement model in PLS-SEM is not always a simple procedure. This is due to the fact that each measurement model necessitates significantly different testing; therefore, selecting the appropriate measurement model is essential to ensure the robustness and validity of the analysis and the research outcomes (Hair et al., 2019).
To specify the measurement model, Confirmatory Tetrad Analysis (CTA-PLS) is used in this study (See Gudergan et al., 2008). The only constraint in using CTA-PLS is that the test can only assess constructs that engage at least four measurement items which is not a challenge in this research as all included constructs are measured using four items, as shown in Table 1. The use of CTA-PLS is valuable to establish a piece of empirical evidence that the model under investigation is formative or reflective. The decision rule here depends on whether a construct's tetrads are significantly different from zero or not (Hair et al., 2019). The findings of the current investigation propose that all the measurements of constructs used in the path modelling are reflective (See Appendix A). This is because the construct's tetrads are not substantially distinct from zero. If zero falls between the CI Low adj. and CI Up adj. for at minimum one of the construct's tetrads, then the measurement model is reflective (Wong, 2019).
Reflective measurement models are evaluated utilizing some criteria, which include (1) indicator loadings; (2) internal consistency and reliability (utilizing Cronbach's alpha (α) and composite reliability (CR); (3) convergent validity (utilizing average variance extracted (AVE)); as well as (4) discriminant validity (utilizing HTMT and Fornell–Larcker tests) (Hair et al., 2019). Reflective indicator loadings greater than 0.708, construct CRs greater than 0.70 and lower than 0.95, as well as an AVE of 0.50 or above are all strongly recommended by Hair et al. (2019). The requirements above for reflective measurement models are fulfilled well in this investigation, as indicated in Table 3.
Construct reliability and convergent validity.
Regarding discriminant validity, two tests are employed to examine whether or not the discriminant validity is accomplished in this investigation. The first test is the Fornell & Larcker (1981) test. When the square root of each construct's AVE is greater than the association between each construct and every other construct in the model, the test implies that discriminant validity is acknowledged. As demonstrated in Table 4, the measurement instrument's discriminant validity is accepted since the square root of each construct's AVE is higher than all other cross-correlations with other constructs. Second, the HTMT- "Heterotrait-Monotrait ratio" test is conducted (Wong, 2019). As shown in Table 5, all values for conceptually different constructs covered in this study are less than 0.85, confirming the results of Fornell–Larcker test and acknowledging the existence of discriminant validity. In summary, it can be established that all measures used in the current study show satisfactory reliability and validity.
Fornell and Larcker's discriminant validity test.
| Research constructs | MNQ | SCQ | CSQ | PV | SAT | CUI |
|---|---|---|---|---|---|---|
| MNQ | 0.892 | |||||
| SCQ | 0.769 | 0.874 | ||||
| CSQ | 0.757 | 0.761 | 0.876 | |||
| PV | 0.742 | 0.782 | 0.767 | 0.837 | ||
| SAT | 0.634 | 0.717 | 0.709 | 0.786 | 0.870 | |
| CUI | 0.683 | 0.750 | 0.673 | 0.760 | 0.790 | 0.887 |
Note: “The square roots of the constructs' AVE values are shown in the diagonal line (in bold); non-diagonal elements are latent variable correlations”.
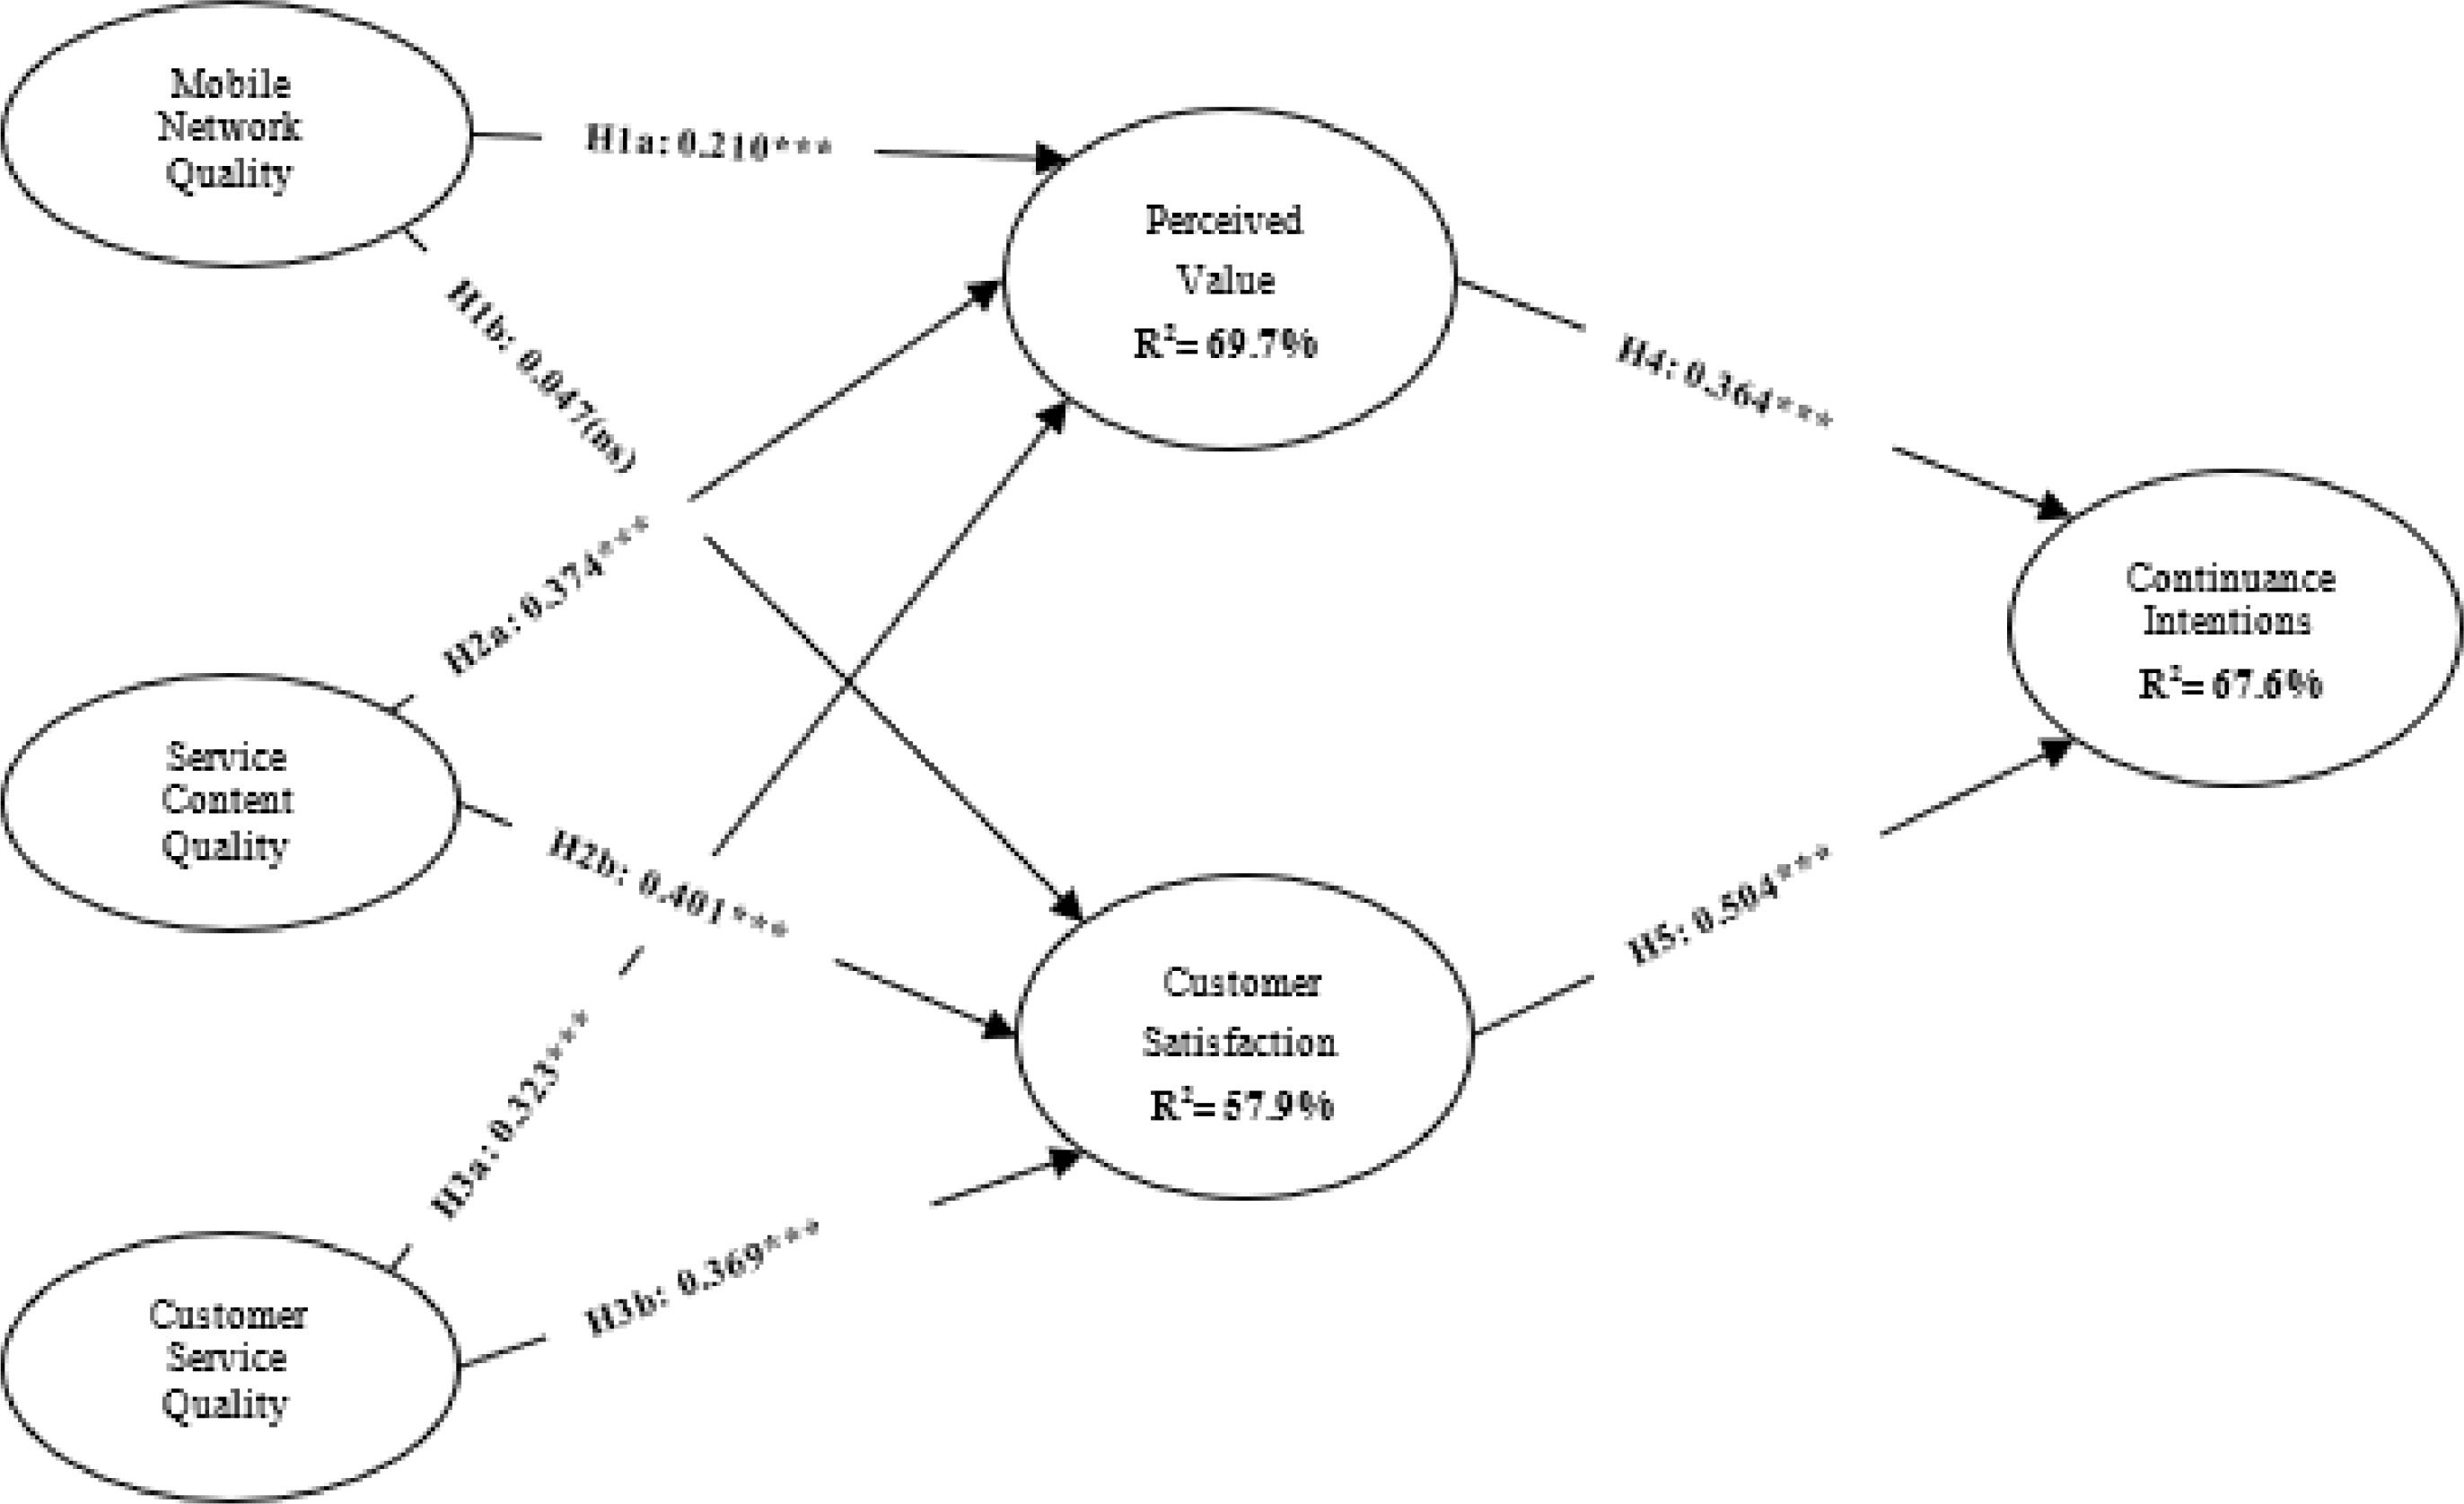
In the structural model, the relationships (i.e., paths) among constructs of the study model are tested. Accordingly, both PLS and bootstrapping procedures (5000 re-samples procedure) are used. As indicated in Table 6 and Fig. 2, the PLS-SEM analysis results demonstrate the structural model's estimation and investigation of the proposed hypotheses. The data generally supports the postulated model correlations, excluding the influence of mobile network quality (MNQ) on customer satisfaction (SAT). The findings show that CSQ (β=0.323, p≤0.001), SCQ (β=0.374, p≤0.001), and MNO (β=0.210, p≤0.001) all have a favourable impact on the PV of mobile customers in Jordan. Only CSQ (β=0.369, p≤0.001) and SCQ (β=0.401, p≤0.001), on the other side, were proven to exert a substantial direct influence on SAT. The findings also show that MVAS's continuance usage intention (CUI) is a direct function of SAT (β=0.504, p≤0.001) and PV (β=0.364, p≤0.001).
Summary of hypotheses testing.
Note: We used a bootstrapping routine using SmartPLS 3 with the no sign change option to determine the significance of the path coefficients. * Significant at p ≤ 0.001; (ns): not significant.

We also present findings for effect size (f2), explanatory power (adjusted R2), predictive relevance (Q2), model out-of-sample predictive power (Q2_predict), including model fit Standardized Root Mean Square Residual (SRMR) and Normed Fit Index (NFI) to verify the model's robustness, in complement to the outcomes of the fundamental structural model (Schirmer et al., 2018).
The findings of f2 follow a pattern comparable to path modelling. According to Cohen (1988), f2 ≥ 0.02 indicates a small effect size, f2 ≥ 0.15 represents a medium effect size, and f2 ≥ 0.35 denotes a large effect size. MNQ has a minor effect size on PV (f2=0.049) but no influence on SAT, according to the findings. SCQ has a medium impact size on PV (f2=0.154) and a small to medium effect size on SAT (f2=0.128). CSQ exhibits small to medium effects on SAT (f2=0.113) and PV (f2=0.121), as well. Lastly, the findings suggest that, although PV has a moderate effect size on CUI (f2=0.156), SAT has a moderate to large effect size on CUI (f2=0.300).
In empirical studies, the R2 values, or "coefficients of determination," for each endogenous latent construct in the study model indicated an adequate prediction level (Refer to Table 7). Rigdon (2012) defines R2 as in-sample predictive power, with larger values indicating more explanatory power (Hair et al., 2019). R2 values of 0.75, 0.50, and 0.25 are considered substantial, moderate, and weak, respectively (Hair et al., 2019; Henseler et al., 2009). The study's primary construct (i.e., continuance usage intention) has a moderate to high R2 value of 0.676. This means that the study constructs all together explain 67.6% of continuance usage intention. Likewise, perceived value and customer satisfaction, as other endogenous latent constructs in this study, both have moderate to high R2 values, as shown in Table 7. To support the previous findings, the measure of predictive relevancy Q2 is assessed (Stone, 1974). The blindfolding procedure is employed to acquire Q2 values, with an omission distance of 9 (D =9). The Q2 values for the research constructs are all considerably above zero, as shown in Table 7, demonstrating that the structural model is not only sufficient but also highly predictive. Q2 values larger than 0, 0.25, and 0.50, as stated by Hair et al. (2019), indicate small, medium, and significant predictive relevance of the path model in PLS-SEM.
The study also employs the PLS Predict in SmartPLS software using ten folds and ten repetitions. The PLS Predict procedure is utilized to estimate the study model's out-of-sample predictive power (Shmueli et al., 2019), which is particularly essential when an investigation derives findings and consequences that influence business and management practices (Hair et al., 2019) as is the case in this investigation. The estimates exceed the most naïve benchmark if the Q2_predict value exceeds zero (Hair et al., 2019). The Q2_predict values for the model's endogenous constructs are significantly above zero, suggesting that the research model has a solid out-of-sample predictive power, as illustrated in Table 7. Following that, we contrasted the root mean squared error (RMSE) with a naïve benchmark (for example, linear regression model (LM)) for all indicators of the endogenous constructs (Shmueli et al., 2019)), as indicated by Hair et al. (2019). Therefore, we observed that just some PLS-SEM indicators yield larger prediction errors than the naïve LM benchmark (See Appendix 2). Based on examining the Q²_predict values for the model's endogenous constructs as well as the prediction statistics of their indicators, it is acknowledged that the study model enjoys a medium to high predictive power. Finally, we investigated the SRMR and NFI values. A good model fit can be established if the SRMR value is lower than 0.08 and the NFI value is higher than 0.90 (Henseler et al., 2016). The SRMR value of our path model is (0.047), and the NFI value is (0.912), indicating that it is an excellent match.
DiscussionThe present study's motivation is to explain why customers of telecoms in Jordan would continue using mobile value-added services such as information, communication, entertainment, and transaction services. We established a model premised on a literature review course of action related to MVAS and mobile service quality in addition to the S-O-R paradigm in which we postulate that customer perceived value and satisfaction constructs as cognitive and affective assessments (O) can significantly predict continuance usage intention of MVAS as a behavioural response (R). Mobile SQ as a multidimensional construct (i.e., mobile network quality, service content quality, and customer support quality) was also proposed as an antecedent (i.e., stimulus (S)) to both customer perceived value and satisfaction constructs. An investigation of this nature is deemed critical because MVAS are currently highly relevant to telecoms to improve their profitability and market shares. Such an analysis is also considered extremely important because the telecommunications industry has undergone significant transformations over the last decade. Telecommunications firms have had to contend with increasingly knowledgeable and demanding clients, intense and unforeseen rivalry, and a slew of disruptive technologies.
Overall, the findings corroborate the created model's validity and efficacy. The only exception is the impact of MNQ on customer satisfaction, which was found not significant. The structural findings reveal that mobile service quality dimensions positively influence perceived value. These findings are aligned with previous research in the field of mobile business (De Leon et al., 2020; He & Li, 2010; Kuo et al., 2009; Shin, 2014; Yang et al., 2021). Although all dimensions of mobile service quality were found significantly influential, their effect sizes on perceived value vary from one to another. It was found that the strongest effect on perceived value is that of service content quality (f2=0.154), followed by the impact of customer service quality (f2=0.121), and finally, the effect of mobile network quality (f2=0.049). It was also found that dimensions of mobile service quality all together explain 69.7% of the variance in perceived value (R2=0.697). Accordingly, and as the notion of perceived value is embedded in the economic theories where the value is a function of the perceived gains minus perceived sacrifices, telecoms need to emphasize increasing the perceived benefits associated with MVAS, reducing the perceived cost, or doing both. Possible strategies that telecoms can pursue to augment the perceived benefits include the utilization of advanced technologies such as artificial intelligence and machine learning to offer personalized location-based services. Telecoms can also employ chatbots based on natural language processing coupled with artificial intelligence as virtual assistants for customer experience touchpoints. Another suggested approach is utilizing visualized tracking systems and mobile payment options for e-commerce transactions. Based on the preceding discussion, we assert that superior mobile service quality can provide a telecom with a competitive advantage and differentiate it from its competitors. We also conclude that the higher the perceived SQ regarding mobile network quality, customer support quality, and service content quality; the greater the perceived value in the MVAS context in Jordan.
Further, the findings indicate that only customer service quality and service content quality influence customer satisfaction, while mobile network quality was insignificant. According to past studies in the mobile business domain, service quality is a crucial predictor of customer satisfaction (Kim et al., 2021; Wang et al., 2019; Zhao et al., 2012; Zhou, 2011). Although customer satisfaction was found to be a direct function of both customer support quality and service content quality, the impact of service content quality on customer satisfaction (f2=0.128) is marginally more significant than the impact of customer support quality on customer satisfaction (f2=0.113). Moreover, it was found that service content quality and customer support quality explain 57.9% of the variance in customer satisfaction (R2=0.579). The lack of a significant association between customer satisfaction and mobile network quality is one of the most intriguing aspects of our analysis. A thorough examination revealed that mobile network quality has the lowest correlation with customer satisfaction. This may explain why it does not affect customer satisfaction. The non-significant influence of mobile network quality (MNQ) on customer satisfaction could also be explained from another perspective as customers nowadays consider having a reliable and stable mobile network that enjoys a good performance as a prerequisite or an obligation and not as a measure of satisfaction. In this digital era, telecoms with trusty mobile networks are considered a necessity rather than a luxury.
Finally, it can be noticed from the preceding findings that service content quality is the most critical feature of mobile SQ in predicting and explaining customers' perceived value and satisfaction levels. As such, telecoms must place adequate attention on the content quality of MVAS in regards to completeness, clearance, timeliness, innovativeness, and aesthetics. The second attribute of mobile service quality in terms of importance is customer service quality. Therefore, we also recommend that the nature, variety, and compatibility of MVAS offered to customers, the flexibility in providing customers with multiple tariff options, and the capability to provide outstanding customer support services are also highly substantial and vital. Although mobile network quality was found to be the least important, we suppose continuous investments in mobile network infrastructure by telecoms are essential. This is critical for telecoms to have the capacity to provide their customers with higher-speed mobile broadband data services and to effectively handle the growing number of connections in addition to the ever-increasing volume of data traffic.
The results also indicate that customers' perceived value (i.e., gains vs. sacrifices) and their degree of satisfaction positively influence continuance usage intention. Both constructs explain 67.6% of the variance in continuance usage intention (R2=0.676) in the current research. This explanatory power is considered relatively high in information systems research. Such a finding signals that the decision of young customers in Jordan relating to the continuance usage of MVAS primarily depends on cognitive and affective assessments. The preceding results are, to a large extent, aligned with the outcomes of prior investigations on the subject and show that perceived value is a strong predictor of continuance usage intention (Chen & Fu, 2018; Chopdar & Balakrishnan, 2020; Karjaluoto et al., 2019; Kuo et al., 2009; Ovčjak et al., 2015). Moreover, the finding regarding the impact of satisfaction on continuance usage intention is coherent with existing literature stating that mobile customer satisfaction positively impacts MVAS post-purchase intention (Kuo et al., 2009; Lu et al., 2008; Wang et al., 2019; Zhou, 2013) and enhances customer loyalty (Deng et al., 2010; Kim et al., 2021). Thus, the authors applauded the growing continuance usage intentions of mobile value-added services in Jordan due to greater customer satisfaction and increased perceived value.
Customer satisfaction was shown to have approximately double the effect of perceived value (f2=0.300 vs. f2=0.156), even though both customer satisfaction and perceived value strongly influence continuance usage intention. This implies that the emotions (i.e., affective states) outperform rationality (i.e., cognitive states) when it comes to continuance usage of MVAS by customers in Jordan. A probable reason might be connected to the study's target population; young students aged between 18 and 30. Further, the Arab culture perhaps plays a role here as well. Accordingly, we recommend that future research focus on exploring the differences in relative importance between customer satisfaction and perceived value in exploring and predicting continuance usage intentions of MVAS across different cultures and age groups. It is also worth mentioning that the preceding finding is inconsistent with some social theories, such as rational choice theory, which states that individuals calculate the expected outcomes of available options and choose the one that will provide them with the most significant benefits. Yet and unsurprisingly, the rational choice theory has received some criticisms that focus on the lack of realism. Indeed, many social studies have empirically established that individuals often act emotionally, impulsively, or simply by force of habit and stereotyped behaviour. Our findings support such criticisms and confirm that behavioural decisions of individuals are often based on their cognitive evaluations, affective judgments, or both.
Implications and future research directionsImplications for theory and researchThis research makes several contributions. Firstly, the study adds to the topic of the mobile business, which is underrepresented in the information systems field. In information systems journals, there is little research on this topic despite the importance and significance of this domain, especially in this era. In the mobile business domain, the present study's contributions are in the area of MVAS. This is believed to be significant as such services are considered strategic from the perspective of telecoms due to their high potential to generate substantial revenues in the highly competitive telecommunications market.
Second, the present study contributes to the domain of post-adoption of MVAS. In the associated literature, just a few studies emphasize the MVAS post-adoption phenomenon; thus, our understanding of this context remains incomplete. This study comprehends that the decision to continue using MVAS is primarily a function of different factors than those influencing pre-adoption decisions. Therefore, relying on a comprehensive literature review course of action related to MVAS and mobile service quality and drawing on the S-O-R paradigm, we have developed a conceptual model that we argue is appropriate to investigate the post-adoption phenomenon in the MVAS context. In the established model, the authors hypothesize that mobile service quality (S) positively impacts customers' perceived value and satisfaction levels as organisms (O).
Further, the authors also postulate that both customer satisfaction and perceived value have direct positive influences on continuance usage intention as a behavioural response (R). As for mobile SQ, this study includes mobile network quality, service content quality, and customer support quality as the three main dimensions of the construct. The authors argue that the developed model premised on the S-O-R paradigm and other relevant literature related to MVAS and service quality in the mobile telecommunications sector adds to the body of knowledge and broadens our understanding concerning customers’ post-adoptive intentions towards the usage of MVAS.
The addition of the perceived value construct, as well as the investigation of its implications on MVAS continuance usage intention, is the study's third contribution. Likewise, the impact of perceived value in justifying consumers' intentions to remain using MVAS is largely unknown, especially in developing countries. The incorporation of the perceived value construct in this investigation is predicated on the cost-benefit paradigm, which contends that people's choice is determined by a trade-off between cumulative sacrifices and benefits. The relevance of perceived value in justifying information technology adoption and post-adoption phenomena has recently been highlighted in the information systems field. Despite its perceived importance, there is a scarcity of investigation in the information systems field that employs the perceived value construct to explore and predict the IS/IT post-adoption phenomenon. Therefore, this study helps fulfil this significant gap as it provides additional evidence on the crucial function of perceived value in predicting continuance usage intention in the mobile business context. Consequently, the authors encourage other researchers to investigate the role of perceived value in understanding post-adoption events in the information systems field and technology management from a unidimensional and/or multidimensional perspectives.
Fourthly, the existing investigation has contributed to the body of knowledge about developing countries within the information systems domain and the exact field of mobile business. Empirical studies in this context focusing on emerging nations in essence and Jordan mainly remain scant. Lastly, the existing research contributes to behavioural decision-making theories. Unlike rational choice theory, which is rooted in behavioural economics and specifies that individuals opt for alternatives with the highest overall utility and thus demonstrate rational decision making, this study asserts that an individual's decision is jointly based on cognitive and affective states with the different relative importance of each. The relative importance of affective and cognitive states may differ across different cultures, age groups, and personalities.
Implications for decision-makersThe conclusions of this research are critical for MVAS decision-makers. It assists telecoms in emphasizing the primary aspects influencing customers' decisions on whether or not to continue using MVAS and the relative importance of these factors. As a result, telecoms would be better able to identify which aspects of MVAS to rectify, balance, strengthen, and preserve for future improvement. Furthermore, given Jordan's rapid growth in the mobile telecommunications sector, the research outcomes would be immensely useful in guiding telecoms in developing adequate business models and impressive advancement strategies. In turn, this would result in a win-win scenario in which both customers and telecoms are contented.
According to the findings of this research, customer satisfaction contributes to the continuance usage intention of MVAS. This signifies that telecom needs to continually identify and then effectively satisfy the needs and desires of customers. Telecoms should guarantee that their services consistently meet the requirements of their customers and also need to ensure that service quality is consistently improved. This, in turn, would help increase customer satisfaction levels and consequently lead to the continuance of usage of MVAS. When customers of a particular telecom are satisfied, they would have a good deal of confidence in the ability of the telecom to deliver the desired services consistently and meet their continuously changing needs and expectations.
In addition to customer satisfaction, it is clear that customers also rely on their perceptions of value in deciding whether or not to continue using MVAS, albeit to a lesser extent than customer satisfaction. Therefore, when formulating their MVAS offers, telecoms should consider the value elements and benefits that customers can obtain by utilizing MVAS, primarily through their advertising and marketing campaigns. Indeed, the greater the ability of any telecom to create and promote desirable value elements, the greater the willingness of customers to continue using MVAS.
In an effort to expand customer perceived value, this research highlights the relevance of service content quality, customer support quality, and ultimately mobile network quality. As per the findings of this investigation, the quality of the service content has the most significant impact on perceived value, accompanied by the quality of the mobile network and the quality of customer support. As a result, the greater the perceived value, the better the service quality concerning the mobile network, customer support, and service content. Nonetheless, the outcomes of this investigation demonstrates that only customer support quality and service content quality positively influence customer satisfaction and that service content quality has the strongest effect. Hence, higher SQ in terms of service content quality and customer support quality would lead to higher customer satisfaction and, consequently, higher levels of continuance adoption intention. Therefore, telecoms need to seriously focus on the quality of their services through a comprehensive quality management system that should incorporate appropriate quality assurance and quality control procedures. Provided that such a quality management system is not in place, we believe that telecoms would face challenging results due to vast amounts of internal and external failure costs such as process failure cost, process downtime cost, customer complaints cost, and lost sales cost. Thus, a total commitment to service quality is required throughout the telecom organization.
We believe that for improving content quality, telecoms need to focus on aspects related to relevancy, conformance, extra features, aesthetics, accuracy, completeness, innovativeness, timeliness, and accuracy of the content. When these aspects are managed carefully and deliberately, the service content quality will be augmented. As for customer support quality, telecoms need to focus on aspects related to empathy, courtesy, and competence of customer service employees. Telecoms also need to ensure that support services are always available and provided promptly. Further, it is also significant in this context to ensure that customers get complete and adequate support for everything they ask for. Finally, as for mobile network quality, telecoms need to focus on continually improving their mobile networks and infrastructure. Quality of Service (QoS) issues related to performance (e.g., connection speed, download speed, and upload speed), reliability, responsiveness (e.g., response time and latency), accessibility, and convenience are highly significant in this context and need to be successfully managed to improve mobile network quality. The fact that mobile network quality has the least effect on perceived value and no effect at all on customer satisfaction is quite intriguing. The drivers of competitive advantage have shifted toward service diversification, service innovativeness, and personalization. Less emphasis has been devoted to the mobile network, which deals primarily with the infrastructure aspects of the MVAS. This is true because customers do not have control over the infrastructure, and MVAS operators have the minimum level of interaction with customers in that regard.
Limitations and future research directionsNotwithstanding the study's significant contributions (addressed in the previous section), particularly the investigation of perceived value effects and customer satisfaction on continued usage intentions of the rapidly growing phenomenon of MVAS, it has several constraints that may restrict the generalizability of its results, which could be discussed in a subsequent investigation. To start, the participants in this research were all students aged between 18 to 30 years. Although these subjects account for the majority of MVAS adopters, their judgments of value and quality and their relevance to satisfaction and post-adoption decisions may vary dramatically from those of professionals and the elderly. These populations, which were not involved in the present investigation, should be the focus of subsequent research. It is also worth looking at the disparities in results across these groups, as well as the causes for them.
Second, in order to keep the model as simple as possible, the construct of perceived value was used as a single construct in the current study. As a result, future research should investigate the function of perceived value from a multidimensional viewpoint. For instance, Kim & Han (2011) classified the perceived value of mobile services as utilitarian, hedonic, and social; whereas Al-Debei & Al-Lozi (2014) suggested utilitarian, hedonic, uniqueness, epistemic, as well as economical as “value components” in the MVAS context. Comparable or enhanced categorizations of value can be utilized in upcoming investigations to analyse the results of perceived value in various behavioural responses and actions.
Third, while continued usage of MVAS is a global phenomenon, this work only focuses on the Jordanian context. Other researchers are encouraged to replicate this investigation in various nations and analyse the findings. From our perspective, cross-cultural comparisons would be highly beneficial. Fourth, due to limited resources, we cannot manage to execute a longitudinal study. However, because the post-adoption phenomenon of MVAS is quite dynamic, a longitudinal study in the future could yield interesting results by demonstrating the differences and variances in such a phenomenon over time.
ConclusionsThis study examined the continuance usage intention of mobile value-added services. A study model was constructed depending on the S-O-R paradigm as well as an extensive review of literature related to MVAS and mobile service quality. As per the established model, continuance usage intention as a behavioural response (R) is a direct function of two primary organisms; customer satisfaction and perceived value (O). The created model also suggests that three primary aspects of mobile service quality (customer support quality, service content quality, and mobile network quality) operate as stimuli (S) that impact customer satisfaction and perceived value positively and directly. Generally, the findings corroborate the developed model's efficacy and validity. Continuance usage intentions of MVAS customers can be confidently anticipated by customer satisfaction and perceived value, according to the findings.
On the other hand, customer satisfaction was revealed to have a more substantial influence on continuance usage intentions than perceived value. Perceived value and customer satisfaction can account for 67.6% of the variation in continuance usage intention. Besides that, it was also proven that service content quality and customer support quality significantly affect customer satisfaction, whereas mobile network quality has no significant effect. The most considerable influence on customer satisfaction was service content quality, which explains 57.9% of the variance in customer satisfaction when combined with customer support quality. Further, service content quality, customer support quality, and mobile network quality were all exhibited to possess a significant direct effect on perceived value. They collectively address 69.7% of the variance in perceived value. Similar to the impact on customer satisfaction, service content quality was revealed to have the strongest effect on perceived value, accompanied by customer support quality and mobile network quality.
The study was supported by a UPAR grant from the United Arab Emirates University (UAEU), Fund number: 12B024.
Note: Subsamples: 5000; do parallel processing: checked (ticked); test type: two tailed; significance level: p ≤ 0.1.