


Using general systems theory, we present a series of simulations that shed light on the viability of business strategies in stable and turbulent business environments. Special attention is given to the impact of efficiency versus flexibility on firm performance, and on what the simulations reveal concerning successful strategies in each environment and firm type.
Design/methodology/approachLarge-scale Monte Carlo simulations based on Ashby's Requisite Variety principle.
FindingsEfficiency and flexibility do not, in general, determine performance. However, certain strategies appear to be superior, and in turbulent business environments, efficiency and flexibility appear well correlated with firm performance.
Research limitations/implicationsImplications and limitations of the Law of Requisite Variety for strategic analysis are set forth. Limitations stem from the simplifications needed for quantitative analysis, and lack of explicit consideration of competitors’ actions.
Practical implicationsThe simulations’ realism offers insights to strategists regarding the roles of efficiency and flexibility in firm performance. The quantitative approach provides unambiguous definitions for some terms used in strategy, sharpening concepts put forth by Ashby and by Ansoff.
Originality/valueA back-to-basics, systems approach to the simulations, using the venerable and general requisite variety principle as its basis, ensures sound analysis and appeal to readers who may come to it from diverse traditions of strategy theory. The quantitative simulation tool is made available for other researchers to test and extend.
“Somewhere along the line, strategy hijacked itself to become little more than a box-ticking exercise, failing to take almost any organisation forward.”
“It's good – we do not have to go to the bank.”
“Strategy is stuck,” says McGrath (2013). See Denning (2012, 2014) and Sull, Homkes, and Sull (2015) for more evidence of strategy theory's current troubles. In this paper, we return to basics in search of a firm, minimal basis for new theorizing. Using general systems theory, we present a series of validated simulations that shed light on the viability of business strategies in stable and turbulent business environments. Special attention is given to the question of efficiency (exploitation, core competence) versus flexibility (nimbleness, exploration, agility, slack) in strategy. We find evidence that efficiency and flexibility jointly drive firm performance in turbulent business environments. This apparent correlation does not hold true in stable business environments, but certain strategies do appear to be superior to others in certain business environments. The simulations serve to sharpen concepts and definitions, including “strategy” and “flexibility.” The simulation code is made available to other researchers for further testing of sensitivity to costs and assumptions.
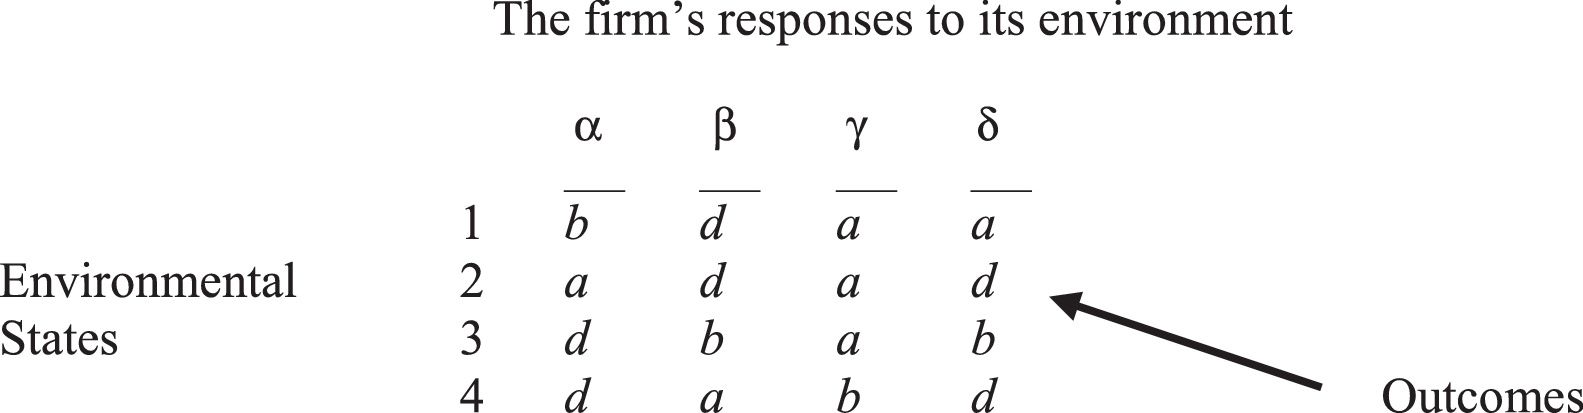
One of the most enduring principles in systems theory is the Law of Requisite Variety (Ashby, 1956). This Law holds that an organism or organization facing a variety of environmental conditions (“stimuli”) must generate at least a certain variety of responses to these stimuli, if it is to maintain viability or homeostasis. This variety of responses “drives down the variety of outcomes.”1 This means that as different pairings of stimuli and response result in different outcomes, the organization wishes, in response to each stimulus, to choose a response such that the resulting outcome is conducive to the organization's viability.
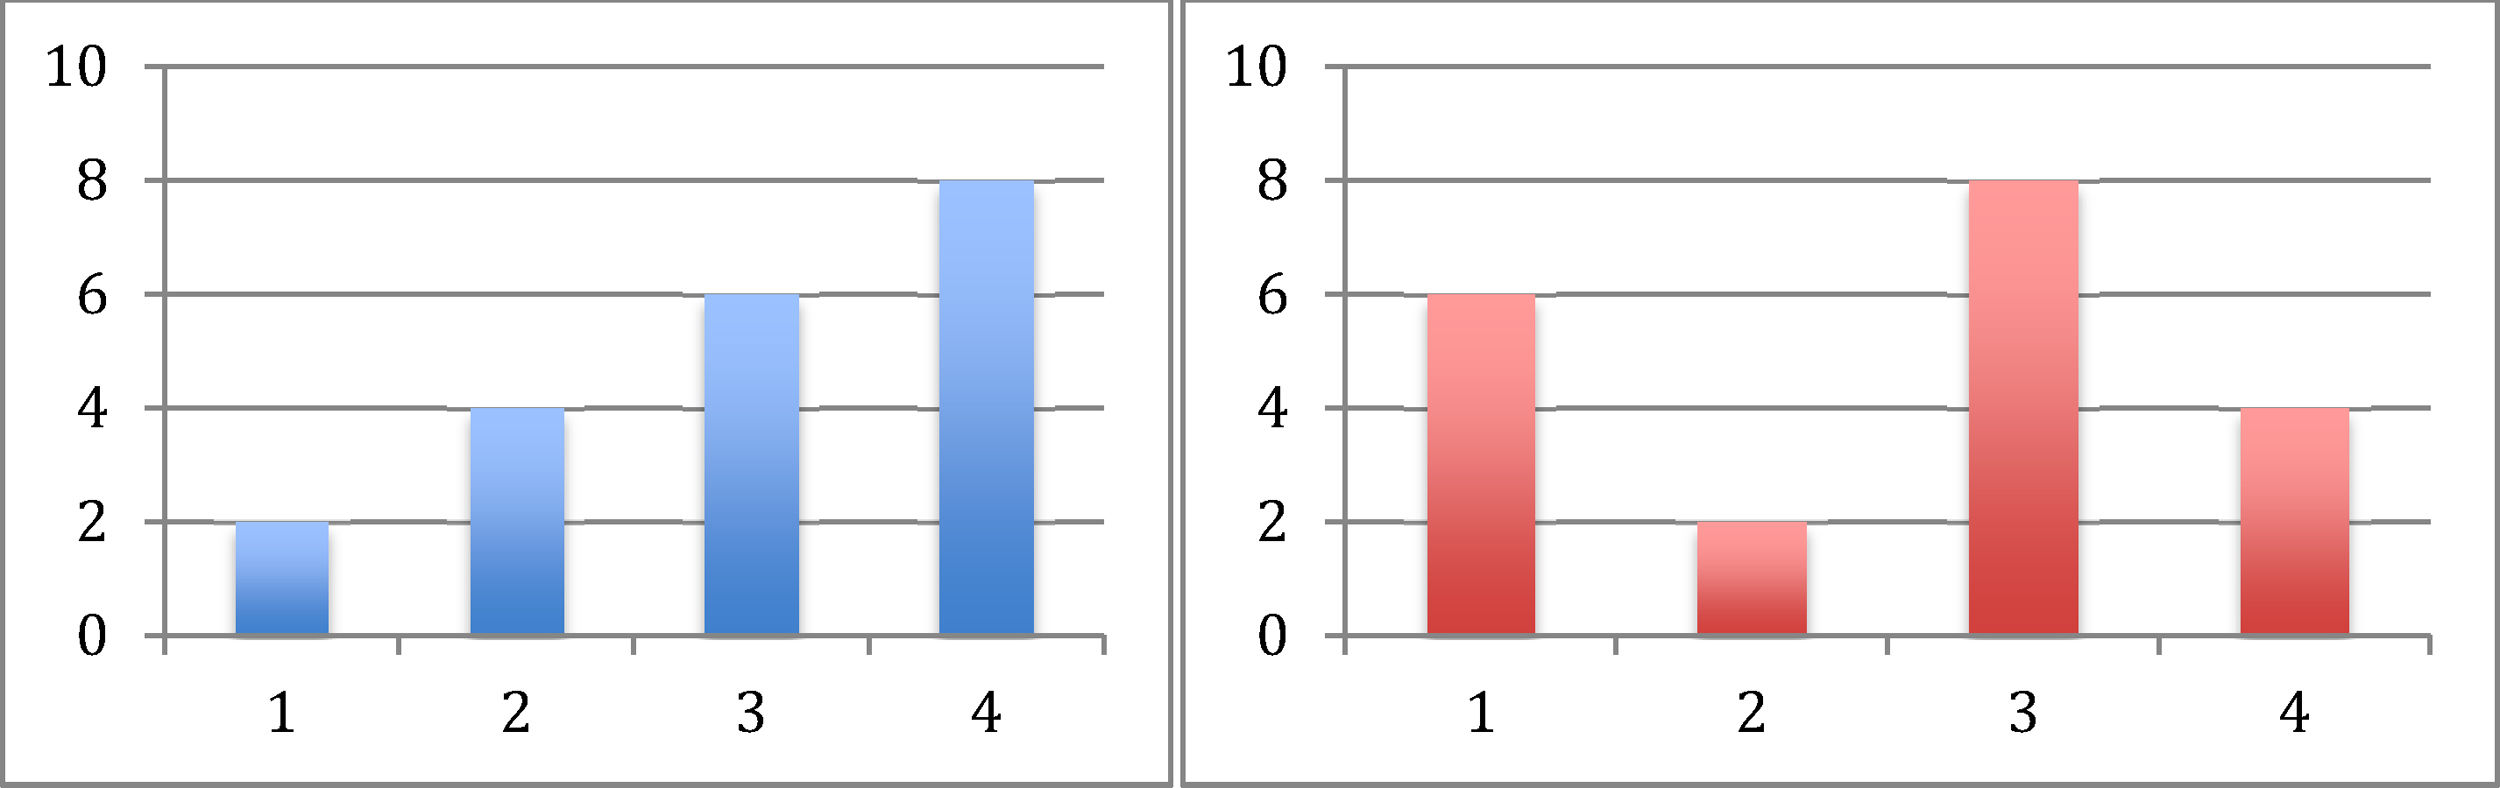
Entropy is often used as a measure of variety in connection with the Law. However, when stimuli and responses are represented by discrete and distinct categories, variety is equivalent to the number of distinct stimuli and the number of distinct responses. This is suggested in Table 1. In Table 1, only some of the outcomes a, b, c, and d may be “survivable” outcomes, and some of those might be more salutary than others.

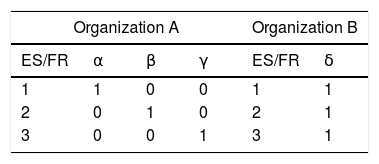
According to systems theory, maintaining a varied internal inventory of responses entails a metabolic cost for the organism or organization. As the number of distinct responses in inventory grows, the cost of managing them grows supralinearly (Linstone & Phillips, 2013), ultimately becoming a “complexity cost” for the enterprise. Of the two organizations depicted in Table 2, Organization A is less efficient, having to maintain three responses in order to deal with an environment providing three alternative stimuli. Organization B is more efficient and “lean” (maintaining only a single, robust response), but possibly more vulnerable in that it has not demonstrated the ability to evince more than one response to its environment. In the tables below, the variety of outcomes is reduced to two: Survival (“1”) or bankruptcy (“0”).
In Tables 1 and 2, symbols are as follows:
ES=environmental state or business condition (stimulus) in a particular period
FR=firm's response in that period
1=outcome: organization survives
0=outcome: organization fails
Are the two organizations equally flexible? We don’t know. Organization 2 might have some latent ability to change responses. In any case, from the organization's perspective the point is survival, not efficiency or flexibility per se. Efficiency and flexibility are only enablers of survival and success, but we focus on them here because they are the controllable causes of enterprise performance. (We will later introduce a performance measure based on volatility-adjusted profit streams.)
The tables show the firms in matrix form, and matrices may have structure, that is, patterns in the number and arrangement of matrix elements. This suggests that the requisite variety construction of strategy may involve archetypal strategies corresponding to different matrix structures. We are interested in how these observations can be harnessed for supporting organizational strategies and decisions.
In what follows, we strive for the most fundamental concepts of strategy. Therefore we continue with the convention that there are only two possible outcomes. This, and other simplifications to be detailed, eliminates distractions concerning “levels” of firm performance. It also allows us to better interpret results, and leaves scope for later elaborations.
Earlier workFollowing Ansoff (1979; see also Ansoff & Sullivan, 1993; Martinet, 2010), the present work aims to bring together thinking from business strategy and from system theory to arrive at useful knowledge for real-world organizations. It is well known that Ansoff's strategic success hypothesis was inspired by and is isomorphic to Ashby's Law (Ansoff, 2007; Chawla, Mangaliso, Knipes, & Gauthier, 2012; Moussetis, 2011).
Phillips and Tuladhar (2000), in developing a requisite variety-based method for measuring the flexibility of enterprises, noted that efficiency is a cross-sectional notion – current output divided by current input – and that flexibility is necessarily a longitudinal construct,2 showing the organization's ability to change from one response to another over time. The longitudinal nature of flexible behavior can make it difficult, empirically, to correctly attribute a real firm's long-term survival to flexibility or to “dumb luck.” This suggests our current approach using simulated firms.
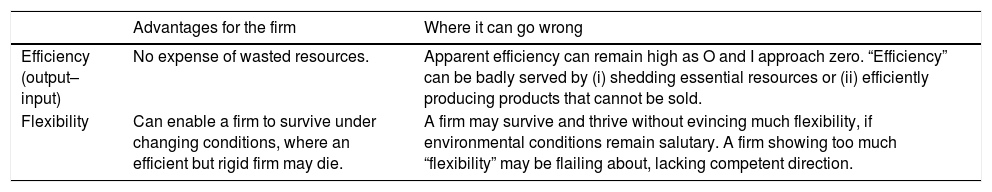
Both efficiency and flexibility have limitations. See Table 3.
Efficiency and flexibility: advantages and risks.
| Advantages for the firm | Where it can go wrong | |
|---|---|---|
| Efficiency (output–input) | No expense of wasted resources. | Apparent efficiency can remain high as O and I approach zero. “Efficiency” can be badly served by (i) shedding essential resources or (ii) efficiently producing products that cannot be sold. |
| Flexibility | Can enable a firm to survive under changing conditions, where an efficient but rigid firm may die. | A firm may survive and thrive without evincing much flexibility, if environmental conditions remain salutary. A firm showing too much “flexibility” may be flailing about, lacking competent direction. |
Strategy scholars have long recognized the strategic duality of organizational plans, distinguishing the (efficient) “exploitation” of current resources from the “exploration” that implies reducing current profits in favor of acquiring access to assets for future use (Lin, McDonough, Yang, & Wang, 2016; March, 1991). Recent literature shows a resurgence (Lecuona & Reitzig, 2014; Vanacker, Cellewaert, & Zahra, 2017) of interest in the concept of slack. More than 60 years ago, Cyert and March (1956, p. 52) introduced the notion of slack as a pool of excess resources that helps firms adjust to unexpected fluctuations. A half dozen years later, slack – defined alternatively as the pool of resources in an organization that is in excess of minimum necessary to sustain routine operations – had become a central concept in the behavioral theory of the firm (Cyert & March, 1963). In this theory, slack should positively affect firm performance as it plays “both a stabilizing and adaptive role” (Cyert & March, 1963).
One view (Nohria & Gulati, 1996) suggests that slack enables organizations to divert attention away from “fire fighting” to focus instead on expansive thinking and risky, innovative ventures with potentially high payoffs. The opposing view (Levinthal & March, 1993) is that high slack leads to risk aversion, which results in low exploration, passively in organizational responses, and increased motivation to capitalize on known competencies through exploitation. Both views, which expand the content of Table 3, are implicitly encompassed by our simulation.
Yet slack is not equivalent to our definition of flexibility. Flexibility implies the actions of seeking new responses (resources) from outside the firm and shedding slack resources that do not appear to be needed in foreseeable future. By assigning costs to switching among current responses and to adopting outside resources, we recognize Singh's (1986) distinction between unabsorbed and absorbed slack. Unabsorbed slack consists of resources that are currently uncommitted and are readily available for redeployment within firms (Bourgeois & Singh, 1983). Absorbed slack consists of those resources that are already tied to current operations, but may be recovered, with more managerial effort and time (Bourgeois & Singh, 1983), or in the simulation, cost.
Charnes, Cooper, and Rhodes (1978) gave us Data Envelopment Analysis, a now widely used mathematical method for measuring organizational efficiency. Phillips and Tuladhar (2000) attempted the same for flexibility, building on Ashby's Law to set forth a flexibility measurement method they named Relative Variety Analysis (RVA). Though RVA proved theoretically sound, its data requirements made it impractical as a management decision tool. Phillips, Summers, and Moon (2002) offered an RVA- and simulation-based approach to the problem, different from the one now presented.
Research objectiveLecuona and Reitzig (2014) asked, (When) does it pay for firms to hold more resources than they actually require to sustain their routine operations (i.e., slack)? There must be, for different strategy types, a desirable level of slack, considering that too little slack creates many organizational problems and too much slack is equally untenable (Bourgeois, 1981; Sharfman, Wolf, Chase, & Tansik, 1988).
This paper presents Monte Carlo simulations to test the efficacy of organizational strategies that balance efficiency and flexibility in different proportions. It overcomes the unrealistic data requirements of RVA, avoiding the need for long-baseline empirical datasets on particular companies, instead using simulated but roughly realistic data. The present approach uses a large number of simulated situations. It thus overcomes the small-sample bias that RVA is prone to, and should yield more realistic results.
The present study gives quantitative extension to Ansoff's formulation. It is not, however, a work of Ansoffian strategy per se. Rather, it is a back-to-basics approach to strategy simulation that yields insights in its present form and is flexible and extensible for the purposes of future researchers.3 It is motivated in part by the Stigter–Cooper quotation above (Cooper is Distinguished Professor of Organizational Psychology at Lancaster University) and McGrath's (2013) remark in Harvard Business Review that “Strategy is stuck.” (See also Denning's (2012) remarks in Forbes, critiquing current strategy scholarship.) Because Ashby's Law is so fundamental to all systems, we hope that the results will be particularly useful for strategists.
Every culture has a flexibility fable. Often it involves a willow tree that stands tall in normal weather but flexes in extreme winds, surviving while its neighbor oak tree has only the “stand tall” response and thus falls and dies in a high wind. The willow tree, though, does not decide to bend. We develop implications of Ashby's Law for human enterprises that evince intention, i.e., that make deliberate decisions about which of an alternative set of responses will be applied in a given situation, and about when to search outside the firm in order to find and adopt new responses.
In particular, we equate a response (α, β, γ, etc.) to a tactic, and call a general rule for acquiring, maintaining, and discarding responses a strategy.4 We recognize too that human organizations intentionally seek and acquire new responses when needed. This activity falls under the headings of innovation, R&D, learning, and M&A. We make these implications sufficiently precise to support a Monte Carlo simulation, and we find the results are meaningful for management and for theory.
Research questionsOur research questions are:
- 1.
Is any strategy superior in the ‘normal’ environment? In the ‘turbulent’ environment?
- 2.
In what range of parameters (industry conditions, costs, and characteristics) does a particular strategy shine?
- 3.
What are the roles of efficiency and flexibility in strategic performance? Do they jointly explain the firm's performance?
The third question is motivated by Kozmetsky, Thore, and Phillips’ (1994) DEA study of a computer company that remained efficient through the 1980s by reducing its expenditures each time its revenue declined. The company was highly efficient, on an output–input basis, until the day it went out of business. Clearly, efficiency is not sufficient for a firm to thrive in new business conditions. As flexibility is touted as the key survival trait of companies in changing times, we conjectured that efficiency and flexibility, together, determine corporate performance.
MethodologyWe start Monte Carlo simulations with:
- •
A set of environmental conditions, any one of which may apply at a given iteration of the simulation.
- •
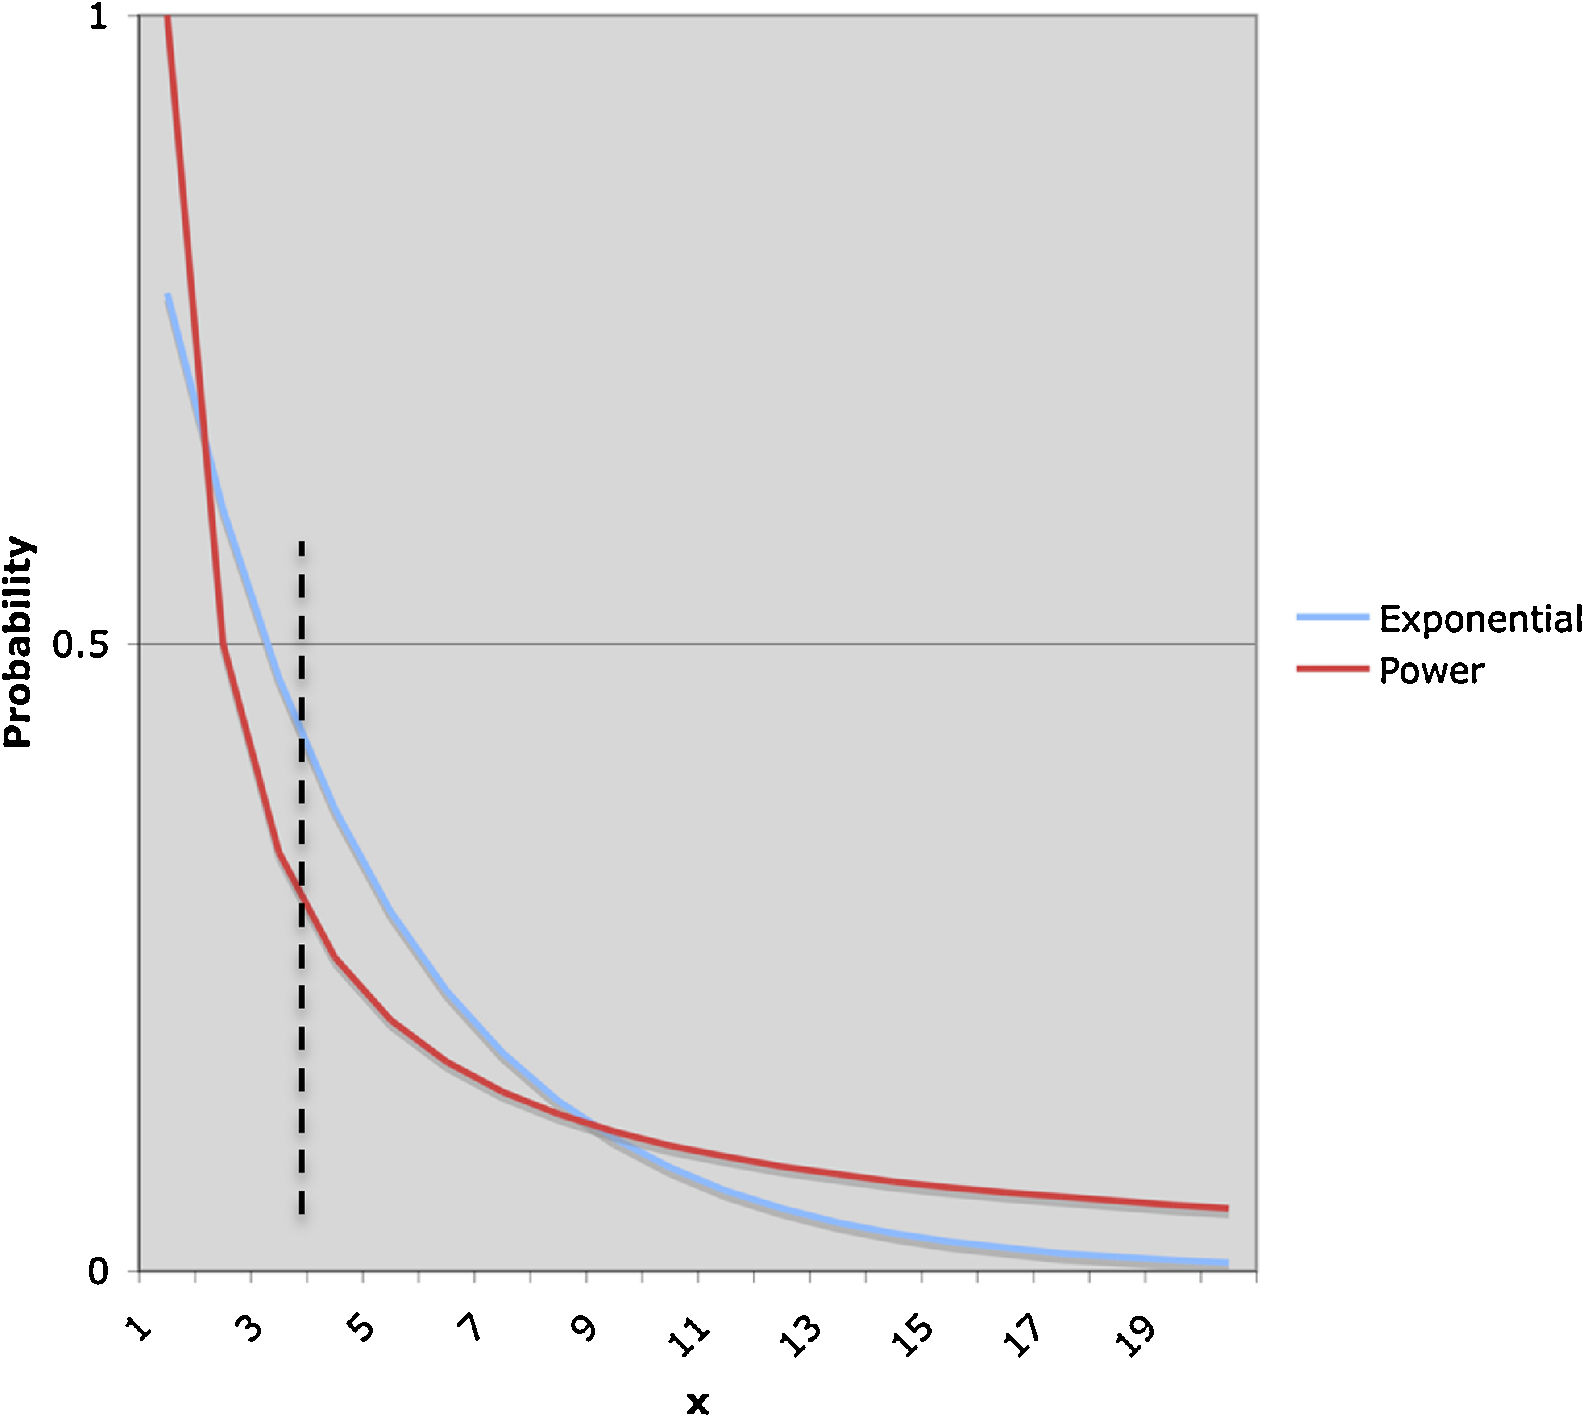
A probability distribution representing the frequency of environmental conditions. An exponential-family distribution represents “normal” business environments, and a longer-tailed power law distribution represents “turbulent” environments. See Fig. 1.
 is much greater under the exponential law. Hence this probability function represents the stable business environment. Under the power law, the probability of a most-probable state is less than under the exponential, and that of a high-numbered “outlier” state is higher. For this reason, the power law describes a turbulent environment. Though the simulation uses discrete probability functions, the point about stability and turbulence is made more clearly with the continuous lines shown in the figure, and no generality is lost.") Fig. 1.
Fig. 1.In this comparative probability chart, the occurrence probability of any of the most probable environmental states 1–4 (area under the curve to the left of the vertical dotted line) is much greater under the exponential law. Hence this probability function represents the stable business environment. Under the power law, the probability of a most-probable state is less than under the exponential, and that of a high-numbered “outlier” state is higher. For this reason, the power law describes a turbulent environment. Though the simulation uses discrete probability functions, the point about stability and turbulence is made more clearly with the continuous lines shown in the figure, and no generality is lost.
(0.08MB). - •
A population of firms. Each firm has a financial balance and a strategy.
- •
Each firm begins with a set of responses in inventory, with the survivability of each response against each environmental condition (the “outcomes”) shown as matrix entries. There is a certain density of “1” (i.e., “survive”) outcomes in the matrix.
- •
An additional bank of matrix columns, considered to be external to the firm. These are responses the firm may choose to acquire, or that it has discarded from its inventory.
- •
Specified costs for maintaining responses,5 for discarding responses from inventory, for adopting responses from the bank, and for switching among inventory responses. Also there is a profit or reward for surviving the iteration. These costs and rewards are debited/credited to the firm's account. Their magnitudes are chosen to approximate the exploration and exploitation costs of companies in the computer and software industries, as inferred from public financial statements. However, as financial statements are not structured in exactly the manner needed for the present model, we do not claim extreme accuracy for these approximations.
 is much greater under the exponential law. Hence this probability function represents the stable business environment. Under the power law, the probability of a most-probable state is less than under the exponential, and that of a high-numbered “outlier” state is higher. For this reason, the power law describes a turbulent environment. Though the simulation uses discrete probability functions, the point about stability and turbulence is made more clearly with the continuous lines shown in the figure, and no generality is lost.")
As the simulations proceed,
- •
A response in the firm's inventory may become “active” when it allows a survivable outcome relative to the current period's environmental condition. It is possible that more than one response leads to survivable outcome, but only one of these will become active in any iteration. (An iteration, or trial, can be seen as a certain time period.)
- •
When no response in the internal inventory leads to firm survival, the firm may expend exploration costs in order to search for a survivable response in the external response bank. Depending on the firm's strategy, it may conduct an “expedient search” for a response that enables survival in the current iteration, or (at greater cost) a “robust search” for a response that has a higher density of 1's in its column. Robust responses allow survival in the current iteration and also a higher chance of usefulness under future, alternative environmental conditions.
- •
The firm may fail, either by reaching a non-positive financial balance or by failing to find a survivable response in any iteration. The failed firm is allowed to continue to “play” – iterations may proceed – but the failed firm does not earn its profit for the iteration in question. The simulation tracks the incidence of failures.
Each simulated firm adopts one of the following four strategies:
- •
Lean.6 Discards all responses that have gone unused for the last three trials. May conduct expedient searches at the bank. Lean thinking aims to take waste out of existing processes (Womack & Jones, 2003). The concept of lean thinking has diffused widely during the past 25 years, and is now applied in manufacturing and services as diverse as chemicals production, hospital management, and supermarket retailing. It originally emerged from assembly plants in a car industry which highlighted significant differences between the best and the average plants along a range of dimensions, including productivity, quality, and time. The source of these significant advantages of lean solution revealed that the major differences lay not in higher level of capital investment or more modern equipment, but in the ways in which production was organized and managed (Womack & Jones, 2005).
- •
Exploiter. Rarely discards a response. Specifically, the Exploiter discards one response every ten trials, but this is never a response from its original, starting inventory. May conduct expedient searches at the bank. An exploiter's search behavior is essentially incremental, doing better what it already does, using adaptive learning. An exploiter uses and develops things already known (March, 1991), but in the process creates a high degree of path dependency. This means firms’ accumulated exploitation experience reinforces established routines within domains. The primary structure of the firm is established for the basic tasks of exploitation, such as purchasing, producing, selling, and distribution.
- •
Opportunistic Explorer: Seeks cheapest survivable (against latest stimulus) response from inventory. The Opportunistic Explorer keeps a record of its last ten trials, keeping the responses that were used more than five times in the ten trials. If none applies, the OE goes to the bank for expedient search. The explorer's search behavior is radical, doing differently, showing generative learning. The explorer makes long jumps that enable a firm to adopt new attributes and attain new knowledge outside its domain (March, 1991). Exploratory activities, such as new product development, typically require interacting with different people within a different type of collaborative relationship.
- •
Innovator. Seeks robust responses, i.e., with a “1” in the needed row but also in other rows. Only Innovators may use robust search. Innovation is the specific tool of entrepreneurs, the means by which they exploit change as an opportunity for a different business or service. It is a discipline capable of being learned and capable of being practiced (Drucker, 1985). Companies achieve competitive advantage through acts of innovation. They approach innovation in its broadest sense, including both new technologies and new ways of doing things (Porter, 1990).
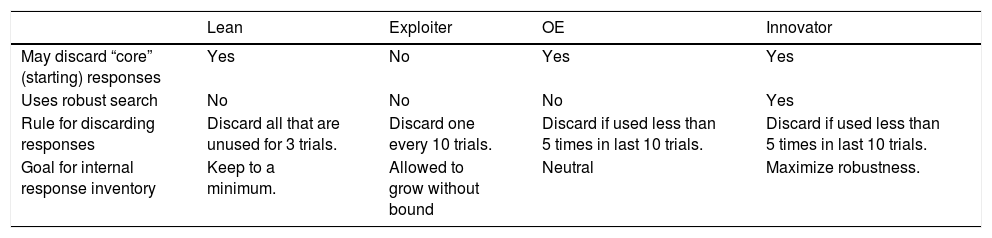
Table 4 clarifies the definitions of the tested strategies.
Summary of characteristics of four strategies simulated.
| Lean | Exploiter | OE | Innovator | |
|---|---|---|---|---|
| May discard “core” (starting) responses | Yes | No | Yes | Yes |
| Uses robust search | No | No | No | Yes |
| Rule for discarding responses | Discard all that are unused for 3 trials. | Discard one every 10 trials. | Discard if used less than 5 times in last 10 trials. | Discard if used less than 5 times in last 10 trials. |
| Goal for internal response inventory | Keep to a minimum. | Allowed to grow without bound | Neutral | Maximize robustness. |
The simulation consists of a large number of iterations or trials. At each iteration, the environmental condition is allowed to change. Each iteration's environmental condition is drawn (in a first set of trials) from a discretized exponential distribution, allowing mostly selection from low-numbered stimuli, but the occasional outlier (high-numbered stimulus). A second set of trials, intended to portray a more turbulent business environment, uses stimuli drawn from a flatter (higher-entropy) probability distribution, namely, a discretized power law.
Each iteration assesses costs against the firm's budget, and rewards survival. Maintaining an inventory of responses is costly for the simulated firm (we have conservatively set this cost proportional to the square of the number of responses), as the firm needs to catalog and manage its resources and options.
A firm can therefore choose to discard a response that has lain unused for a while. There is a cost to this as well, corresponding to costs of layoffs, pension payouts, and equipment disposal.
If a new environmental condition causes the firm to switch from one in-stock response to another, a cost is assessed. This cost is constant, regardless of the nature of the responses before and after the switch. It can represent the costs of re-assigning, re-training, and laying off employees.
If the environmental condition changes and the firm has no ready survivable response to the new stimulus, the firm may “go to the bank” in search of a new response. We assess a search cost for this visit to the bank. The firm may accept any new response that has a “1” in the required row. We call this an expedient search. Alternatively, firms using the Innovator strategy may (at a higher cost) conduct a robust search, seeking a response that has multiple “1” entries that fill other gaps in the firm's own response matrix as well as the current gap. (The bank is not depleted when a firm takes a new response from it.) These costs of exploration represent costs of R&D, alliance formation, and technology licensing.
The simulation rewards each firm that survives an iteration by augmenting its dollar balance by a certain amount. This amount represents “ordinary profit.”
Thus, our simulation parameters are:
n=number of possible environmental conditions
M=cost of maintaining response inventory (variety)∼(number of responses)2
S1=cost of searching for a new, expedient response
S2=cost of searching for a new, robust response
W=cost of switching from one existing (in stock) response to another in-stock response
D=cost of discarding an in-stock response
F=the number of simulated firms
I=the number of iterations
d=the frequency with which non-lean firms discard unused responses
R=the reward for surviving an iteration
DA=density of 1's in a Type A firm's inventory matrix. It is set equal to the density of the expedient bank matrix in which Type A firms may search for new responses.
DB=density of 1's in a Type B firm's inventory matrix. It is set equal to the density of the expedient bank matrix in which Type B firms may search for new responses.
DR=density of 1's in the robust bank matrix
J=number of responses in the firm's repertoire (original inventory plus responses acquired from the bank and retained) at the present iteration
B=balance in the firm's financial account
f=the number of trials (out of 10 trials) during which Explorer and Innovator firms retain a response for future use.
Other parameters include those specifying the probability distribution from which environmental conditions are drawn. Not all these symbols occur in this paper, though the quantities they represent are used in the Excel simulation.
In the context of simulation (Spall, 2004; see also Law, 2009), verification has to do with whether software correctly implements a specified model. Validation is a matter of whether the verified model is a useful representation of the situation under study. The authors coded and exhaustively tested the simulations, implementing it on Excel™. We view Excel, with its long history and wide user base, to be well verified. Therefore the simulations presented here are verified. We have taken the initial steps toward validation, and offer the code to other researchers for further validation.
Simulation detailsWe simulated two types of firms – diversified and focused – with a firm of each type adopting one of the four strategies Lean, Exploiter, Opportunistic Explorer, or Innovator. Each of these eight categories was simulated twice, once under “normal” business conditions, and once in a turbulent environment. Each of the sixteen simulations was then validated by re-running it with 25 different initial conditions. In sum, 2×4×2×25=400 simulations were run, each with two thousand iterations, for a total of 800,000 trials.
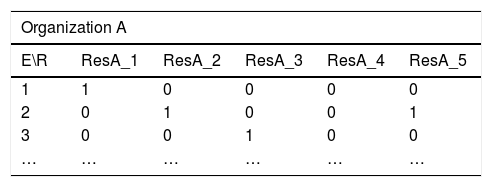
The diversified and focused typologies were variants of Table 2. The specific matrices used in the simulation are shown in Table 5.
“Diversified” firm A begins with five responses with low density of survivable outcomes “1.” “Focused” firm B begins with two responses with high density.
| Organization A | |||||
|---|---|---|---|---|---|
| E\R | ResA_1 | ResA_2 | ResA_3 | ResA_4 | ResA_5 |
| 1 | 1 | 0 | 0 | 0 | 0 |
| 2 | 0 | 1 | 0 | 0 | 1 |
| 3 | 0 | 0 | 1 | 0 | 0 |
| … | … | … | … | … | … |
| Organization B | ||
|---|---|---|
| E\R | ResB_1 | ResB_2 |
| 1 | 1 | 0 |
| 2 | 0 | 1 |
| 3 | 1 | 0 |
| … | … | … |
Each firm within a type, regardless of its strategy, starts with the same beginning inventory.
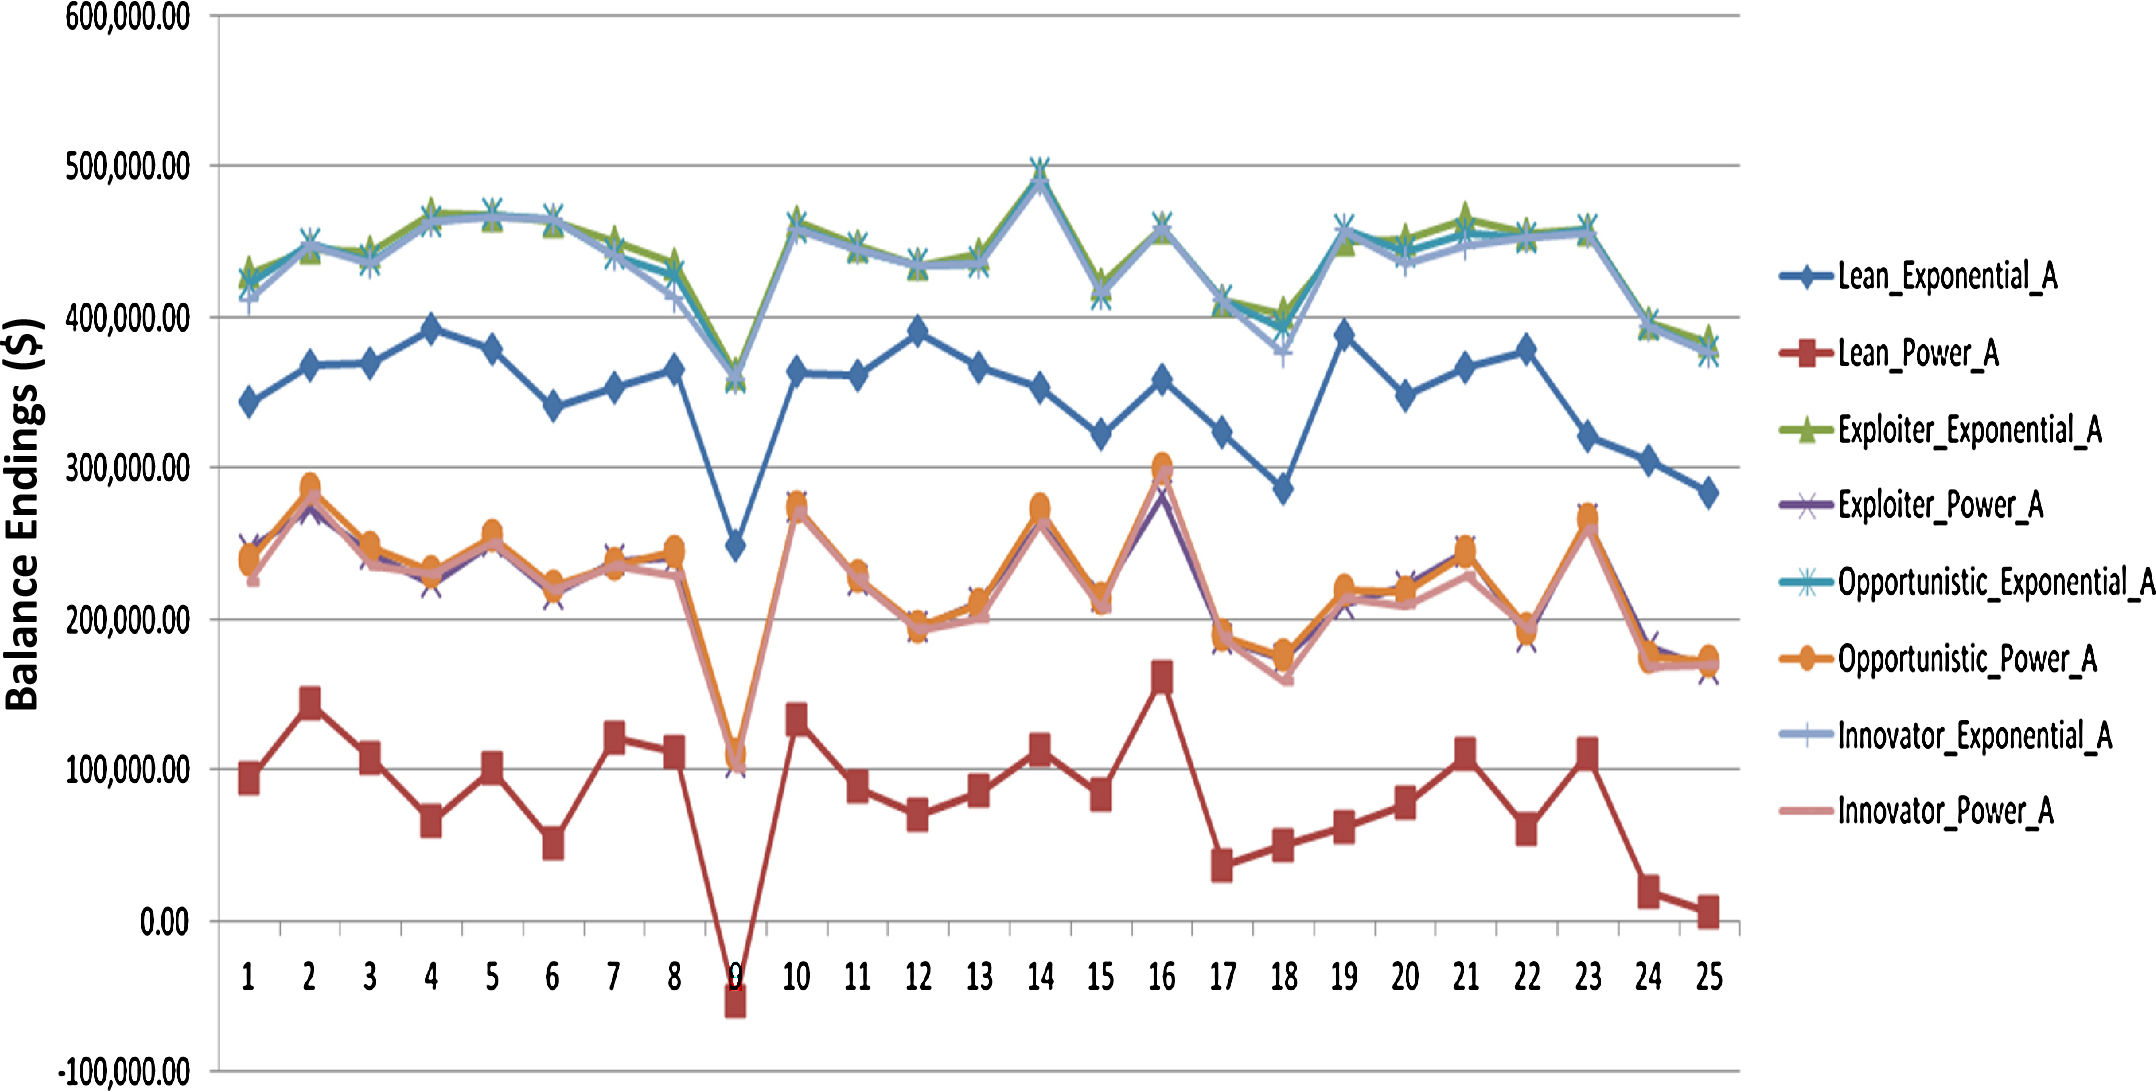
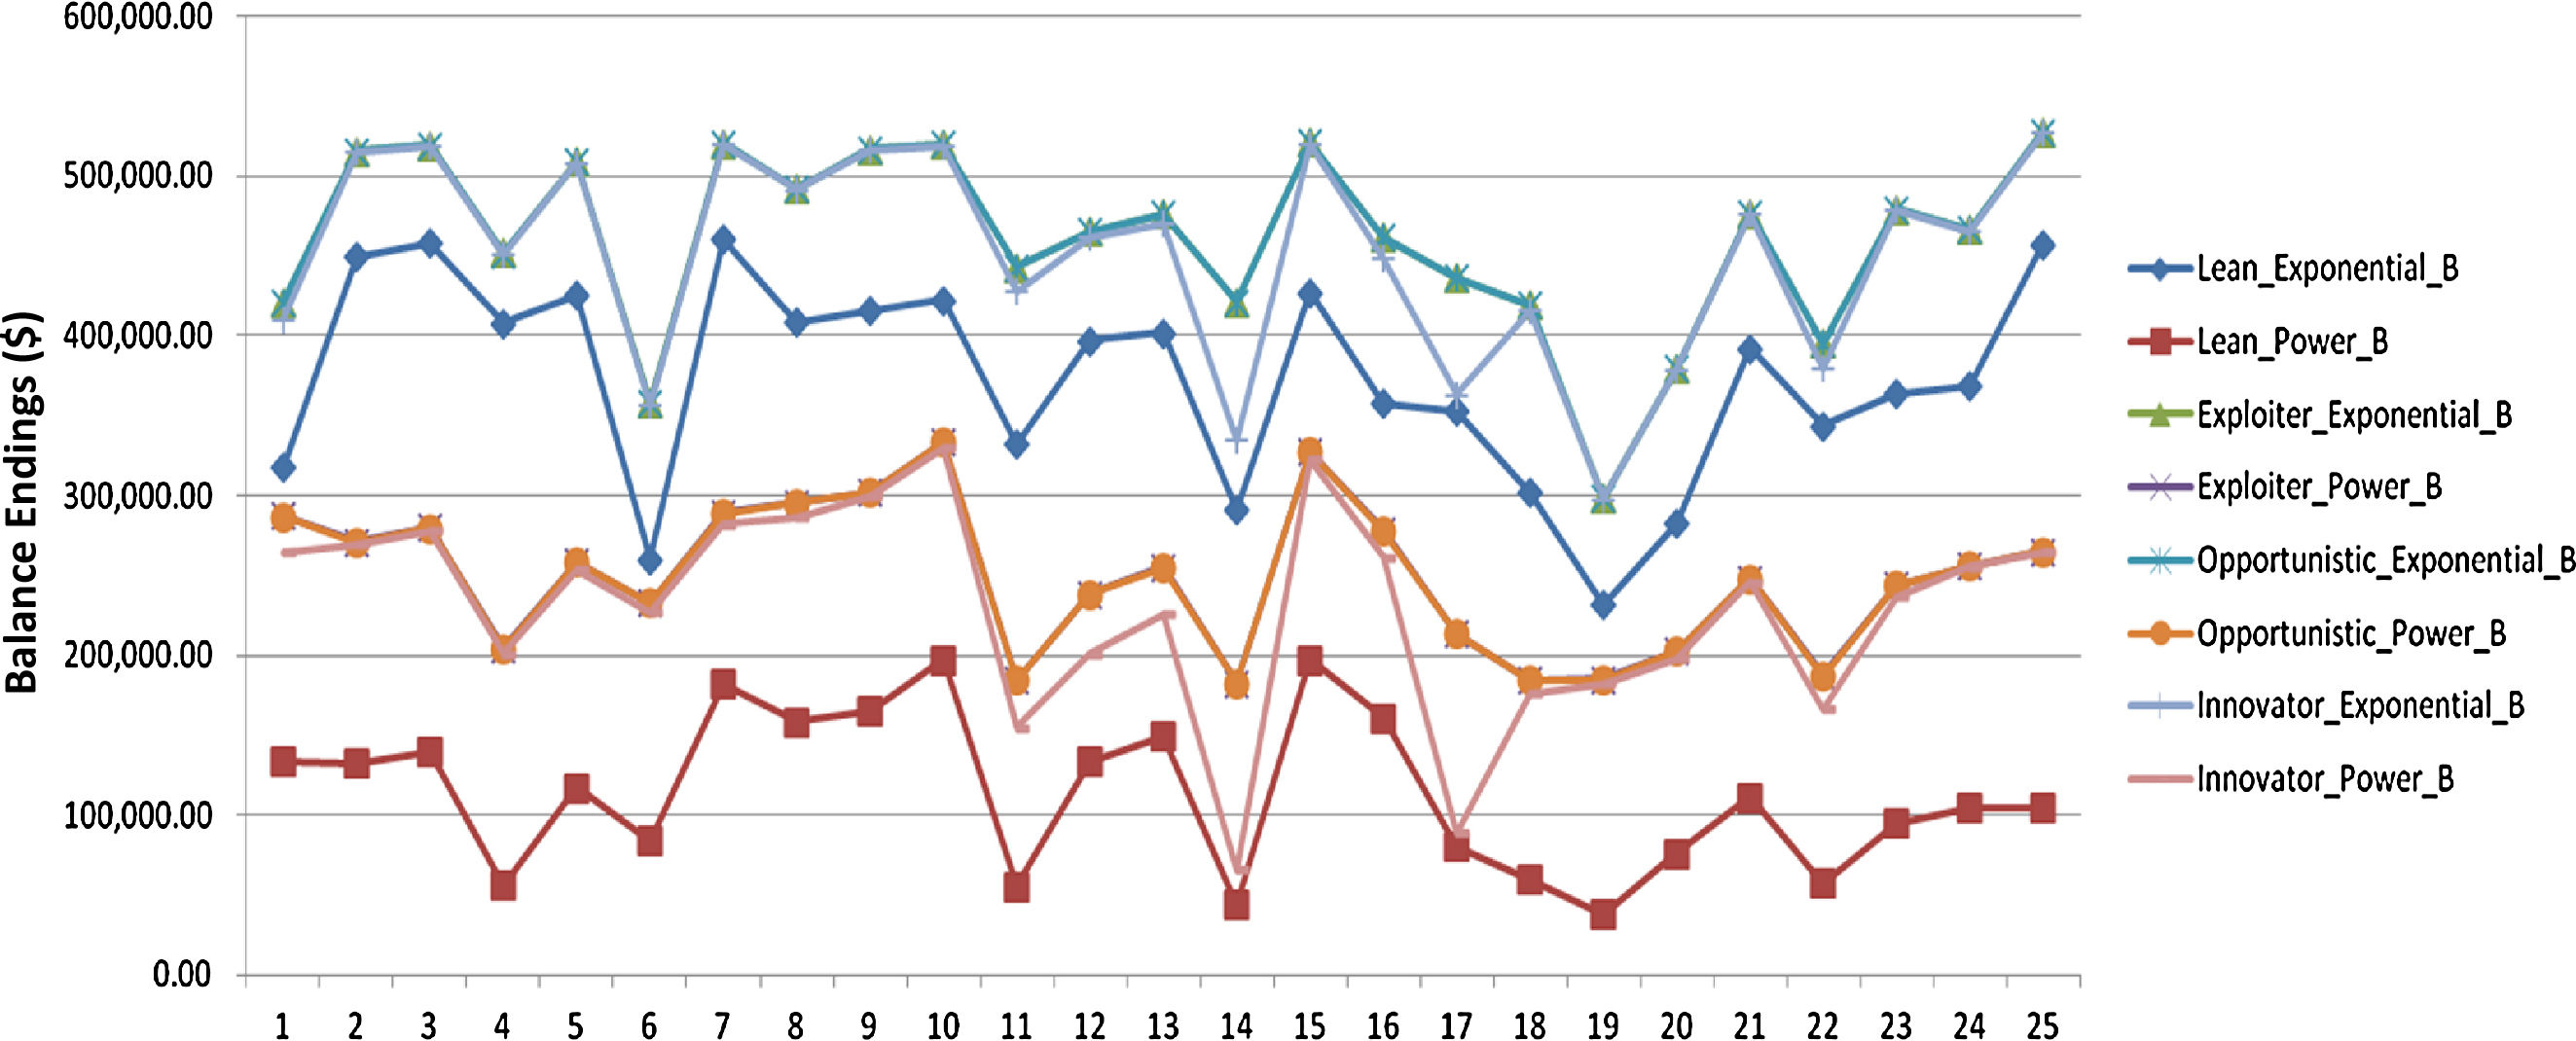
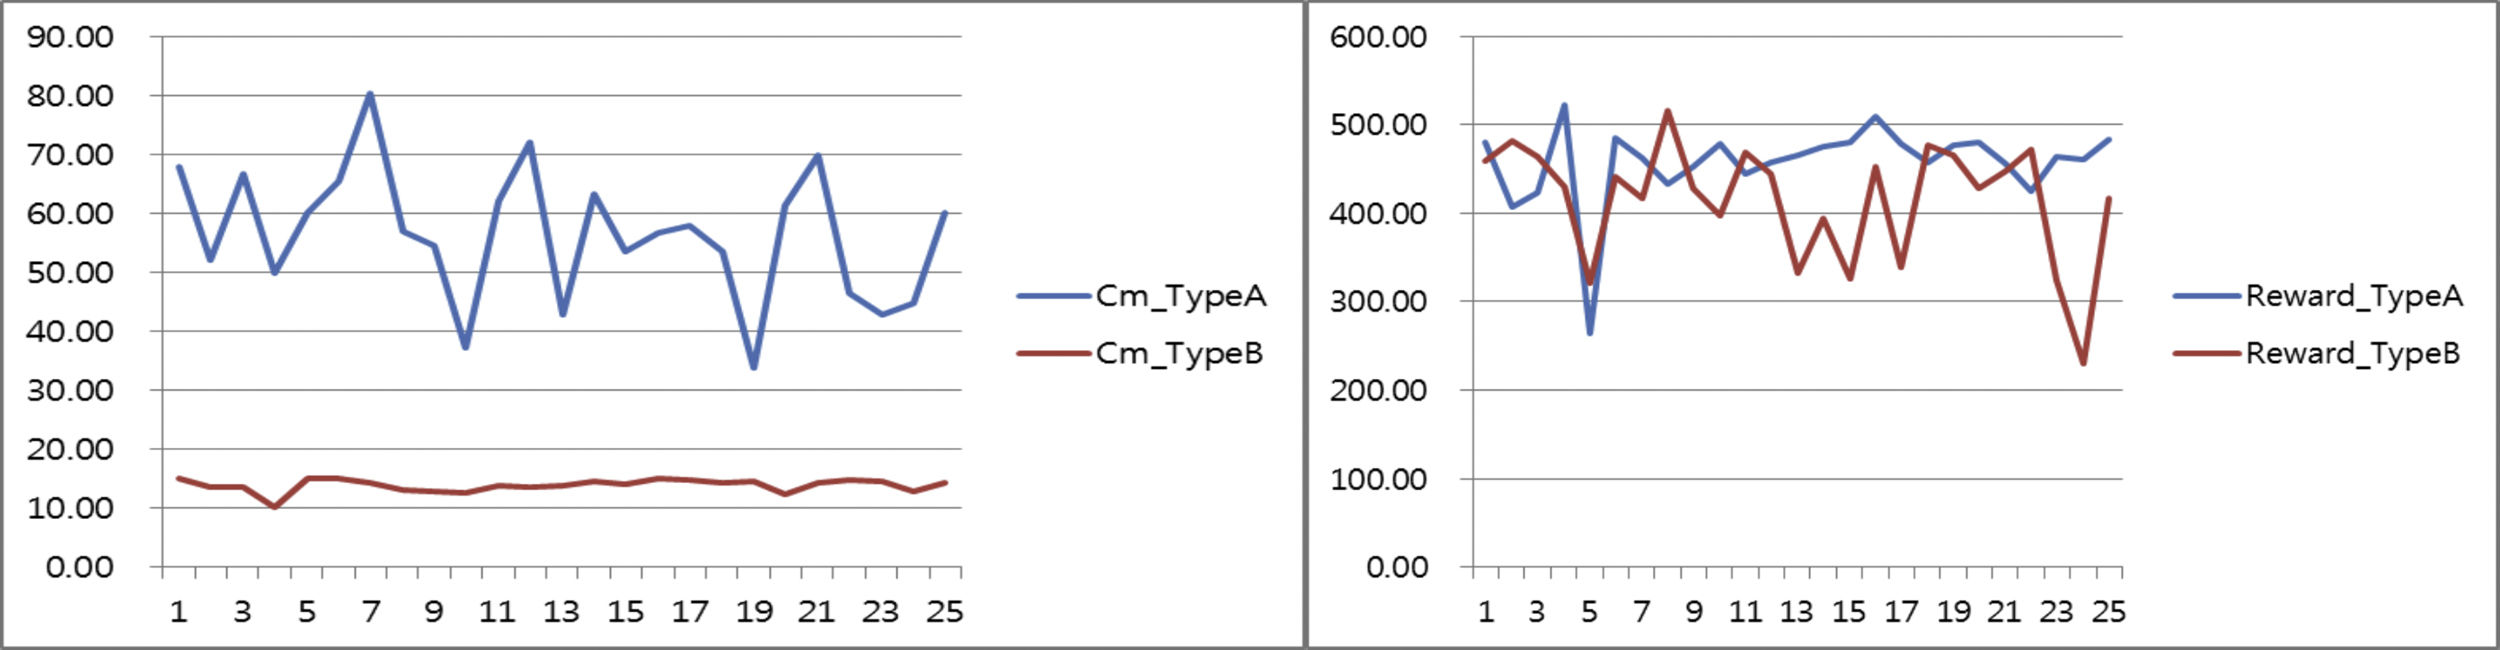
Twenty-five validation runs, each with different initial randomly generated7 libraries, were made for each of the 16 situations. Figs. 2 and 3 show that simulation results were largely stable, preserving the performance rank of each firm-environment combination.
 firms over 25 (horizontal axis) simulation runs. Vertical axis is ending financial balance.")
 firms over 25 (horizontal axis) simulation runs. Vertical axis is ending financial balance.")
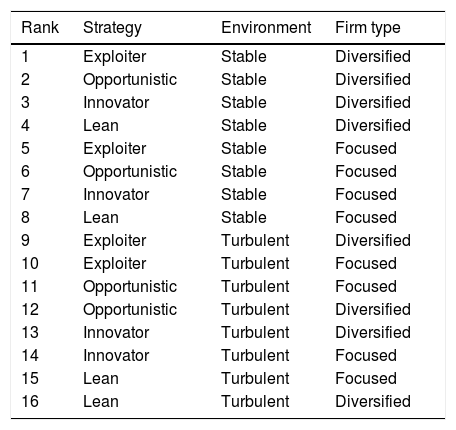
We defined firm performance by the financial balance and defined the related risk by the standard deviation of the ending balance. As a result, the relative performance is calculated by “average balance/s.d. of balance.” (See Denning (2014) for an overview of the many indicators of firm performance, and the controversies attached to them.) The detailed ranking of performance is shown in Table 6.
Ranked performance of firm types, environments, and strategies. (Rank 1 is best.).
| Rank | Strategy | Environment | Firm type |
|---|---|---|---|
| 1 | Exploiter | Stable | Diversified |
| 2 | Opportunistic | Stable | Diversified |
| 3 | Innovator | Stable | Diversified |
| 4 | Lean | Stable | Diversified |
| 5 | Exploiter | Stable | Focused |
| 6 | Opportunistic | Stable | Focused |
| 7 | Innovator | Stable | Focused |
| 8 | Lean | Stable | Focused |
| 9 | Exploiter | Turbulent | Diversified |
| 10 | Exploiter | Turbulent | Focused |
| 11 | Opportunistic | Turbulent | Focused |
| 12 | Opportunistic | Turbulent | Diversified |
| 13 | Innovator | Turbulent | Diversified |
| 14 | Innovator | Turbulent | Focused |
| 15 | Lean | Turbulent | Focused |
| 16 | Lean | Turbulent | Diversified |
It comes as no surprise that all strategies did better under this relative performance criterion in the “stable” environment (generated by an exponential distribution of business conditions) than in the turbulent environment generated by the power law.
Overall, the type A firm (Diversified) shows a slightly higher relative performance than the type B firm (Focused) because returns for the type B firm are much more volatile despite its higher average financial balance.
The type A firm tends to reach higher performance with progressive strategies such as “Opportunistic” or “Innovator” as well as with conservative strategies such as “Lean” or “Exploiter” because the firm's diversity of responses reduces the downside risks stemming from the more extreme strategies. In contrast, type B's performance is more volatile under some strategies than under others.
Because the Focused (efficient) organization keeps an inventory with fewer responses but higher density of survivable outcomes against low-numbered stimuli, it incurs more search cost than type A (diversified) firms when an unusual business condition (one with a high number) occurs, leading to frequent “No Reward” iterations.
The “Exploiter Strategy” makes the best performance overall, regardless of firm type, due to its tendency to keep the basic inventory stable.
The “Lean Strategy” and “Opportunistic Strategy” fare relatively much worse in the volatile environment than in the normal because of their poor performance in the extreme environment of high-numbered, unusual business conditions.
The authors are aware that all but the most complex simulations can be “fixed” to ensure reasonable or desired outcomes. The results reported here are from the first (and only) set of costs, and random initial inventories, input to the simulation. We thus affirm it is an honest simulation.
The simulation gives a “yes” answer to our first research question: Some strategies are superior to others. We have partially answered the second research question: The top strategies are stable under varying initial tactical inventories. It remains to see whether they remain stable under different industry cost structures.
We now return to questions of efficiency and flexibility, and their impact on performance. We use the inverse of “average size of response inventory” (proxied by inventory cost) as a measure of efficiency, and search cost similarly as a measure of flexibility. Higher search cost means a higher total number of responses were ultimately used. Thus this proxy is in line with Ashbian variety.
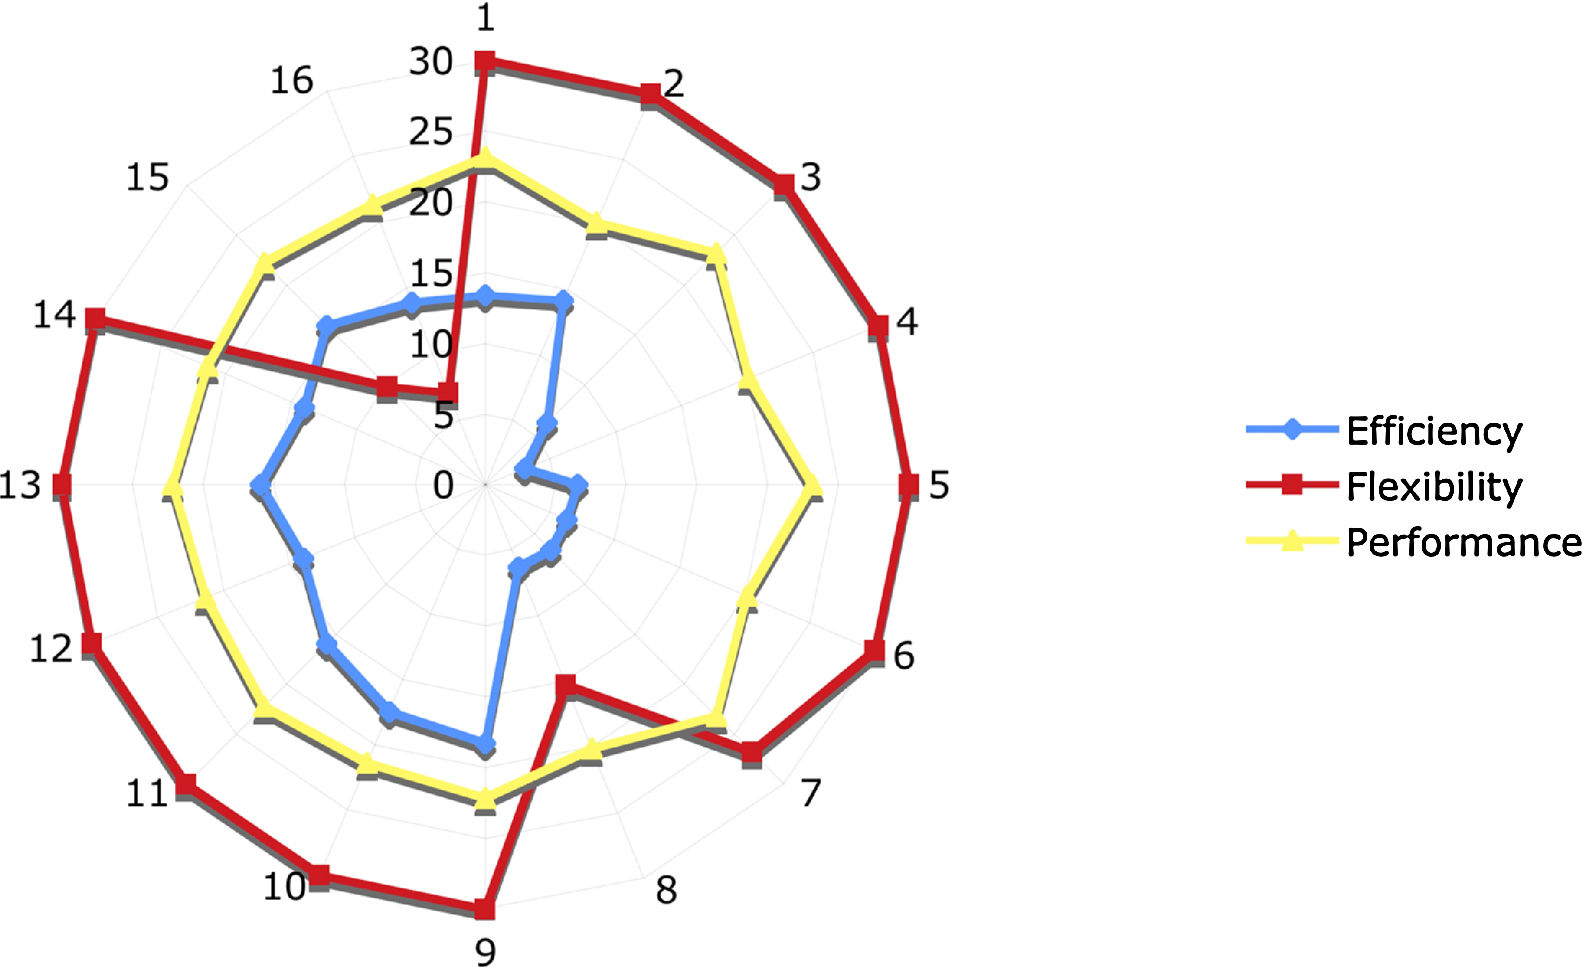
Fig. 4 shows the results. An “eye-ball analysis” of the Figure shows no overall correlation between efficiency and performance (measured in Fig. 4 by total profits earned) emerges when all strategies are considered. What is remarkable is that:
- •
Efficiency and flexibility appear to jointly drive performance in scenarios 9 through 14.8 This means that efficiency and flexibility jointly determine performance in turbulent environments – except for lean firms.
- •
Efficiency does seem to drive performance for scenarios 9 through 16 (as well as for strategies 1 and 2). Efficiency is thus more important to the firm in turbulent environments. Furthermore (though more data would need to confirm this), efficiency and flexibility may be used jointly for advantage in Exploiter Diversified and Opportunistic Diversified firms in stable business environments.
- •
Combinations 3 through 8 performed well despite low efficiency. This could mean that, in line with common observation, stable business environments provide enough profit opportunities to forgive a certain amount of inefficiency. And to forgive some unneeded slack, as 3 through 7 showed high flexibility.
- •
The scenarios with stable environments showed more variability in performance than those in turbulent environments. This is surprising.
, flexibility (outer, or red line) and performance (middle or yellow line) of the sixteen simulated Strategy-Environment-Firm type combinations. Data are from the table in Appendix 1, normalized for clarity in graphic.")
Efficiency (inner, or blue line), flexibility (outer, or red line) and performance (middle or yellow line) of the sixteen simulated Strategy-Environment-Firm type combinations. Data are from the table in Appendix 1, normalized for clarity in graphic.
Though specific operational guidelines from this work must await further sensitivity analysis, the work so far yields useful insights. First, Fig. 5 shows our initial conjecture that efficiency and flexibility always jointly determine performance is wrong. Part of the reason for this must be, as several writers (Jensen & Meckling, 1976; Leibenstein, 1966; Williamson, 1963) have noted, that managers can also use slack for inefficient and value-destroying purposes, rather than to foster strategic behaviors that create value. We have shown that efficiency and flexibility jointly determine performance in turbulent environments. This may be because external challenges effectively focus the attention of competent managers.

What then determines performance in general? Remembering Golany, Learner, Phillips, and Rousseau's (1990) distinction between efficiency (“doing things right”) and effectiveness (“doing the right things right”), we now think the key to performance may be effectiveness, that is, management's ability to choose the right directions and projects. Or as Wedell-Wedellsborg (2017) asked HBR readers more recently, “Are you solving the right problem?” Efficiency and flexibility, however, are key elements in the follow-up to any effective strategic decision.
Our work highlights a limitation of Ashby's principle, which portrays the response set as static. In nature, species evolve, developing new responses. Our simulated firms, like real firms, engage in exploration, bringing new responses into the firms’ inventories. This proactivity of the flexible firm is not represented or even implied in Ashby's Law.
Moreover, we are now more aware (than we were in Ashby's day) of organizational learning. In Ashby's formulation, each trial is independent of those that came before. Modern learning organizations deliberately change their response sets and response frequencies, having learned from experience. In line with Ashby's entropy-based idea, further research might use the Kullback–Leibler measure Σploge(p/q) to compare response frequencies “p” early in the simulation with frequencies “q” several hundred iterations later, to determine the information gain or “learning” that has occurred.
Finally, this work implies that management scholars do not have a satisfactory definition of organizational flexibility. The static Ashby formulation shows only the potential for flexibility. Flexible behavior can only be demonstrated longitudinally. The aforementioned computer company that incrementally reduced its inputs showed only a weak and reactive kind of flexibility. On the other hand, too much volatility in a firm's responses would show a similar lack of control and proactivity.
Simple entropy cannot capture this; the entropy of the two time series in Fig. 5 are the same. Other measures are needed to capture the kind of flexibility sought by companies desiring to operate “on the edge of chaos.”
Limitations and possible extensionsSpall (2004) writes that the “process of building [a] simulation can clarify understanding of [of the] real system, [and is] sometimes more useful than actual application of final simulation.” The present simulation is aimed primarily at enhanced understanding of strategy and its meaning. Further runs with different parameters will, we expect, enhance this understanding still further.
This simulation's results could differ under different assumptions about costs and reward.
- (1)
“Maintenance Cost” incurred makes a more negative impact on the balance of type A organizations, while “Search Cost” incurred or “Reward Won” negatively affects that of Type B. See Fig. 6.
- (2)
”Discard Cost” expended trades off against “Maintenance Cost” in the volatile environment (power distribution) but less so in the stable environment (exponential distribution).
 and “Reward” (right graph) impact on ending financial balance (in thousands, vertical axis) for diversified (Type A) and focused (Type B) firms.")
We have sacrificed some realism to present simulations that can be eye-tested for errors, and that can be published in a manner understandable to readers. Specific limitations to the present simulations include:
- (1)
We have used constant costs for external searches, treating these as deterministic. Probabilistic search times for (robust) responses would be more realistic.
- (2)
“Normal” and “turbulent” are only two of the five environmental conditions examined by Ansoff.9 This is a considerable simplification of a distinction that Ansoff considered important. Our simulation can be expanded to address his five conditions. However, the results will be too complex for easy comprehension, and we judged that our simplified proof-of-concept was justified on these grounds.
- (3)
In these simulations, all firms face the same environmental conditions. That is, a firm's environment does not depend on the actions of its competitors.
- (4)
The four strategies, Lean, Exploiter, Opportunistic Explorer, and Innovator, are rather extreme and rigid.
- (5)
Our performance criterion presumes that volatility is undesirable, i.e., that the firm does not deliberately create volatility for purposes of market manipulation.
- (6)
We have used only two outcomes, survival or failure. A more nuanced approach would allow gradations of survival, e.g., more profit or less profit.
None of these are obstacles, in principle or in practice, to greater realism in future elaborations of the simulations.
Corporate financial statements do not lend themselves to the separation of costs as these costs are represented in these simulations. Some firms using activity-based costing may be able to separate them satisfactorily. However, this cannot lead to strategic guidance for other firms, and so remains a more serious limitation of this research, one that in future could be addressed by cross-discipline research in strategy and accounting.
In these simulations, all behavior is cost-driven. Further research should include more sensitivity analysis under varying cost estimates.
Much recent research suggests organizational culture trumps rational strategy in determining firm behavior, and the present research does not reflect that. That is, habit or culture, for example, rather than explicit strategy, may lead to a firm's willingness or reluctance to seek new responses. The present paper, however, reports research on strategy, and not on organizational behavior. Future research may integrate the two research streams to gain a fuller picture of the determinants of firm behavior.
The following are the supplementary data to this article:
A current application of Ashby's principle in biology is Bolnick et al. (2014): “Diet Variety Can Hamper Microbial Diversity In The Gut.”
This research was supported by the MSIP (Ministry of Science, ICT and Future Planning), Korea, under the “IT Consilience Creative Program” (NIPA-2013-H0203-13-1001) supervised by the NIPA (National IT Industry Promotion Agency), and also by the Nuclear Research & Development of the Korea Institute of Energy Technology Evaluation and Planning (KETEP) grant funded by the Korea government Ministry of Trade, Industry and Energy (2013T100200058), and also by the Taiwan government Ministry of Science and Technology (MOST 103-2511-S-003-045-) and National Science Council (NSC 102-2912-I-110-522).
Flexible behavior can be observed only longitudinally. Ashby's matrix shows capability for flexibility, which in principle if not in practice, can be measured at any moment in time.
The Excel™-based Monte Carlo simulation and a user manual are available on request from co-author Chang. The manual also appears as an Appendix to this paper.
We are aware that there are many definitions of strategy (Mintzberg, 1994) and that some readers may take issue with ours. We set it forth, however, as the definition most consistent with the relative variety framework of system theory. It can easily co-exist with the game-theoretic definition of strategy, that being a general rule for deciding which response to choose for any stimulus – a ‘stimulus’ being the move of (one of) the other player(s).
“Maintaining slack costs money, so too much slack can lower profitability” (Bromiley, 2005; 31).
Vanacker et al. (2017) note that a key dilemma managers often encounter is whether, on the one hand, they should build in excess resources to buffer their firms from internal and external shocks and to pursue new opportunities or whether, on the other hand, they should develop ‘lean’ firms.
Firms were presumed to be viable in iteration 1, i.e., to have a viable response for most of the most likely environmental conditions. The initial libraries were generated by a distribution that recognized this assumption. The distribution was independent of the distribution of environmental conditions.
Refer to Table 5 for the definitions of these scenarios.
- Download PDF
- Bibliography
- Additional material