


The top management team (TMT) of family firms is divided into two groups: family and non-family executives. Each group of executives is driven by different and multiple goals and motivations with distinct strategic innovation decision preferences. The centralized ownership and control of firms confer natural authority on family executives, and the appropriateness of the structural power distribution in the TMT has a significant impact on the level of participation and contribution of non-family executives to corporate innovation strategies that affects the innovation performance of family firms. Based on research of the power distribution of TMTs, this paper argues that a balanced structural power distribution (titles, compensation, representation) between family and non-family executives can improve the TMT interaction process, integrate information and knowledge of non-family executives, help balance economic and non-economic goals, and increase innovation performance. Moreover, we posit that this relationship becomes stronger with increasing board independence and environmental dynamism. We find support for these proposed relationships using a sample of publicly traded family firms in China representing 2,379 firm-year observations from 2009 to 2018. The implications of these findings extend to both family business and TMT research. and we offer practical guidance to encourage professional managers to actively participate in strategic decision-making and planned execution in family firms.
Innovation is an investment in a firm's future growth and a means of cultivating a sustainable competitive advantage to maintain performance growth (Schumpeter & Nichol, 1934). Continuous innovation is a key driver of growth and a significant source of value creation for Chinese family-owned businesses undergoing transformation and upgrading and has a significant role in their development.
In recent years, innovation performance of family firms has received attention from scholars of family firms. Studies have predominantly considered the functioning of the top management team (TMT) responsible for a firm's strategic decision-making (Amason, 1996a; Collins & Clark, 2003) and an influential driver of family-firm innovation opportunity realization (De Massis & Rondi, 2020). The TMT in family firms consists of both family and non-family executives, and the role of non-family executives has been highlighted in the family business literature, especially in relation to innovation outcomes (Calabrò et al., 2019). Non-family executives bring new ideas, information and knowledge, social ties, and human capital beyond what family members could offer (Fang et al., 2016; Stewart & Hitt, 2012). Hence, the participation of non-family executives can increase the cognitive diversity of the entire TMT (Gedajlovic et al., 2004) and improve the capabilities of the TMT in information processing, problem identification, strategy formulation, evaluation, and selection (Hambrick & Mason, 1984). In prior literature, the level of non-family executive participation in innovation was frequently measured according to whether non-family executives are hired, the number or percentage of non-family members in the TMT. In reality, this does not reflect the extent of non-family executive involvement. The status of non-family executives, the manner in which they are involved, whether they are entrusted with key responsibilities and decision-making power (Sundaramurthy, 2008), and the way in which they collaborate with family executives are intimately connected with their role in innovation. It is paramount, therefore, to understand the factors that spur participation of non-family members and foster interaction of both family and non-family members within the family firm's TMT (Patel & Cooper, 2014).
The different goals and motivations for action of family and non-family executives (Chua et al., 2009) influence the preferred choice of each party in innovation strategy decision-making and execution. Family executives have a tendency to prioritize preserving non-economic goals (Gómez-Mejía et al., 2007), alternating their focus between non-economic and economic goals (Block, 2012; Chen & Hsu, 2009; Patel & Chrisman, 2014), while non-family executives prioritize economic goals to improve their financial returns, their human capital and their position in the professional managerial market (Ward, 2010). “Bifurcation bias” has received considerable attention in family-business research in recent years (Kano & Verbeke, 2018; Verbeke et al., 2020), in this regard, reflecting a common phenomenon that family and non-family members are usually treated differently in family firms, with family members more likely to receive preferential treatment. When non-family members believe they are being treated unfairly because of bifurcation bias, they are hesitant to contribute their human and social capital, such as their knowledge, skills, and social connections (Chrisman et al., 2014; Samara et al., 2021).
Given these goal differences and the potential for “bifurcation bias”, it is essential to foster TMT behavioral integration to capitalize on the cognitive diversity of family and non-family members in the family-firm context. Power is the capability of an actor to influence the behavior of others, to get people to do what they would otherwise choose not to do (Finkelstein, 1992; Pfeffer, 1981). Scholars argue that power plays a central role in strategic decision-making within top teams (Hambrick, 1994; Mintzberg et al., 1976). Thus, TMT members’ perception of how power is distributed influences their propensity to engage in integration behavior. If TMT members perceive a reasonable distribution of power, they are more willing to participate in knowledge and information exchange and sharing, strategic decision-making, and openly presenting their views and suggestions (Edmondson et al., 2003). Given the inherent authority of family executives in family firms, disproportionate power and influence in the TMT may lower the paticipation of non-family members. The irrational distribution of power will exacerbate the dominance of innovation decisions by the most powerful party in the firm, thereby diminishing the comprehensiveness of innovation strategy decisions and innovation efficacy (Simons et al., 1999).
Finkelstein (1992) identifies the power of TMT members as deriving either from ownership or from formal structures and hierarchies. Structural power is that acquired by individuals based on their different positions and hierarchical authority in the organizational structure and refers to the relative distribution of titles, compensation, and representation of the board of directors (Finkelstein, 1992; Hambrick, 1981). Concentrated ownership gives family executives natural authority in family firms, while non-family executives (who often hold few or no shares in the firm) rely on structural power conferred through the hierarchy or on their position to influence the decision-making and execution process (Patel & Cooper, 2014). An equal distribution of structural power between family and non-family executives in family firms can improve the effective functioning of three key dimensions of behavioral integration: the quantity and quality of information exchange, cooperative behavior, and joint decision-making (Hambrick, 1994). A rational distribution of structural power has a substantial impact on the motivation of non-family executives to participate in and contribute to the development and implementation of the firm's innovation strategy (Eisenhardt & Bourgeois III, 1988; Hambrick, 1981), and thus to the innovation performance of family firms.
The limited research so far undertaken on TMT dynamics has focused on ways to increase non-family member participation and interation with family members to improve innovation outcomes (Patel & Cooper, 2014). The purpose of this paper is to investigate how the structural power distribution between family and non-family executives influences the innovation performance of family firms.We further explore boundary conditions for the effects of structural power distribution on innovation performance. The external environment influences the structure of the TMT and its members' behavioral integration. Better firm governance can be assured by independent directors contributing knowledge and resources to family and non-family executives, while providing support to non-family executives to ensure oversight and control. A balanced distribution of structural power is more conducive to innovation performance in the context of increased environmental dynamics, where the participation of non-family TMT members is crucial for the formulation and implementation of innovative strategies.
Building on our findings, we contribute to the literature on family business and TMT research. Firstly, we investigate whether a balance in structural power between family and non-family executives in TMTs is a significant determinant of innovation performance from a power distribution perspective, thereby enhancing our understanding of the antecedents that influence the innovation performance of family firms. Secondly, the phenomenon of "bifurcation bias " as common in family firms has begun to attract scholarly attention, although most existing studies remain at the theoretical exploration stage and lack relevant empirical evidence. In fact, the structural power distribution of TMT members essentially reflects the degree of “bifurcation bias “ in the power distribution of family firms, and our findings indirectly enhance and extend empirical study of the “bifurcation bias” outcome variable. Thirdly, using family firms as a research context, our evidence extends the current understanding of TMT dynamics in family firms by scrutinizing TMT behavioral integration through an empirical assessment of structural power distribution between family and non-family executives. Such an assessment allows the interaction of TMT structure and behavior on family firm innovation to be examined, to determine whether a rational power distribution within executive teams is conducive to improving interaction among core TMT members. Based on our findings, we provide practical guidance on the distriution of power and struture of governance of family firms. Specifically, we provide a reference point for motivating non-family executives to participate actively in innovation decisions, contribute their human and social capital to implementing innovation strategies, and enhance the innovation performance of family firms.
Literature review and hypothesis developmentTMT power distribution and innovationThe power distribution in the TMT influences the attitudes and behaviors, cognitions and emotions, and decision-making processes of team members, ultimately leading to differential organizational outputs, such as innovation capability and innovation performance (Hambrick, 2007). Power distribution is a description of the power-level status of each member of the TMT (Smith et al., 2006), and an uneven power distribution implies team members’ asymmetric control over corporate resources (Magee Smith, 2013). Based on research of TMTs in family firms, the presence of non-family executives can not only assist family firms in achieving a balance between the economic goals of the firm and the non-economic goals of the family, but can also offer a more diverse perspective on innovation strategies (Arregle et al., 2019; Chua et al., 2012). An unbalanced distribution of power within the team can constrain the behavior of team members; those weaker in the distribution of power tend to be less engaged and proactive in the strategy development process (Guth & Macmillan, 1989). Thus, the more powerful members of the team can influence or negate the influence of less-powerful members in the strategic development process (Sperber & Linder, 2018), leading to team fragmentation, task conflict and emotional discord among team members (Greer & van Kleef, 2010), which affects the team's ability to innovate and impacts on innovation outcomes (O'Neill et al., 2013). At the same time, to protect their safety and avoid career risks, less-powerful members of the team are afraid to make suggestions that conflict with the preferences of dominant executives, are less likely to express their views even on novel and innovative ideas, and are less likely to participate in the process of determining and implementing innovation strategies (Dewett, 2004). This occurrence will undermine team cohesion, destabilize innovation strategy implementation, and decrease the likelihood of success. Eisenhardt and Bourgeois (1988) discovered that office politics consumes the time of team members and distorts their perceptions and understanding of one another's viewpoint. In this situation, the flow and sharing of information within the TMT is reduced, cooperation is disrupted, and joint decision-making becomes less effective, thus negatively affecting innovation performance.
Structural power distribution in the family firm TMT and innovation performanceInnovation is often a lengthy and involved process, and TMT support is crucial for ideas’ generation and implementation. Two characteristics are fundamental to the TMT's ability to drive effective strategic processes: cognitive diversity and the behavioral interaction of TMT members (Amason, 1996b). However, diversity in goal preferences can degrade the quality of interaction within executive teams and prevent them from capitalizing on their cognitive diversity (Zeki et al., 2005). The different interests, goals and behavioral motivations of family and non-family executives (Chua et al., 2009) influence the different choice preferences of both parties in innovation strategy decision-making and implementation, rendering it crucial to foster behavioral interaction to capitalizes on the cognitive diversity of both family and non-family members.
Behavioral integration research identified three key factors that influence interaction in the TMT: (1) the quantity and quality of information exchange; (2) the extent of collaborative behavior; and (3) joint decision-making (Hambrick, 1994; Zeki et al., 2005). When these three factors are successfully combined, the TMT is better able to integrate the knowledge and skills of every team member. Strengthening the interaction between family and non-family executives in family firms is more likely to increase the participation of non-family executives, resulting in more comprehensive information being available to the TMT, integrating and deepening the processing of diverse information and knowledge, and adopting a collective decision-making approach to problem solving (Wittenbaum & Stasser, 1996). Good interaction between family and non-family executives can balance competing goals and improve the comprehensiveness and efficacy of innovation strategy decision-making and implementation (Simons et al., 1999). Equal distribution of structural power between family and non-family executives (i.e., a balanced distribution of compensation, titles, and representation on the board of directors) facilitates behavioral integration of the TMT in family firms.
Equally distributing structural power will have the following effects on TMT interaction: Firstly, the balanced distribution of structural power can increase the participation of non-family executives, thereby facilitating the communication and exchange of information resources among members. Through this exchange and sharing, the TMT can comprehend the views and perspectives of all parties and fully utilize their social and human capital, thereby improving the breadth and efficacy of innovation processes. The structural power that compensation, titles and representation symbolize legitimizes the task roles of TMT members. Formal positions allow team members respect and prestige in the organization (Eisenberger et al., 2002), and their participation in problem solving gives them a sense of accomplishment (Gist et al., 1987). Compensation is a visual reflection of a team member's organizational status. A large disparity in position and compensation between team members means that those in subordinate positions and who are less-well compensated are more likely to perceive disparity in material rewards as inequity in the distribution of power. Inequality in power within the TMT inhibits the exchange of information and sharing of resources among members, and the opinions of the less powerful are easily ignored or TMT activities are dominated by the more powerful party. Consequently, the less powerful will express their opinions less frequently and reduce or withdraw their contribution to innovation strategy development and implementation processes (Harrison & Klein, 2007).
Secondly, increasing structural power equality can increase TMT members’ cooperative behavior. Chen and Hambrick (1995) propose that excessive differences in compensation among TMT members can lead to internal competition and decrease cooperative team behavior. Meanwhile, empirical studies have found that more equal compensation and a sense of fairness among team members through equal power distribution reduces conflict, enhances team cooperation and subsequently improves team performance (Sinclair, 2003). Ensley et al. (2007) found that unequal pay for non-family TMT members lowers team cohesion, increases emotional conflict, and reduces cognitive diversity, all detrimental to the firm's long-term growth.
Thirdly, research on power distribution in TMTs has revealed that, in general, the more powerful party holds more decision-making authority and has a greater impact on strategic decisions as a whole (Preston et al., 2008). Due to their familial ties, family executives in family firms wield greater "invisible" influence over the innovation strategy formulation process. When family and non-family executives have relatively equal structural power, non-family members are more likely to be included in the innovation strategy decision-making and implementation process, thereby limiting the dominant role of family executives and allowing both parties to exert equal influence on innovation strategic decisions. Conversely, if the perceived power differential is too great, the more powerful party will be less willing to accept the opinions of others and the less powerful party will be less willing to express their opinions (Tost et al., 2013). Balancing structural power distribution may also increase the bargaining power of non-family members and strengthen mutual monitoring of innovation activities (Bennedsen & Wolfenzon, 2000).
In conclusion, a more equal distribution of structural power between family and non-family executives in family firms (i.e., a balanced distribution of titles, compensation, and representation on the board of directors) can lead to more effective functioning of the three key elements that influence behavioral integration in TMTs: the quantity and quality of information exchange, the extent of cooperative behavior, and joint decision-making (Hambrick, 1994). Balanced structural power distribution enhances the willingness and ability of non-family executives to share and provide diversified information and resources for innovation and increases cooperative behavior and joint decision-making between family and non-family executives, allowing non-family executives to participate more effectively in the innovation decision-making and implementation process that promotes interaction and cohesion within the TMT, stimulates team members' willingness to share risks, and balances influence exerted by both parties in innovation (Tost et al., 2013). Importantly, it enables family firms to balance economic and non-economic objectives in their innovation strategies (Fiol et al., 2001) and is conducive to improving innovation performance. Consequently, we propose the following hypothesis:
Hypothesis 1 Equal distribution of structural power (titles, compensation, and representation) between family and non-family executives has a positive effect on the innovation performance of family firms.
With the hypothesized balanced structural power distribution between family and non-family executives improving TMT behavioral integration in family firms leading to increased innovation performance, we argue that it is essential to explore the boundary conditions that influence TMT internal dynamics. The structure of the TMT and its members' behavioral integration will be influenced by the external environment (Finkelstein, 2008). The first external factor affecting the TMT is the board of directors; the second is ambiguous information and an uncertain environment beyond the organization's operational boundaries. Digging deeper into the interplay between TMT dynamics and the exteral environment, we were able to combine an internal perspective on TMT power distribution with an external perspective related to board governance and environmental dynamics, discussed below.
Board independenceThe Board of Directors is responsible for assisting in the acquisition of vital external information and resources, advising on day-to-day operations, voting on proposals for major strategic decisions, and monitoring management conduct and strategy implementation (Hillman & Dalziel, 2003). TMT members are responsible for initiating and implementing strategic actions, and the board of directors exercises supervisory oversight over the TMT (Fama & Jensen, 1983). The China Securities Regulatory Commission(CSRC)promulgated "Guidance on the Establishment of Independent Director System in Listed Companies" in 2001, which clearly defined the concept of an independent director: i.e., an independent director of a listed company is a director who does not hold any position other than director in the company and does not have any relationship with the listed company and its major shareholders that may prevent him/her from making independent and objective decisions. Independent directors play an essential role in monitoring executive behavior and providing independent counsel on the development of the firm. The oversight of the TMT by independent directors can reduce information asymmetry between them and the board; at the same time, independent directors are more likely to challenge established assumptions about strategy and force TMT members to modify their positions. Their expertise can enhance the quality of strategic discussions. Without an effective system for monitoring decisions, TMTs tend to reduce their exposure by selecting less risky and less profitable investment options. In family firms, board members are influenced by family members, but they also need to protect non-family stakeholders’ interests. However, in family businesses, the board may be affected by the entrenchment effect, and those board members with ties to family members may be less willing to monitor the actions of others (Anderson et al., 2004; Schulze et al., 2002). At various stages in the evolution of family businesses, the characteristics and competencies of boards change. When the firm is in its infancy or at founder-owned stage, it is essential for the board to be able to provide vital resources. As the firm matures and becomes larger with a more complex strategy and ownership structure, board members who can provide sound counsel and assist in resolving family ownership conflicts become increasingly valuable.
Greater board independence enhances the impact of structural power equality on firm innovation performance, as it reduces the dominance of family executives in innovation strategies, thereby increasing the participation of non-family executives and ensuring the inclusion of their contributions. Board members aid non-family executives in their innovation strategies to pursue economic goals more effectively by sharing their expertise and providing effective resources. Further, non-family executives can seek resources to pursue their preferred strategic actions by utilizing the board's human capital and experience (Hillman & Dalziel, 2003). A highly independent board provides non-family executives legitimacy to participate. The greater the independence of the board, the more effectively the goals of family and non-family executives can be balanced, thus enhancing the firm's comprehensiveness in developing and executing innovation strategies.
In conclusion, the greater the independence of the board of directors, the more board oversight will occur to diminish the dominant role of family executives in the innovation strategy, while increasing the participation of non-family executives and facilitating TMT interaction based on structural power equality between the two parties. In contrast, a board lacking in independence is unable to play an effective supervisory role and may favor the powerful party in the decision-making process to achieve its goals. Alternatively, it may play a negative role, hindering interaction between family and non-family executives during the innovation strategy process. With a greater degree of board independence, the structural power distribution between family and non-family executives will have a greater positive effect on innovation performance. Consequently, we propose that:
Hypothesis 2 Board independence plays a positive moderating role in the relationship between equal distribution of structural power and innovation performance in family firms.
The TMT will always be influenced by external environmental factors in the process of making, implementing and adjusting strategic decisions. The dynamic nature of the environment refers to the rapidity and unpredictability of environment change (Dess & Beard, 1984) and is a significant external contextual factor influencing the strategic behavior of the firm (Liang et al., 2010). One of the purposes of an innovation strategy is to assist companies to maintain their core competencies in a market environment undergoing rapid change. The increased dynamism of the environment necessitates that firms make innovative, complex, open, and responsive strategic decisions (Eisenhardt, 1989).
When confronted with ambiguous information and a high level of uncertainty, family firms must adapt their resource allocation and innovation strategies accordingly. The fast-changing and complex environment requires TMT members to search extensively for information, process it deeply, consider multiple strategic options, and pursue new opportunities in a dynamic environment with stronger strategic adaptability (Burgelman, 1991). The limited human resources within the family may not be sufficient to meet such complex and specialized needs, and it is necessary to seek specialized competencies, heterogeneous information and knowledge combinations from non-family executives. In this context, the importance of balancing the structural power of family and non-family executives cannot be overstated. An equal distribution of structural power can support both family and non-family executives to participate more effectively in the interactive process, exchange information and resources, and grasp the requirements of environmental change for innovation strategies more quickly. Repeated and in-depth communication and information exchange between family and non-family executives can facilitate a more comprehensive integration of the team's cognitive resources (Zahra et al., 2002). This can compensate for problems caused by the lack of a diverse knowledge structure of involved parties, and can effectively manage different types of information, thereby enhancing the comprehensiveness and accuracy of decision-making. At the same time, the equal distribution of structural power can result in a positive communication atmosphere and open communication channels for the team, prompting both parties to propose differentiated decision-making solutions and conduct in-depth analysis and evaluation of the benefits, risks and countermeasures to better integrate diverse opinions and make innovation strategy adjustments to adapt to environmental change.
When the external environment changes significantly, the development and implementation of an innovation strategy places greater demands on the TMT's ability to recognize risks and access and acquire key resources, relying on joint decision-making and interaction between family and non-family executives with an equal distribution of structural power (Eisenhardt, 1989). The greater the environmental dynamics, the more family and non-family executives must collaborate. The greater the environmental dynamics, the greater the impact of equal structural power distribution between family and non-family executives on innovation performance in family firms. We therefore propose that:
Hypothesis 3 Environmental dynamics play a positive moderating role in the relationship between structural power equality distribution and the innovation performance of family firms.
We used Chinese family-owned listed companies and issued A-shares on the Shanghai and Shenzhen stock exchanges from 2009 to 2018 as the basis for this study. Referring to previous studies, the criteria for defining family-owned listed companies in this paper are as follows: (1) the actual control of the company can be traced to a natural person or family, and the family ownership (voting rights) is 15% and above; and (2) at least two or more family members are shareholders or hold positions on the board of directors or the TMT (including chairman, directors, and senior management). This study positions the research time window after 2008 and before 2019 for the following reasons: (1) to avoid the effects of the 2008 financial crisis on the design of the research; (2) on December 10, 2008, the Chinese State Administration of Taxation issued the Administrative Measures for Pre-tax Deduction of Enterprise Research and Development Expenses, which stipulates taxation of enterprise R&D investment, after which listed companies must disclose complete and detailed information on R&D expenses in their annual reports; and (3) the coronavirus pandemic began to spread globally in late 2019, and as of March 2022, the cumulative number of confirmed cases worldwide exceeded 480 million, with the global spread of the epidemic having serious economic impacts and social repercussions.
This paper focuses on family and non-family executives in family firms; therefore, the most important aspect of the data collection process is to confirm whether the executives are family members, i.e., whether there is a relationship between the ultimate controller of the firm and the TMT members. We cross-reference the identity information of TMT members from the following channels: (1) According to the regulations of the China Securities Regulatory Commission(CSRC), the annual report, prospectus, and listing announcement of publicly traded companies must include the "shareholding of the top ten shareholders," the "statement of shareholders' affiliation or concerted action," the "block diagram of property rights and control relationship between the Company and the actual controller," and the biographical information of the executive officers; (2) If the TMT members do not hold shares, even if they are related to the firm's ultimate controlling shareholder, the listed company will not disclose their familial relationship. In this instance, we verified whether the members are related to the actual controller of the family firm individually through search engines and relevant financial websites and by checking the list of members appearing in the column of "Basic Information of Directors, Supervisors and Senior Management" in annual reports.
Through the Chinese Stock Marketing and Accouting Research (CSMAR) database and Wind financial services database, we collect data on enterprise financial information (return on assets, gearing ratio, redundant resources, etc.), innovation investment and patent information, enterprise characteristics (age, size, industry), TMT characteristics (age, gender, tenure, level of education), and board of director characteristics (size, duality). According to the control criteria of similar previous research, the sample data are rigorously screened using the following procedures: (1) remove firms with ST, SST, and *ST1; (2) remove firms with significant missing data, such as R&D expenses and the number of patents; (3) remove firms with unclear relationships between executives and actual controllers and with missing information of executives and financial data.
Some key variables in this study, such as the structural power distribution of the TMT and family voting rights, were not directly accessible. We therefore assembled a coding team to code and manually calculate the following information: According to the coding manual, two coders coded and calculated the aforementioned variables; the results obtained were then checked; if inconsistencies were discovered, the accounting process was repeated until identical results were obtained.
Following these procedures, a total of 2379 firm-year observations were obtained.
Research modelTo test the hypotheses, we constructed a regression model. A regression model of the effect of structural power distribution in the TMT of family firms on the innovation performance is:

The moderating effect of board independence on the relationship between structural power distribution in the TMT and innovation performance is:

The moderating effect of environmental dynamics on the relationship between structural power distribution in the TMT and innovation performance is:

A diagram of the research model based on the three hypotheses presented above is shown in Fig. 1.
Variables
Dependent variable. There is no unified standard for measuring innovation performance; the existing literature employs technical, financial, and market indicators. The number of patents is the most direct indicator of technological innovation, and the data are easy to obtain. As widely used by previous studies (Becheikh et al., 2006; Chang et al., 2006; Flor & Oltra, 2004), the patent counts data are used as an indicator of technological innovation performance of firms. Thus, we draw on Lin and Chen (2005) approach, where the ratio of patent applications to total assets is employed as a measure of technological innovation performance. Technological innovation is a long-term, capital-intensive endeavor with a lengthy result cycle. To examine the current level of innovation performance, we use the number of patent applications with a one-year lag in the empirical analysis.
Independent variables. In previous studies, the power distribution of the TMT was measured by the power gap between the CEO and other executive members, the coefficient of variation of the power distribution, or by scales (Hambrick, 1981; Smith et al., 2006). As this study focuses on two distinct groups of family and non-family executives, measuring the power gap between individuals is not applicable.
The proportional distribution of family and non-family members in the TMT in terms of numbers does not reflect the distribution of power in the TMT of family firms (Minichilli et al., 2010). Finkelstein (1992) proposed that structural power of TMT members has three components: the number of job titles in the organization, compensation, and whether they have seats on the board of directors. The combination of these three power indicators as a measure of TMT power is widely used in related studies (Mitsuhashi & Greve, 2004; Pollock et al., 2002; Smith et al., 2006). These three power indicators provide a comprehensive depiction of the power distribution between family and non-family executives. After distinguishing whether TMT members are family or non-family, we coded the number of positions held by family executives as a percentage of the total number of positions in the TMT (Power1), the compensation of family executives as a percentage of the total compensation of executives2 (Power2), and the number of board seats held by family executives as a percentage of the board members of the TMT (Power3).
We then calculated the structural power distribution of the family firm's TMT using the Herfindahl index. Since the Herfindahl index was originally a measure of concentration rather than dispersion (Le Breton-Miller & Miller, 2006), the reversed polarities (1-Herfindahl index) is thus taken. The share of structural power of family and non-family executives is first calculated and then, based on HHI=1-ΣPi2, the distribution of structural power in the TMT of family firms is calculated, ranging from 0 to 1. When the value is close to 0, the structural power in the TMT is more concentrated; when the value is close to 1, the structural power between family and non-family executive members is more evenly distributed.
Moderating variables. In this study, two moderating variables were considered:
Board independence (BDratio): Candidates for independent directors may not be related to the top ten shareholders of the listed company or may not be employees of the listed company and its subsidiaries, nor may they have business or service dealings with the listed company. The number and list of independent directors are disclosed in the annual reports of publicly traded companies, and the ratio of independent directors to the total number of directors on the board was used to determine the board's independence (Jansen et al., 2006).
Environmental dynamics (ED): Based on previous studies, we measure environmental dynamics through the coefficient of variation in sales revenue. We regress industry sales revenue on the time variable and then divide the standard deviation of the regression coefficient by the industry mean (Boyd & Runkle, 1993). The smaller the calculated value, the more stable the environment; conversely, the larger the value, the more volatile the industry environment.
Control variables. Based on previous research regarding the innovation performance of family firms, the control variables in this paper include four aspects: firstly, the characteristics of the TMT, including the size, gender, average age and level of education of members, controlling for the above variables to isolate the influence of the demographic characteristics of the TMT; secondly, firm-level variables, including firm characteristics (age, size), operating conditions (total assets, net profit margin, balance sheet, slack), are used to isolate the possible influence of related factors on the acquisition or supply of R&D resources; thirdly, the influence of board-level variables, such as the size of the board, whether the chairman and CEO have duality; and fourthly, controlling for the potential influence of family-level related variables (family voting rights, whether the CEO is a family member). Table 1 displays the operational definitions and coding of variables.
Operational definitions and coding of variables.
Table 2 displays the means, standard deviations and correlation coefficients for the variables listed above. As shown in the table, the standard deviation of the innovation performance indicators of Chinese listed family firms is small during the period 2009–2018. The mean value of the structural power distribution of TMT is 0.273, indicating an uneven distribution of structural power between family and non-family executives in family firms, and a large standard deviation, indicating a considerable inter-sample variance. The mean value of the moderating variable, the proportion of independent directors, is 0.373, with a small standard deviation and little variation between samples. This satisfies the requirement of the CSRC that at least one-third of the board consists of independent directors. With a mean value of 0.311, the overall dynamic nature of the environment faced by the sample companies is high, indicating that the environment changes rapidly and is highly uncertain. The mean value of the asset-liability ratio among the control variables is 0.372; the mean value of family voting rights is 56%; the proportion of duality is close to 0.4; and the proportion of CEOs who are family members is 0.2, indicating that most of the CEOs of family firms in the sample are served by professional managers.
Mean, standard deviations and correlations.
| M | SD | 1 | 2 | 3 | 4 | 5 | 6 | 7 | 8 | 9 | ||
|---|---|---|---|---|---|---|---|---|---|---|---|---|
| 1 | Patents/assets | 0.716 | 1.095 | 1 | ||||||||
| 2 | Structural powerdistribution | 0.273 | 0.189 | 0.160⁎⁎⁎ | 1 | |||||||
| 3 | Independentdirector ratio | 0.373 | 0.055 | 0.124⁎⁎⁎ | 0.136⁎⁎⁎ | 1 | ||||||
| 4 | Environmentaldynamism | 0.308 | 0.123 | −0.328⁎⁎⁎ | 0.015 | −0.024 | 1 | |||||
| 5 | TMT size | 6.556 | 2.642 | −0.010 | −0.034 | −0.036 | −0.041 | 1 | ||||
| 6 | TMT age | 45.281 | 3.271 | −0.146⁎⁎⁎ | −0.084⁎⁎⁎ | 0.021 | 0.087⁎⁎⁎ | 0.055⁎⁎ | 1 | |||
| 7 | TMT gender | 0.148 | 0.157 | 0.023 | 0.027 | 0.037 | 0.008 | −0.121⁎⁎⁎ | −0.076⁎⁎⁎ | 1 | ||
| 8 | TMT education | 3.028 | 0.454 | 0.056⁎⁎ | 0.006 | 0.054⁎⁎ | −0.013 | −0.013 | −0.165⁎⁎⁎ | −0.074⁎⁎⁎ | 1 | |
| 9 | Firm age | 16.505 | 7.090 | 0.070⁎⁎⁎ | −0.068⁎⁎⁎ | 0.041 | 0.059⁎⁎ | −0.019 | 0.170⁎⁎⁎ | −0.018 | 0.008 | 1 |
| 10 | Firm size | 7.663 | 0.938 | −0.049⁎ | −0.104⁎⁎⁎ | −0.073⁎⁎⁎ | 0.025 | 0.168⁎⁎⁎ | 0.091⁎⁎⁎ | 0.0130 | 0.116⁎⁎⁎ | 0.115⁎⁎⁎ |
| 11 | ROA | 0.790 | 1.634 | 0.008 | −0.047⁎ | 0.081 | 0.023 | −0.081⁎⁎⁎ | −0.013 | 0.056⁎⁎ | 0.019 | −0.020 |
| 12 | Asset liquidity | 0.377 | 0.187 | −0.119⁎⁎⁎ | −0.171⁎⁎⁎ | −0.085⁎⁎⁎ | −0.011 | 0.074⁎⁎⁎ | 0.046⁎ | −0.051⁎ | 0.014 | 0.033 |
| 13 | Slack | 3.413 | 7.788 | 0.020 | 0.064⁎⁎ | 0.043⁎ | 0.004 | −0.007 | −0.012 | 0.057⁎⁎ | 0.003 | −0.020 |
| 14 | R&D intensity | 0.020 | 0.013 | 0.208⁎⁎⁎ | 0.066⁎⁎ | 0.118⁎⁎⁎ | −0.200⁎⁎⁎ | 0.150⁎⁎⁎ | 0.044⁎ | −0.021 | 0.117⁎⁎⁎ | 0.040 |
| 15 | Board size | 8.426 | 1.420 | −0.154⁎⁎⁎ | −0.121⁎⁎⁎ | −0.556⁎⁎⁎ | 0.022 | 0.068⁎⁎⁎ | 0.026 | −0.033 | −0.037 | 0.025 |
| 16 | Duality | 0.380 | 0.485 | 0.165⁎⁎⁎ | 0.388⁎⁎⁎ | 0.279⁎⁎⁎ | −0.089⁎⁎⁎ | 0.039 | 0.048⁎ | 0.029 | 0.045⁎ | 0.009 |
| 17 | vote right | 0.560 | 1.970 | −0.012 | −0.033 | −0.005 | 0.064⁎⁎ | 0.032 | 0.034 | −0.036 | −0.050⁎ | 0.066⁎⁎ |
| 18 | Family CEO | 0.204 | 0.403 | −0.058⁎⁎ | 0.166⁎⁎⁎ | −0.056⁎⁎ | −0.076⁎⁎⁎ | −0.144⁎⁎⁎ | −0.011 | −0.106⁎⁎⁎ | −0.057⁎⁎ | 0.040 |
| M | SD | 10 | 11 | 12 | 13 | 14 | 15 | 16 | 17 | 18 | ||
| 10 | Firm size | 7.663 | 0.938 | 1 | ||||||||
| 11 | ROA | 0.790 | 1.634 | −0.164⁎⁎⁎ | 1 | |||||||
| 12 | Asset liquidity | 0.377 | 0.187 | 0.359⁎⁎⁎ | −0.164⁎⁎⁎ | 1 | ||||||
| 13 | Slack | 3.413 | 7.788 | −0.185⁎⁎⁎ | 0.359⁎⁎⁎ | −0.298⁎⁎⁎ | 1 | |||||
| 14 | R&D intensity | 0.020 | 0.013 | 0.004 | −0.185⁎⁎⁎ | 0.392⁎⁎⁎ | −0.390⁎⁎⁎ | 1 | ||||
| 15 | Board size | 8.426 | 1.420 | 0.236⁎⁎⁎ | 0.004 | −0.077⁎⁎⁎ | −0.168⁎⁎⁎ | −0.033 | 1 | |||
| 16 | Duality | 0.380 | 0.485 | −0.120⁎⁎⁎ | 0.236⁎⁎⁎ | −0.050⁎ | 0.091⁎⁎⁎ | −0.067⁎⁎ | −0.115⁎⁎⁎ | 1 | ||
| 17 | vote right | 0.560 | 1.970 | 0.024 | −0.120⁎⁎⁎ | −0.038 | −0.115⁎⁎⁎ | 0.016 | 0.128⁎⁎⁎ | −0.273⁎⁎⁎ | 1 | |
| 18 | Family CEO | 0.204 | 0.403 | 0.011 | 0.023 | −0.007 | −0.038 | 0.001 | −0.014 | 0.017 | 0.037 | 1 |
N = 2379.
The structural power distribution and innovation performance of the firm were significantly positively correlated (correlation coefficient of 0.16, p<0.001) in terms of the correlation between the main variables. The more equal the structural power distribution, the higher the degree of innovation performance. In terms of control variables, board independence is significantly and positively related to innovation performance (correlation coefficient of 0.124, p<0.001) and environmental dynamics is significantly and negatively related to innovation performance (correlation coefficient of −0.328, p<0.001). Although there are significant correlations between some explanatory variables, the maximum correlation coefficient does not exceed 0.7, indicating that multicollinearity is not a significant issue.
Hypotheses testingThe aforementioned hypotheses were tested with STATA 14.0. To ensure the consistency and validity of the results, the following treatments were applied to the data: (1) The main continuous variables were winsorized within 5% to avoid the effects of outliers; (2) The variance inflation factor (VIF) diagnostics were used to diagnose the independent and control variables in the model, and the VIF values were less than 2, indicating that multicollinearity was not severe; (3) For the test of the moderating variables, the interaction term variables of the moderating and independent variables were centered; (4) The Hausman Test was conducted, and the results supported the random effects model estimation in this paper.
Table 3 presents the relationship between structural power distribution and innovation performance. Model 1 is the fundamental model with all control and moderating variables included; Model 2 is the test model with independent variables included. The results of Model 2 show that structural power distribution equality is significantly and positively related to innovation performance (β=0.082, p<0.001), and the results are robust with the subsequent addition of moderating variables as shown in Models 3, 4 and 5, indicating that as structural power distribution equality increases, innovation performance improves. Thus, hypothesis 1 is supported.
The relationship between structural power distribution and innovation performance.
| Patents/assets | |||||
|---|---|---|---|---|---|
| Variables | (M1) | (M2) | (M3) | (M4) | (M5) |
| Controls | |||||
| TMT size | −0.002 | 0.000 | 0.001 | −0.003 | −0.002 |
| (0.014) | (0.016) | (0.017) | (0.012) | (0.014) | |
| TMT age | −0.045⁎⁎⁎ | −0.045⁎⁎⁎ | −0.044⁎⁎⁎ | −0.041⁎⁎⁎ | −0.040⁎⁎⁎ |
| (0.011) | (0.011) | (0.014) | (0.016) | (0.015) | |
| TMT gender | 0.426 | 0.443* | 0.449* | 0.434 | 0.441* |
| (0.226) | (0.225) | (0.214) | (0.224) | (0.227) | |
| TMT education | −0.031 | −0.022 | −0.022 | −0.047 | −0.047 |
| (0.063) | (0.078) | (0.078) | (0.052) | (0.052) | |
| Firm age | 0.024⁎⁎ | 0.025⁎⁎⁎ | 0.025⁎⁎⁎ | 0.026⁎⁎⁎ | 0.027⁎⁎⁎ |
| (0.006) | (0.008) | (0.008) | (0.009) | (0.004) | |
| Firm size | −0.009 | −0.007 | −0.008 | 0.007 | 0.005 |
| (0.023) | (0.049) | (0.051) | (0.146) | (0.035) | |
| ROA | 0.001 | 0.004 | 0.007 | 0.001 | 0.004 |
| (0.017) | (0.023) | (0.046) | (0.017) | (0.023) | |
| Asset liquidity | −0.059 | −0.033 | −0.040 | −0.072 | −0.077 |
| (0.215) | (0.214) | (0.213) | (0.243) | (0.256) | |
| Slack | 0.000 | 0.000 | −0.001 | −0.001 | −0.001 |
| (0.004) | (0.004) | (0.006) | (0.006) | (0.006) | |
| R&D intensity | 15.347⁎⁎⁎ | 15.435⁎⁎⁎ | 15.414⁎⁎⁎ | 13.485⁎⁎⁎ | 13.485⁎⁎⁎ |
| (2.691) | (2.675) | (2.669) | (2.720) | (2.714) | |
| Board size | −0.030 | −0.027 | −0.033 | −0.028 | −0.034 |
| (0.021) | (0.031) | (0.037) | (0.063) | (0.047) | |
| Duality | 0.214⁎⁎ | 0.109 | 0.093 | 0.096 | 0.080 |
| (0.074) | (0.079) | (0.082) | (0.098) | (0.086) | |
| Vote right | 0.002 | 0.002 | 0.001 | 0.003 | 0.002 |
| (0.012) | (0.012) | (0.023) | (0.010) | (0.012) | |
| Family CEO | 0.029 | −0.024 | −0.021 | −0.016 | −0.013 |
| (0.104) | (0.157) | (0.142) | (0.136) | (0.168) | |
| Year dummy | Included | Included | Included | Included | Included |
| Industry dummy | Included | Included | Included | Included | Included |
| Independent director ratio | 0.243 | 0.305 | 0.060 | 0.377 | 0.137 |
| (0.737) | (0.733) | (0.736) | (0.731) | (0.735) | |
| Environmental dynamism | 0.762* | 1.083⁎⁎⁎ | 1.080⁎⁎⁎ | 2.055⁎⁎⁎ | 2.038⁎⁎⁎ |
| (0.307) | (0.318) | (0.317) | (0.414) | (0.413) | |
| Structural power Distribution | 0.082⁎⁎⁎(0.224) | 0.084⁎⁎⁎(0.223) | 0.088⁎⁎⁎(0.234) | 0.086⁎⁎⁎(0.027) | |
| Structural power distribution * Independent director ratio | 0.877⁎⁎(3.089) | 0.857⁎⁎(3.080) | |||
| Structural power distribution * Environmental dynamism | 0.661⁎⁎⁎(1.801) | 0.659⁎⁎⁎(0.224) | |||
| Constant | 2.512⁎⁎(0.807) | 2.146⁎⁎(0.808) | 2.234⁎⁎(0.807) | 1.858*(0.812) | 1.948*(0.810) |
| Log likelihood | 870.105 | 876.673 | 883.754 | 882.734 | 889.921 |
| Wald χ2 | 163.541⁎⁎⁎ | 152.412⁎⁎⁎ | 276.942⁎⁎⁎ | 235.421⁎⁎⁎ | 119.620⁎⁎⁎ |
| left-censored observations | 124 | 124 | 124 | 124 | 124 |
| N | 2379 | 2379 | 2379 | 2379 | 2379 |
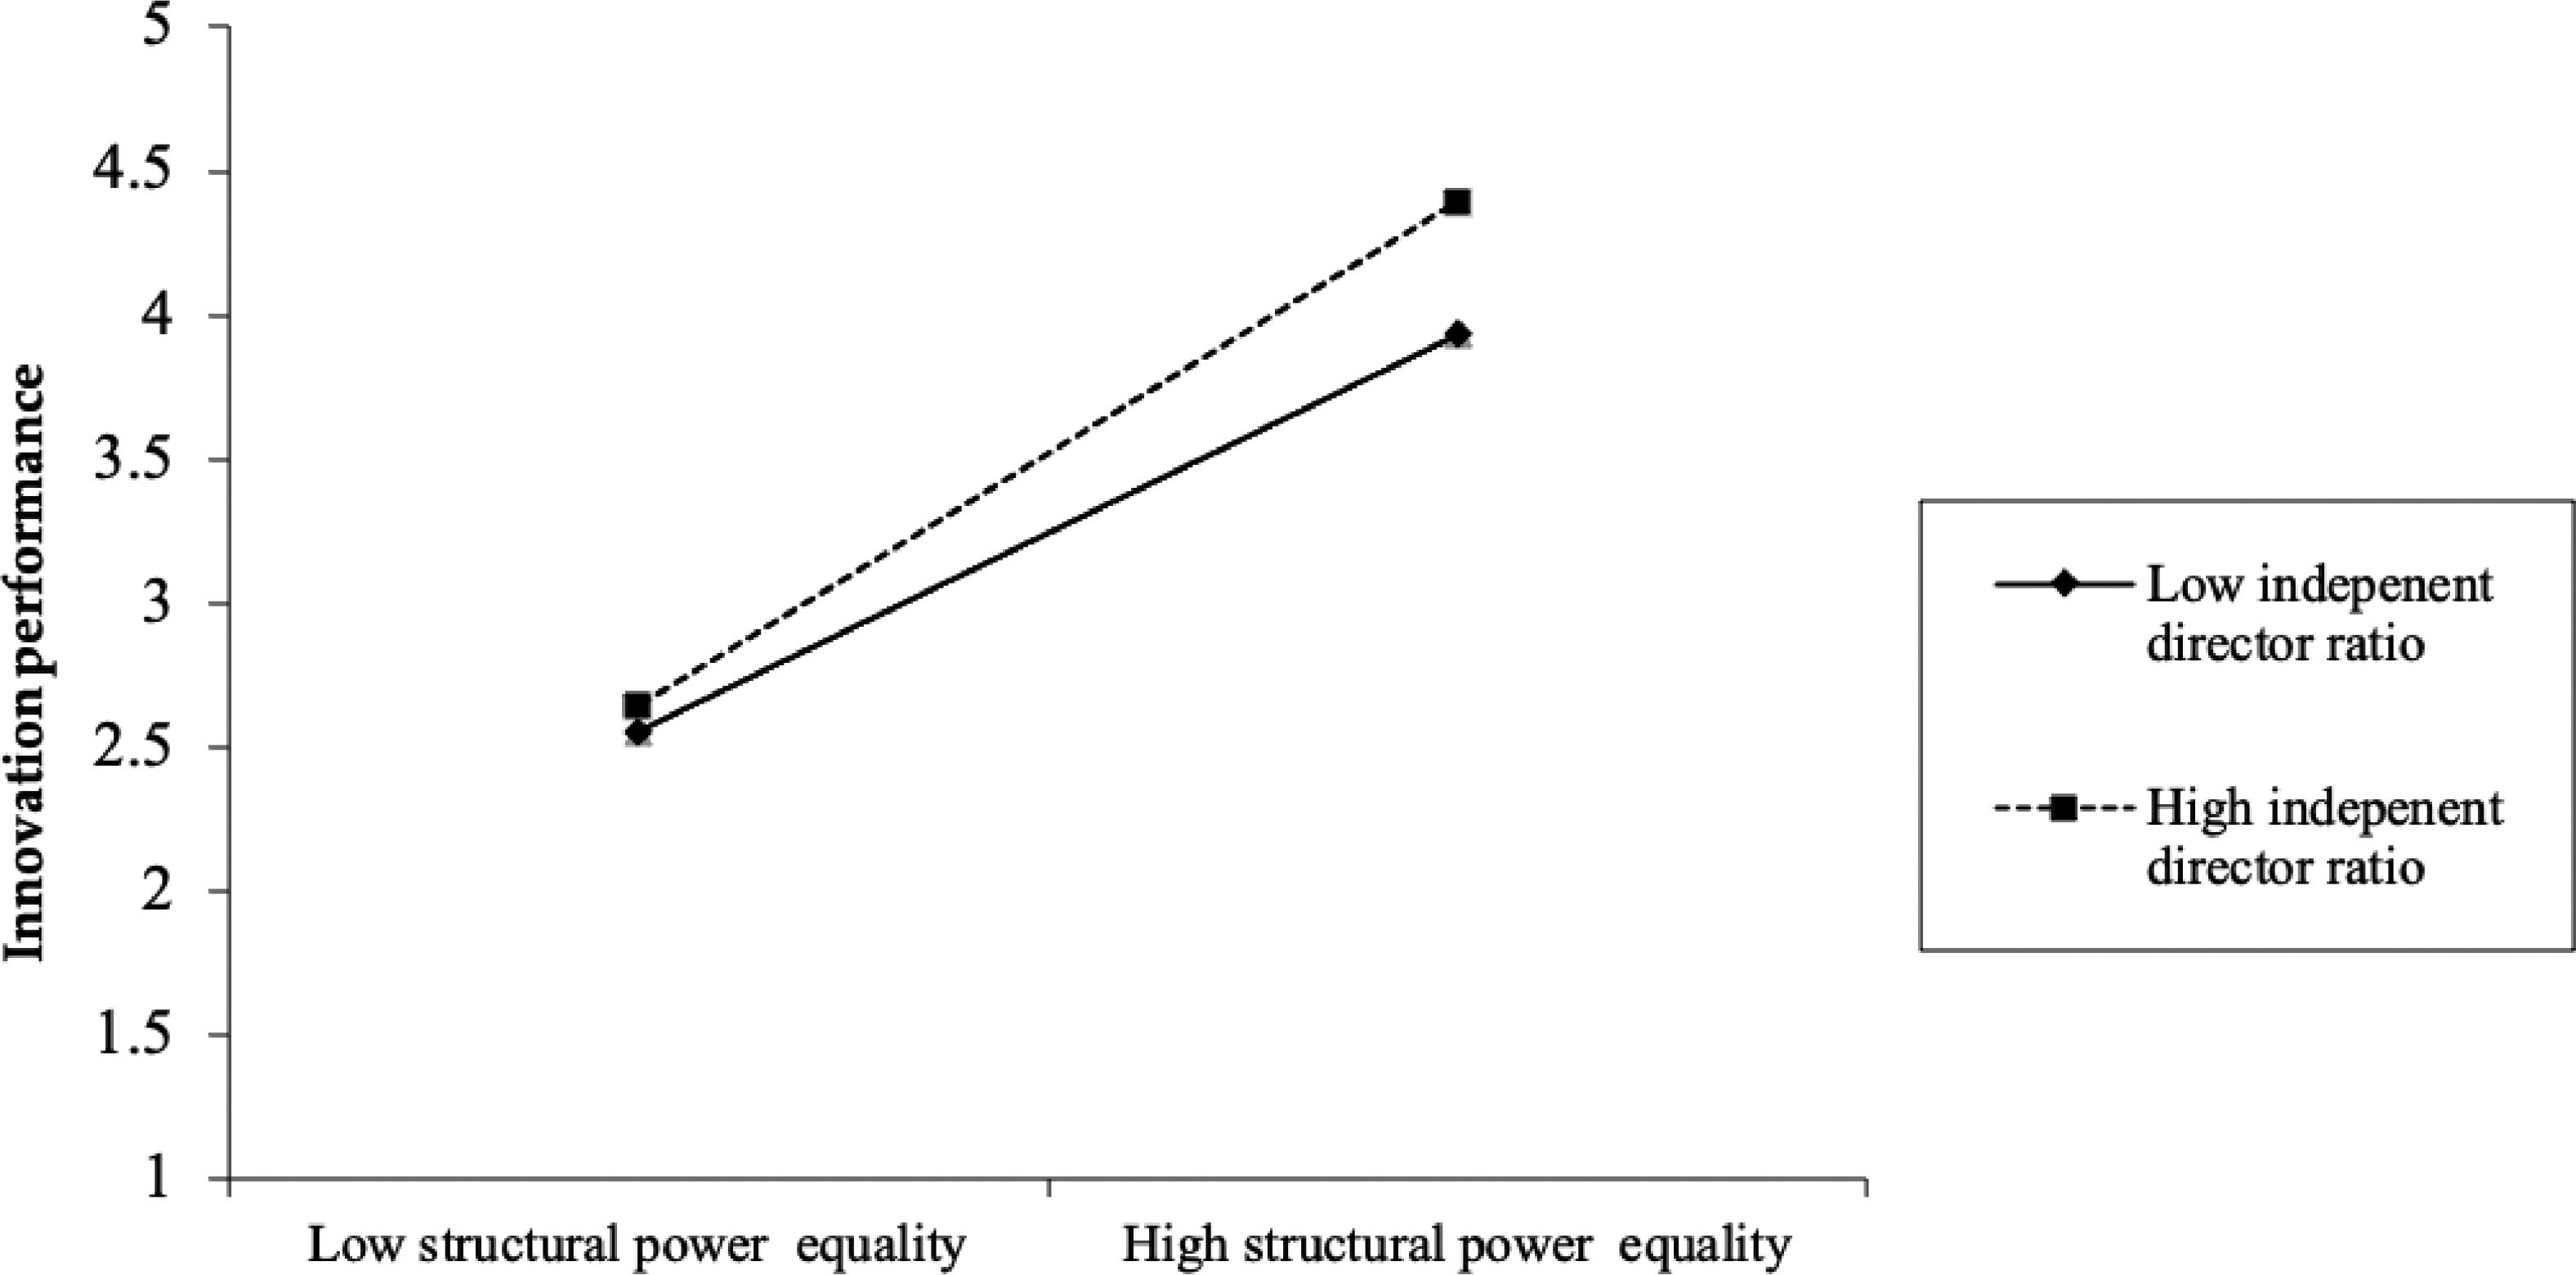
Model 3 tests the moderating effect of board independence, and the results show that the interaction term between structural power distribution and board independence is significantly and positively related to innovation performance (β=0.877, p<0.01), and the result remains robust in the full model 5, indicating that hypothesis 2 is supported.
Model 4 tests the moderating role of environmental dynamics, and the interaction term between structural power equality and environmental dynamics is significantly and positively related to firm innovation performance (β=0.661, p<0.001), and this result remains robust in the full model 5, indicating that hypothesis 3 is supported.
We analyze the moderating effect of board independence and environmental dynamics further by plotting the moderating effect of board independence and environmental dynamics (Figs. 2 and 3). As depicted in Fig. 2, the positive effect of structural equal power distribution of the TMT on innovation performance is more pronounced when the board of directors is more independent in family firms. As shown in Fig. 3, the positive effect of structural power equality distribution of the TMT on innovation performance is amplified in the presence of stronger environmental dynamics.
Robustness testRobustness test regarding endogeneity

Since the appointment of executives in family firms may be influenced by characteristics of the controlling family as well as other factors, it may lead to endogeneity problems, which in turn affect the accuracy of the findings of this paper. We employ instrumental variables to address this issue. Firstly, we choose the number of children of the controlling family as an instrumental variable for the structural power distribution of the TMT in family firms. The state of structural power distribution in the TMT of family firms will be affected by the number of children. Two conditions need to be satisfied to select an effective instrumental variable: first is relevance; the greater the number of children of the controlling family, the greater the likelihood of selecting the next generation with the willingness and ability to enter the TMT; and the greater the proportion of family executives, the greater the likelihood of influencing the power distribution within the TMT. The number of children of the controlling family is related to the structural power distribution of the TMT; second is exogeneity; there is as yet no evidence that the number of children will affect firm innovation performance. The instrumental variable, number of children of the controlling family, is not related to the innovation performance of family firms and can only affect the innovation performance of firms via the structural power distribution of the TMT.
Endogeneity is then examined using a Heckman two-stage model. Firstly, at the first stage, the model is constructed using factors affecting the appointment of the TMT in family firms and the inverse Mills ratio (IMR) is calculated. The structural power distribution of the TMT is set as a dummy variable (Power-dummy) by median; it takes the value of 1 if it is greater than the median, otherwise it takes the value of 0. Then, based on previous studies, we select the number of children (Kid-Num) as an instrumental variable, the family ownership (FO), whether the CEO is a family member (Family CEO), the degree of marketization (Market), and whether the prior performance level of the firm reaches the industry average (Perf-ind) as the main control variables. We then conduct a Probit regression model of the structural power distribution of TMT by median to obtain the inverse Mills ratio (IMR). At the second stage, the IMR is regressed as a control variable into the previous main effects model. The Heckman two-stage test regression results are presented in Table 4. At the first stage, the Model1 results indicate that the number of children (Kid-Num) is significantly negatively related to the structural power distribution of the TMT (Power-dummy) with a significantly negative regression coefficient, indicating that it is a valid instrumental variable. At the second stage, after adding IMR from the first stage as an additional control variable, Model 2 indicates that the structural power distribution is significantly related to innovation performance and is significantly positively correlated (β=0.062, p<0.001), indicating that, as structural power equality increases, firm innovation performance increases, again validating the main hypothesis.
Using an alternative measure for the independent variableThis section examines the robustness of the results by substituting the measure of the independent variable, which is the distribution of structural power of the TMT in family firms. The rational ratio of structural power distribution between family and non-family executives is 0.5, and the degree of deviation from 0.5 can reflect the structural power distribution by comparing the measure. We refer to Leik (1966), Blair and Lacy (2000), Trezzini (2011), and Patel and Cooper (2014), adopting the calculation method with the following formula:

PDcatrepresents the degree of dispersion of structural power, with a greater value indicating more equal structural power, and Dord is the observed ordinal variability for n power categories.pi represents the degree of power distribution in each of the three structural power sub-dimensions, i.e., the number of titles held by family executives as a percentage of the total number of titles in the TMT; the ratio of family executives' compensation to total TMTs’ compensation; and the number of board seats held by family executives as a percentage of the board members of the TMT, with values ranging from 0 to 1.Dordmax is the maximum value of the theoretical ordinal variability, and n is the number of categories of power. For instance, if the proportion of the number of titles held by family executives is 0.4, the proportion of compensation of family executive members is 0.6, and family executives who serve on the board is 0.5, the resulting measure of structural power distribution is:

Higher values of the results obtained indicate a smaller degree of disparity in the structural power distribution between family and non-family executives, indicating that structural power is more evenly distributed between the two parties.
Table 5 presents the robustness test results. The statistics depicting the hypothesized results in Table 5 are consistent with those in Table 3. In Model 2, the structural power distribution of the TMT still has a significant positive effect on innovation performance (β=0.5489, p<0.001); in Model 3, the interaction term of structural power distribution and board independence has an increased significance with innovation performance ((β=0.4347, p<0.001); and Model 4 tests the interaction between structural power distribution and environment dynamics, and the statistical results are consistent with those in Table 3. The above results confirm the robustness of all hypotheses.
Robustness test.
| Patents/assets | |||||
|---|---|---|---|---|---|
| Variables | (M1) | (M2) | (M3) | (M4) | (M5) |
| Controls | |||||
| TMT size | −0.005 | −0.003 | −0.002 | −0.005 | −0.004 |
| (0.012) | (0.017) | (0.017) | (0.019) | (0.014) | |
| TMT age | −0.042⁎⁎ | −0.043⁎⁎ | −0.043⁎⁎ | −0.039⁎⁎ | −0.038⁎⁎ |
| (0.015) | (0.014) | (0.014) | (0.017) | (0.018) | |
| TMT gender | −0.057 | −0.047 | −0.081 | −0.054 | −0.086 |
| (0.290) | (0.287) | (0.286) | (0.287) | (0.286) | |
| TMT education | 0.049 | 0.060 | 0.044 | 0.035 | 0.021 |
| (0.099) | (0.098) | (0.098) | (0.098) | (0.098) | |
| Firm age | 0.024⁎⁎ | 0.026⁎⁎ | 0.027⁎⁎ | 0.029⁎⁎ | 0.030⁎⁎⁎ |
| (0.009) | (0.009) | (0.009) | (0.009) | (0.009) | |
| Firm size | 0.031 | 0.035 | 0.035 | 0.048 | 0.048 |
| (0.064) | (0.063) | (0.063) | (0.064) | (0.063) | |
| ROA | 0.037 | 0.044* | 0.052* | 0.042* | 0.049* |
| (0.020) | (0.020) | (0.020) | (0.020) | (0.020) | |
| Asset liquidity | −0.125 | −0.060 | −0.131 | −0.038 | −0.107 |
| (0.286) | (0.284) | (0.284) | (0.284) | (0.283) | |
| Slack | −0.001 | −0.002 | −0.003 | −0.002 | −0.003 |
| (0.005) | (0.005) | (0.005) | (0.005) | (0.005) | |
| R&D intensity | 9.871⁎⁎ | 10.150⁎⁎ | 10.168⁎⁎ | 7.487* | 7.559* |
| (3.641) | (3.614) | (3.598) | (3.685) | (3.670) | |
| Board size | −0.066 | −0.068 | −0.078* | −0.073 | −0.083* |
| (0.040) | (0.040) | (0.039) | (0.040) | (0.039) | |
| Duality | 0.230* | 0.102 | 0.077 | 0.087 | 0.063 |
| (0.094) | (0.100) | (0.100) | (0.100) | (0.099) | |
| Vote right | 0.007 | 0.008 | 0.006 | 0.010 | 0.009 |
| (0.023) | (0.023) | (0.023) | (0.023) | (0.022) | |
| Family CEO | −0.100 | −0.172 | −0.178 | −0.160 | −0.166 |
| (0.136) | (0.136) | (0.135) | (0.136) | (0.135) | |
| Year dummy | Included | Included | Included | Included | Included |
| Industry dummy | Included | Included | Included | Included | Included |
| Independent director ratio | −0.999 | −1.048 | −1.735 | −0.945 | −1.618 |
| (0.944) | (0.938) | (0.953) | (0.935) | (0.951) | |
| Environmental dynamism | 0.670(0.414) | 1.121⁎⁎(0.429) | 1.097*(0.427) | 2.137⁎⁎⁎(0.527) | 2.085⁎⁎⁎(0.525) |
| Structural power distribution | 0.549⁎⁎⁎(0.151) | 0.579⁎⁎⁎(0.167) | 0.545⁎⁎⁎(0.142) | 0.574⁎⁎⁎(0.158) | |
| Structural power distribution * Independent director ratio | 0.435⁎⁎(2.230) | 0.411⁎⁎(2.221) | |||
| Structural power distribution * Environmental dynamism | 0.361⁎⁎(1.801) | 0.359⁎⁎(0.224) | |||
| Constant | 2.747⁎⁎(1.053) | 2.377*(1.049) | 2.730⁎⁎(1.048) | 2.024(1.053) | 2.379*(1.052) |
| Log likelihood | 770.105 | 776.655 | 783.670 | 782.145 | 788.923 |
| Wald χ2 | 177.541⁎⁎⁎ | 192.412⁎⁎⁎ | 206.942⁎⁎⁎ | 205.421⁎⁎⁎ | 219.620⁎⁎⁎ |
| left-censored observations | 124 | 124 | 124 | 124 | 124 |
| N | 2379 | 2379 | 2379 | 2379 | 2379 |
To ensure the reliability of the analysis results, we conducted additional robustness tests focusing on the following aspects: (1) Referring to previous research, the operational definition of a family business, i.e., controlling the shareholding of family firms, is adjusted from 15% to 10%, and the data results show that the hypothesis is still supported. (2) By replacing the measurement of the dependent variable with the number of patents granted/total assets as a measure of technological innovation performance, the data demonstrate consistent test results, further validating the robustness of the findings. Due to space constraints, the above test results are not reported here.
Discussion and conclusionThe power distribution of TMTs influences the attitudes and behaviors, cognitions and emotions, and behavioral integration of TMT members, leading to differential innovation output. The involvement of non-family executives provides diverse expertise and information for innovation, and motivating non-family executives of family firms to actively contribute their human and social capital to innovation is the key to enhancing innovation in family firms. However, the factors that spur interaction within family firm TMTs has received less attention than other aspects of TMT dynamics. We propose that a more equal distribution of structural power between family and non-family executives can facilitate behavioral integration within the TMT.
The implications of these findings extend to both family business and TMT research.
In previous debates about whether family firms hinder or promote innovation (Block, 2012; Gomez‐Mejia et al., 2014), scholars have analyzed the impact of family influence on firm innovation performance primarily from the perspective of internal family attributes. Thus, the "non-family" factors that influence the formulation and execution of innovation strategies is under-researched in comparison to its importance (Klein & Bell, 2007; Leach, 2002; Neffe et al., 2020). Yet, the visions and goals of non-family executives differ from those of family executives, and dominant and highly influential family executives can limit non-family executive involvement in strategic planning and decision-making. Balancing structural power could enhance behavioral integration in the upper echelons of family firms, facilitate participation of non-family executives and enhance their willingness and ability to share diversified information and resources for innovation strategies, thereby increasing cooperation and joint decision-making. This balance allows non-family executives to participate in innovation decision-making and implementation to promote interaction and cohesion within the TMT, stimulate team members' willingness to share risks, and balance the influence of both parties to achieve these goals (Tost et al., 2013). Family firms can thus balance economic and non-economic objectives in their strategies (Fiol et al., 2001) to achieve innovation performance. Patel and Cooper (2014) conceptualized and examined equality in structural power between family and non-family coalitions rather than power dispersion across all TMT members, demonstrating its implications for family firms. Building on their findings, we assert that a balance in structural power between family and non-family executives in TMTs is a significant determinant of innovation performance and contributes to a deeper understanding of the antecedents of innovation performance in family firms.
"Bifurcation bias", characteristic of family business governance, is a reflection of the limited rationality of family firms (Kano & Verbeke, 2018) and is a cause of heterogeneity in a family business (Verbeke et al., 2020). Family firms recruit non-family members to meet the requirements of professional and standardized management and rely on the resources they provide, such as information and knowledge, technology and social capital. When family firms treat non-family members differently, they experience a sense of unfairness that reduces their job satisfaction and organizational commitment and their investment and contribution in human capital and social resources. Moreover, bifurcation bias can result in intense relationship conflicts within the organization and damage the organizational climate and cohesion that is not conducive to the sustainable and healthy development of the family business (Madison et al., 2017; Roxas & Chadee, 2011). However, most existing studies remain theoretical, unsupported by empirical evidence. Essentially, the structural power distribution of the TMT reflects the degree of "bifurcation bias" in the power distribution of family firms. Our findings indicate that balanced structural power distribution that encourages participation of non-family executives in the strategy process and facilitates behavioral integration between family and non-family executives can contribute to innovation performance. This provides theoretical insights into ways to manage the organization, coordinate and balance the relationship between the two parties and stimulate use of talent resources to the full, thereby indirectly enhancing and extending empirical study of the "bifurcation bias" outcome variable (Tsui, 2007).
The influence of the TMT composition on organizational output has been a primary topic of discussion in upper echelons of theoretical research (Hambrick, 2007). While prior studies have shown that the TMT organizational configuration that family firms adopt leads to less exploitation of opportuities (De Massis & Rondi, 2020), the mechanisms through which behavioral integration within the TMT relates to innovation have been largely overlooked. Past research has identified elements of TMT diversity, i.e., gender, generation and goals, as drivers of creativity in the upper echelons of family firms (Diaz-Moriana et al., 2020; Röd, 2019); however, the behavioral integration of the TMT was only theoretically inferred as a mechanism connecting empirically captured TMT characteristics and innovation outcomes (Kraiczy et al., 2015). Our evidence extends the current knowledge of TMT dynamics in family firms. We put TMT power distribution under the spotlight by scrutinizing the influence of interaction of TMT structure and behavior on family firm innovation empirically, demonstrating that a rational power distribution among executive teams is conducive to improving interaction within the core TMT group.
We offer practical guidance on the configuration and power distribution of the governance structure of family firms. A balanced distribution of structural power promotes the active participation of non-family executives in formulating and implementating innovation strategies to enhance interaction in the TMTs of family firms. The interaction between family and non-family executives is conducive to overcoming the limitations of resources within the family and integrating the knowledge, experience and skills of both groups more effectively. These findings are a practical guide on how to motivate non-family executives in family firms to participate more actively in innovation decisions, contribute their human and social capital to the implementation of innovation strategies, and improve the innovation efficiency of family firms.
Limitations and directions for future researchThere are some limitations in this paper. Firstly, it lacks an examination of the level of affinity between family and non-family members at the emotional level. Under equal structural power distribution, cohesion and coordination are key to improved cooperation between family and non-family executives. By using questionnaires or case studies, future research can explore the issue of "trust" and "closeness" between family executives and non-family in the decision-making process in depth. Secondly, it lacks an examination of the TMT interaction process. Due to restrictions on data collection, the process through which family and non-family executives influence the innovation strategy needs to be further investigated. Future qualitative research can examine the behavior of the family executive team in goal-setting, negotiation and cooperation in the process of making and executing particular strategic decisions in detail. Moreover, patent data are employed as a measure of technological innovation output. It must be acknowledged that patent data have certain limitations, and we encourage future research to employ other indicators, such as new products as a percentage of total sales and number of innovations, to comprehensively measure innovation performance. Lastly, structural power is one type of power in family firms, and future research can continue to focus on other types of power, such as expert and prestige power, to further examine distribution patterns of power in family firms.
The Shanghai and Shenzhen Stock Exchanges provide for special treatment of trading in the stocks of listed companies with unusual financial or other conditions. ST means a company operating at a loss for two consecutive years, special treatment; *ST means a company operating at a loss for three consecutive years, delisting warning. SST means a company operating at a loss for two consecutive years, special treatment, and has not completed the share reform.
Family executive compensation consists of two components: salary compensation and shares incentive compensation, where shares incentive compensation is calculated by multiplying the number of shares held by the family executive at year end by the value of the shares at year end, divided by 100,000.