


Edited by: Abbas Mardari
More infoStarting from the theoretical mechanism of the impact of financial agglomeration on regional green innovation efficiency, and using panel data from 30 provinces in China from 2009 to 2017, this study calculates a financial agglomeration index and green innovation efficiency applying principal component analysis and the slacks-based measure (SBM) of super-efficiency. The study then constructs static and dynamic spatial Durbin models using two different spatial weight matrices to empirically test the spatial spillover effect of financial agglomeration on regional green innovation efficiency. The results reveal a significant positive spatial correlation between China's inter-provincial green innovation efficiency and financial agglomeration. Both static and dynamic models demonstrate that financial agglomeration has a significant spatial spillover effect on the green innovation efficiency of adjacent provinces, but the static model overestimates the impact of spatial spillover. In addition, human capital level, technology market activity, and environmental regulation all have significant positive impacts on the green innovation efficiency of provinces and adjacent provinces.
The contemporary era has given China's economy new growth momentum. The traditional extensive economic growth model of the past, driven by resources and factors, is no longer pertinent, and innovation-driven development is an important support and guarantee for China's future economic development (Wang & Tan, 2021). Innovation-driven development means that economic growth will no longer rely solely on the low-cost advantage of resources and environmental exploitation, but on technological changes to advance continued intensive economic growth (Hao, Gai & Yan, 2021; Fang, Razzaq & Mohsin, 2022). During the current Fourteenth Five-Year Plan period, China's economic and social development will continue to focus on green development and innovation. Green innovation is a significant concept, and green innovation efficiency is a vital index for measuring regional competitiveness and promoting healthy regional development (Tariq, Badir & Tariq, 2017; Zeng, Li & Huang, 2021). Meanwhile, the financial industry has an important role in promoting the green economy and technological innovation due to its resource allocation function, low resource consumption, and low emissions (Xie & Wang, 2019). China has been emphasizing and insisting on deepening financial system reform, establishing financial agglomeration areas in many regions, and creating conditions and environments for the agglomeration and development of financial resources to leverage the ability of financial services to support the real economy and contribute to high-quality economic development (Ye, Sun & Chen, 2018). As the efficiency of the financial system is primarily realized through the agglomeration of financial resources in specific regions (Qu, Shao & Shi, 2020), it is of practical significance to explore the impact of financial agglomeration on regional green innovation efficiency (Tian, Wang & Liu, 2021; Zheng, Chen & Wang, 2020).
This study, first, divides the spatial spillover effect into two parts, intra-regional spillover and extra-regional spillover, and explores the theoretical mechanism of financial agglomeration affecting the efficiency of regional green innovation. Second, the study calculates a financial agglomeration index and green innovation efficiency applying the principal component analysis and the slacks-based measure (SBM) super-efficiency model. Finally, we construct static and dynamic spatial Durbin models (SDMs) employing two different spatial weight matrices to empirically test the spatial spillover effect of financial agglomeration on regional green innovation efficiency. The results reveal a significant positive spatial correlation between inter-provincial green innovation efficiency and financial agglomeration in China. The static and dynamic SDM models demonstrate that financial agglomeration has a significant spatial spillover effect on green innovation efficiency, providing valuable insights to guide government allocation of financial resources. In addition, the level of human capital, technological market activity, and environmental regulation have significant positive impacts on the efficiency of green innovation, providing further focus for the development of relevant policies.
The remainder of this paper is structured as follows. Section 2 summarizes the relevant research achievements in the academic community, and introduces the content of this article by analyzing the characteristics and shortcomings of existing research. The third section explores the theoretical mechanism of the impact of financial agglomeration on the efficiency of regional green innovation, dividing the spatial spillover effect into intra- and extra-regional spillover. Section 4 presents the overall research design, including model setting and variable selection. The fifth section details the results of the empirical research. Section 6 presents the conclusion, future research suggestions, and policy implications.
Literature reviewPrevious research has explored the internal and external factors that influence the efficiency of green innovation. External factors primarily include environmental regulation (Cao & Yu, 2015; Lian, Xu & Zhu, 2022), foreign direct investment (FDI) (Zhou, Ang & Poh, 2008), market demand (Olson, 2013), and fiscal decentralization (Chen & Li, 2020). Internal factors include enterprises’ profit (Bansal & Roth, 2000), size (Etzion, 2007), and research and development (R&D) investment (Wang & Zhang, 2021). However, minimal research has directly examined the effect of financial agglomeration on green innovation efficiency or explored the relationship between financial agglomeration and the two independent considerations of green economic development and technological innovation.
Regarding green economic development, Ma & Stern (2008) found that finance could support enterprises’ technological innovation to advance technological development while reducing energy consumption and pollution and promote the growth of green total factor productivity (GTFP). Cole, Elliott & Shimamoto (2005) asserted that the profit-seeking nature of capital will cause financial resources to flow to high-polluting enterprises, generating energy waste and aggravating environmental pollution, which inhibits the growth of GTFP. Ge, Huang & Xu (2018) revealed a negative correlation between financial development and GTFP based on cross-border panel data from the Belt and Road Initiative.
As a low-consumption and low-emissions industry, finance can advance the development of a green economy and improve the efficiency of regional financial resource allocation and technological innovation (Benfratello, Schiantarelli & Sembenelli, 2008). Guariglia & Liu (2014) found that increased venture capital in a financial agglomeration area could promote technological innovation. Wen, Zhao & Zheng (2021) contended that financial agglomeration promotes technological innovation in a region and will rise with increased financial agglomeration. However, the spatial spillover effect of technological innovation exhibits characteristics of an inverted U shape, wherein moderate financial agglomeration will promote technological innovation in surrounding areas, while excessive financial agglomeration will have an inhibitory effect (Wen, Zhao & Zheng, 2021).
In summary, previous research has the following two characteristics. First, as policies prioritize R&D quality, innovation output, and environmental protection, the input–output factors of green economic efficiency continuously expand. Considering previously applied measures of efficiency, inputs such as R&D and energy are introduced, outputs are divided into undesired (pollution) and desired (innovation) forms. The measurement methods have constantly improved with the evolution of mathematics and statistics. Second, the scope of research on factors influencing green innovation efficiency is continuously expanding to include financial agglomeration and external factors such as environmental regulation and FDI and internal factors related to enterprises’ activities.
Examining the relevant literature, we identified the following deficiencies. First, minimal research has examined the relationship between financial agglomeration and green innovation efficiency, and a lack of consensus remains regarding the direction in which financial agglomeration affects technological innovation and green economic development. Second, existing studies have used inconsistent methods to measure financial agglomeration, and limited literature is available from which to construct a comprehensive indicator system to measure financial agglomeration; the range of indicators must be expanded. Third, most studies consider only spatial factors and construct static spatial econometric models to analyze the impact of financial agglomeration on green innovation efficiency. Minimal research has considered both spatial and temporal factors to build dynamic spatial panel models.
Considering the analysis above, we examine the theoretical mechanism of the impact of financial agglomeration on green innovation efficiency, constructing and testing static and dynamic spatial panel models.
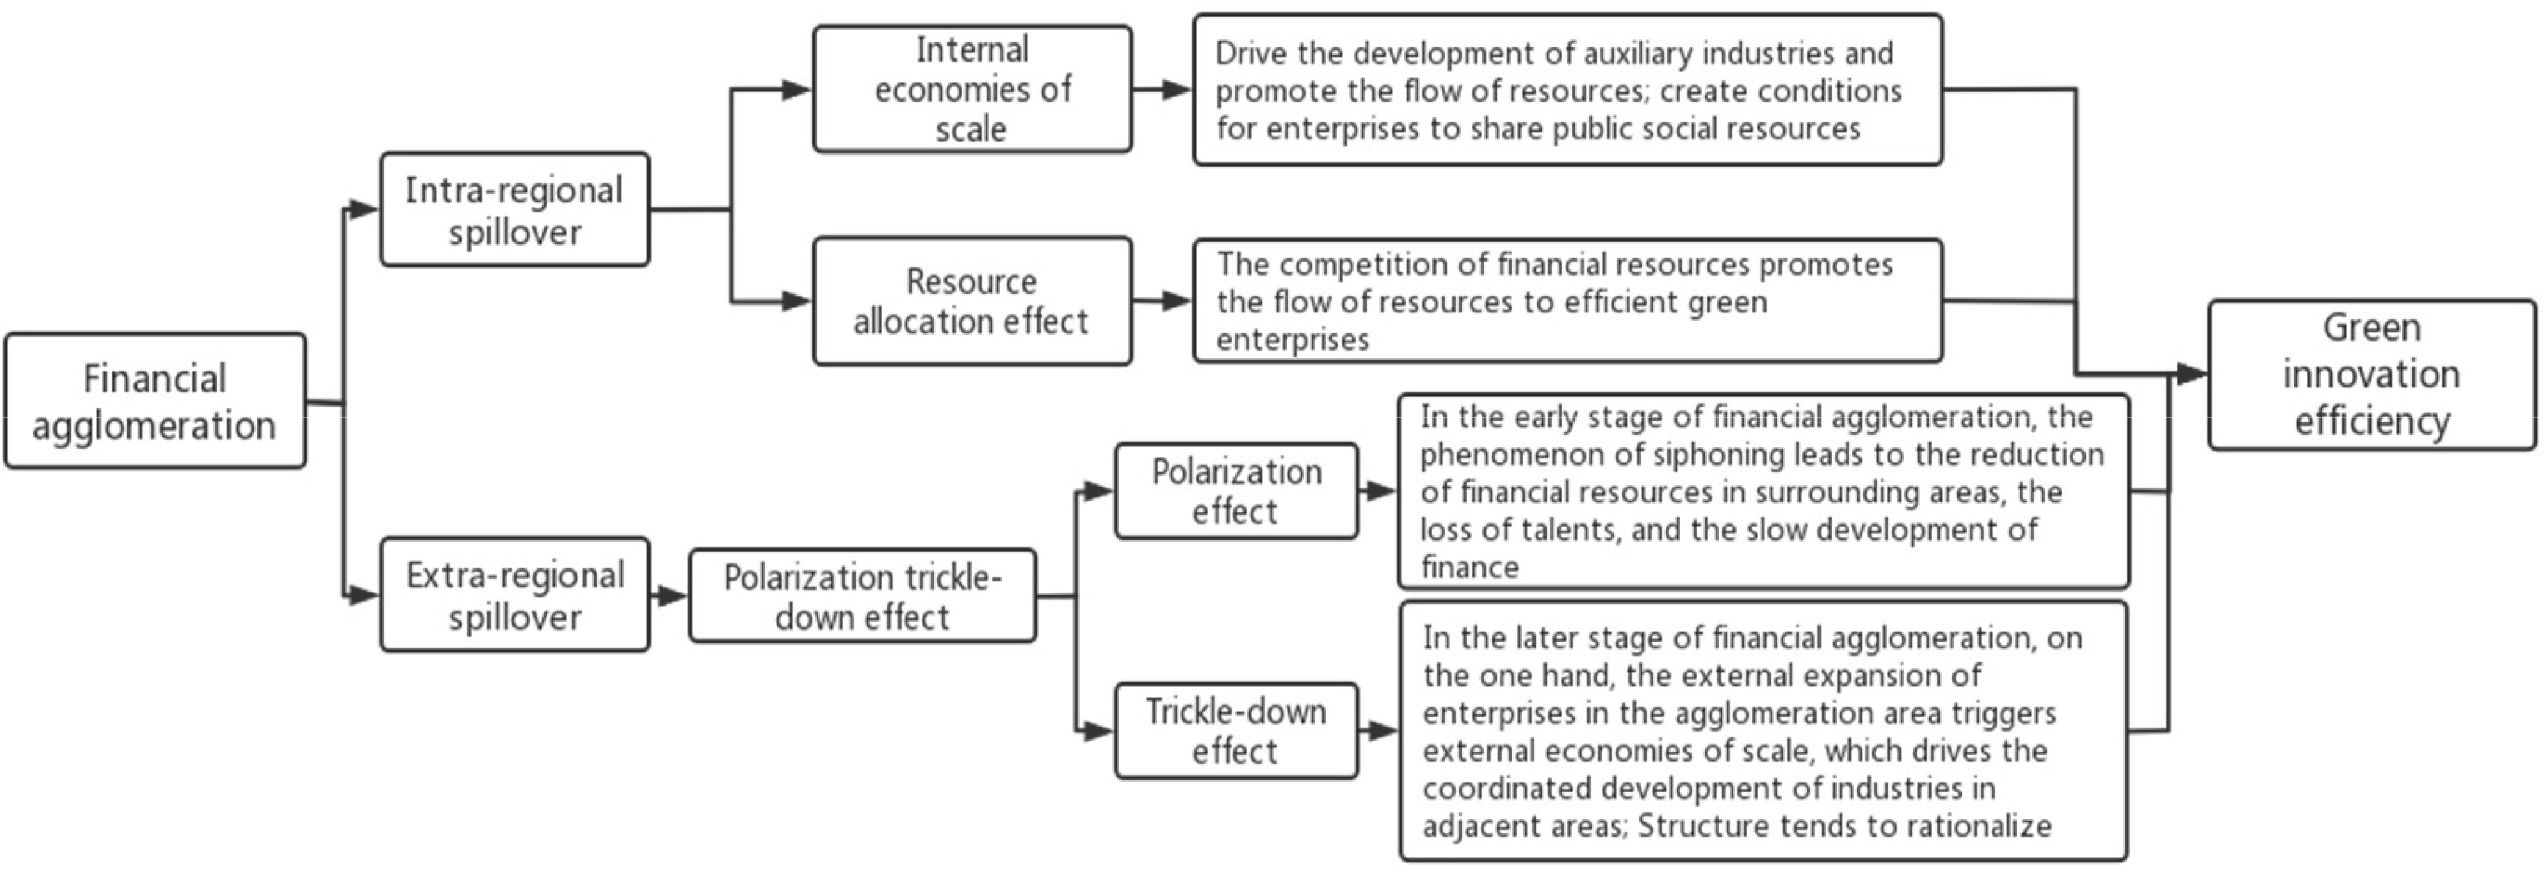
Theoretical mechanism analysisGreen innovation development cannot be separated from high-quality technology R&D, reasonable industrial structure, and effective division of labor among enterprises (Shao, Luan & Yang, 2016). Financial agglomeration can promote the optimal allocation of resources, improve the regional industrial structure, and ultimately induce scale economy and trickle-down polarization effects by increasing the quantity and improving the quality of financial resources in agglomeration areas (Wurgler, 2000; Tian, Wang & Liu, 2021). This study divides the spatial spillover of financial agglomeration on green innovation efficiency into intra- and extra-regional spillover. An analysis of the theoretical mechanism is illustrated in Figure 1.

Financial resources agglomeration is not simply the sum of individual financial institutions, but the formation of 1 + 1 > 2 cooperation, which produces internal economies of scale (Maji, Habibullah & Saari, 2017). When financial institutions gather in a certain area, they are able to work with local industries more conveniently, which can promote the development of auxiliary industries (i.e., lawyers, investment consulting, and asset evaluation, among other supporting industries), reduce the transaction costs of enterprise financing, and promote the rapid flow of financial resources. Furthermore, agglomeration can establish conditions for enterprises in the cluster to share social resources and ease enterprises’ capability to obtain information and capital, which advances enterprises’ R&D related to environmental protection innovation technology, subsequently reducing resource waste and environmental pollution, with a positive impact on regional green innovation efficiency (Peneder, 2002).
Resource allocation effectResource allocation is the core function of financial institutions, referring to the allocation of various financial resources at different times and places and among different subjects (Kindleberger, 1973). The financial resources in the market are limited, the concentration of financial capital results in competition, and financial institutions preference high-quality industries when choosing financial support objects, facilitating the transfer of financial resources from inefficient and polluting enterprises to efficient and less-polluting enterprises to advance the rational allocation of financial resources (Tan et al., 2017). When more resources flow to the high-efficiency green environmental protection industry, enterprises’ technological R&D efforts can obtain sufficient financial support, reducing the consumption of raw materials and energy, lowering pollution, improving resource utilization rates, and advancing enterprises’ green innovation efficiency (Levine & Zervos, 1998).
Extra-regional spilloverPolarization trickle-down effectHirschman asserted that relative changes in the economic development of a certain region will inhibit or promote the economic development of the surrounding areas, which is realized through polarization and trickle-down effects, and the trickle-down effect will eventually dominate the polarization effect (Hirschman, 1992). The polarization effect primarily emerges in the early stage of financial agglomeration. Due to the advantages of independently held financial resources and the inclination of national policies, the financial industry can develop rapidly, generating a siphoning phenomenon to surrounding areas (Akinci, 2018), which results in a decreasing financial resources, brain drain, and financial sluggishness, adversely affecting the efficiency of surrounding areas’ green innovation.
In the later stage of financial agglomeration development, the trickle-down effect will gradually dominate (Deng, Wang & Yang, 2019; Benfratello, Schiantarelli & Sembenelli, 2008). Enterprises in the agglomeration area can develop rapidly due to the numerous resources available in the early stage. To maximize profits, the agglomeration center will continue to expand outward, triggering external economies of scale (Krugman, 1992; Bencivenga, Smith & Starr, 1995). Through technical assistance, information sharing, and the establishment of branch offices, enterprises in the agglomeration area have a spatial spillover impact on surrounding areas, driving the industrial development of the adjacent areas and helping improve the green innovation efficiency of surrounding areas. In contrast, as financial resources congregate in a certain geographic area, market congestion effect will emerge, and the costs of productive factors such as labor and capital in the agglomeration area will rise, increasing enterprises’ production costs. Confronting the pressure of cost, enterprises will gradually relocate production plants to surrounding areas with relatively lower prices. Furthermore, new enterprises will also consider cost factors, choosing locations on the periphery of agglomeration areas, and the industrial structure will gradually tend to rationalize (Sun & Zhang, 2018). The regions undertaking industrial transfer can then absorb the advanced technologies and high-quality production factors of other regions and actively conduct technological re-innovation, which promotes the improvement of local innovation efficiency (Lewis, 1954).
Research designModel settingsSpatial econometric modelTraditional regional econometric studies generally assume that the variables between regions are independent of one another, but according to the first law of geography proposed by Tobler (1970), spatial connections are ubiquitous. Because economic data is usually collected from a certain location, the spatial perspective has received extensive attention in recent years. As this study focuses on the spatial spillover effect of financial agglomeration on green innovation efficiency, the SDM is initially established as follows:
where the subscripts i and j represent provinces, and t represents the year; TEit is the explained variable, representing the green innovation efficiency of province i in year t; Finit is the core explanatory variable, representing the financial agglomeration index of province i in year t; Wij is the element of the i-th row and the j-th column of the spatial weight matrix W, measuring the spatial relationship between province i and province j; Xit is a control variable; ui represents the individual effect; vt represents the time effect; εit is the random error term; and β1, β2, and β3 are the spatial regression coefficients of the explained variable, the core explanatory variable, and the control variable, respectively.
Because green innovation economic development is a dynamic activity, the explained variable of the current period may be affected by the previous period. Therefore, a first-order lag term of the explained variable is introduced on the basis of the above model, and a dynamic model is further established as follows:

The meaning of the variables and coefficients in the equation is the same as that of Eq. (1). TEit-1 represents the value of the explained variable in the previous period, representing the green innovation efficiency of province i in year t-1, and α1 is its coefficient, which measures provinces’ current green innovation efficiency, influenced by the previous period.
Spatial weight matrixA distance-based adjacency weight matrix has been commonly used in the literature. Considering that the influence of geographical location on real economic activities is not limited to adjacent regions, and the explanatory power of the matrix will decrease with increased sample size, this study selects first-order and second-order inverse distance matrices to describe the spatial connections between provinces (Gilio & de Moraes, 2016). The matrix settings are as follows:
where dij is the geographic distance between provinces i and j, which is calculated based on each province's longitude and latitude, which are obtained from the National Basic Geographic Information Center.Methods of estimating parameters

Due to the existence of spatial correlation, the spatial econometric model does not meet the assumptions of the classical ordinary least squares model, and the regression results will be biased and inconsistent (Elhorst, 2014). Therefore, the maximum likelihood method (MLE) is employed in this study to estimate the static SDM. The general matrix form of the static SDM model is as follows:
where Y is the n-dimensional explanatory variable column vector, X is the n × k explanatory variable matrix, β is the k-dimensional column vector, and V ∼ N(0,δ2In). Let Z = (X,WX) and β = (β1’,β2’). Eq. (5) can then be transformed as follows:

The MLE function of the static SDM can then be obtained as follows:
where V = Y-λWY-Zβ, and the parameter estimates of the static SDM can be obtained by maximizing Eq. (7).
The explained variable is lagged by one period in the dynamic SDM of Eq. (2). Because the explanatory variable has potential endogeneity problems, the above MLE method for estimating the static model is no longer applicable to the dynamic model. Three methods have generally been used for estimating dynamic spatial panel models, including quasi-likelihood function or bias-corrected likelihood function, the generalized method of moments (GMM), and the of Bayes–Markov Monte Carlo method (Elhorst, 2010; Elhorst, 2014). This study adopts the Han–Phillips GMM proposed (Han & Phillips, 2010) to estimate the dynamic SDM. This method can better manage the endogeneity problem and can effectively solve the weak instrumental variable problem associated with the traditional instrumental variable method and the difference in GMM. Please refer to the relevant literature (Han & Phillips, 2010) for the mathematical derivation of the method, which will not be repeated in this study.
Variable and data descriptionsExplained variableThe explained variable in this study is each province's green innovation efficiency (TE), and the SBM super-efficiency model is employed to facilitate its measurement. This model is an improved data envelopment analysis (DEA) method that measures efficiency by means of linear programming. It does not need to set the specific form of the production function in advance, but only needs to have the relevant input–output data (Zhang, Kang & Li, 2020). Li & Du (2021) applied this model to examine the impact of environmental regulation on the efficiency of green innovation. The selection of input–output indicators in this study is presented in Table 1:
Input–output indicators.
Regarding green indicators, this study considers the “three wastes” discharge indicators that are often discussed in China; however, only two indicators are used due to data availability, including total wastewater discharge and sulfur dioxide discharge. In previous research, two methods have commonly been used to manage such bad output indicators. One is using the bad output as an input indicator, which is represented by Mohtadi (1996), among others, and the other is using it as an undesired output, as in Lu, Pan & Chen (2006). The first method is adopted in this study, incorporating total wastewater and sulfur dioxide discharge indices into the model as input indicators. Regarding innovation output, this study uses the number of patent applications to reflect enterprises’ innovation capabilities (Liu & Wang, 2023). This study uses linear interpolation to complete missing data for some years in individual provinces.
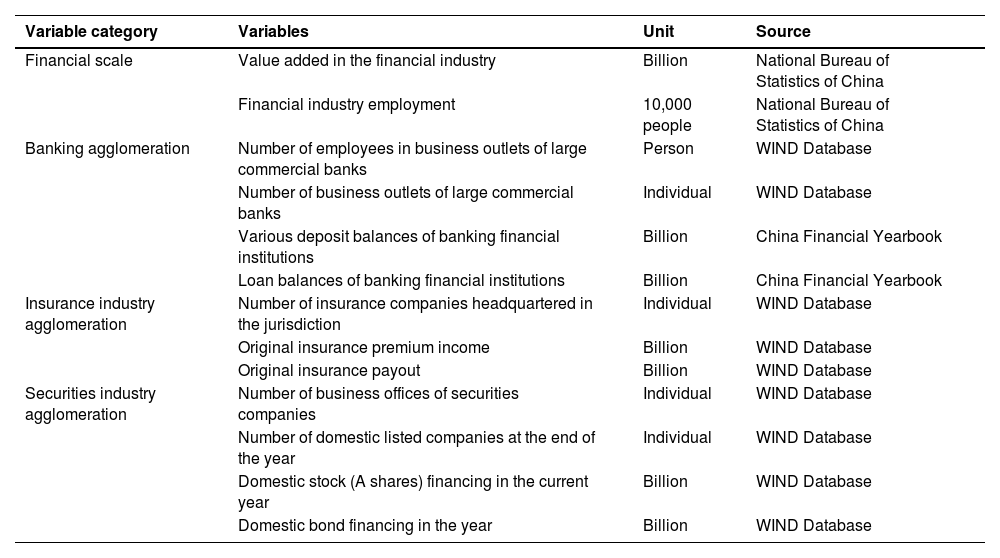
Core explanatory variablesThe core explanatory variable of this study is the financial agglomeration index (Fin). Considering the diversified characteristics of finance, this study constructs a comprehensive evaluation index to measure the financial agglomeration index of 30 provinces across China (excluding Hong Kong, Macao, Taiwan, and Tibet) from 2009 to 2017, employing principal component analysis (PCA). The indicator system is presented in Table 2, including 13 specific indicators in four categories of financial scale, banking industry agglomeration, insurance industry agglomeration, and securities industry agglomeration.
Comprehensive evaluation index system of financial agglomeration.
To eliminate the influence of dimensions, all indicators were standardized before conducting PCA. Again, linear interpolation is used to complete missing data.
Control variablesTo ensure the reliability of the empirical results, this study synthesizes the relevant research regarding the factors that influence green innovation efficiency, selecting the following seven control variables (Chen, Tao & Zhou, 2023). (1) Government support for science and technology (Gov). The government's intervention in enterprise R&D and the market economy will inevitably have an impact on the efficiency of regional green innovation. This variable is measured by the proportion of local fiscal science and technology expenditure in general budget expenditure. (2) Human capital level (HC). HC is an important factor affecting economic development. In addition to impacting financial agglomeration, it can also affect the efficiency of regional green innovation by raising enterprises’ technical talent and innovation levels. This variable is measured using the average number of students in colleges and universities per 100,000 population. (3) Technology market activity (Tec). The more active the technology market is, the more active the R&D and innovation activities of the enterprise will be. This variable is measured by the proportion of technology market turnover in GDP. (4) Infrastructure level (Inf). Infrastructure is the foundation of regional economic development, and has an impact on regional green innovation efficiency. This variable is measured by the proportion of total telecommunications business in GDP. (5) Degree of openness (Open). Opening to the outside world attracts foreign-funded enterprises with higher innovative technologies to conduct green economic activities, which impacts regional green innovation efficiency. This variable is measured using the proportion of total import and export of goods in GDP. (6) Environmental regulation (Env). Environmental regulation can directly affect regional green innovation efficiency by reducing environmental pollution. This variable is measured using the proportion of environmental pollution control investment in GDP; (7) Foreign direct investment (FDI). Technology spillovers from FDI can have a positive impact on firms in emerging market economies, promoting technological innovation. This variable is measured using the ratio of actual FDI use to GDP. The above data are obtained from the National Bureau of Statistics, the China Statistical Yearbook, China Environmental Statistical Yearbook, and the WIND database.
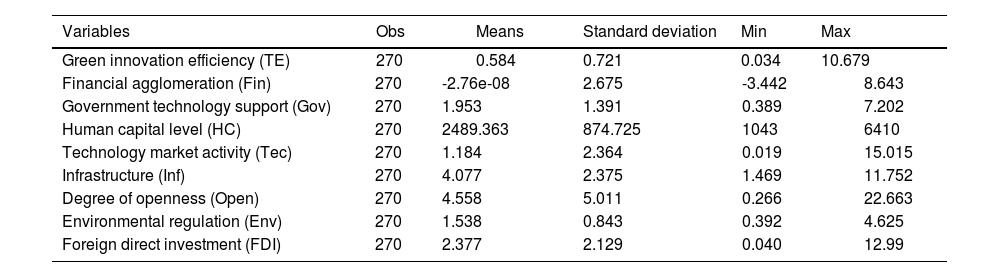
The research sample in this study is balanced panel of data from 30 provinces across the country from 2009 to 2017. The data exclude Hong Kong, Macao, Taiwan, or Tibet. The descriptive statistics of each variable are presented in Table 3. While no abnormal values are evident for any variable, the standard deviations are generally large, indicating a serious imbalance in provinces’ resource allocation. Therefore, to better explain the results economically and reduce the influence of heteroskedasticity, this study performs logarithmic processing on each variable. This study first translates cases of a negative financial agglomeration index and then conducts logarithmic processing.
Descriptive statistics.
This study's spatial correlation tests include global and local spatial self-correlation tests.
The global spatial self-correlation test is used to determine the overall distribution of variables in the spatial range. The test statistics commonly used are Moran's index (Moran's I) and the Geary index C, among others. Moran's I is used in this study to test the spatial correlation of variables. For details regarding Moran's I, please refer to the relevant literature (Moran, 1950). Table 4 presents the results of the Moran's I test of the national provincial-level green innovation efficiency and financial agglomeration index from 2009 to 2017. The results show that the Moran's I of green innovation efficiency and financial agglomeration index is greater than 0 each year, passing the significance test at the 1% level. This indicates that the green innovation efficiency and financial agglomeration index of all provinces in China have an obvious positive spatial correlation; therefore, it is appropriate to introduce spatial effects when exploring the relationship between them.
Global spatial autocorrelation test.
| Green innovation efficiency | Financial agglomeration index | |||||
|---|---|---|---|---|---|---|
| Year | Moran's I | z | p | Moran's I | z | p |
| 2009 | 0.089⁎⁎⁎ | 3.321 | 0.000 | 0.085⁎⁎⁎ | 3.226 | 0.001 |
| 2010 | 0.121⁎⁎⁎ | 4.182 | 0.000 | 0.088⁎⁎⁎ | 3.332 | 0.000 |
| 2011 | 0.084⁎⁎⁎ | 3.323 | 0.000 | 0.083⁎⁎⁎ | 3.192 | 0.001 |
| 2012 | 0.076⁎⁎⁎ | 3.049 | 0.001 | 0.082⁎⁎⁎ | 3.150 | 0.001 |
| 2013 | 0.103⁎⁎⁎ | 3.774 | 0.000 | 0.079⁎⁎⁎ | 3.074 | 0.001 |
| 2014 | 0.048⁎⁎⁎ | 2.373 | 0.009 | 0.086⁎⁎⁎ | 3.269 | 0.001 |
| 2015 | 0.130⁎⁎⁎ | 4.397 | 0.000 | 0.092⁎⁎⁎ | 3.438 | 0.000 |
| 2016 | 0.105⁎⁎⁎ | 3.727 | 0.000 | 0.115⁎⁎⁎ | 4.068 | 0.000 |
| 2017 | 0.086⁎⁎⁎ | 3.225 | 0.001 | 0.096⁎⁎⁎ | 3.557 | 0.000 |
Note:
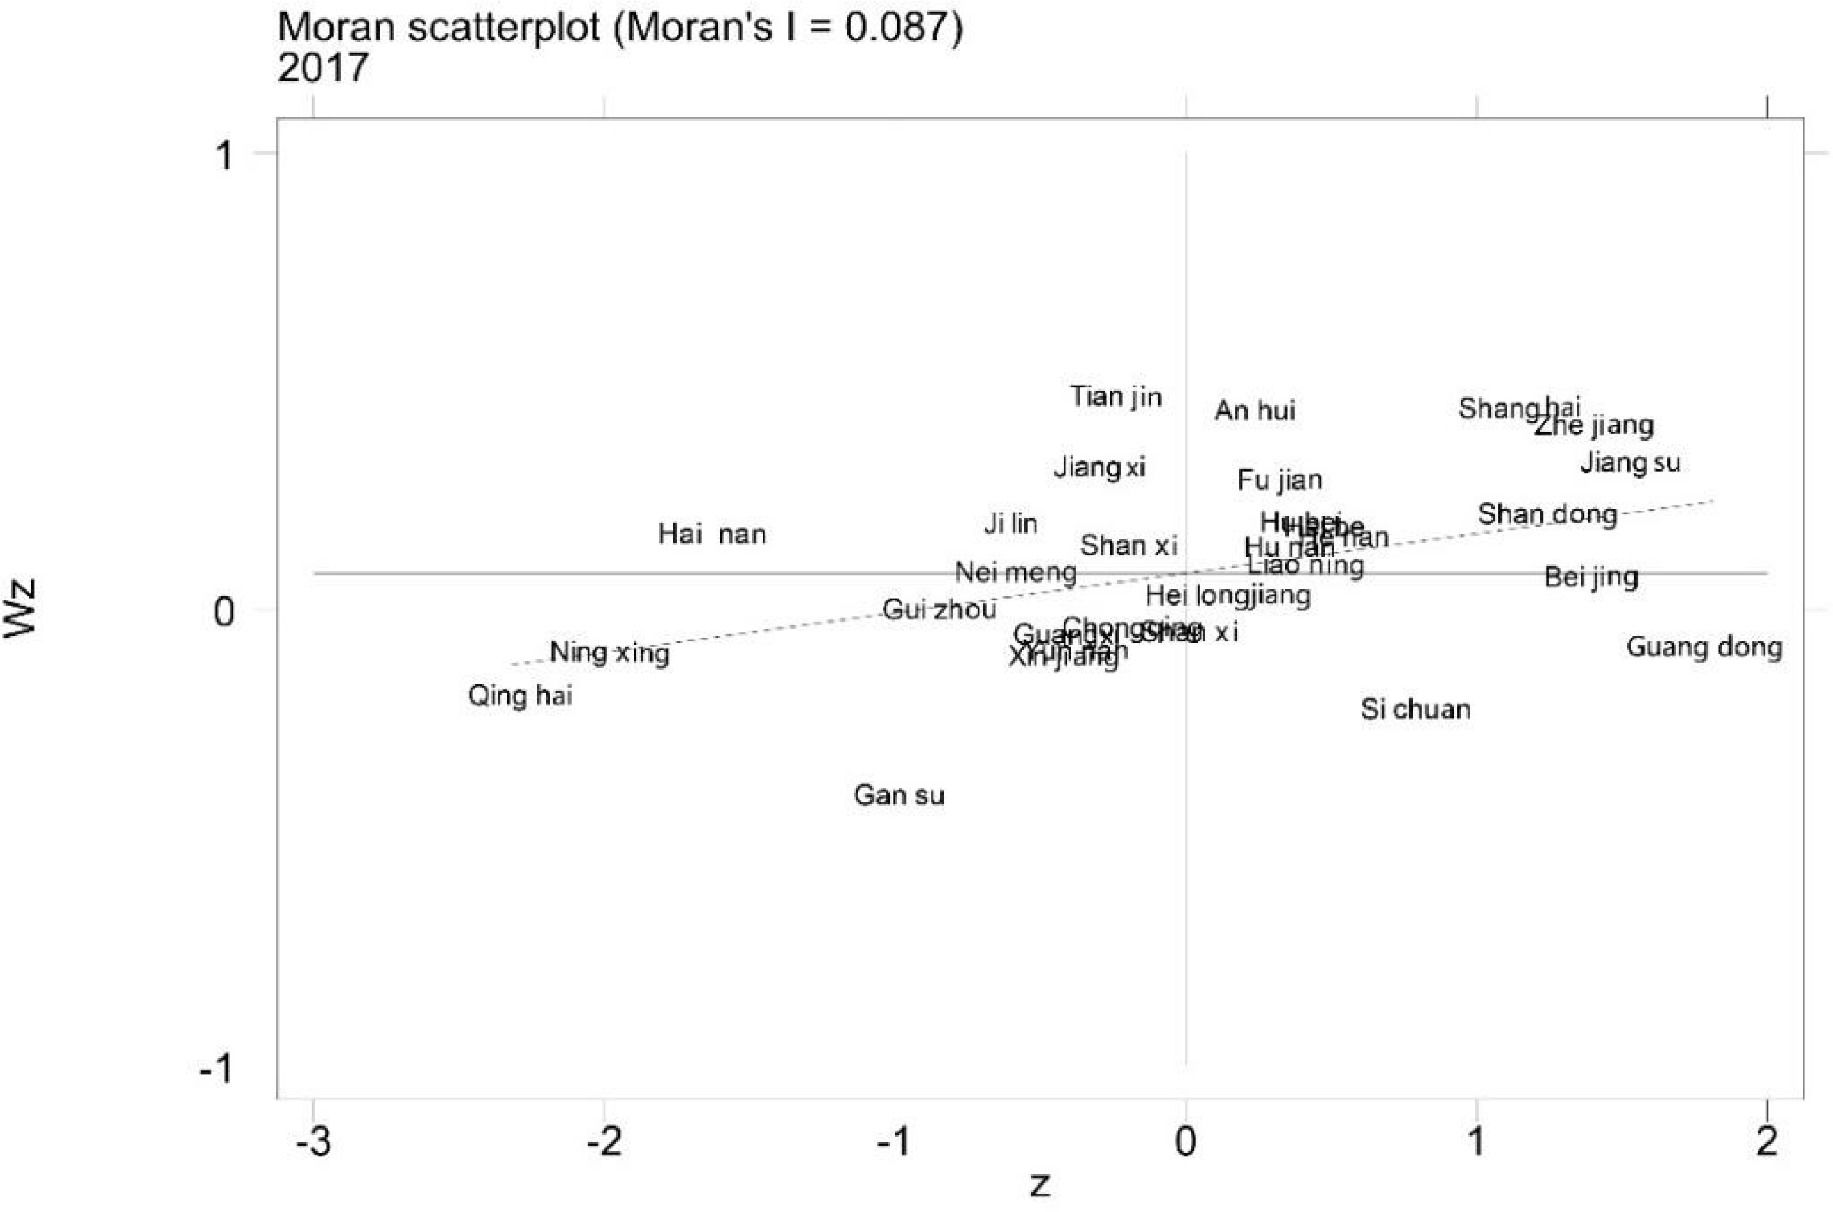
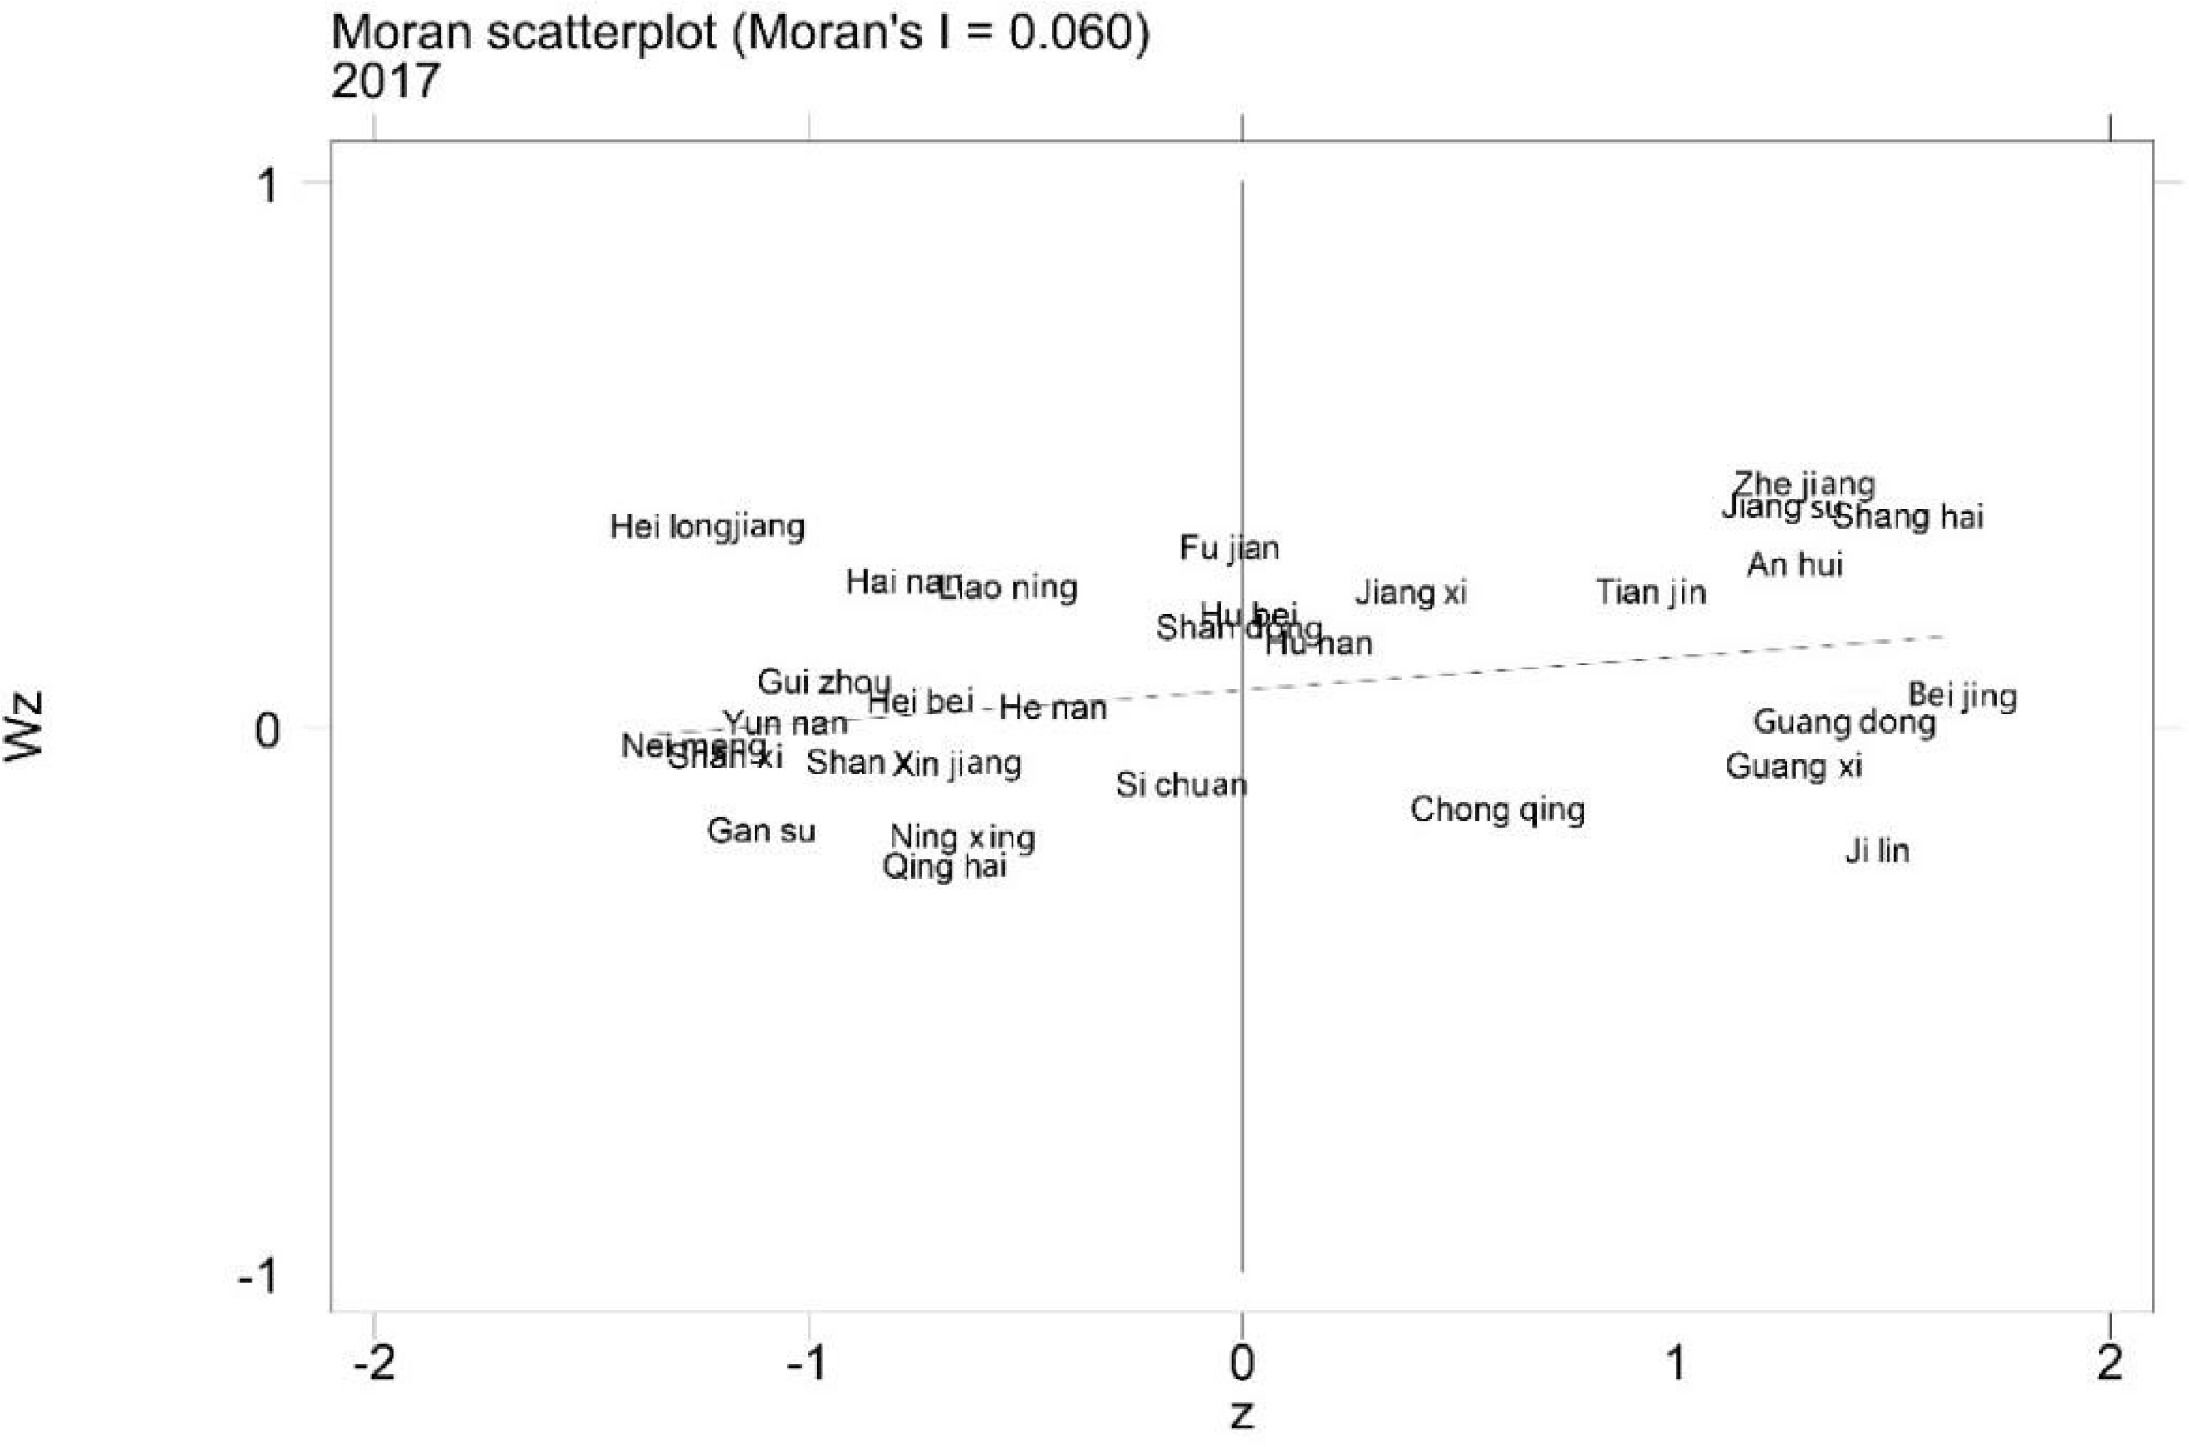
A local spatial self-correlation test is used to determine the distribution of variables in and around local areas. The local Moran's I is used to present the local spatial correlation by means of a Moran scatter plot to illustrate the test results more intuitively. The local Moran scatter plot includes four quadrants. The first quadrant represents the aggregation of high values and high values, indicating that the spatial unit itself and its surrounding areas have high variable observation values. The second quadrant represents low values surrounded by high values, indicating that the observed value of the variable in the spatial unit itself is low, and the observed value of the variable in the surrounding area is high. The third quadrant represents the aggregation of low values and low values, indicating that the spatial unit itself and its surrounding areas have low values. The fourth quadrant represents high values surrounded by low values, indicating that the observed value of the variable in the spatial unit itself is high, and the observed value of the variable in the surrounding area is low. Due to space constraints, this study only presents the results for 2017. Figures 2 and 3 reveal that most provinces are distributed in the first and third quadrants, indicating that the green innovation efficiency and financial agglomeration index of each province has a spatial trend of high-value and high-value and low-value and low-value agglomeration. This further illustrates the presence of spatial effects.
Analysis of regression results

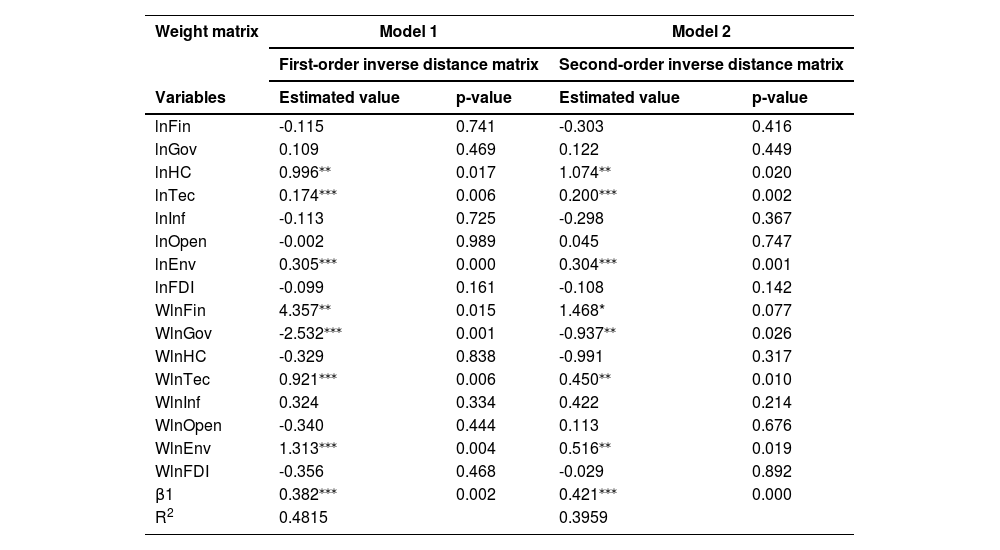
Considering that the existence of spatial correlation breaks the basic assumption in traditional econometric analysis that samples are independent of one another, this study initially uses SDM Eqs. (1) and (2) for empirical research. First, the LM test reveals that spatial lag and spatial error effects of the research variables are significant at the 1% significance level, and LR and Wald tests show that the SDM cannot degenerate into a spatial error model or a spatial lag model, indicating that the SDM that was initially established is reasonable. Second, the Hausman test reveals that a fixed effects model should be used; therefore, a fixed effect SDM is constructed in this study for subsequent econometric analysis. The regression results of Eq. (1) are presented in Table 5.
Static SDM estimation results.
| Weight matrix | Model 1 | Model 2 | ||
|---|---|---|---|---|
| First-order inverse distance matrix | Second-order inverse distance matrix | |||
| Variables | Estimated value | p-value | Estimated value | p-value |
| lnFin | -0.115 | 0.741 | -0.303 | 0.416 |
| lnGov | 0.109 | 0.469 | 0.122 | 0.449 |
| lnHC | 0.996⁎⁎ | 0.017 | 1.074⁎⁎ | 0.020 |
| lnTec | 0.174⁎⁎⁎ | 0.006 | 0.200⁎⁎⁎ | 0.002 |
| lnInf | -0.113 | 0.725 | -0.298 | 0.367 |
| lnOpen | -0.002 | 0.989 | 0.045 | 0.747 |
| lnEnv | 0.305⁎⁎⁎ | 0.000 | 0.304⁎⁎⁎ | 0.001 |
| lnFDI | -0.099 | 0.161 | -0.108 | 0.142 |
| WlnFin | 4.357⁎⁎ | 0.015 | 1.468* | 0.077 |
| WlnGov | -2.532⁎⁎⁎ | 0.001 | -0.937⁎⁎ | 0.026 |
| WlnHC | -0.329 | 0.838 | -0.991 | 0.317 |
| WlnTec | 0.921⁎⁎⁎ | 0.006 | 0.450⁎⁎ | 0.010 |
| WlnInf | 0.324 | 0.334 | 0.422 | 0.214 |
| WlnOpen | -0.340 | 0.444 | 0.113 | 0.676 |
| WlnEnv | 1.313⁎⁎⁎ | 0.004 | 0.516⁎⁎ | 0.019 |
| WlnFDI | -0.356 | 0.468 | -0.029 | 0.892 |
| β1 | 0.382⁎⁎⁎ | 0.002 | 0.421⁎⁎⁎ | 0.000 |
| R2 | 0.4815 | 0.3959 | ||
Note:
The results reveal that the spatial lag coefficients of Models 1 and 2 using two different spatial weight matrices are 0.382 and 0.421, respectively, both of which are significant at the 1% level, indicating considerable spatial spillover effects in China's inter-provincial green innovation efficiency. In contrast, the financial agglomeration has a slight but insignificant negative impact on provinces’ green innovation efficiency, whereas a significant positive impact on neighboring provinces’ green innovation efficiency is evident. Regarding control variables, HC level, technology market activity, and environmental regulation all have significant positive impact, while government technology support, infrastructure level, degree of openness, and FDI exhibit no significant impact on provinces’ green innovation efficiency.
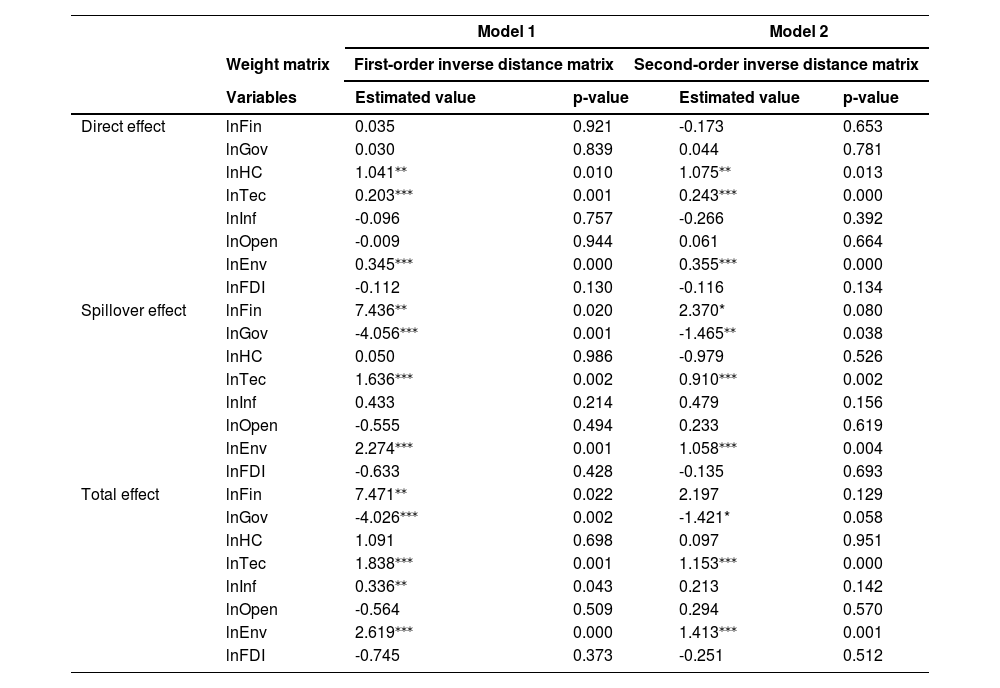
When the model has a significant spatial lag effect, bias is introduced when directly using the regression coefficient of the explanatory variable to analyze the influence of the explanatory variable on the explained variable. Therefore, this study adopts the partial differential decomposition method to explore the influence of each explanatory variable on the efficiency of inter-provincial green innovation (LeSage & Pace, 2009). Table 6 presents the decomposition results of the spatial effects. The direct effect indicates the impact of changes in explanatory variables on provinces’ green innovation efficiency, and the indirect effect represents the impact of changes in provinces’ explanatory variables on neighboring provinces’ green innovation efficiency, indicating the spatial spillover effect. The total effect is calculated as the sum of direct and indirect effects, indicating the overall spatial impact of changes in the explanatory variables on the efficiency of green innovation.
Partial differential decomposition results.
| Model 1 | Model 2 | ||||||
|---|---|---|---|---|---|---|---|
| Weight matrix | First-order inverse distance matrix | Second-order inverse distance matrix | |||||
| Variables | Estimated value | p-value | Estimated value | p-value | |||
| Direct effect | lnFin | 0.035 | 0.921 | -0.173 | 0.653 | ||
| lnGov | 0.030 | 0.839 | 0.044 | 0.781 | |||
| lnHC | 1.041⁎⁎ | 0.010 | 1.075⁎⁎ | 0.013 | |||
| lnTec | 0.203⁎⁎⁎ | 0.001 | 0.243⁎⁎⁎ | 0.000 | |||
| lnInf | -0.096 | 0.757 | -0.266 | 0.392 | |||
| lnOpen | -0.009 | 0.944 | 0.061 | 0.664 | |||
| lnEnv | 0.345⁎⁎⁎ | 0.000 | 0.355⁎⁎⁎ | 0.000 | |||
| lnFDI | -0.112 | 0.130 | -0.116 | 0.134 | |||
| Spillover effect | lnFin | 7.436⁎⁎ | 0.020 | 2.370* | 0.080 | ||
| lnGov | -4.056⁎⁎⁎ | 0.001 | -1.465⁎⁎ | 0.038 | |||
| lnHC | 0.050 | 0.986 | -0.979 | 0.526 | |||
| lnTec | 1.636⁎⁎⁎ | 0.002 | 0.910⁎⁎⁎ | 0.002 | |||
| lnInf | 0.433 | 0.214 | 0.479 | 0.156 | |||
| lnOpen | -0.555 | 0.494 | 0.233 | 0.619 | |||
| lnEnv | 2.274⁎⁎⁎ | 0.001 | 1.058⁎⁎⁎ | 0.004 | |||
| lnFDI | -0.633 | 0.428 | -0.135 | 0.693 | |||
| Total effect | lnFin | 7.471⁎⁎ | 0.022 | 2.197 | 0.129 | ||
| lnGov | -4.026⁎⁎⁎ | 0.002 | -1.421* | 0.058 | |||
| lnHC | 1.091 | 0.698 | 0.097 | 0.951 | |||
| lnTec | 1.838⁎⁎⁎ | 0.001 | 1.153⁎⁎⁎ | 0.000 | |||
| lnInf | 0.336⁎⁎ | 0.043 | 0.213 | 0.142 | |||
| lnOpen | -0.564 | 0.509 | 0.294 | 0.570 | |||
| lnEnv | 2.619⁎⁎⁎ | 0.000 | 1.413⁎⁎⁎ | 0.001 | |||
| lnFDI | -0.745 | 0.373 | -0.251 | 0.512 | |||
Note:
The results in Table 6 reveal that the direction and significance of the coefficients of each explanatory variable are basically the same as the direct regression results in Table 5. The spatial spillover effect of the core explanatory variable (financial agglomeration) is significantly positive, indicating that financial industry agglomeration can serve the surrounding areas across regions and significantly promote adjacent provinces’ green innovation efficiency.
The financial industry is essentially an information industry. With the vigorous development of modern information technology, the cross-regional exchange and transmission of information have become increasingly easier, and the development of the financial industry is becoming less sensitive to geographic distance, which alleviates the adverse effects of information asymmetry. In addition, financial industry agglomeration makes it easier for enterprises to obtain funds. Competition in the financial market encourages more resources to flow to high-quality and efficient sunrise industries, resources are allocated more effectively, and industrial structure moves toward rationalization and advanced development. In addition, enterprises in the agglomeration area drive the development of industries in surrounding areas through technical assistance, information sharing, and establishing neighboring branches, thereby improving the efficiency of green innovation in the entire area.
Regarding other control factors, the direct effect of HC level is significantly positive; however, the spillover effect is not significant, indicating that the cross-regional mobility of human resources is not high, and HC is limited to promoting the development of a green innovation economy within the province. In contrast, the direct and indirect effects of technology market activity are significantly positive, indicating that technology market activity significantly improves the province's green innovation efficiency as well as exhibiting significant positive spatial spillover effects for neighboring provinces. The direct and indirect effects of environmental regulation are also significantly positive, indicating that provinces’ investments in pollution control have yielded good results. The direct effect of government science and technology support is not significant, while the indirect effect is significantly negative, indicating that excessive intervention by local government officials in business operations and the market economy exerts an adverse impact. The level of infrastructure, degree of openness, and FDI have no significant impact on the efficiency of green innovation.
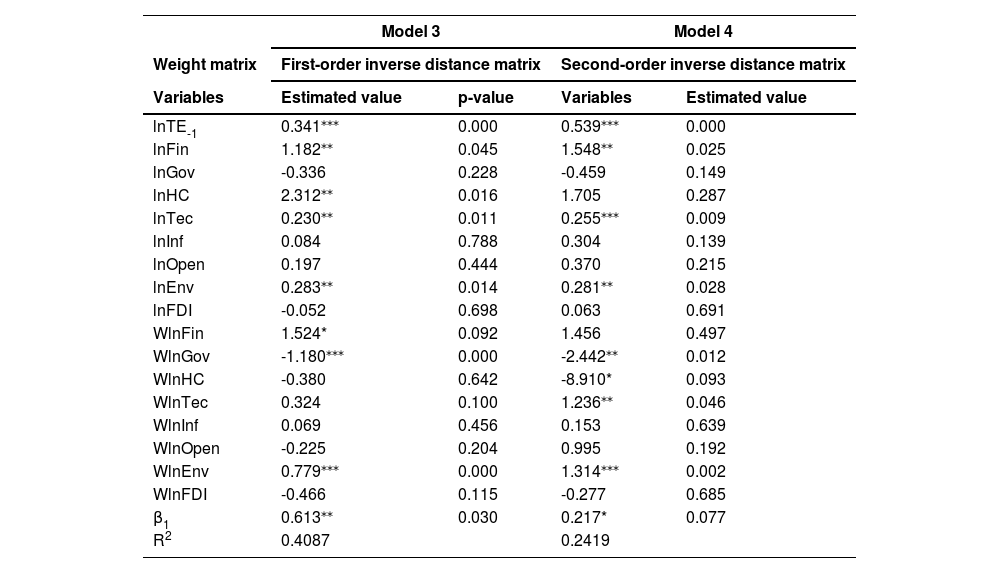
Because the dynamic model has unparalleled advantages in managing the endogeneity of spatial measurement (Zhang, Yang & Sun, 2017), this study further constructs a dynamic SDM, using Eq. (2) to explore the impact of financial agglomeration on the efficiency of inter-provincial green innovation. The results are presented in Table 7, revealing that the core explanatory variable (financial agglomeration) has a significant positive impact on the green innovation efficiency of the province and neighboring provinces after adding the first-order lag term of the explained variable, aligning with theoretical expectations. The spatial spillover coefficients of financial agglomeration on green innovation efficiency shown by the dynamic model (1.524 and 1.456) are both lower than the spatial spillover coefficients shown by the static model (4.357 and 1.468). A possible rationale for this is that the dynamic model adds the first-order lag term of the explained variable, which separates other potential factors affecting green innovation efficiency; thus, the spatial spillover effect of financial agglomeration on green innovation efficiency can be more accurately measured. Therefore, the static model exhibits an overestimation bias regarding the spatial spillover effect. In addition, the direction and significance of the influence of other control variables are basically consistent with the results of the static SDM, indicating that the model established in this study is robust.
Dynamic SDM estimation results.
| Model 3 | Model 4 | |||
|---|---|---|---|---|
| Weight matrix | First-order inverse distance matrix | Second-order inverse distance matrix | ||
| Variables | Estimated value | p-value | Variables | Estimated value |
| lnTE-1 | 0.341⁎⁎⁎ | 0.000 | 0.539⁎⁎⁎ | 0.000 |
| lnFin | 1.182⁎⁎ | 0.045 | 1.548⁎⁎ | 0.025 |
| lnGov | -0.336 | 0.228 | -0.459 | 0.149 |
| lnHC | 2.312⁎⁎ | 0.016 | 1.705 | 0.287 |
| lnTec | 0.230⁎⁎ | 0.011 | 0.255⁎⁎⁎ | 0.009 |
| lnInf | 0.084 | 0.788 | 0.304 | 0.139 |
| lnOpen | 0.197 | 0.444 | 0.370 | 0.215 |
| lnEnv | 0.283⁎⁎ | 0.014 | 0.281⁎⁎ | 0.028 |
| lnFDI | -0.052 | 0.698 | 0.063 | 0.691 |
| WlnFin | 1.524* | 0.092 | 1.456 | 0.497 |
| WlnGov | -1.180⁎⁎⁎ | 0.000 | -2.442⁎⁎ | 0.012 |
| WlnHC | -0.380 | 0.642 | -8.910* | 0.093 |
| WlnTec | 0.324 | 0.100 | 1.236⁎⁎ | 0.046 |
| WlnInf | 0.069 | 0.456 | 0.153 | 0.639 |
| WlnOpen | -0.225 | 0.204 | 0.995 | 0.192 |
| WlnEnv | 0.779⁎⁎⁎ | 0.000 | 1.314⁎⁎⁎ | 0.002 |
| WlnFDI | -0.466 | 0.115 | -0.277 | 0.685 |
| β1 | 0.613⁎⁎ | 0.030 | 0.217* | 0.077 |
| R2 | 0.4087 | 0.2419 | ||
Note:
Determining how financial agglomeration promotes the development of a green innovation economy is a seminal topic of academic attention. Assuming a spatial perspective, and starting with an analysis of the theoretical mechanism of financial agglomeration in promoting the efficiency of regional green innovation, this study proposes that the agglomeration of the financial industry will promote improved efficiency in green innovation in the region through the intra-regional spillover mechanism as well as impacting the surrounding areas through the extra-regional spillover mechanism. Intra-regional spillover includes internal economies of scale and resource allocation effects, while extra-regional spillover is polarization and trickle-down effects, of which trickle-down effects include external economies of scale and industrial structure upgrading. Based on these assumptions, and using spatial panel data from 30 provinces in China from 2009 to 2017, a green innovation efficiency and financial agglomeration index are calculated using the DEA and comprehensive indices, respectively. We also construct static and dynamic SDMs for empirical analysis based on two different spatial weight matrices. The results reveal significant positive spatial correlation between the green innovation efficiency and the financial agglomeration index of 30 provinces in China. Both static and dynamic SDMs demonstrate that financial agglomeration has a significant spatial spillover effect on neighboring provinces’ green innovation efficiency, but the static model exhibits an overestimation bias on the spatial spillover effect. In addition, human capital level, technology market activity, and environmental regulation all have significant positive impacts on green innovation efficiency, while government technology support has a negative impact.
Future researchBased on its theoretical mechanism analysis and empirical research results, this study offers some inspiration for future research directions. After verifying the existence of the spatial spillover effect of financial agglomeration on green innovation efficiency, does the spatial spillover effect vary when the geographical distance between two provinces changes with the increase? Will the spatial spillover effect differ for different geographic sectors in China? These and other relevant considerations require further exploration.
Policy implicationsThe government can guide financial industry agglomeration through various initiatives, such as planning layout and financial support to fully leverage its advantages in optimizing resource allocation and supervision. Doing so can promote the balanced development of regional financial agglomeration and better support the green development of the real economy. Furthermore, policymakers must actively promote cross-regional communication and cooperation, innovate resource flow channels, fully leverage the positive spatial spillover effect of financial agglomeration on green innovation efficiency, strengthen the financial trickle effect, and drive the development of underdeveloped regions. In addition, the empirical results of the control variables offer some inspiration. First, the cross-regional flow of human resources should be promoted through measures such as talent introduction and improved social security to promote balanced green innovation economic development in various regions. The second is recognizing the role of the market in resource allocation, streamlining enterprises’ operation, and simplifying examination and approval procedures for the identification and issuance of enterprises’ patent applications, which will stimulate the vitality of enterprises’ technological innovation. Finally, the government must continue to adhere to environmental governance and innovate pollution control methods.
CRediT authorship contribution statementYue Hu: Conceptualization, Data curation, Writing – original draft, Methodology, Formal analysis. Chong Wang: Formal analysis, Methodology, Writing – review & editing, Supervision. Xukang Zhang: . Hong Wan: Writing – review & editing. Dan Jiang: Conceptualization, Writing – review & editing, Project administration.
CRediT authorship contribution statementYue Hu: Conceptualization, Data curation, Writing – original draft, Methodology, Formal analysis. Chong Wang: Formal analysis, Methodology, Writing – review & editing, Supervision. Xukang Zhang: . Hong Wan: Writing – review & editing. Dan Jiang: Conceptualization, Writing – review & editing, Project administration.