


The development of high-tech industries in an open economy has become an inevitable requirement for all countries to enhance their competitive advantages and overall national strength. Technological innovation is a direct driving force for promoting high-tech industries’ development. The technological innovation capability of China's high-tech industries over 2010–2019 was measured using factor analysis. Moreover, the spatial pattern and evolution characteristics of the technological innovation capability of high-tech industries were analyzed using the Moran index. The empirical results demonstrate that: (1) during the research period, the technological innovation capability of China's high-tech industries rose, but regional development was uncoordinated. Input-output and transformation guarantee capacities were the main factors influencing technological innovation. (2) Improvements in the technological innovation capability of China's high-tech industries were spread over the southeast coast to the central and southwest regions. The technological innovation capabilities of high-tech industries in different regions exhibited an evident spatial correlation. The spatial agglomeration distribution is relatively stable, mainly characterized by “Low-Low” (L-L) agglomeration. This study offers managerial enlightenment for improving the technological innovation capability of high-tech industries to accelerate industrial development to the middle and high end of the global value chain.
High technology, as an emerging cutting-edge technology, significantly influences changes in the economic landscape of countries. High-tech industries significantly contribute in industrial restructuring and economic transformation. Their development is fundamental for overcoming the middle-income trap and building a modern and powerful country. Their participation in the global value chain (GVC) plays a pivotal role in the country's international status. Accelerating industrial development toward the middle and high ends of the GVC has become a strategic choice for numerous regions.
In 2020, the profits of China's high-tech industries increased by 16.4% year on year, and the profits achieved by high-tech industries were 17.8%. These industries maintained relatively rapid profit growth and, as the industrial segment with the fastest profit growth, strongly promoted the continuous optimization of the industrial profit structure. Owing to its considerable economic benefits and optimizing effect on the existing industrial structure, high-tech industries are important for international economic and technological competition. China classifies high-tech industries into six categories: manufacturing medicines, aircraft and spacecraft and related equipment, electronic and communication equipment, computers and office equipment, medical equipment and meters, and electronic chemicals. The contents of the first to fifth categories in the classification table are linked to the international classification to accommodate international comparison. Technological innovation, as a prerequisite for technological development, is an engine for developing high-tech industries and plays a catalytic role in upgrading the GVC.
This study examines the provincial innovation capacity of high-tech industries in China during 2010–2019. The remainder of this paper is structured as follows: Section 2 provides a literature review. Section 3 elucidates the research methods, indicator systems, and evaluation results. Section 4 introduces the evolutionary characteristics of the spatial pattern. Section 5 concludes.
Literature reviewIn “The Theory of Economic Development”, Schumpeter opined that innovation creates a new production function, introducing new factors and conditions into the production system that never existed before (Schumpeter, 2003). The Organization for Economic Cooperation and Development (OECD) considers technological innovation to include the commercialization of new products and the application of new processes. Innovation encompasses a range of scientific, technological, organizational, financial, and commercial activities. Freeman and Soet (1997) stated that technological innovation is the first commercial transformation of new products, processes, systems, and services. The existing literature possesses rich research on the influencing factors, index systems, and evaluation methods of high-tech industries’ technological innovation capability.
The extent to which influencing factors affect different industries varies significantly (Zhu et al., 2019). As a key to developing high-technology industries, there has been a long-standing debate on the influence of different firm sizes on technological innovation. Scherer (1965) argued for an inverted U-shaped relationship, whereas Kraft (1989) posited that there is no significant relationship. Braga and Willmore (1991) demonstrated a positive relationship; however Lee et al. (2010) suggested that this relationship is negative. Zhou et al. (2017) found that the contribution of research and development (R&D) capability to the innovation incubation capacity of high-tech industries is more important, and Lopez-Garcia et al. (2012) found a positive connection between human resources and industrial-technological innovation capability. Menaker and Ozoliņa (2018) found that government assistance was important in Latvia. The lack of technical experts and complexity of the real estate space were important limiting factors. Chen et al. (2020a) found that government support, R&D investment intensity, industrial agglomeration, outward economic orientation, and the development of modern service industries exhibit different degrees of influence on innovation efficiency. Guo et al. (2022) conceptualized the novel concept of generative capability, a unique capability by which is positively associated with firm innovation performance.Thus, numerous factors influence innovation.
The evaluation index system was constructed using various methods. Yu et al. (2018) studied the key factors in the ecological development of high-tech industries in the Hubei Province. Among the 14 evaluation indicators, the top five were product innovation, cost and exchange rate, knowledge dissemination, industrial structure, and experience accumulation. Sun and Sun (2018) used the social network analysis method to extract indicators step by step and determine the regional science and technology innovation capability evaluation index in China. Primary indicators include the foundation, input, output, and benefits of science and technology innovation. Yao and Ma (2017) selected 13 input and output indicators and identified 12 indicators after the correlation analysis to construct the technical efficiency of the high-tech industry's evaluation model in Jilin Province. Sumrit and Anuntavoranich (2012) designed an evaluation index system based on three dimensions—management, input, and innovation—and found that management capability was the most important influencing factor. Wang et al. (2020) divided technological innovation activities into R&D and commercialization phases, including shared, intermediate, and free intermediate outputs. Their experimental results suggested reduced R&D in high-tech industries in China, however, there is potential for breakthroughs.
There is no single application for evaluation methods and perspectives. Zhu et al. (2019) constructed a semiparametric model to comprehensively compare the factors influencing the technological innovation performance of different high-technology enterprises. Chen et al. (2020a) applied data envelopment analysis (DEA) and a spatial econometric model to measure the innovation efficiency and influencing factors of high-tech enterprises in China. They determined significant differences among provinces. Using factor analysis, distinguishing the impacts of the four main factors on regional innovation capacity is possible (Mikel Buesa et al., 2006). This method can also measure a region's innovative capacity (Martínez Pellitero et al., 2008). He et al. (2018) used factor analysis to compare the competitiveness of high-tech industries in China and discussed their spatial distribution characteristics. Chen et al. (2020b) established spatial lag and error models to empirically test the key factors affecting the spatial spillover of a country's high-tech industry. Their results showed that R&D investment and international trade contribute positively to the spatial spillover of high-tech industries in different regions. Jo et al. (2020) demonstrated that industrial agglomeration in the Korean region enhances the innovation efficiency and capacity of high-tech firms, leading to sustained innovation performance in the region. Seddighi and Mathew (2020) presented a theoretical/empirical framework for the promotion of innovation via enhancement of a firm's core competence, and improvement in its output/product characteristics.To meet their respective needs for the results of evaluation studies, scholars use evaluation methods appropriate for the subject and direction of the study. For example, the Moran index measures the degree of spatiotemporal autocorrelation. Moran scatter plots effectively reveal the characteristics of spatiotemporal clustering patterns and changes in patterns (Shen et al., 2016).
This study contributes to the literature in two respects. First, it enriches the research on the technological innovation capability of high-tech industries by combining the main influencing factors with the degree of spatio-temporal autocorrelation. Existing studies have focused on spatial variation, which has practical implications for national planning studies; however, the analysis in the temporal and spatial dimensions must be supplemented. Second, this study is motivated by the development of a composite indicator system for technological innovation capabilities. This study adopts the factor analysis method to effectively screen the evaluation indicators to eliminate indicators that are not explanatory. Therefore, factor analysis and the Moran index were chosen as the main research methods to evaluate the innovation capability, spatial and temporal distribution characteristics, and spatial autocorrelation of high-tech industries in China. This study's conclusions provide a reference for other developing countries’’ high-tech industries.
Evaluation of technological innovation capability in china's high-tech industriesData sourcesThe data were sourced from the China Statistics Yearbook on High Technology Industry 2011–2020 and the China Statistical Yearbook 2011–2020. Given that the 2018 data from the China High Technology Industry Statistical Yearbook were not included, some of the data relating to 2018 were selected from the China Statistical Yearbook on Science and Technology 2019, and some of the missing data were filled using the mean value method. As the breakdown in the various statistical yearbooks predominantly pertains to the breakdown of manufacturing industries, high-tech industries in this study refer specifically to high-tech manufacturing industries. As the original data for Tibet and Qinghai were incomplete, the analysis did not involve these two provinces, nor did it include Hong Kong, Macao, and Taiwan.
Design of the evaluation indicator systemThis study considers the decomposition of the technological innovation capability system and its constituent elements while considering combining total and relative indicators and qualitative and quantitative indicators, referring to the research results of related literature and features of the high-tech industry. The indicator system is divided into four dimensions: innovation input, transformation, environmental protection, and output capacities. Then, it is decomposed layer-by-layer (Table 1).
Evaluation index system of technological innovation capability of high-tech industries.
The basic idea of factor analysis is transforming multiple indicators into a small number of composite indicators by creating a linear mapping from a high-dimensional to a low-dimensional space using dimensionality reduction. These unmeasured composite indicators are often referred to as common factors. The original variables are grouped based on the magnitude of the correlation such that the variables within the group are more correlated and those between the groups are less correlated. Each group of variables represents a common factor that reflects one aspect of the problem. The variance contribution of several common factors is then used as weights to construct a comprehensive evaluation function, simplifying the numerous original variables and effectively dealing with repetitive information between indicators.
Process of factor analysisSPSS26.0 was used to conduct the factor analysis to assess the technological innovation capability of 29 provinces in China's high-tech industries. In the first screening, variables with an information deficit value greater than 60% were excluded according to the variable commonality scale (D2, D11, D12, D14, and D16).
Factor analysis requires a strong correlation between original variables. Therefore, correlation analysis and testing of variables were required before the factor analysis. The results are presented in Table 2.
Following the criterion of eigenvalues greater than 1, two public factors were selected with a cumulative contribution of 87.381% to the variance. They represent most of the information and fully reflect high-tech industries’ comprehensive development level in China. The corresponding eigenvalues and variance contribution rates for each public factor are listed in Table 3.
To facilitate the classification of the factors, factor loadings on different original variables allowed significant differences. Therefore, the initial factor-loading matrix must be rotated to concentrate it at both ends. The rotated component matrices are listed in Table S1 in the Supporting Information.
The indicators were grouped into two categories, and the factors were named based on indicator rankings; the results are shown in Table 4. The Kaiser standardized orthogonal rotation method was applied to obtain the factor score coefficient matrix. Factor scores were calculated based on their function, the product of the factor score coefficients, and standardized values of each original variable. The results are presented in Tables S2 and S3 in the Supporting Information.
Each factor's combined score was calculated by taking the variance of each factor in the rotated cumulative variance contribution table as the weight of each factor, and the formula was F = 0.868*F1+0.132*F2. The same SPSS calculation can be used to obtain the combined scores of the technological innovation capability of each region and its rankings. For observation, the ranking is sorted in ascending order, as shown in Table S4 in the Supporting Information.
For achieving an enhanced overall analysis, the 29 provinces and municipalities studied were divided based on the National Bureau of Statistics division criteria, as shown in Table 5.
Regional divisions.
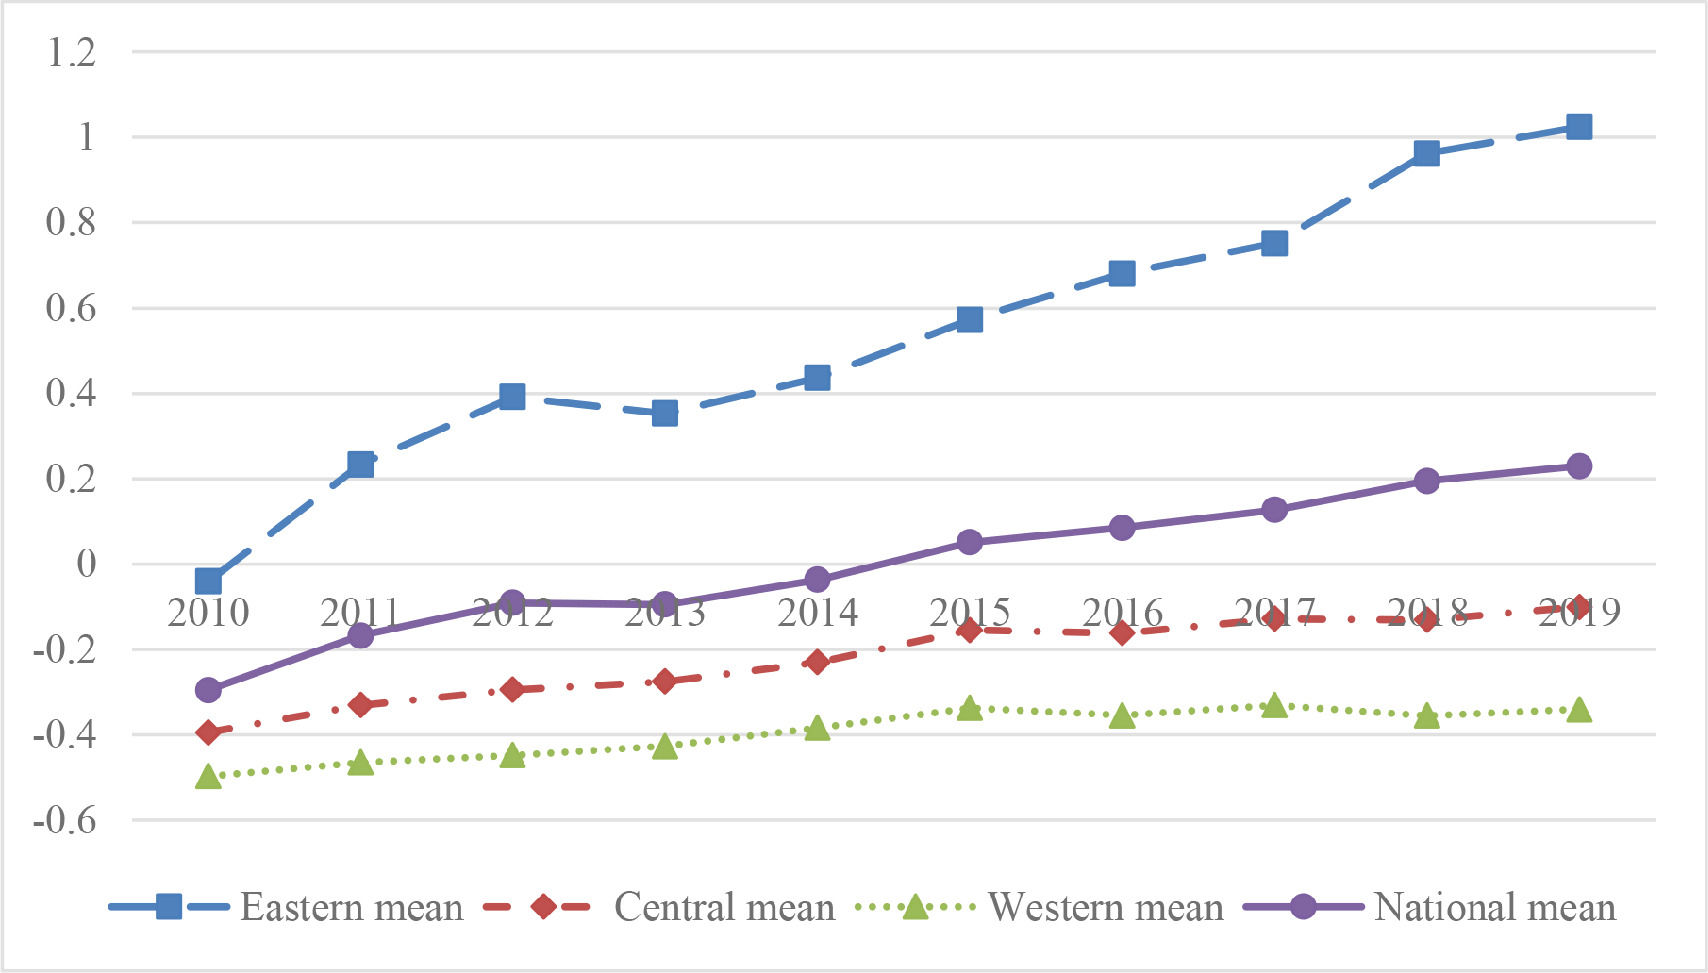
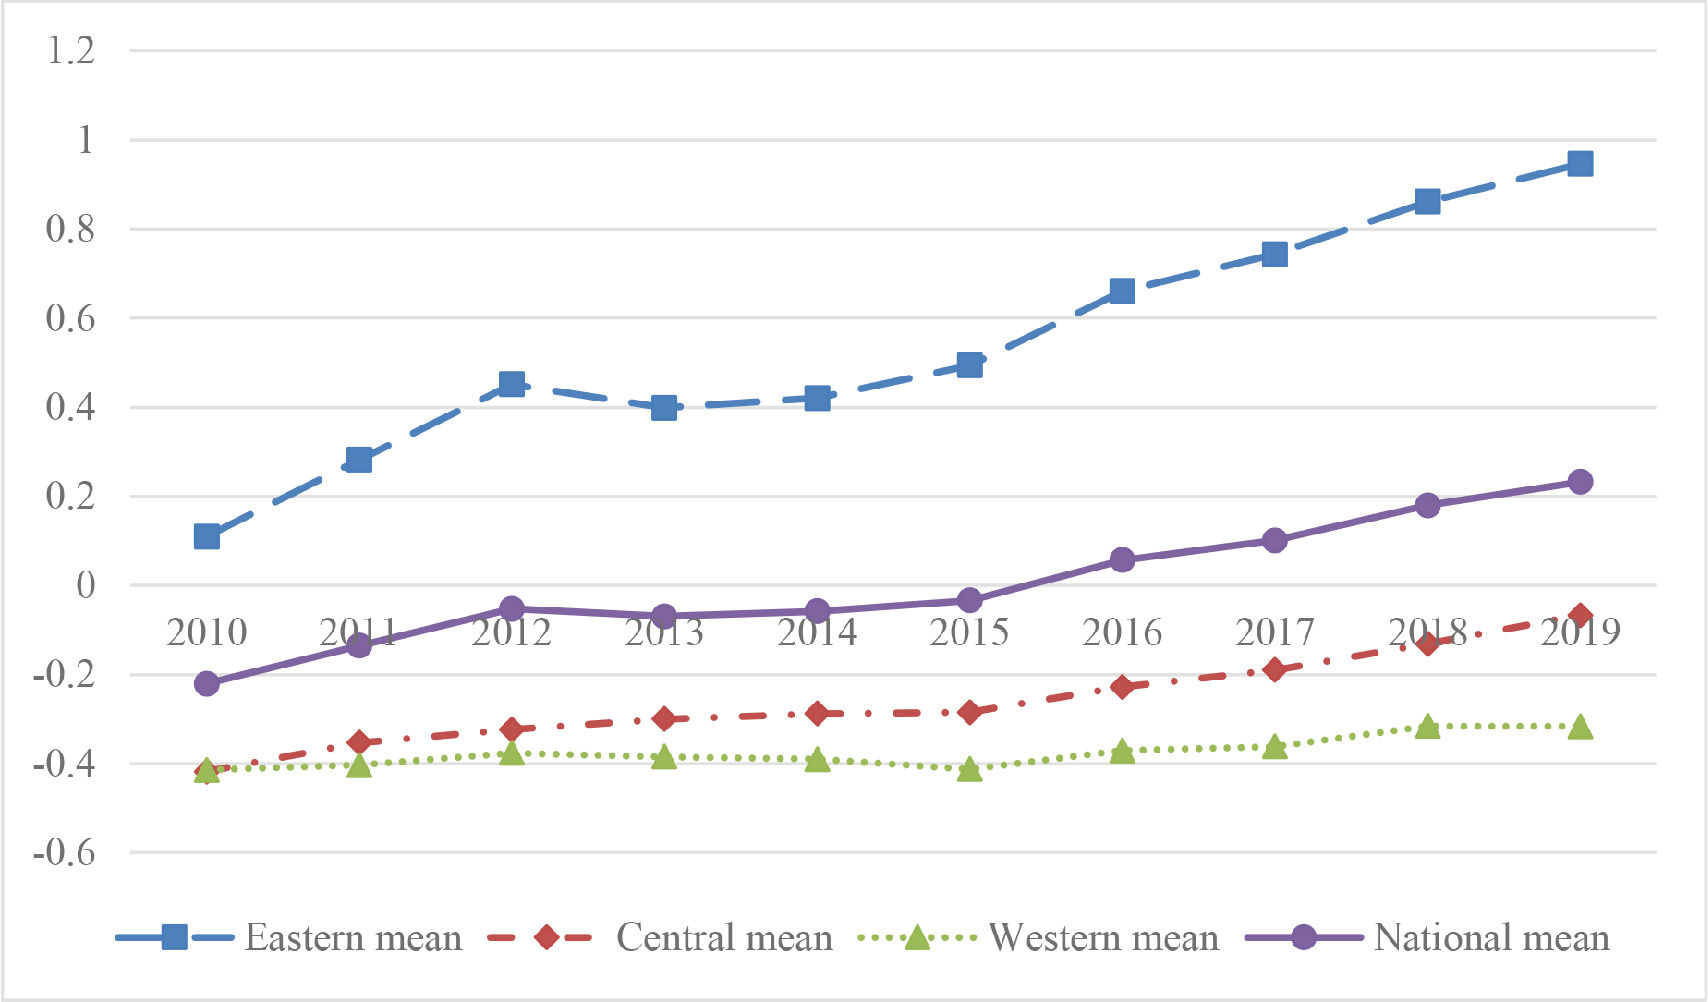
To compare the means of the factor and composite scores of the eastern, central, and western regions with the national average each year, as shown in Figs. 1–3.


Fig. 1 shows that the technological innovation input and output capabilities of high-tech industries in China generally showed an insignificant upward trend during 2010–2019. The eastern, central, and western regions showed clear characteristics of regional heterogeneity, and the gap between the regions expanded. The rising trend is faster in the eastern region and slower in the central and western regions. Table S2 shows that the top 15 regions have eight in the east-central, five in the central, and two in the western regions. The national average trend is mainly consistent with the changes in the central and western regions. Therefore, the central and western regions need to focus on the input and output capacities. However, the technological innovation input and output capacities of the eastern region have grown steadily to enable China's overall technological innovation input and output capacity to achieve effective improvement.
Moran index of technological innovation capability of China's high-tech industries.
Note. * represents the 10% significance level.
Fig. 2 shows that during 2010–2019, the high-tech industry's technological innovation capacity generally showed a “long-tailed U-shaped” trend, declining before rising, with 2015 being an inflection point. Although changes in the East have fluctuated, the region has consistently been above above the national average. The central region has been on an upward trend since reaching its lowest point in 2015. Similarly, the distribution of technological innovation transformation security capacity within the region is uneven, as shown in Table S3, with seven of the top 15 in eastern regions, two in the central region, and six in the western region. Although the eastern region still ranks high, the trend in the national average is mainly consistent with changes in the central region. Thus, efforts should be made to coordinate the strategic arrangements between the eastern and western regions in terms of the transformation guarantee capacity and raising the level of conversion security capacity in the eastern and western regions.
Fig. 3 illustrates that the technological innovation capacity of high-tech industries in China generally showed an upward trend during 2010–2019. The change in trend is almost the same as the technological innovation input-output capacity, which shows that the input-output capacity is the dominant influencing factor of the technological innovation capacity of high-tech industries in China. Thus, the uneven distribution within regions is similar to the differences in the input-output capabilities. Table S4 shows that eight of the top 15 regions were in the central-eastern region, five in the central region, and two in the western region. The technological innovation capacity in the central and western regions did not reach the national average during the study period, which indicates a long journey ahead.
We provide the following summary by examining the results.
- (1)
From the perspective of factor extraction, the main factors influencing the technological innovation capability of high-tech industries are input-output and transformation guarantee capabilities. The input and output are the main forces, the transformation guarantee is the auxiliary force, and the two are complementary. Therefore, enhancing the technological innovation capability of high-tech industries in China by increasing resource input, improving output efficiency, and strengthening environmental safeguard capability, especially government policy and financial support, is necessary to improve technological transformation capability.
- (2)
The scores of the technological innovation capabilities in high-tech industries indicate uneven development between regions in China. The eastern region leads in technological innovation capability, in which regard the central and western regions are weaker. They did not achieve the national average during the study period; further, there is uneven development within regions. Additionally, there is a slight difference in the concentrations of technological innovation input-output and transformation guarantee capacities, with weaker input-output capacity being stronger in technology transformation and environmental safeguards. The Chinese government is aware of this imbalance and has ensured environmental safeguards in capacity coordination to upgrade regions with weaker input and output capacities. Although the state has focused on promoting high-tech industries in the central and western regions, providing policy and financial support, the western regions are clearly weaker than the central regions in transformation guarantee capacity. Considering that most western regions are more geographically isolated and less economically developed, they are limited in the transformation capacity level. They cannot fully integrate resources, including equipment and workforce, with national policy support to facilitate the technological innovation transformation. Meanwhile, the eastern region was the first province and city to implement a coastal opening policy. Thus, it has a higher level of economic development and is the first to enjoy national support and development due to its location (Banwo et al., 2017).
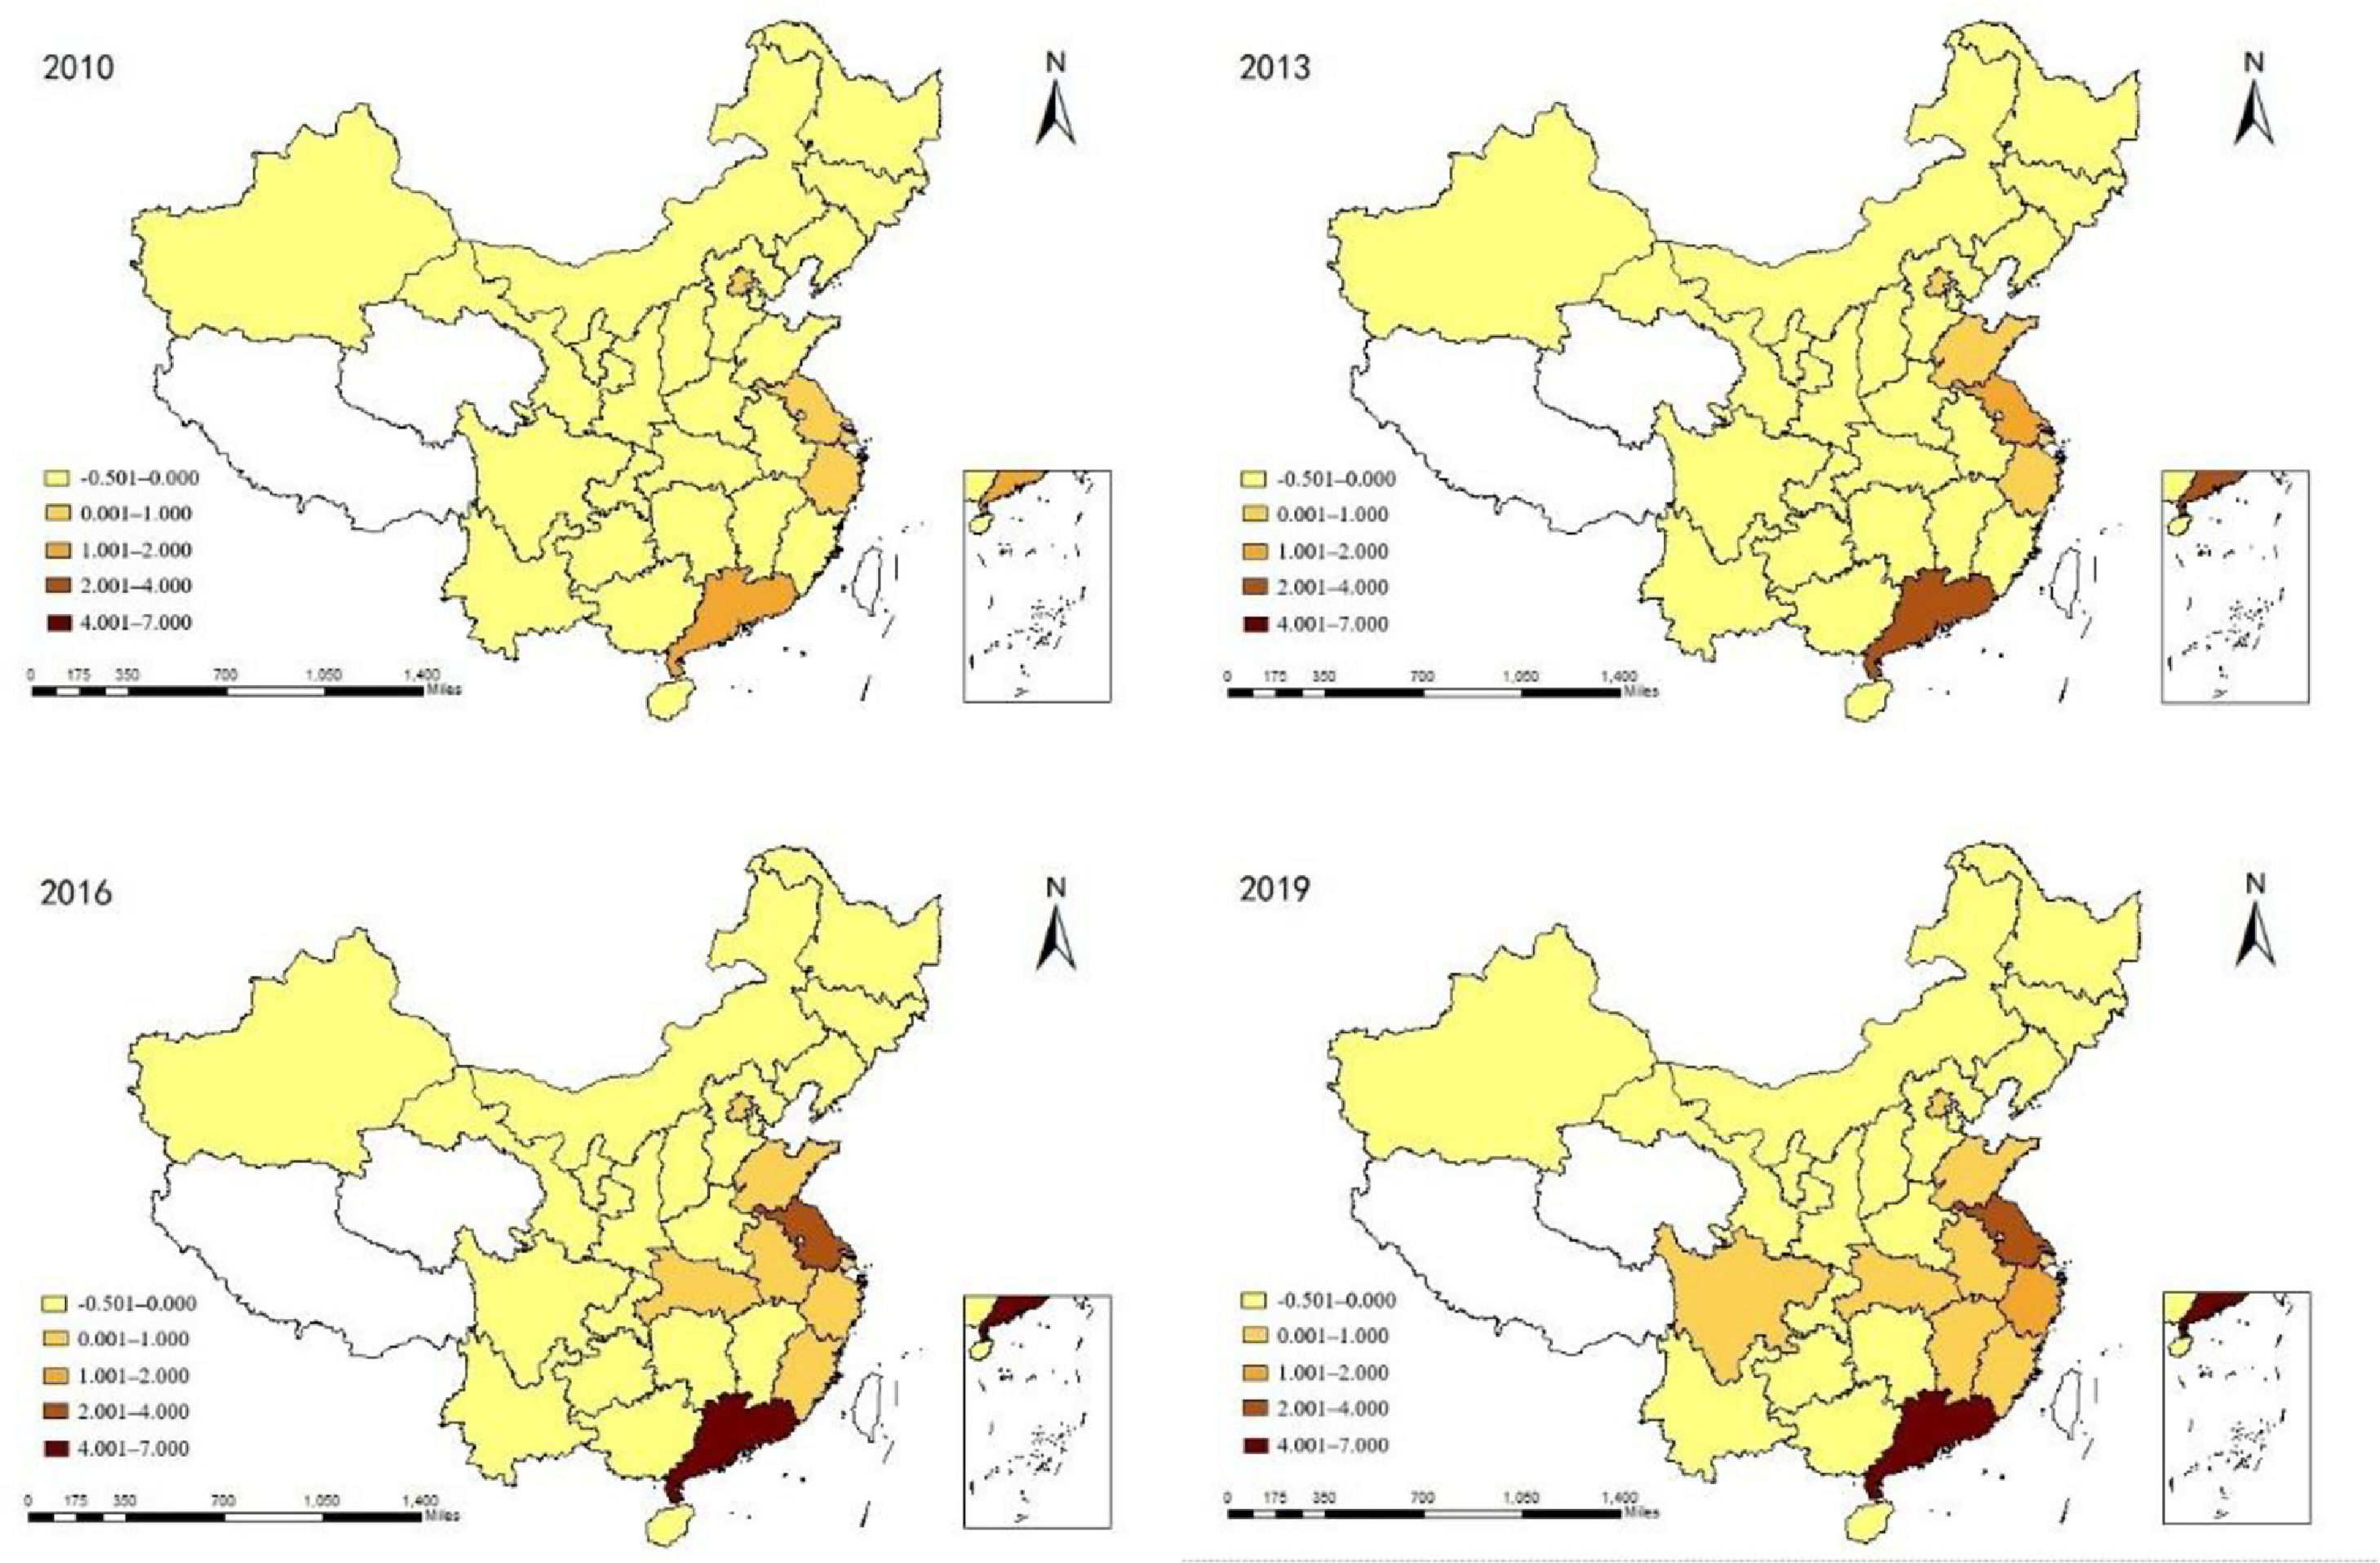
To better demonstrate the spatial and temporal distribution characteristics, we observe the total scores of each region in Table S4. According to the distribution characteristics of the values, the total scores for technological innovation capability over 2010–2019 were divided into five intervals, namely -0.501–0.000, 0.001–1.000, 1.001–2.000, 2.001–4.000, 4.001–7.000. The distribution graphs of the three-year intervals for 2010, 2013, 2016, and 2019 were drawn using ArcGIS 10.2 (Fig. 4) to analyze the distribution characteristics of the composite score of technological innovation capability in different provinces, excluding Tibet, Qinghai and Hong Kong, Macao, and Taiwan.
Results of the analysis of spatial and temporal distribution characteristics
The five regions divided by the total score value were divided into the first, second, third, fourth, and fifth echelons according to the size of the value—from the smallest to the largest. The more regions in the fifth echelon, the darker the color of the regions in the graph, and the higher the level of technological innovation in China's high-technology industry. Based on Fig. 4, the specific analysis is as follows.
Regarding changes in the number of echelons, most regions remained in the first echelon during the study period. In contrast, regions in the second echelon increased from five in 2010 to 11 in 2019. Regions in the third echelon and above increased from one region in 2010 to three in 2019, indicating a steady increase in the technological innovation capability in high-tech industries in China. However, the gradients are insignificant, and there are insufficient high-level areas. In 2019, only one region was in the 3rd, 4th and 5th echelons, Zhejiang, Jiangsu, and Guangdong, which were also ranked in terms of input and output capacity. However, a wide gap exists in transformation guarantee capacity, with Zhejiang scoring 1.480 (ranked 3rd), Jiangsu scoring 1.563 (ranked 1st), and Guangdong scoring -0.220 (ranked 22nd), thereby demonstrating the importance of input-output efficiency for technological innovation capacity enhancement.
Regarding changes in the geographical distribution of each echelon, the spatial echelons of technological innovation capabilities in high-tech industries in China changed significantly during the study period, with higher levels in the southeastern coastal regions and lower levels in the northeast and other inland regions. Over time, with Jiangsu, Zhejiang, and Guangdong as the centers, the technological innovation capabilities of the surrounding regions spread and penetrated the inland regions. This indicates that national policies are steadily advancing, with the strategy for the rise of the central region and for the evolution of the western region gaining in terms of technological innovation in high-tech industries, promoting the coordinated development of all regions.
Spatial autocorrelation analysis of technological innovation capabilities in high-tech industries of ChinaTo further examine whether the technological innovation capability of high-tech industries in China is agglomerative, the global Moran index was used to show the degree of difference in globally relevant industries. Simultaneously, to reflect the spatial dependence between a region and its neighbors in more detail, the local Moran index was used to scale the degree of spatial agglomeration of the technological innovation capability of high-tech industries.
Moran indexSpatial correlation analysis was used to characterize the degree of clustering and dispersion of the distribution of the same variable in different regions. The stronger the spatial correlation, the more concentrated the distribution.
- (1)
Global spatial autocorrelation
The Global Moran's I is generally used to represent the correlation characteristics of the spatial distribution and is calculated by the following Eq. (1).
Xi is the area observation, and Wij is the spatial weight matrix, where x¯ and s2 are the mean and variance of the area observation, respectively. The spatial weight matrix is a 0-1 matrix generated by the Geoda software. The value of the spatial weight matrix corresponding to two adjacent regions is 1, while that corresponding to two non-adjacent regions is 0. The Global Moran's I takes the value interval [-1,1]. When the value is in the interval [0,1], the attribute shows a spatial clustering phenomenon, and the larger the value, the stronger the spatial correlation. When the value is in the interval [-1, 0], the attribute tends to be discrete; the smaller the value, the more pronounced the dispersion. When the value is 0, the attribute is randomly distributed in space, and there is no clustering or dispersion.
- (1)
Local spatial autocorrelation
The Global Moran's I was decomposed into individual cells to test for the presence of localized agglomeration. The Local Moran's I reflects the agglomeration characteristics of the different areas. The LISA distribution was plotted using GeoDa software, containing four distribution patterns: “High-High” (H-H) clustering, “Low-Low” (L-L) clustering, “High-Low” (H-L) clustering, and “Low-High” (L-H) clustering. The formula for calculating the Local Moran's I is shown in Eq. (2).
A Local Moran's I greater than 0 indicates the existence of H-H agglomeration or L-L agglomeration in the area. When it is less than zero, it implies an H-L agglomeration or an L-H agglomeration in the area.Process of spatial autocorrelation analysis
(1)Analysis of global spatial autocorrelation
This study uses the 0-1 spatial weight matrix constructed by GeoDa to measure the spatial global Moran index during 2010–2019, using stata16.0 software to analyze the spatial correlation of the technological innovation capability of high-tech industries in China. Table 6 presents the results.
(2)Analysis of local spatial autocorrelation
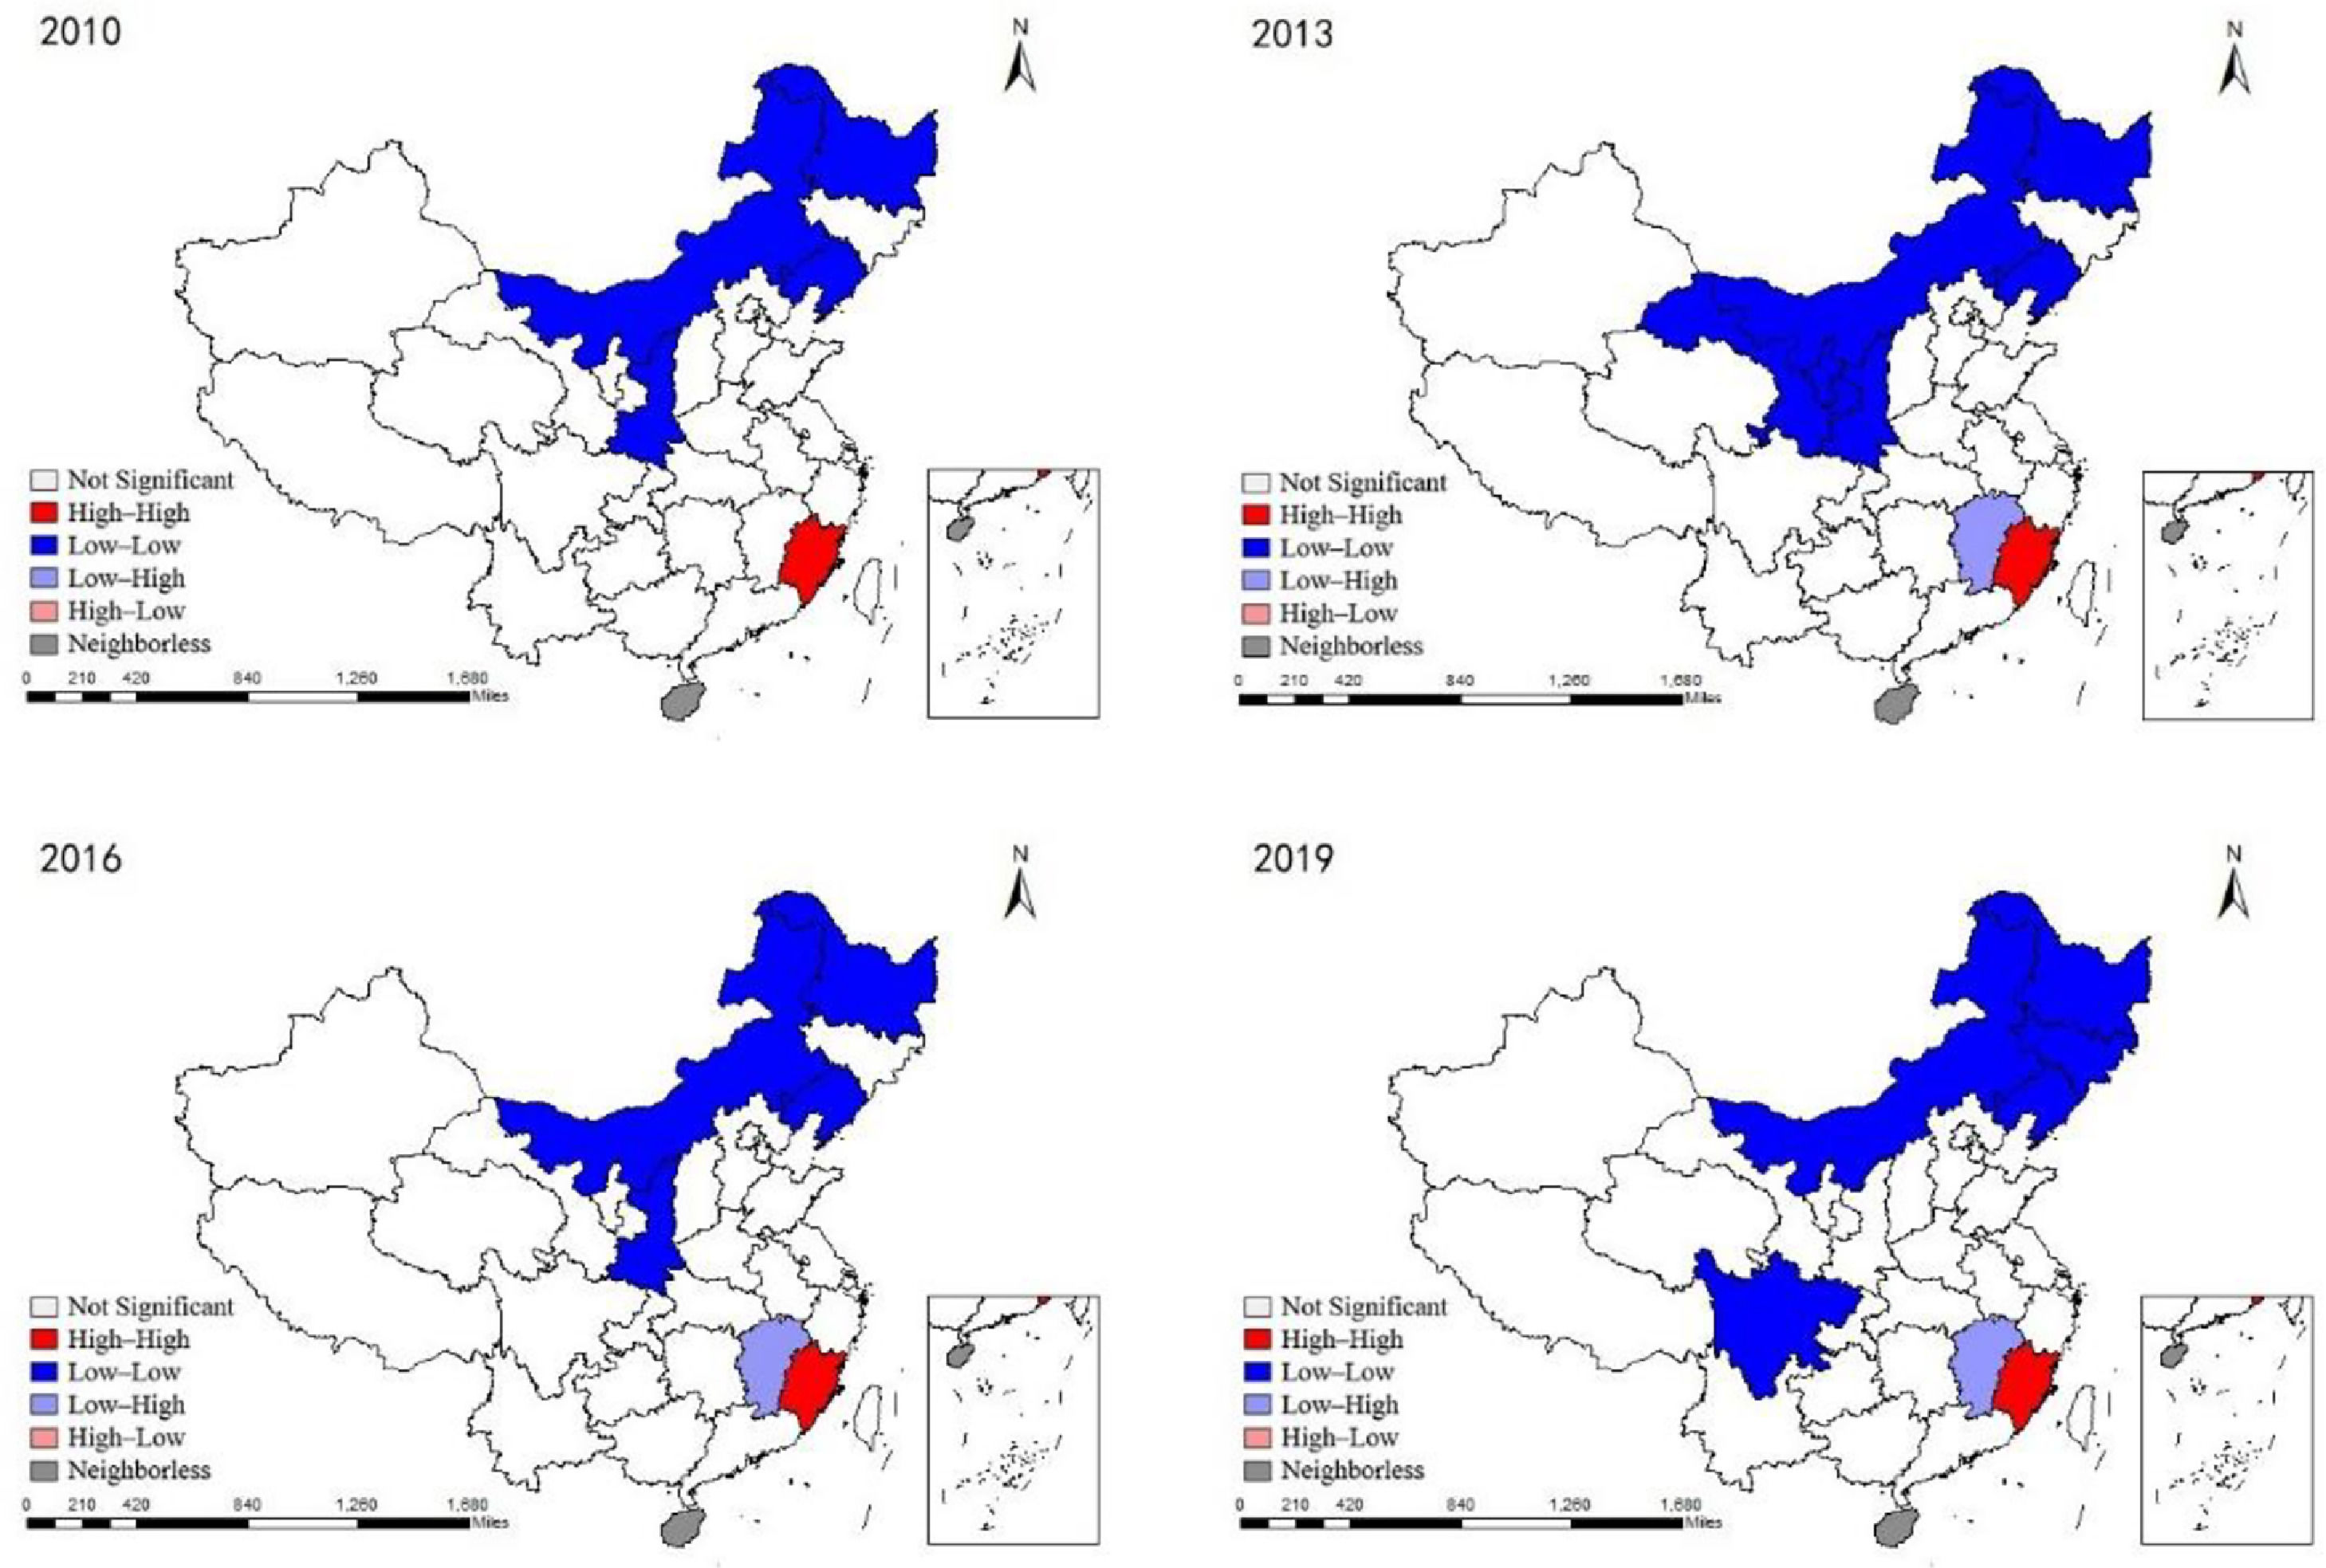
This study uses GeoDa software to draw LISA scatter plots of the local Moran's I for 2010, 2013, 2016, and 2019, with the four distribution patterns to reflect further the spatial agglomeration distribution characteristics of the technological innovation capability of high-tech industries in China (shown in Fig. 5). The analysis does not include Hainan Province, as no neighboring provinces exist.
Results of spatial autocorrelation analysis
(1)Outcome of the global spatial autocorrelation analysis
Table 6 shows that the global Moran index values for 2010–2019 are all greater than 0, and the p-values are all significant at the 10% confidence level. This means that the technological innovation capability of high-tech industries in China is not randomly distributed. There is also a positive spatial correlation between them. Considering the global Moran Index value, although it fluctuated during 2010–2015, it consistently remained above 0.1. However, since 2016, the value has been less than 0.1 and has declined significantly over 2016–2018, falling to the lowest point of 0.0589, implying the relevance of the technological innovation capability of the high-tech industry of China as a whole gradually weakens. Accordingly, it can be inferred that the spatial spillover effect of China's high-tech industries is not strong, and the regional driving effect is not evident.
(2)Results of local spatial autocorrelation analysis
According to the LISA scatter diagram in Fig. 5, each province can be divided into four different spatial correlation states. The first is the “H-H” agglomeration, showing that the technological innovation capacity of the region as well as that of the neighboring regions is high. This is the spatial correlation of high-level regions. The second is the “L-L” agglomeration, showing that the technological innovation capacity of the region as well as that of the neighboring regions is low, a spatial correlation of low-level regions. Thirdly, the “L-H” agglomeration indicates that the region's technological innovation capacity is low. Nevertheless, the technological innovation capacity of the neighboring regions is high and is catching up with development; thus, the spatial correlation is expressed as the development stage. The fourth is the “H-L” agglomeration, which indicates a high level of technological innovation capability in the region. However, the level of technological innovation capability in the neighboring regions is low. Therefore, the increase in technological innovation capability in the region has a countereffect on the level of technological innovation capability in the neighboring regions; hence, the spatial correlation indicates the inverse development stage.
Fig. 5 shows only three spatial correlation states: “H-H”, “L-L” and “L-H” agglomerations, and the main focus is on the “L-L” agglomeration. The “L-L” agglomeration is predominant in the northeast and southwest regions; the “H-H” agglomeration and the “L-H” agglomeration are in the southeast region; and the agglomeration status of each region is relatively stable, with no evident changes. Fujian, located in southeastern China, is the only “H-H” agglomeration, while Jiangxi, a neighboring province, is the only “L-H” agglomeration. This suggests that the southeast coastal region has a strong industrial base, transportation network coverage, and development of basic industries. However, the desirable locational advantage is bound to provide a better external environment to support the development of high-tech industries’ technological innovation capacity. This spatial agglomeration is characterized by the radiation of high-tech industrial centers, such as the Shanghai High-Tech Zone and Shenzhen High-Tech Zone. The Northeast and Southwest regions are the main distribution areas of the “L-L” agglomeration. Due to the large gap in economic development and industrial structure, these regions have not benefitted from the spillover and driving effects of the regions with high technological innovation capacity, resulting in insufficient innovation power.
Conclusions and recommendationsConclusionsThis study evaluates the technological innovation capabilities of high-tech industries in China's 29 provinces and analyzes the evolution characteristics of their spatial patterns between 2010 and 2019.
- (1)
Overall, the development of technological innovation capability in high-tech industries in China for 2010 –2019 exhibited an upward trend. Notably, the development was unbalanced in the eastern, central, and western regions. The eastern region exceeds the national average, whereas the western region is developing slowly. However, there is an imbalance in the development within the region. Additionally, input-output and transformation guarantee capabilities are the main factors influencing technological innovation capability.
- (2)
Regarding spatial changes, the increase in high-tech industries’ technological innovation capacity shows a trend of spreading from the southeast coast to the central and southwest regions. The high-level areas are mainly centralized in Zhejiang, Jiangsu, and Guangdong. The development differences between these three regions are mainly concentrated in the gap between technological innovation input-output capacities. The transformation guarantee capacity is more auxiliary to the effective realization of input and output. This shows that the improvement in technological innovation capacity in high-tech industries lies in the efficiency of inputs and outputs, rather than relying solely on external financial support to improve. Most regions have incomplete echelon crossing and remain in the lower echelons. During the study period, the technological innovation capability of high-tech industries in China exhibits a relatively significant spatial correlation, with the global Moran index being greater than 0. However, this correlation tends to weaken. The agglomeration status of each region is relatively stable, indicating that the development of high-tech industries is related to the geographical location and economic development level of each region.
Based on the above findings, the following countermeasures and suggestions are proposed to promote the technological innovation capability of high-tech industries and accelerate industrial development toward the middle and high ends of the GVC.
- (1)
Strengthen effective investment in human and financial resources and improve the mechanism for transforming technological achievements. The selected indicators are well represented in terms of human and financial resources, among the main influencing factors. Therefore, we should strengthen human resources and financial investments to improve technology output capacity and improve the mechanism for transforming scientific and technological achievements to enhance the input-output capacity. Local governments should provide sufficient human and financial resources for innovation in high-tech industries. China needs time to build science-based innovation capacity, even now with large R&D investments. However, guiding high-tech enterprises to effectively connect with the capital market and attract R&D investments from non-government sectors is necessary. Building a government-enterprise-market multi-party integration platform to help high-tech enterprises quickly find resources and improve the efficiency of technological innovation is crucial. It cannot be ignored to consider the impact of standards on the efficiency of techno-economic activity in high-tech industries (Tassey, 2018). Further, it is vital to consider the U-shaped relationship between intellectual property protection and technological innovation in high-tech industries (Liu et al., 2018).
- (2)
Strengthen industrial collaboration and technical exchanges to narrow inter-provincial differences. The spatial transfer of high-tech industries can be implemented orderly to improve the technological innovation capacity in the central and western regions. This requires the western region to provide complete supporting policies for the transferred high-tech enterprises. It is necessary to use the industrial value chain linkage to promote scientific and technological innovation resource flow between regions and form an orderly and win-win spatial distribution pattern. Knowledge-sharing is the core of enhancing the technological innovation capability of enterprises (Sáenz et al., 2009). Additionally, breaking down local protectionism by establishing a regional development coordination mechanism to avoid duplication and the waste of limited human and financial resources is necessary. Nevertheless, the relevant departments of the central government should coordinate the layout of high-tech industries and provide preferential policies for the western region to attract foreign direct investment and domestic industrial transfer.
- (3)
Promote high-quality development of high-tech industrial agglomerations and enhance the complementary and spillover effects of technological innovation. The construction of high-tech industrial agglomerations should consider the geographical, historical, and cultural differences between regions and the current state of industrial development to maximize the spatial complementarity and spillover effects, enhancing the technological innovation capacity of China's high-tech industry. However, we should be wary of the inhibitory effect of industrial diffusion on coordinated regional economic development (Zheng et al., 2019). For example, the Chengdu-Chongqing Economic Zone and Beibu Gulf Economic Zone represent high-tech industrial development in the western region. Therefore, these economic zones should be encouraged to use their unique resource, location, and policy advantages to create an ecosystem of high-tech industries within the economic zones.
The study is supported by the MOE (Ministry of Education in China) Project of Humanities and Social Sciences (18YJA630105), the National Social Science Fund of China (20BGL113; 21AZD067), and Key Research Base of Universities in Jiangsu Province for Philosophy and Social Science "Research Center for Green Development and Environmental Governance" is highly appreciated by authors of this study. Moreover, we gratefully acknowledge the editors and anonymous referees for their helpful suggestions and corrections on our manuscript's earlier version, according to which we improved the content.