


The institution-based view of strategy has emerged as a leading perspective in Strategic Management. It incorporates the institutional dimension when offering relevant answers to the fundamental questions of strategy. One of the challenges of this perspective is to develop stronger measures of institutions (Peng et al., 2009). This paper seeks to contribute in this direction by offering a detailed analysis of the main measures of institutions that previous works in Strategic Management have used. Our aim is to offer a guide that will help researchers to decide how they should incorporate the institutional dimension into their empirical work.
The field of Strategic Management has been traditionally governed by two big paradigms. While the 1980s were characterized by the dominance of the industry-based view (Porter, 1980), the 1990s were clearly the decade of the resource-based view of the firm (Barney, 1991). In recent decades, the two perspectives have moved like swings of a pendulum in the search for the answers to the fundamental questions of strategy (Hoskisson et al., 1999). In recent years, a third leading perspective seems to have conditioned the movement of the pendulum between these two important frameworks and has emerged in Strategic Management: the institution-based view (Peng et al., 2009). This perspective, with roots in both the economic – institutional economics – (North, 1990; Williamson, 1985) and sociological – institutional theory – literature (DiMaggio and Powell, 1983; Scott, 1995), incorporates the role of institutions in understanding why firms differ in terms of competitive advantage.
On the one hand, its emergence responds to external pressures from the new institutionalism movement in the social sciences in recent decades (North, 1990; Scott, 1995; Peng et al., 2009). On the other, its appearance seems to obey internal forces within the Strategic Management domain. In particular, the lack of attention to certain macro-contextual aspects by the industry and resource-based views has been important to promote the institutional perspective. The recognition of the relevance of institutions for competitive advantage is important so that they cease to be treated as background conditions or control variables (Peng et al., 2008). This recognition is also strongly related to Bamberger's (2008) claim for a more formal inclusion of contextual factors (e.g. institutions) in existing models that attempt to further advance management theories.
In the last decade, the institution-based view has been mainly used in the international business literature (Peng et al., 2008; Peng, 2009), particularly in the study of emerging economies (Cuervo-Cazurra and Genc, 2011; Cuervo-Cazurra, 2012). However, its use is increasing in Strategic Management in broader terms and some authors suggest that it should be understood as a complementary perspective to the industry- and resource-based views (Peng et al., 2009). This new paradigm is extremely young in the Strategic Management discipline and one of its challenges in the next few years is to demonstrate the importance of institutional factors for our understanding of competitive advantage.
It has been argued that, before its consolidation, the institution-based view needs to develop stronger measures of institutions (Peng et al., 2009). A first step in this direction would be to take stock of the available measures, analyzing their features and the interrelationships arising between them. Our objective in this paper is precisely this: to provide a guide that will help researchers to incorporate the institutional dimension of strategy into their empirical works by characterizing the different measures used in the literature. We first introduce the institution-based view of strategy and depict some of the areas in which the theory is more promising. Second, we focus on the practicalities of the application of this framework for the analysis of research questions in the Strategic Management arena. More precisely, we attempt to shed some light on the different alternatives available to scholars when incorporating the role of institutions into their empirical work. Although our intention is not to deal with all the measures that could be used to introduce the institution-based view of strategy, we analyze the wide variety of measurements that worldwide public sources offer to characterize the institutional environment. This analysis can be used as the benchmark against which new measures of institutions may be proposed in the future. We follow extant institutional studies and distinguish between formal and informal institutions (North, 1990), where the former are understood as laws, rules and regulations, and the latter as culture, norms and values. They are different but complementary sides of the coin that offer a complete picture of the institutional environment.
The institution-based view of the firmDefinition and rootsBroadly speaking, institutions can be understood as the rules of the game in a society (North, 1990; Williamson, 1998). According to North (1991), they are the humanly devised constraints that structure political, economic and social interaction. They impose restrictions by defining legal, moral and cultural boundaries, setting off legitimate from illegitimate activities (Scott, 1995: 50). From a theoretical point of view, one of the major focuses of the literature on institutions has been on considering them as efficient solutions to problems of organization in a competitive framework (Williamson, 1975).
Although the early study of institutions can be traced back to the last decades of the 19th century, the emergence of the new institutionalism did not occur until the 1950s (Scott, 2008). As in Peng (2002), we use the term to refer to two independent streams of research that consider the role of institutions within society. The first, economic in nature, has its roots in the works of Coase (1937) and Williamson (1994, 1998). These authors considered formal and informal institutions as “background conditions” and focused on the determinants of choosing between different governance structures (e.g. markets vs. firms) to reduce transaction costs. By contrast, North (1990) mainly focused on formal and informal institutions as direct determinants of transaction costs in an economy. The evolutionary economics approach complements the static viewpoint of transaction cost economics by suggesting that firms continuously adapt their routines to the institutional framework through “an endogenous, experience-based learning process” (Knudsen, 1995: 203).1
Whereas the first stream of research has economic foundations and focuses on efficiency, the second viewpoint is sociological in nature, focuses on the role of legitimacy (Peng, 2002) and its main interest is to understand the role of institutions in explaining why organizations are similar. Under this perspective, the concept of isomorphism is based on the need to conform to what certain resource providers that are vital for organizational survival deem appropriate (Hambrick et al., 2005). Following DiMaggio and Powell (1983), pressure from societal institutions and collective rationality among organizations are the key elements to understand homogeneity. In other words, from this perspective, institutional support depends on a “general perception of organizational actions as desirable, proper or appropriate within some socially constructed system of norms, values, beliefs and definitions” (Suchman, 1995: 576).2
The institution-based view of strategy is the result of a consideration of both these streams of research in the context of business strategy. It conceives strategic choices as the result of the dynamic interaction between organizations and the formal and informal institutional environment (Peng, 2002).
The institution-based view of strategyThe field of Strategic Management has evolved a great deal since its inception. During the 1960s, the discipline paid attention to studies that focused on the importance of managerial skills (Andrews, 1971; Ansoff, 1965; Chandler, 1962). The 1980s were characterized by the role that industry structure played in determining differences in performance between firms, while the 1990s saw the birth of a new dominant paradigm, the resource-based view of the firm (Barney, 1991; Peteraf, 1993; Wernerfelt, 1984). The 21st century has rescued the environment as a key determinant in the analysis of firm behavior and performance. However, this analysis does not only focus on the industry-specific environment, as happened in the 1980s, but also highlights the institutional environment. As a consequence, recently a third leading perspective has emerged in strategic management. This perspective has been named the institution-based view (Peng et al., 2009).
One of the reasons that could explain the recent interest in this new paradigm is the globalization process that has affected most industries in the last years (Dunning and Lundan, 2008). This has also motivated an increase in academic research attempting to understand the origins of competitive advantage in international contexts. Although variations in the two components of the institutional environment, formal and informal, could be important within national contexts, it seems clear that its elements should present the highest differences when different countries are taken into account.
It is important to stress the intrinsic potential of this framework in order to answer relevant questions for business strategy. Previous literature has used some institutional dimensions before, but the link with what is called the institution-based view of strategy has only been implicit. Nevertheless, the use of the institution-based view of strategy, as an integrated framework for the understanding of competitive advantage, is more recent. In practical terms, this means that the variety of topics to which it has been applied and the depth of the analyses performed are still limited and call for further research. Following Bamberger (2008), the potential for contributions in this area should not just consist of the incorporation of control variables that help to provide an ad hoc understanding of some prevailing results in the literature, but should be an ex ante exercise in which the institutional framework is incorporated into the theories of strategic management.
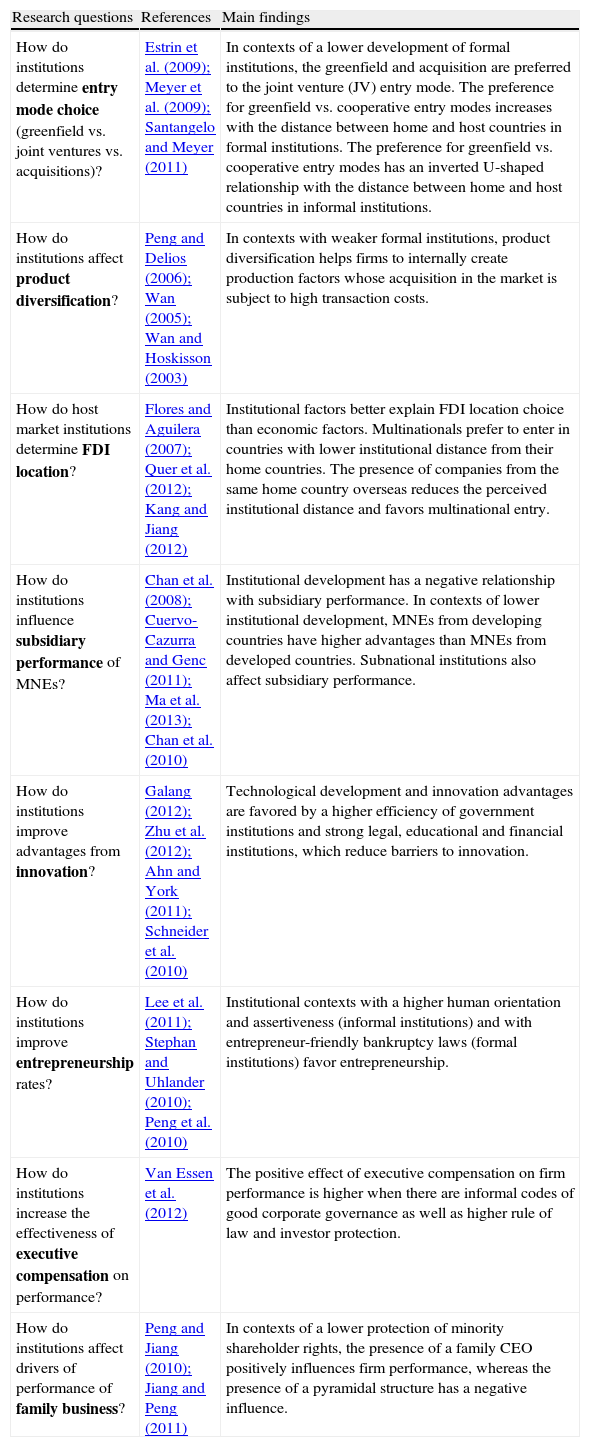
The opportunity for this framework to interact with extant business strategy research can be assessed by considering the questions that have been deemed as important from the institution-based view (Peng et al., 2009), namely, (1) how do firms behave? (2) why are firms different? (3) what determines the scope of the firm?, and (4) what determines the success or failure of the firm in international competition? (Rumelt et al., 1994: 2). A first step in the search for the corresponding answers from the institution-based view has already started. Recent papers, since the seminal work of Peng (2002), have tried to analyze how institutions condition strategic choices (e.g. FDI location and entry mode, innovation adoption, executive compensation and entrepreneurship) as well as performance (e.g. from family and multinational firms). Table 1 shows several examples of the research questions that previous papers have tackled taking the institution-based view as a theoretical framework and some of their main findings.3 Some of these questions are clearly related to the four broad areas delineated by Rumelt et al. (1994). For example, institutions have been related to the behavior of firms by considering how they determine entry mode choices, how they affect product diversification decisions or how they condition foreign direct investment locations. In the case of the latter, for instance, it has been found that, in contexts of low development of formal institutions, firms tend to prefer acquisitions and greenfield entries, rather than joint ventures (for more details, see Table 1).
Examples of existing research questions and findings from the IBV.
| Research questions | References | Main findings |
| How do institutions determine entry mode choice (greenfield vs. joint ventures vs. acquisitions)? | Estrin et al. (2009); Meyer et al. (2009); Santangelo and Meyer (2011) | In contexts of a lower development of formal institutions, the greenfield and acquisition are preferred to the joint venture (JV) entry mode. The preference for greenfield vs. cooperative entry modes increases with the distance between home and host countries in formal institutions. The preference for greenfield vs. cooperative entry modes has an inverted U-shaped relationship with the distance between home and host countries in informal institutions. |
| How do institutions affect product diversification? | Peng and Delios (2006); Wan (2005); Wan and Hoskisson (2003) | In contexts with weaker formal institutions, product diversification helps firms to internally create production factors whose acquisition in the market is subject to high transaction costs. |
| How do host market institutions determine FDI location? | Flores and Aguilera (2007); Quer et al. (2012); Kang and Jiang (2012) | Institutional factors better explain FDI location choice than economic factors. Multinationals prefer to enter in countries with lower institutional distance from their home countries. The presence of companies from the same home country overseas reduces the perceived institutional distance and favors multinational entry. |
| How do institutions influence subsidiary performance of MNEs? | Chan et al. (2008); Cuervo-Cazurra and Genc (2011); Ma et al. (2013); Chan et al. (2010) | Institutional development has a negative relationship with subsidiary performance. In contexts of lower institutional development, MNEs from developing countries have higher advantages than MNEs from developed countries. Subnational institutions also affect subsidiary performance. |
| How do institutions improve advantages from innovation? | Galang (2012); Zhu et al. (2012); Ahn and York (2011); Schneider et al. (2010) | Technological development and innovation advantages are favored by a higher efficiency of government institutions and strong legal, educational and financial institutions, which reduce barriers to innovation. |
| How do institutions improve entrepreneurship rates? | Lee et al. (2011); Stephan and Uhlander (2010); Peng et al. (2010) | Institutional contexts with a higher human orientation and assertiveness (informal institutions) and with entrepreneur-friendly bankruptcy laws (formal institutions) favor entrepreneurship. |
| How do institutions increase the effectiveness of executive compensation on performance? | Van Essen et al. (2012) | The positive effect of executive compensation on firm performance is higher when there are informal codes of good corporate governance as well as higher rule of law and investor protection. |
| How do institutions affect drivers of performance of family business? | Peng and Jiang (2010); Jiang and Peng (2011) | In contexts of a lower protection of minority shareholder rights, the presence of a family CEO positively influences firm performance, whereas the presence of a pyramidal structure has a negative influence. |
Two main conclusions arise from the review of the literature that considers the role of institutions in the context of strategy. The first is that the theory suggests that the institution-based view of strategy could have a central role in the development of strategy research. For example, recent research equates the so-called influence rents with the four types of rents (monopolistic, efficiency, quasi-rents and Schumpeterian) on which research on strategic management articulates our comprehension of competitive advantage (Ahuja and Yayavaram, 2011). Influence rents are the “extra profits earned by an economic actor because the rules of the game of business are designed or changed to suit an economic actor or a group of economic actors” (Ahuja and Yayavaram, 2011: 1631). Therefore, they are the result of considering business strategy in the context of institutions from which economic rents may be extracted. This perspective on institutions seems to call for an even more central role of their interaction with business strategy, and it also suggests new relevant directions for research. Two examples of these questions are the following (Ahuja and Yayavaram, 2011). First, whether influence rents may provide firms implementing them with a sustainable improvement in performance, given the persistence of many institutions. Second, whether influence rents interact with the other four types of rents to provide the firm with competitive advantage.
Furthermore, our review also shows the variety of topics on which the institution-based view may be applied and the gap that exists between theory and empirics. Although it is not our objective to be exhaustive, some examples in which the theory could be applied to the analysis of topics of traditional interest for strategy researchers can be easily depicted. For example, the consideration of the institution-based view of strategy in the context of first-mover advantages could lead to an improved understanding of the advantages accruing to pioneers in an international context. This study could help to conciliate some of the conflicting evidence on the topic by incorporating the macro-contextual factors determining performance to which we referred above. Another opportunity arises in multimarket competition theory. It is highly likely that the variation in the institutional characteristics of countries could affect the coordination capabilities of firms and, hence, the opportunities for mutual forbearance. For example, the different regulatory conditions prevailing in the different countries forming the market domains of firms or the cultural distances between these countries could affect the ability of multinationals to coordinate their international operations and their ability to collude with other multimarket firms (see, for example, Yu et al., 2009).
A second conclusion from our review is that the majority of papers focus on non-developed and emerging countries (China, India and Malaysia are three examples). This is unsatisfactory because, in this way, research on institutions renounces the exploration of a part of the variation of the underlying dimensions of institutions. The decomposition of the institutional environment, together with the combination of a larger set of different countries, could help in the task of effectively integrating the institution-based view into business strategy research. Ahuja and Yayavaram (2011: 1646) stress the possibility that (1) different sets of institutions may “be strong and well developed in a nation relative to other types of institutions in that nation” and (2) the level of development of a given set of institutions may vary across different nations. Therefore, opportunities arise for the exploitation of the sources of variation within and across different institutional contexts. Perhaps the most evident source of variation is the one that arises when considering the different countries in which firm strategies could be implemented. In this context, the comparison between developed, non-developed and emerging countries seems to be a fruitful avenue for research.
Measuring institutionsTypes of institutionsAs mentioned above, our main objective in this paper is to provide a guide for measuring institutions by taking stock of the available measures. A first step in this direction is to distinguish between the different types of institutions that can be identified. We closely follow the widely accepted classification of North (1990), which distinguishes between formal and informal institutions.
Formal institutions refer to explicit rules in a society such as laws, regulations, property rights protection or discipline of economic and political markets and contracts (Dunning and Lundan, 2008; Meyer et al., 2009). They have to be explicitly established by an authority or an organization/individual. They are susceptible to change over time and can anticipate the desirable behavior of individuals and organizations from general and simple exchanges (e.g. through laws) to specific and complex ones (e.g. by a contract or a judicial resolution).
Informal institutions can be understood as those constraints that people in a society impose upon themselves to give a structure to their relations with others (North, 1990). These rules are transmitted from one generation to another by teaching and imitation (Boyd and Richerson, 1995) and, according to North (1990: 37), are a part of the heritage that we call culture. Tradition, religion, language, customs, values and trust-based relationships are some examples of informal institutions (Dunning and Lundan, 2008). Unlike formal institutions, informal institutions have their source in the values of a society and are difficult to change over time (North, 1990).
One of the main challenges for researchers attempting to integrate extant research on business strategy and the institution-based view of the firm is to obtain information on these two dimensions. In order to select the measures to analyze, we have imposed three criteria: (1) they have to be frequently used in the (Strategic) Management literature, (2) they also have to be publicly available for researchers and (3) they must have been specifically designed to capture the institutional characteristics of markets. In presenting the different alternatives, we offer a description of each index, its dimensions, time horizon and geographic scope, and we offer examples of papers that have incorporated these measures into their analyses. Additionally, wherever possible, correlation and factorial analyses are used for both formal and informal institutional indicators in order to determine the extent to which they converge or differ. We first analyze four measures that may be used to measure formal institutions and then move on to consider Hofstede's and the GLOBE studies as tools to capture informal institutions.
The measurement of formal institutionsIn this section, we focus on four different approximations to the measurement of formal institutions: the economic freedom index, the political constraints index, the corruption perceptions index and the worldwide governance indicators. We first briefly present their main characteristics and then compare them.
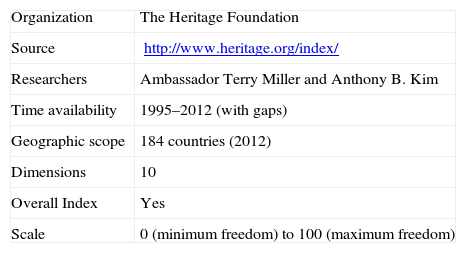
The Index of Economic Freedom (EFI)The Index of Economic Freedom (see Table 2 for more details), offered by the Heritage Foundation, measures the extent of government support to a person's control of the fruits of his/her labor and initiative. This index has been used in previous research as a measure of the level of institutional development of a country (Gubbi et al., 2010; Meyer and Sinani, 2009) or of the strength of market-supporting institutions (Meyer et al., 2009). A higher score in this index has been linked to stronger institutions, that is, those that support voluntary economic exchanges by assuring transparency and predictability.
Index of Economic Freedom (EFI).
| Organization | The Heritage Foundation |
| Source | http://www.heritage.org/index/ |
| Researchers | Ambassador Terry Miller and Anthony B. Kim |
| Time availability | 1995–2012 (with gaps) |
| Geographic scope | 184 countries (2012) |
| Dimensions | 10 |
| Overall Index | Yes |
| Scale | 0 (minimum freedom) to 100 (maximum freedom) |
Countries with higher EFI: Hong Kong (89.9), Singapore (87.5) and Australia (83.1).
Countries with lower EFI: Cuba (28.3), Zimbabwe (26.3) and North Korea (1.00).
The overall index is calculated as the average of 10 dimensions that are grouped into four categories: (i) rule of law, (ii) regulatory efficiency, (iii) open markets and (iv) limited government. Rule of law refers to the extent to which the state protects private property rights from unfair expropriation and theft through the judicial system (property rights) and to which the market is free from political corruption through transparency in the regulatory procedures and processes (freedom from corruption). Regulatory efficiency determines whether the state allows individuals to establish and run their own businesses without interference (business freedom); whether it favors a policy based on low inflation, price stability and independence of the central bank (monetary freedom) and whether it allows individuals to work as much as they want and wherever they want and businesses to contract and dismiss workers according to activity requirements (labor freedom). The third category, open markets, describes the degree to which regulation supports market exchanges without restrictions in the national and international flow of goods and services (trade freedom) and capital (investment freedom). It also considers whether it encourages transparency, integrity and efficiency in the access to financing (financial freedom). Finally, limited government determines the level of lack of taxation (fiscal freedom) and spending (government spending) in a country. It is considered that high levels of government spending are associated with high levels of taxation, which reduces individuals’ resources. For this reason, a high score in these two dimensions – lower levels of public taxation and spending – is considered a signal of greater freedom of individuals in a society, since they can freely decide the destination of their resources.
The Heritage Foundation offers an annual ranking of countries according to the overall EFI index. In addition, the Heritage Foundation classifies the listed countries according to five categories: free (100–80), mostly free (79.9–70), moderately free (69.9–60), mostly unfree (59.9–50) and repressed (49.9–0).
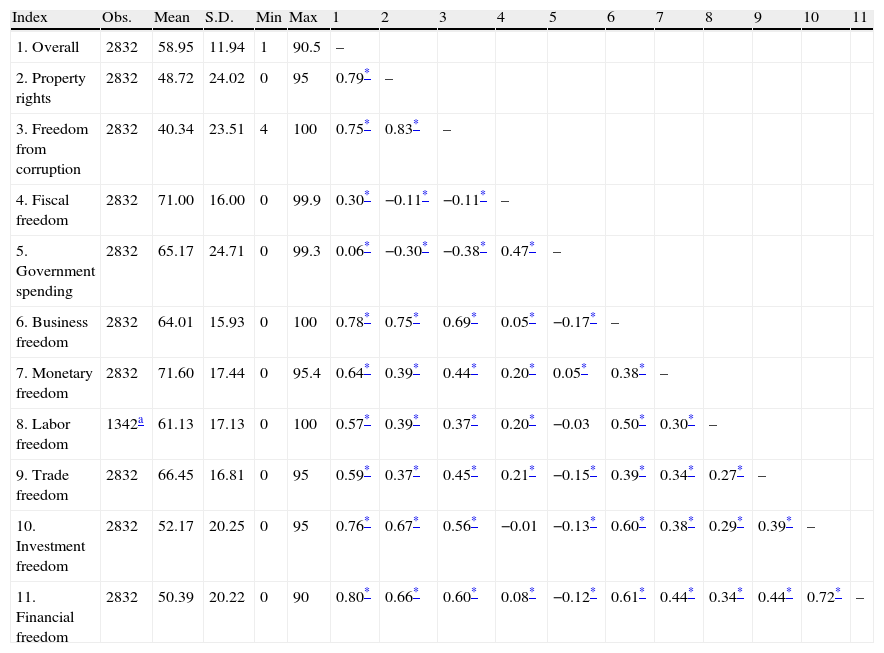
Table 3 provides the descriptive statistics for the overall index and for the ten dimensions it consists of (from 1995 to 2012). As it can be observed, the average score is higher for dimensions such as fiscal and monetary freedom (71 over 100), whereas the lowest average scores refer to property rights protection and freedom from corruption (48 and 40 over 100, respectively). Almost all the EFI dimensions present significant correlations within them. The correlations are especially high for the pairs (1) property rights and freedom from corruption (r=0.83), (2) business freedom and property rights protection (r=0.75) and (3) investment and financial freedom (r=0.72). Interestingly, all the correlations are positive with the only exception of the ones involving fiscal freedom and government spending (limited government category), which present some negative correlations with the other EFI dimensions.
Descriptive statistics EFI (1995–2012).
| Index | Obs. | Mean | S.D. | Min | Max | 1 | 2 | 3 | 4 | 5 | 6 | 7 | 8 | 9 | 10 | 11 |
| 1. Overall | 2832 | 58.95 | 11.94 | 1 | 90.5 | – | ||||||||||
| 2. Property rights | 2832 | 48.72 | 24.02 | 0 | 95 | 0.79* | – | |||||||||
| 3. Freedom from corruption | 2832 | 40.34 | 23.51 | 4 | 100 | 0.75* | 0.83* | – | ||||||||
| 4. Fiscal freedom | 2832 | 71.00 | 16.00 | 0 | 99.9 | 0.30* | −0.11* | −0.11* | – | |||||||
| 5. Government spending | 2832 | 65.17 | 24.71 | 0 | 99.3 | 0.06* | −0.30* | −0.38* | 0.47* | – | ||||||
| 6. Business freedom | 2832 | 64.01 | 15.93 | 0 | 100 | 0.78* | 0.75* | 0.69* | 0.05* | −0.17* | – | |||||
| 7. Monetary freedom | 2832 | 71.60 | 17.44 | 0 | 95.4 | 0.64* | 0.39* | 0.44* | 0.20* | 0.05* | 0.38* | – | ||||
| 8. Labor freedom | 1342a | 61.13 | 17.13 | 0 | 100 | 0.57* | 0.39* | 0.37* | 0.20* | −0.03 | 0.50* | 0.30* | – | |||
| 9. Trade freedom | 2832 | 66.45 | 16.81 | 0 | 95 | 0.59* | 0.37* | 0.45* | 0.21* | −0.15* | 0.39* | 0.34* | 0.27* | – | ||
| 10. Investment freedom | 2832 | 52.17 | 20.25 | 0 | 95 | 0.76* | 0.67* | 0.56* | −0.01 | −0.13* | 0.60* | 0.38* | 0.29* | 0.39* | – | |
| 11. Financial freedom | 2832 | 50.39 | 20.22 | 0 | 90 | 0.80* | 0.66* | 0.60* | 0.08* | −0.12* | 0.61* | 0.44* | 0.34* | 0.44* | 0.72* | – |
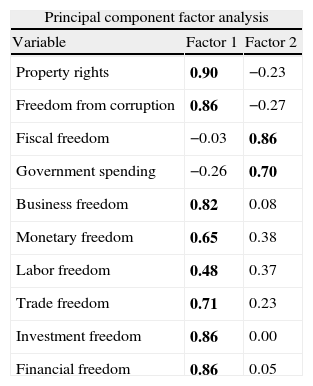
Given the high correlations between some EFI dimensions, we have considered it interesting to carry out a factor and a cluster analysis with the aim of determining the extent to which the dimensions differ. Both techniques show similar results for all the years for which the information is available. Therefore, we base our comments on the most recent year (2012).4 Using a principal component factor analysis with varimax rotation, two significant factors emerge (Table 4). All the dimensions have significant factor loadings (i.e. ≥±0.40) on only one of the two factors. The first factor includes three categories, i.e. rule of law (property rights and freedom from corruption), regulatory efficiency (business, monetary and labor freedom) and open markets (trade, investment and financial freedom). The second factor includes the limited government category (fiscal freedom and government spending). After carrying out a cluster analysis using the ten dimensions, the countries are divided into two groups, in accordance with the Calinski-Harabasz test. When the average factor scores are calculated for the two groups, it is observed that countries in Group 1 are characterized by a higher score in Factor 1 (rule of law, regulatory efficiency and open markets categories) and a lower score in Factor 2 (limited government) than countries in Group 2.
EFI categories, scores and country classification (2012).
| Principal component factor analysis | ||
| Variable | Factor 1 | Factor 2 |
| Property rights | 0.90 | −0.23 |
| Freedom from corruption | 0.86 | −0.27 |
| Fiscal freedom | −0.03 | 0.86 |
| Government spending | −0.26 | 0.70 |
| Business freedom | 0.82 | 0.08 |
| Monetary freedom | 0.65 | 0.38 |
| Labor freedom | 0.48 | 0.37 |
| Trade freedom | 0.71 | 0.23 |
| Investment freedom | 0.86 | 0.00 |
| Financial freedom | 0.86 | 0.05 |
| Cluster analysis | ||
| Group | Average factor score | Countries |
| Group 1 | Higher av. score factor 1=1.10•Rule of law (property rights and freedom from corruption);•Regulatory efficiency (business, monetary and labor freedom);•Open markets (trade, investment and financial freedom). | Armenia, Australia, Austria, Bahrain, Barbados, Belgium, Botswana, Bulgaria, Canada, Chile, Colombia, Cyprus, Czech Republic, Denmark, Dominica, Estonia, Finland, France, Georgia, Germany, Greece, Hong Kong, Hungary, Iceland, Ireland, Israel, Italy, Jamaica, Japan, Jordan, Lithuania, Luxembourg, Macedonia, Malaysia, Malta, Mauritius, Mexico, Montenegro, New Zealand, Norway, Oman, Poland, Portugal, Santa Lucia, Saint Vincent and the Grenadines, Saudi Arabia, Singapore, Slovakia, Slovenia, Spain, Sweden, Switzerland, The Netherlands, Trinidad y Tobago, United Kingdom, United States. |
| Lower av. score factor 2=−0.32•Limited government (fiscal freedom and government spending) | ||
| Group 2 | Lower av. score factor 1=−0.51•Rule of law (property rights and freedom from corruption);•Regulatory efficiency (business, monetary and labor freedom);•Open markets (trade, investment and financial freedom). | Albania, Algeria, Angola, Argentina, Azerbaijan, Bangladesh, Belarus, Belize, Benin, Bhutan, Bolivia, Bosnia and Herzegovina, Brazil, Burkina Faso, Burma, Burundi, Ivory Coast, Cambodia, Cameroon, Cape Verde, Central African Republic, Chad, China, Comoros, Costa Rica, Croatia, Cuba, DR Congo, Djibouti, Dominican Republic, Ecuador, Egypt, El Salvador, Equatorial Guinea, Eritrea, Ethiopia, Fiji, Gabon, Ghana, Guatemala, Guinea, Guinea-Bissau, Guyana, Haiti, Honduras, India, Indonesia, Iran, Kazakhstan, Kenya, Kiribati, Kuwait, Kyrgyz Republic, Laos, Latvia, Lebanon, Lesotho, Liberia, Libya, Macau, Madagascar, Malawi, Mauritania, Micronesia, Moldova, Mongolia, Morocco, Mozambique, Namibia, Nepal, Nicaragua, Niger, Nigeria, North Korea, Pakistan, Panama, Papua New Guinea, Paraguay, Peru, Qatar, R. Congo, Romania, Russia, Rwanda, Santo Tomé y Príncipe, Samoa, Senegal, Serbia, Seychelles, Sierra Leone, Solomon I., South Africa, Sri Lanka, Suriname, Swaziland, Syria, Taiwan, Tajikistan, Tanzania, Thailand, The Bahamas, The Gambia, The Philippines, Timor-Leste, Togo, Tonga, Tunisia, Turkey, Turkmenistan, Uganda, Ukraine, United Arab Emirates, Uzbekistan, Vanuatu, Venezuela, Vietnam |
| Higher av. score factor 2=0.15•Limited government (fiscal freedom and government spending). | ||
This index has frequently been used to measure formal institutions. Although there are examples in which the 10 dimensions have been employed at the same time, in other papers, only some of the dimensions of Factor 1 are introduced into the empirical analyses. For instance, Meyer and Sinani (2009) use the average score for the business freedom, trade freedom, investment freedom, financial freedom and property rights dimensions to analyze variations in spillovers from foreign direct investment (FDI) in developing and developed countries and transition economies. Similarly, Meyer et al. (2009) focus on emerging economies to analyze entry mode strategies followed by MNEs depending on the level of institutional development based on the five dimensions previously mentioned.
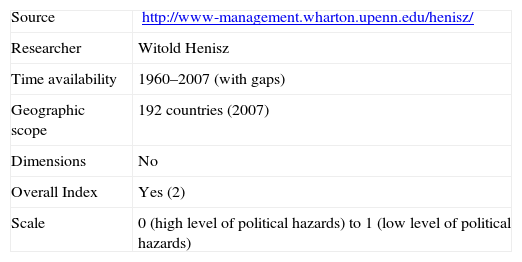
Political Constraints Index (POLCON)The Political Constraints Index (see Table 5 for more details) measures the extent to which policy changes are constrained by institutional and political factors (Henisz, 2000). It is assumed that a higher number of constraints is positive, given that it promotes stability, reducing political hazards and, thus, uncertainty. For this reason, this index has been used to measure the variable political stability (Guler and Guillén, 2009; Vaaler and Schrage, 2009).
Political Constraint Index (POLCON).
| Source | http://www-management.wharton.upenn.edu/henisz/ |
| Researcher | Witold Henisz |
| Time availability | 1960–2007 (with gaps) |
| Geographic scope | 192 countries (2007) |
| Dimensions | No |
| Overall Index | Yes (2) |
| Scale | 0 (high level of political hazards) to 1 (low level of political hazards) |
Countries with higher POLCON: Morocco (0.73) and Belgium (0.69).
Countries with lower POLCON: Cuba (0.00), Iran (0.00) and Somalia (0.00).
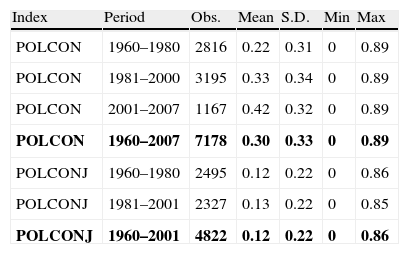
The POLCON database offers two measures of political constraints. The first, POLCON, identifies the degree of constraints on policy change using data on the number of independent veto points in the political system (executive, legislative, judicial and sub-federal branches of government) and the distribution of political preferences both across and within these branches (Henisz, 2000: 4). There is an alternative measure, POLCONJ, which also takes into account the alignment between the judicial and executive powers as well as the polarization or fractionalization of the courts. A high score in this index means that political hazards are low and, thus, firms are in a better position to anticipate market conditions.
As can be observed in Table 6, the average POLCON index has increased from 1960 to 2007, which means that, on average, the political hazard has decreased over time. There is also a high variability among countries: some of them score 0 (minimum), whereas the maximum score is 0.89. It can be highlighted that POLCONJ is very stable over time.
Descriptive Statistics POLCON (1960–2007).a
| Index | Period | Obs. | Mean | S.D. | Min | Max |
| POLCON | 1960–1980 | 2816 | 0.22 | 0.31 | 0 | 0.89 |
| POLCON | 1981–2000 | 3195 | 0.33 | 0.34 | 0 | 0.89 |
| POLCON | 2001–2007 | 1167 | 0.42 | 0.32 | 0 | 0.89 |
| POLCON | 1960–2007 | 7178 | 0.30 | 0.33 | 0 | 0.89 |
| POLCONJ | 1960–1980 | 2495 | 0.12 | 0.22 | 0 | 0.86 |
| POLCONJ | 1981–2001 | 2327 | 0.13 | 0.22 | 0 | 0.85 |
| POLCONJ | 1960–2001 | 4822 | 0.12 | 0.22 | 0 | 0.86 |
When management researchers use this indicator, they mainly focus on POLCON instead of POLCONJ, perhaps because the two are highly correlated (0.79) and POLCON has a notably higher number of observations. Previous studies have observed that the political stability of a country allows a higher rate of entry into a foreign market by American venture capital firms (Guler and Guillén, 2009). Political stability also moderates the relationship between the residual state ownership of a privatized firm and the financial performance associated with strategic decisions of privatizing firms, and between the time since privatization and this performance (Vaaler and Schrage, 2009).
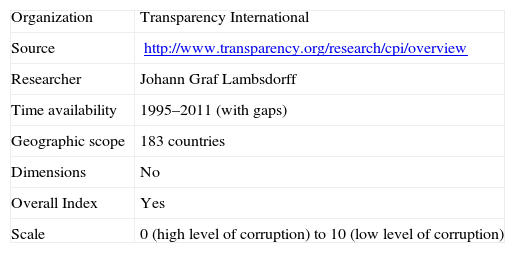
Corruption Perceptions Index (CPI)The Corruption Perceptions Index (see Table 7 for more details) measures the extent to which international businessmen and financial journalist perceive corruption in the public sector of a given country. It includes perceptions about the bribery of public officials, kickbacks in public procurement, and the effectiveness of public sector anti-corruption efforts. It considers corruption in a strict sense, without other dimensions such as political instability, and it has been understood as the most comprehensive quantitative indicator of cross-country corruption available (DiRienzo et al., 2007).
Corruption Perceptions Index (CPI).
| Organization | Transparency International |
| Source | http://www.transparency.org/research/cpi/overview |
| Researcher | Johann Graf Lambsdorff |
| Time availability | 1995–2011 (with gaps) |
| Geographic scope | 183 countries |
| Dimensions | No |
| Overall Index | Yes |
| Scale | 0 (high level of corruption) to 10 (low level of corruption) |
Countries with the highest level of corruption: North Korea (1.0) and Somalia (1.0).
Countries with the lowest level of corruption: New Zealand (9.5), Denmark (9.4) and Finland (9.4).
The Transparency International Society also offers a ranking of countries. However, it is important to consider the scores of each country instead of its position in the ranking in order to develop year-to-year comparisons (Lambsdorff, 2007) because this position not only depends on the scores of each country, but also on the number of participant countries in each edition. Since this number has varied over time, a country could occupy different positions in the ranking in two consecutive years although its score – and, thus, its perceived corruption – had not changed.
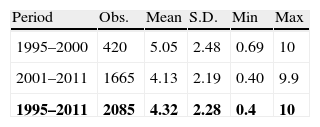
Table 8 shows the descriptive statistics for the CPI from 1995 to 2011. As can be observed, the average corruption index has decreased from the first period 1995–2000 to the second 2001–2011, meaning that, on average, the level of corruption in the public sector has increased. This decrease of the index is caused by the inclusion in this study of new countries with low scores (high level of corruption) in the CPI in the first decade of the 21st century. While the number of participant countries in 2000 was 91, it increased to 182 in 2011.
Unlike EFI and POLCON, the CPI is based on only one dimension/indicator. Previous studies have used it to analyze how the level of corruption of a country influences firm decisions. For instance, Habib and Zurawicki (2002) and Pajunen (2008) analyze developed and developing countries and find a negative impact of the CPI on the level of FDI in a country. Spencer and Gomez (2011), analysing Eastern European countries and Ghana, found a positive relationship between the host country corruption environment and the pressure that subsidiaries face to engage in bribery locally. Other studies have analyzed how the access to information and technology in a given country is negatively related to the level of corruption (DiRienzo et al., 2007), whereas the more rapid rate of change in FDI in a country is positively related to it (Robertson and Watson, 2004).
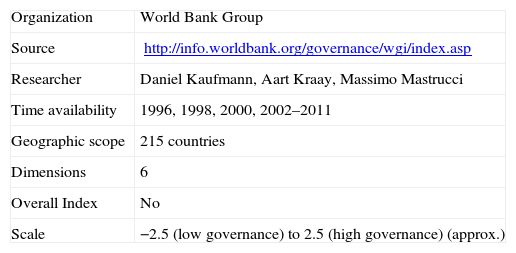
Worldwide Governance Indicators (WGI)The Worldwide Governance Indicators (see Table 9 for more details) have been used in previous studies to measure the governance of countries, in other words, the set of traditions and institutions by which authority in a country is exercised and by which it is expected to affect economic activity (Cuervo-Cazurra and Genc, 2011; Globerman and Shapiro, 2003; Oh and Oetzel, 2011). It includes three categories of information: (1) the process by which governments are selected, monitored and replaced; (2) the capacity of the government to effectively formulate and implement sound policies; and (3) the respect of citizens and the State for the institutions that govern the economic and social interactions among them.
Worldwide Governance Indicators (WGI).
| Organization | World Bank Group |
| Source | http://info.worldbank.org/governance/wgi/index.asp |
| Researcher | Daniel Kaufmann, Aart Kraay, Massimo Mastrucci |
| Time availability | 1996, 1998, 2000, 2002–2011 |
| Geographic scope | 215 countries |
| Dimensions | 6 |
| Overall Index | No |
| Scale | −2.5 (low governance) to 2.5 (high governance) (approx.) |
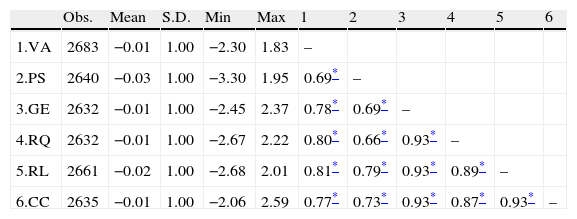
There are six governance indicators that are based on the three previous categories: (1) Voice and accountability (VA) determine the degree to which citizens can exert their freedom rights and participate in selecting their government, while Political stability and absence of violence/terrorism (PS) measure perceptions about the likelihood that the government would be destabilized by unconstitutional or violent means or by terrorists; (2) Government effectiveness (GE) includes perceptions about the quality of public services, the civil service, policy formulation and the implementation and credibility of public policies, while Regulatory quality (RQ) captures the degree to which governments implement policies and regulations to promote private sector development; (3) Rule of law (RL) measures the quality of contract enforcement, property rights protection and the likelihood of crime and violence, and Control of Corruption (CC) measures the extent to which public power is exercised for private gain and the influence of private interests on public policies. Thus, in a country with high scores in these dimensions, economic agents can more easily anticipate the results of their economic activities, provided that there is a respect for regulation and contracts, a lack of violence and corruption, and regulatory quality and effectiveness.
Table 10 provides the descriptive statistics of WGI from 1996 to 2011. As can be observed, the average score is similar for all indicators (close to 0). All of them are highly correlated, with values ranging from 0.66 to 0.93.
Descriptive Statistics WGI (1996–2011).
| Obs. | Mean | S.D. | Min | Max | 1 | 2 | 3 | 4 | 5 | 6 | |
| 1.VA | 2683 | −0.01 | 1.00 | −2.30 | 1.83 | – | |||||
| 2.PS | 2640 | −0.03 | 1.00 | −3.30 | 1.95 | 0.69* | – | ||||
| 3.GE | 2632 | −0.01 | 1.00 | −2.45 | 2.37 | 0.78* | 0.69* | – | |||
| 4.RQ | 2632 | −0.01 | 1.00 | −2.67 | 2.22 | 0.80* | 0.66* | 0.93* | – | ||
| 5.RL | 2661 | −0.02 | 1.00 | −2.68 | 2.01 | 0.81* | 0.79* | 0.93* | 0.89* | – | |
| 6.CC | 2635 | −0.01 | 1.00 | −2.06 | 2.59 | 0.77* | 0.73* | 0.93* | 0.87* | 0.93* | – |
To understand the structure of the indicators, we have performed an exploratory factor analysis using the principal component method with varimax rotation for the most recent period in which information is available (2011).5 In this case, the six indicators were reduced to one factor, with factor loadings between 0.83 and 0.98.
Despite the high correlation between indicators, previous studies vary in the way that they have used them in empirical analyses. For instance, Globerman and Shapiro (2003) take the common factor based on the six indicators to show that governance institutions determine FDI inflows and outflows in developed and developing countries. Other researchers perform the empirical analysis for each of the six indicators, instead of reducing them to a common factor. For instance, Cuervo-Cazurra and Genc (2011) analyze developing country MNEs in comparison with developed country MNEs and find that the indicators related to regulatory quality, rule of law and control of corruption of the least developed countries have a key role in explaining the prevalence of developing-country MNEs among the largest subsidiaries of foreign firms in these countries. Oh and Oetzel (2011) also include each of the six indicators to analyze the moderating role of governance quality in the variation of European MNEs’ investments at subsidiary level in response to major disasters. However, they find similar results for each of the six indicators.
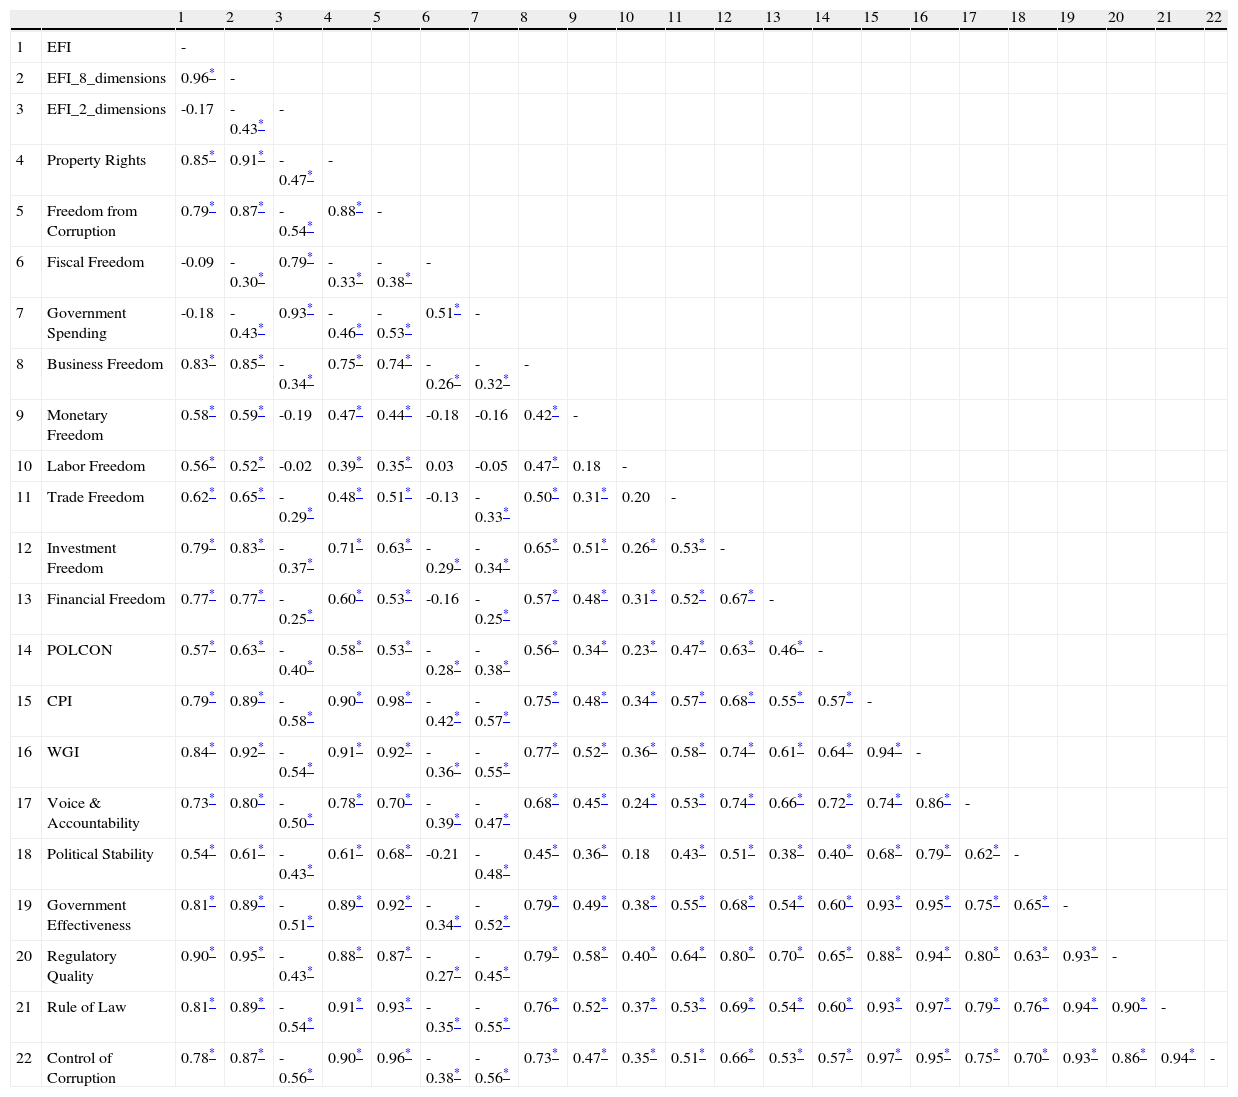
Comparing the indicatorsHaving presented the main measures of formal institutions, in this subsection, we offer a comparison between them. Table 11 shows the correlations between all the previous indicators6 for the 177 countries that appear in all the indexes for the last available year, 2007.7
Correlation Matrix All Indicators (2007)**
| 1 | 2 | 3 | 4 | 5 | 6 | 7 | 8 | 9 | 10 | 11 | 12 | 13 | 14 | 15 | 16 | 17 | 18 | 19 | 20 | 21 | 22 | ||
| 1 | EFI | - | |||||||||||||||||||||
| 2 | EFI_8_dimensions | 0.96* | - | ||||||||||||||||||||
| 3 | EFI_2_dimensions | -0.17 | -0.43* | - | |||||||||||||||||||
| 4 | Property Rights | 0.85* | 0.91* | -0.47* | - | ||||||||||||||||||
| 5 | Freedom from Corruption | 0.79* | 0.87* | -0.54* | 0.88* | - | |||||||||||||||||
| 6 | Fiscal Freedom | -0.09 | -0.30* | 0.79* | -0.33* | -0.38* | - | ||||||||||||||||
| 7 | Government Spending | -0.18 | -0.43* | 0.93* | -0.46* | -0.53* | 0.51* | - | |||||||||||||||
| 8 | Business Freedom | 0.83* | 0.85* | -0.34* | 0.75* | 0.74* | -0.26* | -0.32* | - | ||||||||||||||
| 9 | Monetary Freedom | 0.58* | 0.59* | -0.19 | 0.47* | 0.44* | -0.18 | -0.16 | 0.42* | - | |||||||||||||
| 10 | Labor Freedom | 0.56* | 0.52* | -0.02 | 0.39* | 0.35* | 0.03 | -0.05 | 0.47* | 0.18 | - | ||||||||||||
| 11 | Trade Freedom | 0.62* | 0.65* | -0.29* | 0.48* | 0.51* | -0.13 | -0.33* | 0.50* | 0.31* | 0.20 | - | |||||||||||
| 12 | Investment Freedom | 0.79* | 0.83* | -0.37* | 0.71* | 0.63* | -0.29* | -0.34* | 0.65* | 0.51* | 0.26* | 0.53* | - | ||||||||||
| 13 | Financial Freedom | 0.77* | 0.77* | -0.25* | 0.60* | 0.53* | -0.16 | -0.25* | 0.57* | 0.48* | 0.31* | 0.52* | 0.67* | - | |||||||||
| 14 | POLCON | 0.57* | 0.63* | -0.40* | 0.58* | 0.53* | -0.28* | -0.38* | 0.56* | 0.34* | 0.23* | 0.47* | 0.63* | 0.46* | - | ||||||||
| 15 | CPI | 0.79* | 0.89* | -0.58* | 0.90* | 0.98* | -0.42* | -0.57* | 0.75* | 0.48* | 0.34* | 0.57* | 0.68* | 0.55* | 0.57* | - | |||||||
| 16 | WGI | 0.84* | 0.92* | -0.54* | 0.91* | 0.92* | -0.36* | -0.55* | 0.77* | 0.52* | 0.36* | 0.58* | 0.74* | 0.61* | 0.64* | 0.94* | - | ||||||
| 17 | Voice & Accountability | 0.73* | 0.80* | -0.50* | 0.78* | 0.70* | -0.39* | -0.47* | 0.68* | 0.45* | 0.24* | 0.53* | 0.74* | 0.66* | 0.72* | 0.74* | 0.86* | - | |||||
| 18 | Political Stability | 0.54* | 0.61* | -0.43* | 0.61* | 0.68* | -0.21 | -0.48* | 0.45* | 0.36* | 0.18 | 0.43* | 0.51* | 0.38* | 0.40* | 0.68* | 0.79* | 0.62* | - | ||||
| 19 | Government Effectiveness | 0.81* | 0.89* | -0.51* | 0.89* | 0.92* | -0.34* | -0.52* | 0.79* | 0.49* | 0.38* | 0.55* | 0.68* | 0.54* | 0.60* | 0.93* | 0.95* | 0.75* | 0.65* | - | |||
| 20 | Regulatory Quality | 0.90* | 0.95* | -0.43* | 0.88* | 0.87* | -0.27* | -0.45* | 0.79* | 0.58* | 0.40* | 0.64* | 0.80* | 0.70* | 0.65* | 0.88* | 0.94* | 0.80* | 0.63* | 0.93* | - | ||
| 21 | Rule of Law | 0.81* | 0.89* | -0.54* | 0.91* | 0.93* | -0.35* | -0.55* | 0.76* | 0.52* | 0.37* | 0.53* | 0.69* | 0.54* | 0.60* | 0.93* | 0.97* | 0.79* | 0.76* | 0.94* | 0.90* | - | |
| 22 | Control of Corruption | 0.78* | 0.87* | -0.56* | 0.90* | 0.96* | -0.38* | -0.56* | 0.73* | 0.47* | 0.35* | 0.51* | 0.66* | 0.53* | 0.57* | 0.97* | 0.95* | 0.75* | 0.70* | 0.93* | 0.86* | 0.94* | - |
As can be observed, there is a high correlation between EFI 8, CPI and WGI (0.89–0.94), which means that these indicators seem to measure related dimensions of formal institutions. Moreover, the correlation is especially high between some indicators and dimensions that capture similar institutional aspects. These include corruption (freedom from corruption from EFI, the CPI and control of corruption from WGI have a correlation that ranges from 0.96 to 0.98) and property rights protection (property rights from EFI and rule of law from WGI have a correlation of 0.91).
By contrast, correlations have a lower value between EFI 2 and the other indicators and dimensions, which seems to confirm that fiscal freedom and government spending capture government size instead of regulatory issues, as the other EFI dimensions do. The POLCON index also has a lower correlation with the other indicators, which suggests that it is measuring a different dimension.
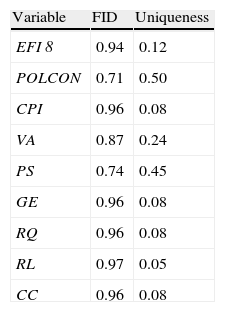
Additionally, we have conducted an exploratory factor analysis through the principal component method for EFI 8, POLCON, CPI and the six WGI indicators in the last available period (2007). Table 12 shows that they are reduced to one factor that we have called formal institutional development (FID). We have calculated the value of this variable for each country. Table 12 offers a summary of the ten countries with the highest and lowest scores of the FID. As can be observed, the results are consistent with the classification obtained from the EFI dimensions and that presented in Table 4, because countries with the highest scores of FID belong to Group 1 whereas countries with the lowest score of FID belong to Group 2.
Factor analysis (2007).
| Variable | FID | Uniqueness |
| EFI 8 | 0.94 | 0.12 |
| POLCON | 0.71 | 0.50 |
| CPI | 0.96 | 0.08 |
| VA | 0.87 | 0.24 |
| PS | 0.74 | 0.45 |
| GE | 0.96 | 0.08 |
| RQ | 0.96 | 0.08 |
| RL | 0.97 | 0.05 |
| CC | 0.96 | 0.08 |
| Highest FID | Lowest FID | ||
| Country | Factor 1 | Country | Factor 1 |
| Denmark | 2.19 | Zimbabwe | −1.72 |
| Finland | 2.04 | Turkmenistan | −1.60 |
| New Zealand | 2.01 | Chad | −1.52 |
| Switzerland | 1.99 | Guinea | −1.39 |
| Sweden | 1.99 | Equatorial Guinea | −1.34 |
| Iceland | 1.94 | Uzbekistan | −1.33 |
| The Netherlands | 1.92 | Central African Rep. | −1.33 |
| Australia | 1.91 | Côte d’Ivoire | −1.30 |
| Austria | 1.86 | Venezuela | −1.29 |
| Canada | 1.85 | Iran | −1.19 |
In this section, we review the most widespread alternatives to capture informal institutions: Hofstede and GLOBE (Global Leadership and Organizational Behavior Effectiveness). However, we have to acknowledge that there are also other options to measure informal institutions. For instance, Schwartz's value survey (1994), Inglehart and Associates’ World Values Survey (1997) and Trompenaars and Hampden-Turner (1997) also allow the consideration of cultural issues across countries. In any case, due to their relevance and diffusion among the academic community (Hofstede, 2006; Tung and Verbeke, 2010; Smith, 2006), we focus our attention on Hofstede and GLOBE.
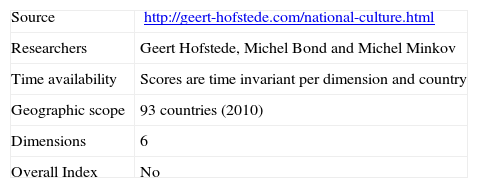
HofstedeIn his seminal book “Culture's Consequences: International Differences in Work-Related Values” (1980), Geert Hofstede developed several indicators to capture cross-national cultural differences. Hofstede initially collected data from 116,000 questionnaire-based surveys delivered to IBM managers participating in international management development courses in 1967 and 1973. At first, the study was conducted for 40 countries, but its coverage was extended to cover 93 countries in 2010 (Table 13).
Hofstede's cross-cultural dimensions.
| Source | http://geert-hofstede.com/national-culture.html |
| Researchers | Geert Hofstede, Michel Bond and Michel Minkov |
| Time availability | Scores are time invariant per dimension and country |
| Geographic scope | 93 countries (2010) |
| Dimensions | 6 |
| Overall Index | No |
The four initial dimensions were extended to five in 1991 and six in 2010 by Michel Bond and Michel Minkov, respectively. The six dimensions are the following: (1) Power distance measures the extent to which unequal distributions of power are accepted by the less powerful members of a society; (2) Uncertainty avoidance reflects societal stress as well as intolerance for uncertainty and ambiguity; (3) Individualism vs. collectivism shows the extent to which individuals are integrated into groups; (4) Masculinity vs. femininity is related to emotional gender roles in which masculinity is associated with assertiveness and competitiveness and femininity to modesty and caring; (5) Long vs. short term orientation is related to society's search for virtue, with short-term orientation being associated with respect for traditions, quick results and lower levels of savings and investments, and long-term orientation with a better adaptation to changes, long-term results and higher levels of savings and investments; (6) Indulgence vs. restraint determines the extent to which a society allows free gratification such as having fun (indulgence) or suppresses the gratification of needs by strict social norms (restraint). Therefore, a country with high scores in these six cultural dimensions would be characterized by (1) an unequal distribution of power; (2) intolerance of uncertainty and ambiguity; (3) individualism; (4) masculinity; (5) long-term orientation; and (6) indulgence.
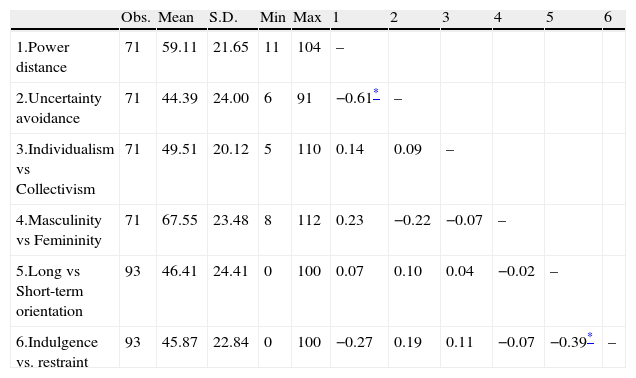
If we calculate descriptive statistics for the six dimensions (Table 14), it can be observed that the average country has intermediate values. Interestingly there is only one significant correlation over 0.50 (the one between power distance and uncertainty avoidance, whose value is −0.61). This seems to imply that the dimensions are generally independent, in contrast to formal institutional indexes and dimensions, which were highly correlated in some cases.
Descriptive statistics and correlations (Hofstede).a
| Obs. | Mean | S.D. | Min | Max | 1 | 2 | 3 | 4 | 5 | 6 | |
| 1.Power distance | 71 | 59.11 | 21.65 | 11 | 104 | – | |||||
| 2.Uncertainty avoidance | 71 | 44.39 | 24.00 | 6 | 91 | −0.61* | – | ||||
| 3.Individualism vs Collectivism | 71 | 49.51 | 20.12 | 5 | 110 | 0.14 | 0.09 | – | |||
| 4.Masculinity vs Femininity | 71 | 67.55 | 23.48 | 8 | 112 | 0.23 | −0.22 | −0.07 | – | ||
| 5.Long vs Short-term orientation | 93 | 46.41 | 24.41 | 0 | 100 | 0.07 | 0.10 | 0.04 | −0.02 | – | |
| 6.Indulgence vs. restraint | 93 | 45.87 | 22.84 | 0 | 100 | −0.27 | 0.19 | 0.11 | −0.07 | −0.39* | – |
The use of these dimensions in empirical studies has focused on the role of culture in topics that belong to the Strategic Management domain and there have been two main approaches. The first focuses on analysing the impact of one or several dimensions on management behavior. For instance, Crossland and Hambrick (2012) study 15 developed countries and show that individualism in a country is positively related to the managerial discretion of the firms headquartered in that country, whereas uncertainty avoidance and power distance are negatively related to CEO discretion. Shao et al. (2013) show that the four initial dimensions of Hofstede moderate the relationship between employees’ perceptions of justice and organizational outcomes such as satisfaction and commitment.
The second approach is based on analysing the effect of cultural indicators on firm strategies and outcomes by comparison. In this line the literature has used Hofstede's dimensions to calculate different measures of cultural distance. One of the most frequent cultural distance measures based on Hofstede's dimensions is proposed by Kogut and Singh (1988),8 and is calculated as follows:
where Iij (Iij) is the score of dimension i (i=1,…,6) for country j(u) and Vi is the variance of dimension i. Cultural distance based on Hofstede's indicators has been used in the analysis of a long list of research topics, mainly related to the internationalization process of multinationals. As examples, Chang and Rosenzweig (2001) show that joint ventures are preferred over greenfield and acquisition modes to enter into the United States when the cultural distance is high. Chakrabarti et al. (2009) analyze cross-border acquisitions involving 37 countries and show that cross-border acquisitions perform better in the long run when the acquirer and the target come from countries with higher cultural distance. As well as being a key independent variable, cultural distance between home and host countries has become one of the most frequent control variables in international studies that analyze MNEs’ strategies and outcomes.Global Leadership and Organizational Behavior Effectiveness (GLOBE)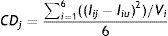
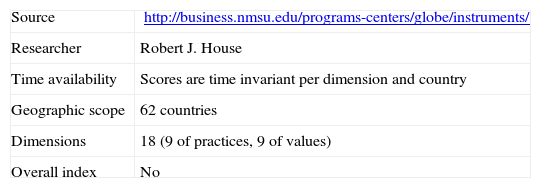
The GLOBE project is a research program involving over 160 researchers from many parts of the world, conceived by Robert J. House in 1991 and initiated in 1993 (Table 15). It focuses on understanding the impact of culture on leadership and organizational processes. The project examines national cultures through a survey answered by middle managers from food processing, financial and telecommunications service industries and working in 62 countries (House et al., 2004, 2006).
GLOBE dimensions.
| Source | http://business.nmsu.edu/programs-centers/globe/instruments/ |
| Researcher | Robert J. House |
| Time availability | Scores are time invariant per dimension and country |
| Geographic scope | 62 countries |
| Dimensions | 18 (9 of practices, 9 of values) |
| Overall index | No |
GLOBE distinguishes cultural practices, that is, practices that individuals carry out de facto (“as is”), from cultural values, that is, practices that individuals should carry out (“should be”). There are nine dimensions each for both practices and values, which are described as follows: (1) uncertainty avoidance defines the extent to which societies avoid uncertainty by reliance on social norms; (2) power distance shows the degree to which members of a society agree that power should be unequally distributed; (3) institutional collectivism reflects the extent to which a society encourages collective actions, as well as the collective distribution of resources; (4) in-group collectivism considers the degree to which individuals express loyalty and cohesiveness in their families or organizations; (5) gender egalitarianism shows the degree to which a society minimizes gender discrimination; (6) assertiveness reflects the extent to which individuals are able to express their opinions; (7) future orientation considers the degree to which individuals are engaged in future-oriented behaviors; (8) performance orientation refers to the degree to which a society encourages individuals to improve their performance; and (9) humane orientation measures the extent to which a society or organization rewards individuals for being fair, altruistic and generous.
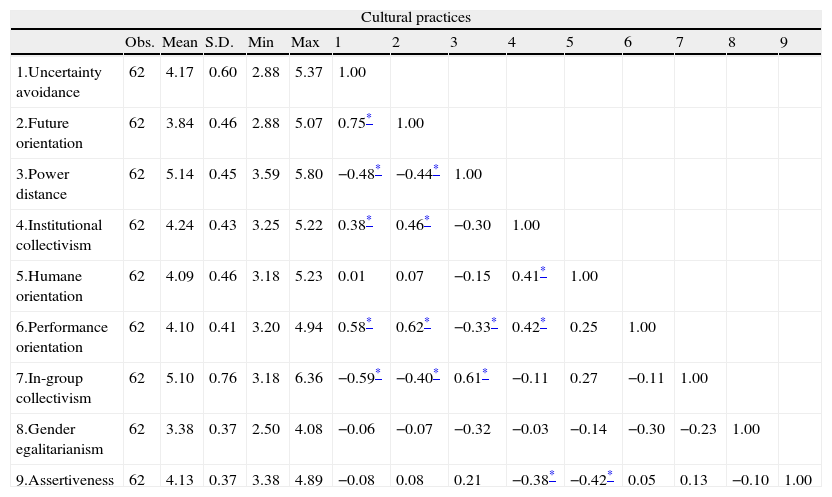
Table 16 shows the descriptive statistics and correlations of the cultural dimensions of practices and values considered by GLOBE. As can be observed, although GLOBE dimensions present higher significant correlations in comparison with Hofstede's, they are generally moderate.
Descriptive statistics and correlations (GLOBE).
| Cultural practices | ||||||||||||||
| Obs. | Mean | S.D. | Min | Max | 1 | 2 | 3 | 4 | 5 | 6 | 7 | 8 | 9 | |
| 1.Uncertainty avoidance | 62 | 4.17 | 0.60 | 2.88 | 5.37 | 1.00 | ||||||||
| 2.Future orientation | 62 | 3.84 | 0.46 | 2.88 | 5.07 | 0.75* | 1.00 | |||||||
| 3.Power distance | 62 | 5.14 | 0.45 | 3.59 | 5.80 | −0.48* | −0.44* | 1.00 | ||||||
| 4.Institutional collectivism | 62 | 4.24 | 0.43 | 3.25 | 5.22 | 0.38* | 0.46* | −0.30 | 1.00 | |||||
| 5.Humane orientation | 62 | 4.09 | 0.46 | 3.18 | 5.23 | 0.01 | 0.07 | −0.15 | 0.41* | 1.00 | ||||
| 6.Performance orientation | 62 | 4.10 | 0.41 | 3.20 | 4.94 | 0.58* | 0.62* | −0.33* | 0.42* | 0.25 | 1.00 | |||
| 7.In-group collectivism | 62 | 5.10 | 0.76 | 3.18 | 6.36 | −0.59* | −0.40* | 0.61* | −0.11 | 0.27 | −0.11 | 1.00 | ||
| 8.Gender egalitarianism | 62 | 3.38 | 0.37 | 2.50 | 4.08 | −0.06 | −0.07 | −0.32 | −0.03 | −0.14 | −0.30 | −0.23 | 1.00 | |
| 9.Assertiveness | 62 | 4.13 | 0.37 | 3.38 | 4.89 | −0.08 | 0.08 | 0.21 | −0.38* | −0.42* | 0.05 | 0.13 | −0.10 | 1.00 |
| Cultural values | ||||||||||||||
| Obs. | Mean | S.D. | Min | Max | 1 | 2 | 3 | 4 | 5 | 6 | 7 | 8 | 9 | |
| 1.Uncertainty avoidance | 62 | 4.61 | 0.61 | 3.16 | 5.61 | 1.00 | ||||||||
| 2.Future orientation | 62 | 5.44 | 0.51 | 2.95 | 6.20 | 0.64* | 1.00 | |||||||
| 3.Power distance | 62 | 2.77 | 0.40 | 2.04 | 4.35 | 0.04 | −0.36* | 1.00 | ||||||
| 4.Institutional collectivism | 62 | 4.71 | 0.50 | 3.83 | 5.65 | 0.45* | 0.50* | −0.37* | 1.00 | |||||
| 5.Humane orientation | 62 | 5.39 | 0.36 | 3.39 | 6.09 | 0.02 | 0.38* | −0.62* | 0.07 | 1.00 | ||||
| 6.Performance orientation | 62 | 5.88 | 0.56 | 2.35 | 6.58 | 0.25 | 0.69* | −0.61* | 0.43* | 0.61* | 1.00 | |||
| 7.In-group collectivism | 62 | 5.64 | 0.41 | 4.06 | 6.52 | 0.35* | 0.66* | −0.42* | 0.36* | 0.27 | 0.70* | 1.00 | ||
| 8.Gender egalitarianism | 62 | 4.50 | 0.49 | 3.18 | 5.17 | −0.49* | −0.16 | −0.51* | 0.00 | 0.28 | 0.28 | 0.21 | 1.00 | |
| 9.Assertiveness | 62 | 3.83 | 0.64 | 2.66 | 5.56 | 0.19 | 0.03 | 0.29 | −0.22 | −0.12 | −0.06 | −0.02 | −0.29 | 1.00 |
GLOBE's dimensions have been used by previous literature in similar ways to Hofstede's indicators. For instance, Martin et al. (2007) analyze the impact of performance orientation, human orientation and in-group collectivism on local firm bribery activity, finding that only in-group collectivism is negatively related to it. Other studies calculate cultural distance through Kogut and Singh's (1988) formula by using GLOBE dimensions and employ this variable for similar purposes as Hofstede's indicators. As an example, Reus and Lamont (2009) focus on US multinational firms and show that, in international acquisitions, cultural distance based on GLOBE constrains communication between the acquirers and their acquired units but, at the same time, it provides more learning opportunities.
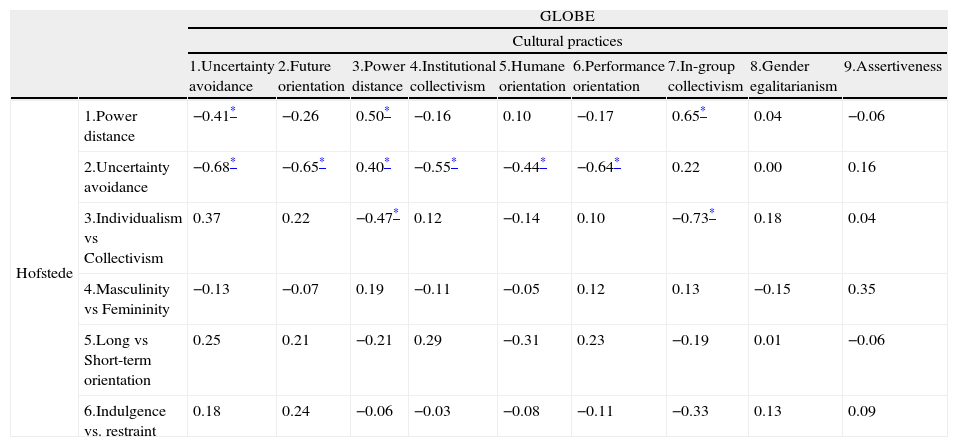
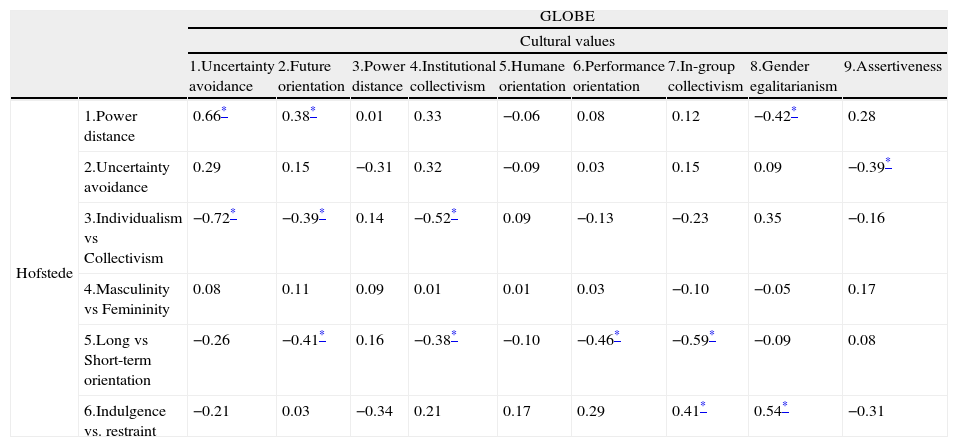
Hofstede vs. GLOBESince the publication of the GLOBE project, scholars have been heatedly debating the validity of Hofstede and GLOBE indexes, mainly from the perspective of the international business literature (Brewer and Venaik, 2011; Maseland and Van Hoorn, 2009; Smith, 2006). In spite of this discussion, there is no unanimity as to which index is superior. Tables 17a and 17b show correlations between Hofstede and GLOBE dimensions for both practices and values. The comparison of the two indexes shows that cultural dimensions that have similar names do not present high correlations and, apparently, are not measuring the same reality. As can be observed, the correlations are generally moderate and nonsignificant, although there are some exceptions. These exceptions sometimes coincide with dimensions that have similar meanings in Hofstede's dimensions and GLOBE's practices, such as (1) uncertainty avoidance (−0.68), (2) individualism vs. collectivism (−0.73) and (3) power distance (0.50), and in Hofstede and GLOBE's values, such as (4) future orientation (−0.41) and (5) individualism vs. collectivism (−0.52). However, these high correlations are also found between pairs of dimensions that differ in their names. This is the case for (1) uncertainty avoidance (Hofstede) and future orientation (GLOBE practices) (−0.65) and for (2) individualism vs. collectivism (Hofstede) and uncertainty avoidance (GLOBE values) (−0.72), to give just a couple of examples. This situation has been highlighted by Javidan et al. (2006) as a response to the claim that GLOBE only replicates the five cultural dimensions presented by Hofstede (2006).
Correlations between cultural practices of GLOBE and Hofstede scores.a
| GLOBE | ||||||||||
| Cultural practices | ||||||||||
| 1.Uncertainty avoidance | 2.Future orientation | 3.Power distance | 4.Institutional collectivism | 5.Humane orientation | 6.Performance orientation | 7.In-group collectivism | 8.Gender egalitarianism | 9.Assertiveness | ||
| Hofstede | 1.Power distance | −0.41* | −0.26 | 0.50* | −0.16 | 0.10 | −0.17 | 0.65* | 0.04 | −0.06 |
| 2.Uncertainty avoidance | −0.68* | −0.65* | 0.40* | −0.55* | −0.44* | −0.64* | 0.22 | 0.00 | 0.16 | |
| 3.Individualism vs Collectivism | 0.37 | 0.22 | −0.47* | 0.12 | −0.14 | 0.10 | −0.73* | 0.18 | 0.04 | |
| 4.Masculinity vs Femininity | −0.13 | −0.07 | 0.19 | −0.11 | −0.05 | 0.12 | 0.13 | −0.15 | 0.35 | |
| 5.Long vs Short-term orientation | 0.25 | 0.21 | −0.21 | 0.29 | −0.31 | 0.23 | −0.19 | 0.01 | −0.06 | |
| 6.Indulgence vs. restraint | 0.18 | 0.24 | −0.06 | −0.03 | −0.08 | −0.11 | −0.33 | 0.13 | 0.09 | |
Correlations between cultural values of GLOBE and Hofstede scores.a
| GLOBE | ||||||||||
| Cultural values | ||||||||||
| 1.Uncertainty avoidance | 2.Future orientation | 3.Power distance | 4.Institutional collectivism | 5.Humane orientation | 6.Performance orientation | 7.In-group collectivism | 8.Gender egalitarianism | 9.Assertiveness | ||
| Hofstede | 1.Power distance | 0.66* | 0.38* | 0.01 | 0.33 | −0.06 | 0.08 | 0.12 | −0.42* | 0.28 |
| 2.Uncertainty avoidance | 0.29 | 0.15 | −0.31 | 0.32 | −0.09 | 0.03 | 0.15 | 0.09 | −0.39* | |
| 3.Individualism vs Collectivism | −0.72* | −0.39* | 0.14 | −0.52* | 0.09 | −0.13 | −0.23 | 0.35 | −0.16 | |
| 4.Masculinity vs Femininity | 0.08 | 0.11 | 0.09 | 0.01 | 0.01 | 0.03 | −0.10 | −0.05 | 0.17 | |
| 5.Long vs Short-term orientation | −0.26 | −0.41* | 0.16 | −0.38* | −0.10 | −0.46* | −0.59* | −0.09 | 0.08 | |
| 6.Indulgence vs. restraint | −0.21 | 0.03 | −0.34 | 0.21 | 0.17 | 0.29 | 0.41* | 0.54* | −0.31 | |
According to the evidence presented in this paper, it seems that both Hofstede and GLOBE differ in their measurement of the underlying variables and the literature has offered several reasons for these divergences. First, GLOBE considers a greater number of cultural dimensions than Hofstede, which, in practice, implies that one dimension of Hofstede might be explained by several dimensions of GLOBE. For instance, the individualism vs. collectivism of Hofstede would correspond to institutional collectivism and in-group collectivism in GLOBE (Venaik and Brewer, 2010). However, in the cases in which the name of the dimension and the underlying concept are the same, the way in which the question is posited is sometimes different. This is, for example, the case of the variable measuring uncertainty avoidance (Venaik and Brewer, 2010).
Second, Hofstede and GLOBE do not use the same scales and questions in their surveys. There are two main differences in this sense. Whereas GLOBE includes questions referring to both practices (“as is”) and values (“should be”), Hofstede considers that practices are determined by values and, thus, only includes questions about values. Moreover, Hofstede questionnaires ask each individual about his/her personal perceptions about cultural dimensions, whereas GLOBE asks about society perceptions of cultural dimensions (Javidan et al., 2006; Maseland and Van Hoorn, 2009).
Third, Hofstede's dimensions are based on surveys to managers of the same multinational (IBM), whereas GLOBE's dimensions have been calculated on the basis of surveys to managers of more diverse origin. Moreover, the time of data collection differs between Hofstede and GLOBE. Whereas Hofstede started his project at the beginning of the 1970s and included new dimensions in 1991 and 2010, GLOBE started in the mid-1990s. Therefore, the cultural changes that might have taken place from the 1970s to the 1990s and from the 1990s to now could also explain the divergences between the two studies.
In sum, two main cultural indexes may be used by Strategic Management scholars to include informal institutions in their empirical analysis, namely, Hofstede's and GLOBE's. There is much discussion, based on their divergences, about which proposal is superior. These divergences can be explained by the structure of the survey, the different questions posited (even when the name of the variable is the same), the sample and the time at which these studies were conducted. Even admitting that these divergences exist, these indexes are frequently used in strategy journals. Some papers have even carried out analyses that take both measures into account in order to determine the robustness of their results (Hutzschenreuter and Voll, 2008; Hutzschenreuter et al., 2011).
ConclusionsThe objective of this paper has been to provide a useful tool for strategy scholars interested in incorporating the institutional dimension of strategy into their research. Our main contribution has been to identify the different alternatives available to measure formal and informal institutions, the relationship between them and some guidance about their use in empirical work. We have focused on the information that is more easily available to the researcher, that provided by worldwide public sources. Although there is no doubt that this selection of these measures is, in some ways, arbitrary, it can be justified by their ability to capture the formal and informal dimensions into which the institutional characteristics of the environment may be divided, and by the frequency with which they have been used in the past.
The paper offers two main groups of conclusions. The first is related to the idea that the opportunities for research in the intersection between strategic management and the institution-based view seem to be promising. From the theoretical point of view, the institution-based view provides researchers with enough arguments for it to become a source of inspiration for Strategic Management, given that it directly tackles the questions that define its domain. Of special interest is its potential power to explain why firm performance differs. The idea that institutions not only condition the different solutions offered to organizational problems, but that they also may be influenced by firms to obtain “influence rents” also seems to contribute to that explanation, widening the applicability of the theory. Whether influence rents will become the “standard fifth type” of rents, at the same level as efficiency, monopolistic, Schumpeterian or quasi-rents, is a question that will remain open for some time and that also depends on the interest the subject raises. The fact that all firms are embedded in societal systems also seems to evidence its potential applicability.
From the empirical point of view, although with some exceptions, the existing evidence has centered on the analysis of international businesses. Although there is no doubt that the international context is one of the natural places in which the theory could be applied, the literature suggests other avenues for research as may also be derived from the analysis above. One of them is to further explore the variation in institutions between different countries, even if the firms considered are not executing an international business strategy. Up to now, research has focused on emerging economies, losing the opportunity to explore the differences between developed and non-developed countries. These differences not only affect our understanding of the strategies and performance of international firms when going abroad, but they also help us to understand why similar strategies may offer different results in different institutional contexts. In this line, we have observed that the institution-based view has already been used in a wide variety of contexts seeking to analyze, for instance, the role of institutions in explaining product diversification or entry mode strategies. However, there is still a range of topics to which the theory may be applied. This paper suggests the analysis of first-mover advantages or multimarket competition theory as future arenas where the intersection between existing theories and the institution-based view could give us a more nuanced picture of these phenomena.
The second group of conclusions relates to the main objective of the paper, which has been to provide researchers with a view of the variables that capture the institutional environment within which firms operate and that may condition their performance. First, we have provided clear evidence of the feasibility of measuring the different dimensions that define the institutional environment, given the existence of publicly available information. Second, we have studied a selected set of variables that refer to the two main types of institutions that are frequently distinguished, offering a brief description of each of them and analysing their interrelations. Regarding formal institutions, we have focused our attention on the Index of Economic Freedom, the Political Constraints Index, the Corruption Perception Index and the Worldwide Governance Indicators. The correlations between some of these four indexes and, sometimes, between their components are high enough to make us think that the underlying concept they are measuring is very similar. Importantly, when a factorial analysis is performed, all the variables are reduced to one factor, apparently indicating that they are measuring the same underlying construct. From this evidence, our advice to researchers is to bear in mind that when measuring formal institutions, most of the analyzed alternatives point in the same direction.
A similar analysis has been performed to understand the variables proposed to measure the informal dimension of institutions. In this case, the sources of the data are Hofstede's study of culture and the GLOBE project. The main issue to highlight is that, although both studies attempt to measure the same underlying dimension, they achieve this task very differently and with a certain degree of contradiction. First, they differ in the number of underlying dimensions, the way the different questions are posited, the sources of the information provided and the timing. Second, and perhaps most important in terms of potential confusion, the dimensions that are similarly named are sometimes very difficult to conciliate and seem to be measuring different underlying dimensions. Our comparison of the Hofstede and GLOBE measures not only confirms this by sometimes even showing negative correlations between similarly named dimensions, but also that there are some unexpectedly high correlations between apparently different measures. Therefore, researchers incorporating the institution-based view are advised to be very careful when selecting the variable of informal institutions that best fits their theory. We suggest going directly to the source, either Hofstede or GLOBE, and understanding the meaning underlying each dimension in order to be more precise when selecting the measure. It is not only important to empirically justify the choice of one particular alternative, but also to theoretically argue in favor of the relationship between the theory used and the informal dimension analyzed.
In sum, this paper aimed to contribute to the consolidation of the institution-based view by presenting a guide for researchers for incorporating the institutional dimension into their works. This is just a first attempt; there is still a long way to go in integrating the extant Strategic Management theories and this new and promising perspective.
For a more detailed review of the link between transaction costs economics and the old and new institutionalism in the firm organizational adaptation, see Greenwood and Hinings (1996) and Roberts and Greenwood (1997).
As one anonymous referee points out, it is necessary to highlight the importance that the sociological view has for strategy. For example, the idea of organizational isomorphism (DiMaggio and Powell, 1983) has frequently been used with diverse objectives. Although the emphasis has traditionally been on the tendency of organizations to become similar, some authors (see Hambrick et al., 2005, for example) argue that, in fact, the factors proposed by DiMaggio and Powell have acted “in reverse”, increasing the tendency of firms to become more heterogeneous. Given the attention paid to heterogeneity by Strategic Management research, the implications of all this may be far reaching.
In order to build Table 1, we searched for the terms “institution and strategy” and “institution based view” in all the Journals appearing in the first quartile of the Social Science Citation Index (2012). We conducted the searches in Scopus and limited our observation window to papers appearing after the publication of Peng (2002). The final selection of papers included in Table 1 attempts to be representative of the research areas in which the institution-based view of strategy has been used.
The analysis for the rest of the periods is consistent with the one presented here (it is available from the authors upon request).
These analyses remain stable for the other periods. This information is available from the authors upon request.
We have included three additional indicators. Although the Index of Economic Freedom offers an overall index, we have shown that the 10 dimensions converge into two factors that behave differently (we have named them EFI 8 and EFI 2). We have included both of them in the analysis. Additionally, given that the Worldwide Governance Indicators do not provide an overall index, we have included the common factor that was previously calculated to allow comparisons between indicators.
These analyses remain stable for the other periods. Data are available from the authors upon request.
In the original work of Kogut and Singh (1988), cultural distance is calculated for the four dimensions of the Hofstede Index that were available and that we have adapted to the six currently available.
articles