


This paper analyzes differences in target leverage and speed of adjustment across three life cycle stages of European listed firms: introduction, growth and maturity. We determine that profitability and tangibility are the most stable determinants, whereas growth opportunities and size exhibit changing effects across stages. The speed of adjustment does not increase as the firms evolve, as firms in introduction are able to adjust the fastest. Firms changing stage adjust leverage at a lower speed, and their target is more affected by profitability, primarily when the change is from growth to maturity. Finally, we confirm the existence of long-term debt targets, by providing evidence that the next-year target is a relevant factor to explain current debt when firms change from one stage to another.
Since the seminal work of Fischer et al. (1989), which proposed a model of dynamic capital structure choice considering the adjustment costs, target leverage has become an important concept for research on capital structure. In addition to the identification of the determinants of the target leverage, the model computes the speed of adjustment to the target. Depending on the cost of transactions relative to the changes toward the new capital structure, the speed of adjustment varies across companies and over time (Hovakimian et al., 2001). Recent papers have studied the target leverage as a function of firm-level (Byoun, 2008; Chang and Dasgupta, 2009; Hovakimian and Li, 2011; Aybar-Arias et al., 2012; Faulkender et al., 2012) or country-level variables (Cook and Tang, 2010; Rubio and Sogorb, 2011), as well as in relation to firms’ legal and institutional environment (González and González, 2008; Öztekin and Flannery, 2012). Our work adds a new factor to this growing literature: the firm life cycle.
The empirical literature suggests the existence of changing patterns of capital structure across the life stages (La Rocca et al., 2011; Teixeira and Santos, 2014) and a time-varying target leverage ratio (Myers, 1984; Elsas and Florysiak, 2011) in response to changing circumstances and conditions. Several authors (Hackbarth et al., 2006; Drobetz et al., 2007) exhibit interesting relations between the speed of adjustment and well-known business cycle variables, indicating the impact of macroeconomic factors. However, there is no empirical evidence about the capital structure adjustment along the life cycle of the firm.
After using a classification model partially based on Dickinson (2011) that allows us to consider the comprehensive behavior of the firm to distinguish between firms in introduction, growth or maturity, we investigate a panel data of quoted firms from fourteen European countries to analyze their target determinants and their speed of adjustment across the stages.
Our work makes several contributions. First, we demonstrate that the main factors of target leverage as well as the speed of adjustment vary along the stages of the life cycle. Our findings suggest that firms adjust to the target ratio faster during introduction than during growth or maturity. Second, we observe differential effects of some determinants and a lower speed of adjustment in firms that have changed stage. We attribute this result to the increase of asymmetric information resulting in an intensification of transaction costs. Finally, we provide evidence that next-stage target leverage induces the level of current leverage, consistent with firms involved in the process of leverage adjustment previously (in advance) to carry out their planned investments.
The rest of the paper is organized as follows. The second section discusses the concepts of target leverage, adjustment speed, life cycle, and the relation between them to derive the hypotheses tested. The following section describes the research design including the measure of life cycle, the dynamic models of capital structure, the factors of target leverage, and the methodology used. The fourth section presents the sample and the descriptive statistics. The fifth section discusses empirical results and robustness checks. Finally, the sixth section presents the conclusions.
Theoretical background and hypothesesThe optimal capital structure has been related to the trade-off theory (TOT), as it poses that a firm's target leverage is driven by competing forces that originate the benefits and costs of debt, mainly the agency cost of financial distress and the tax-deductibility of debt finance (Myers, 1977). Under this dominant explanation, adjustment costs generate lags between the actual debt ratio and the optimal level by slowing down the speed at which firms adjust deviations (Myers, 1984; Titman and Tsyplakov, 2007). For example, if there are fixed transactions costs for issuing or retiring debt, a firm only rebalances when its debt ratio crosses an upper or lower hurdle (Fischer et al., 1989). Consistent with the trade-off reasoning, the following factors have been found crucial to determine the speed of adjustment (Elsas and Florysiak, 2011): high opportunity costs of deviating from a target, for example, in firms with high financing deficits or in small firms; and high default risk.
However, for Shyam-Sunder and Myers (1999), the existence of a target debt ratio does not invalidate the pecking order theory (POT). Flannery and Rangan (2006) find that although more than half of the observed changes in debt ratios are from targeting behavior, pecking order considerations account for part of them (less than 10%). Under the POT, managers do not attempt to maintain a particular target; instead, the leverage ratio is defined as the gap between operating cash flows and investment requirements over time (Barclay and Smith, 1999). In this line, Byoun's (2008) results suggest that many adjustments occur when firms have above-target debt with a financial surplus or when they have below-target debt with a financial deficit. Hovakimian and Li (2009) find asymmetric adjustment costs depending on whether the firm is above or below its target leverage. They find particularly low incremental costs when the firm pays off the excess debt with internal funds. Consistent with the pecking order reasoning, some factors appear as crucial to determine the speed of adjustment: the level of information asymmetry between insiders and outsiders (Öztekin and Flannery, 2012); a variable related to debt capacity, size (Drobetz et al., 2007; Aybar-Arias et al., 2012); other variables indicating current or future additional investments, such as growth (Drobetz and Wanzenried, 2006; Drobetz et al., 2007) or growth opportunities (Aybar-Arias et al., 2012); and cash flow (Faulkender et al., 2012).
We argue that the TOT and the POT change their prevalence along the introduction, growth, and maturity stages of the firm life cycle, giving rise to changing patterns of both debt targets and adjustment speeds. Costs and benefits of adjusting debt, adduced by the TOT, such as bankruptcy costs and tax shields, depend on firm-specific factors that evolve along life cycles as the firms do. Concerning the POT, factors behind the firm financing needs, ability to produce cash flows, financing alternatives, debt capacity, and information asymmetries evolve along the life cycle as well.
Target leverage and life cycleConsidering the trade-off reasoning, the costs and benefits of debt financing are expected to change over the life cycle, thus allowing or forcing firms to modify their financing strategies. As firms grow and develop, they are usually more profitable and have more tangible assets that can act as collateral (Titman and Wessels, 1988), whereas their size allows them to be more diversified (González and González, 2008), and these three factors contribute to a reduction in bankruptcy costs. As for growth opportunities, the literature attributes this factor an increase of bankruptcy costs, that would reduce leverage (Frank and Goyal, 2009), however, some authors find that firms with more growth opportunities have relative cost advantages in external growth funding (Drobetz et al., 2007; Elsas and Florysiak, 2011). During maturity, the trust of shareholders and the market is greater, easing the transaction of these firms and decreasing their costs with regard to the growth stage. As for the benefits of debt, the possibility of using tax shields effectively varies depending on net income or profitability (Frelinghaus et al., 2005; Pfaffermayr et al., 2013). In sum, according to the TOT, taxes, and bankruptcy costs drive more profitable firms toward greater leverage; rather low bankruptcy costs through collateralization drive firms with high proportions of tangible assets toward high target leverage ratios; and lower probability of bankruptcy through higher diversification drive big firms toward higher leverage ratios. Therefore, as transaction costs of financing and bankruptcy costs decrease whereas more tax shields can be used effectively, we can expect a higher validity of the TOT in larger and more mature firms, meaning higher target leverage and higher levels of debt for these types of firms, in line with Frelinghaus et al. (2005). We derive our hypothesis H.1a:H.1a As firms grow and mature, profitability, size and tangibles become stronger positive drivers of the target leverage.
As posed by the POT, the information asymmetries between insiders and outsiders tend to be higher during the earlier stages of firm life cycles, whereas debt capacity is lower (Teixeira and Santos, 2014; Pfaffermayr et al., 2013). In line with González and González (2012) we could expect the POT predictions to be more valid during introduction and growth,1 when the information asymmetry is higher. Start-up equity financing should become more probable than start-up debt financing in an information asymmetry scenario, as Hirsch and Walz (2011) find for boom periods, when economies and industries grow rapidly. On the one hand, factors that increase as the firms evolve, such as age or size, indicate bigger debt capacity (due to know-how, notoriety, and collateral). In the same direction, growth and growth opportunities indicate more fund needs (higher investment requirements). On the other hand, during growth and maturity firms hold cash to undertake their profitable investment projects deprived of raising outside funds at high transaction costs (Saddour, 2006). In sum, according to the POT, higher profitability enables firms to use less debt; low information asymmetry as a reason of less costly debt issuances drive firms with more tangible assets toward greater leverage; and know-how, notoriety and collateral, working as an indication of debt capacity drive firms with bigger size toward higher leverage ratios. Therefore, the POT supports the hypothesis H.1a in respect to size and tangibles but an additional hypothesis H.1b is derived.2H.1b As firms grow and mature, profitability contributes as a stronger negative driver of target leverage.
Finally, from Jalilvand and Harris (1984), a number of works allude to long-run target capital structures, finding that the rate of annual convergence toward the target is lower than 40% for the typical firm (Flannery and Rangan, 2006; Huang and Ritter, 2009) or lower than 20% once the methodological bias has been avoided (Hovakimian and Li, 2009). Furthermore, Leary and Roberts (2005) attribute to some firm shocks lasting effects despite active rebalancing. In this line, we have considered the magnitude of investments when a large firm changes from one stage to another. For listed firms, the process to adjust the current capital structure to the future target may be longer than a period. This is consistent with a relevant fraction of major financing transactions associated with adjustments away from the target or adjustments beyond the target, even in cases in which the speeds of adjustment are substantially higher (Hovakimian and Li, 2009). In line with the possible use of the financial structure to sign higher expected performance3 in the next future (Ross, 1977), those drivers concerned by the improved expected returns, such as profitability, size, or tangibles could shift the intensity or even the sign of their effect on the current leverage when future values are taken instead of the current values. Given that the capital structure is the first decision a firm has to take before starting a new investment project, we hypothesize that during the period previous to a changing of life stage, the firm's leverage is not only explained by the contemporaneous target but by the target leverage of the next stage, leading to a new hypothesis not previously tested in this line of research.H.2 When the firm changes from one stage to another, the target leverage of the next stage is an explanatory factor of the current capital structure.
Unlike the previous works, we study the speed of adjustment to target leverage in a dynamic way by taking into consideration how the speed of adjustment changes by life cycle stages and how the speed changes when firms evolve from one stage to another. Considering the trade-off reasoning, during introduction, transaction costs are higher because of the limited possibilities of financing, as they have not projected a fully reliable and strong position in the market. During growth, additional needs of external financing (Saddour, 2006) and/or bargaining fight (Delmas and Marcus, 2004) may generate transaction costs, though firms with more growth opportunities have relative cost advantages in external growth funding (Drobetz et al., 2007; Elsas and Florysiak, 2011) and adjust faster. During maturity, firms can choose among alternative types of financing, which implies lower transaction costs, such as the cost of paying dividends to a wider number of shareholders or the cost of issuing bonds to a wider number of bondholders; furthermore, they frequently have less cash flow volatility which decreases the possible costs of distress increasing the expected speed of adjustment. Consistent with this reasoning, Hovakimian and Li (2009) identify firms in the highest maturity debt group as the ones with the highest speed of adjustment.
Both Hackbarth et al. (2006) and Drobetz et al. (2007) relate the speed to the economic cycle. Using common business cycle variables linked to the current or future state of the economy, they conclude that the adjustment is faster during booms than in recession periods, that is, with low interest rates and negligible risks of disruption in the global financial system. They attribute their results to the importance of these determinants of default risk. Therefore, the fewer transaction costs of financing and the fewer bankruptcy costs during maturity lead to our third hypothesis:H.3 As firms mature, an increase of the speed of adjustment is expected.
Concerning the POT, as growth starts leveling off during maturity earnings and cash flows will continue to increase rapidly, reflecting past investments, but the investment in new projects will decline, decreasing the financing needs. Larger firms often have lower information asymmetry, which would indicate a lower cost of financing and faster adjustment. Thus, better analyst coverage reduces information asymmetry upon announcement of debt or equity issues (Hovakimian and Li, 2009). In this line, Bulan and Yan (2010) find that the POT better explains the financing decisions of mature firms compared to growth firms. Therefore, the pecking order reasoning provides us with factors pushing the speed of adjustment up. Lower information asymmetry and financing needs reduce adjustment costs, favoring a higher speed of adjustment and reinforcing our third hypothesis.
However, firms changing from one stage to another will suffer higher levels of information asymmetry between the firm managers and the financing market, generating higher transaction costs. Both, the change from introduction to growth and the change from growth to maturity, take place in a period for which the firm's information talks about the previous situation when the firm's managers need financing for the following stage. The information asymmetry concerns the variations of risk, profitability and generation of cash flows, from one stage to another. Furthermore, for firms that change from introduction to growth, certain transaction costs such as those stemming from cash flow volatility are expected to be higher than for firms that advance from growth to maturity. Consequently, the speed of adjustment should be slower in the last case. Hence, we pose two new hypotheses:H.4a During the year in which firms change to the subsequent stage, the speed of adjustment is lower than for firms remaining in the same stage. The speed of adjustment is faster for firms changing from growth to maturity than for firms changing from introduction to growth.
Note that hypotheses H.4a and H.4b concern only those firms classified in different stages in two consecutive periods. The speed of adjustment would be lower during the transition to a new stage, showing a lack of linearity in respect to the evolution of the speed posed by the previous hypothesis H.3. For example, in accordance with H.3, a higher speed of adjustment is expected for mature firms than for firms in the growth stage, but, according to H.4a, a lower speed of adjustment is expected in the transition period from growth to maturity.
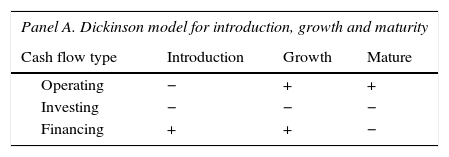
Research designMeasure of life cycleTo consider different aspects of the business by assigning firms to the proper stage of their life cycle, we have started from the model by Dickinson (2011) previously used by Castro et al. (2015) in a capital structure context. Dickinson (2011) empirically demonstrates that, consistent with theory, profitability and growth differ as the firm progress through life stages taking into consideration the signs of the operating, investing and financing cash flows disclosed in the Cash Flow Statement. The combinations of these signs allow us to establish five possible stages, of which we focus on the first three: introduction, growth and maturity,4 as presented in Table 1 (Panel A), considering only what concerns the operating and investing activities.
Life cycle stage model.
| Panel A. Dickinson model for introduction, growth and maturity | |||
|---|---|---|---|
| Cash flow type | Introduction | Growth | Mature |
| Operating | − | + | + |
| Investing | − | − | − |
| Financing | + | + | − |
| Panel B. Modified Dickinson model for introduction, growth and maturity | |||
|---|---|---|---|
| Introduction | Growth | Mature | |
| Operating CF | − | + | + |
| Investing CF | − | − | − |
| Growth-risk | (Growth Decile+Risk Decile)/2 must be ≥5 | (Growth Decile+Risk Decile)/2 must be ≥5 | (Growth Decile+Risk Decile)/2 must be <5 |
Given that our study concerns the evolution of firm leverage across the life cycle, and the Dickinson model includes financial cash flows (combined with operating and investing cash flows) to discriminate between the life cycle stage in which the firms are classified, an endogeneity problem could bias the results. In order to avoid this potential problem, we have discarded that part of the Dickinson model that uses financial cash flows. Therefore, as this third type of cash flows is necessary to distinguish between firms in growth and maturity stages, as well as to distinguish firms in the shake-out stage against firms in any other stage, we have introduced an alternative discriminant criterion, based on previous empirical literature (Table 1, Panel B). The new criterion combines two relevant factors in life cycle theory: growth and risk, especially discriminant for the introduction/growth stages against the maturity stage.5 The first discriminant factor is growth because relatively young firms are fast growing (Mueller, 1972) both in sales and assets (Miller and Friesen, 1984), considering for this study the growth of sales with respect to the previous year. The second discriminant measure is risk, which is found to be remarkably higher during the birth, growth and revival stages, in contrast with the more conservative maturity and decline stages (Miller and Friesen, 1984). In this study, we use the yearly standard deviation of monthly returns. Then, we consider the joint effect of these variables. We calculate the decile of the risk and growth variables by year and country. Then, we create a new variable that takes the average value of the deciles in which these two factors are placed. Consequently, the firm is in the introduction or growth stage when the resulting value is equal or higher than 5; meanwhile, it is in the maturity stage when the value is lower than 5.
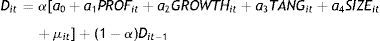
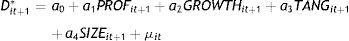
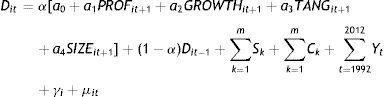
Dynamic models of capital structureWe have used a target adjustment model in the line proposed by Miguel and Pindado (2001), which takes into account the role of transaction costs when firms change their debt level and furthermore computes the target debt level as a function of the determining factors of capital structure. The model tests how quickly the debt level (Dit−1) moves toward the target (Dit*) in one period.

The transaction costs impede firms from fully adjusting their levels of indebtedness to the target level. Therefore, the coefficient α varies between 0 and 1 and is inversely related to adjustment costs. In the extremes, firms completely adjust their leverage to the optimal level (α=1) when transaction costs are zero; on the contrary, transaction costs may be so high that no firm adjusts its debt level (α=0), maintaining the previous debt level.

Following González and González (2008) and Rajan and Zingales (1995), profitability (PROF), growth opportunities (GROWTH), tangible assets (TANG) and size are included in the model as determinants of the target debt.
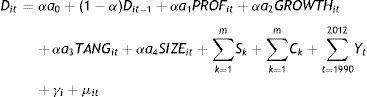
where Dit is the leverage of firm i in year t, α0 is the independent term and a are the coefficients of the variables taken as explanatory factors, Sk is the set of 49 sector dummies to control for sector effects based on the Fama and French industry classification,6Ck is the set of country dummy variables controlling for other aspects beyond those explicitly included in the equation, and Yt is a set of time dummy variables for each year capturing any unobserved firm time effect not included in the regression. γi is the firm effect, which is assumed to be constant for firm i over t; and μit is the error term. In our empirical analysis, we run several groups of regressions using diverse combinations of these variables.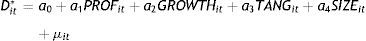
Our proxy for leverage is the ratio of total debt (long term debt plus short term debt) to total assets, in book values.7 Profitability is computed as the ratio of earnings before interest, taxes, depreciation, depletion, and amortization over total assets. Growth opportunities is the market to book ratio, defined as the market value of equity plus debt in current liabilities plus long-term debt plus preferred stocks minus deferred taxes and investment tax credit over total assets. We proxy tangible assets by the rate of property, plant, and equipment over total assets (TANG). Finally, size is measured as the logarithm of total assets.
To consider the life cycle of the firm jointly with this dynamic model of capital structure, we test the model for the group of companies placed inside the introduction, growth, and maturity stages. According to the classification criteria explained in the section “Measure of life cycle”, we select the specific group of firms belonging to each stage when needed to applying the models. Thus, we test if the different financing strategies of the firm across the stages change the drivers’ effect on the target and modify the speed of adjustment.
Concerning the second and fourth hypotheses, we study how the next-year target leverage affects the current debt and how the speed of adjustment varies when the firms change of stage. We run the regression with five different samples depending on the situation of the firms in two consecutive years: firms remaining in introduction, firms changing from introduction to growth, firms remaining in growth, firms changing from growth to maturity, and firms remaining in maturity.
To test the second hypothesis, we model current debt as a function of the next-year target instead of the contemporaneous target. The modified model is as follows:

We use the panel data methodology to alleviate the endogeneity concerns driven by unobservable heterogeneity; our models are estimated by using a more advanced method of GMM (Arellano, 2003; Baltagi, 2005; Wooldridge, 2002), specifically the two-step GMM estimator, included in the xtabond2 Stata routine written by Roodman (2009) that uses one-step residuals to construct the asymptotically optimal weighting matrix and addresses the heterogeneity and endogeneity problems. The GMM estimator addresses the heterogeneity problem by modeling it as an individual effect, which is removed by taking first differences of the variables used in the regression. Also, GMM shows its efficiency by adding new nonlinear functions of the exogenous variables to the instruments (Hsiao, 2003). Besides, the endogeneity problem is mitigated by using the lags of all the right-hand side variables. As explained in the previous section, we use predetermined variables that have been carried out using the system GMM in panel data, developed by Arellano and Bover (1995) and Blundell and Bond (1998).
We use the m statistic, which tests for lack of second-order serial correlation in the two first-difference residuals, as this condition is required for the proper functioning of the estimator. An additional test of specification used is the Hansen's statistic of over-identifying restrictions, which tests for the absence of correlation between the instruments and the error term. The use of panel data improves the efficiency of econometric estimates and is more flexible in the choice of variables to be used as instruments to control for endogeneity.
Sample and descriptive analysisSampleIn our analysis, we have used firm balance-sheet, income-statement and cash-flow-statement annual data from Worldscope database. As indicated in Table 1, the signs of the Worldscope variables ‘Net Cash Flow, Operating Activities’ and ‘Net Cash Flow, Investing’, jointly with a complementary criterion concerning growth and risk, allow us to assign firms into the three life cycle stages studied. The cash flow statement is generally not available prior to 1989. Therefore, our sample covers the period 1990–2012. The panel data contain all quoted8 firms from Austria, Belgium, Denmark, Finland, France, Germany, Greece, Italy, Netherlands, Norway, Portugal, Spain, Sweden and UK (11,553 firm-year observations). The sample is made up of the main European countries as regards the number of listed firms. To test the first and the third hypotheses, we take all those firms classified into the introduction, the growth or the maturity stages, according to the classification criteria9 explained in the section “Measure of life cycle”. For our second, and fourth hypotheses, we work with five subsamples, firms that change from introduction to growth (453 firm-year observations), firms that move from growth to maturity (1363 firm-year observations) and firms that maintain in the same stage (837 firm-year observations in introduction; 2700 in growth; and 1683 in maturity). We exclude financial and regulated firms (SIC codes 6000–6999 and 4900–4999) from the sample. Moreover, we winsorize all variables at the 3% level to avoid the influence of outliers.
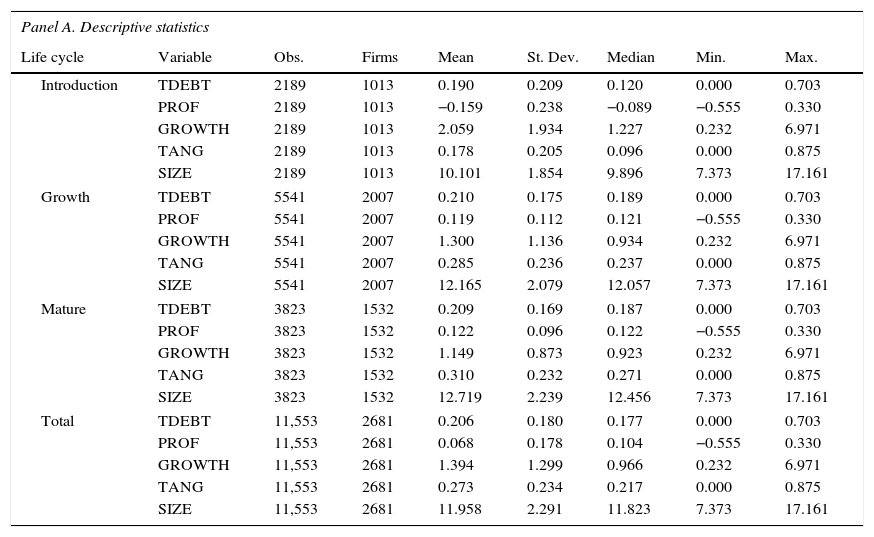
Descriptive statisticsTable 2 reports the descriptive statistics by life cycle stage. The total sample indicates a mean leverage ratio of 20.6%; being higher for firms during growth and maturity than for introduction firms. The mean profitability of 6.8% hides strong differences between the negative mean for firms in introduction and around 12% during growth and maturity. Profitability is higher for firms changing stage (Table 2, Panel B). Property, plant and equipment to total assets, and size exhibit growing numbers across the stages, as expected, in line with La Rocca et al. (2011). By contrast, growth opportunities exhibit a sound decreasing pattern as the firms evolve, as in La Rocca et al. (2011) and Teixeira and Santos (2014).
Descriptive statistics. General.
| Panel A. Descriptive statistics | ||||||||
|---|---|---|---|---|---|---|---|---|
| Life cycle | Variable | Obs. | Firms | Mean | St. Dev. | Median | Min. | Max. |
| Introduction | TDEBT | 2189 | 1013 | 0.190 | 0.209 | 0.120 | 0.000 | 0.703 |
| PROF | 2189 | 1013 | −0.159 | 0.238 | −0.089 | −0.555 | 0.330 | |
| GROWTH | 2189 | 1013 | 2.059 | 1.934 | 1.227 | 0.232 | 6.971 | |
| TANG | 2189 | 1013 | 0.178 | 0.205 | 0.096 | 0.000 | 0.875 | |
| SIZE | 2189 | 1013 | 10.101 | 1.854 | 9.896 | 7.373 | 17.161 | |
| Growth | TDEBT | 5541 | 2007 | 0.210 | 0.175 | 0.189 | 0.000 | 0.703 |
| PROF | 5541 | 2007 | 0.119 | 0.112 | 0.121 | −0.555 | 0.330 | |
| GROWTH | 5541 | 2007 | 1.300 | 1.136 | 0.934 | 0.232 | 6.971 | |
| TANG | 5541 | 2007 | 0.285 | 0.236 | 0.237 | 0.000 | 0.875 | |
| SIZE | 5541 | 2007 | 12.165 | 2.079 | 12.057 | 7.373 | 17.161 | |
| Mature | TDEBT | 3823 | 1532 | 0.209 | 0.169 | 0.187 | 0.000 | 0.703 |
| PROF | 3823 | 1532 | 0.122 | 0.096 | 0.122 | −0.555 | 0.330 | |
| GROWTH | 3823 | 1532 | 1.149 | 0.873 | 0.923 | 0.232 | 6.971 | |
| TANG | 3823 | 1532 | 0.310 | 0.232 | 0.271 | 0.000 | 0.875 | |
| SIZE | 3823 | 1532 | 12.719 | 2.239 | 12.456 | 7.373 | 17.161 | |
| Total | TDEBT | 11,553 | 2681 | 0.206 | 0.180 | 0.177 | 0.000 | 0.703 |
| PROF | 11,553 | 2681 | 0.068 | 0.178 | 0.104 | −0.555 | 0.330 | |
| GROWTH | 11,553 | 2681 | 1.394 | 1.299 | 0.966 | 0.232 | 6.971 | |
| TANG | 11,553 | 2681 | 0.273 | 0.234 | 0.217 | 0.000 | 0.875 | |
| SIZE | 11,553 | 2681 | 11.958 | 2.291 | 11.823 | 7.373 | 17.161 | |
| Panel B. Mean differences | |||
|---|---|---|---|
| Mean diff. (Growth minus Introduction) | Mean diff. (Maturity minus Growth) | Mean diff. (Stage Change minus Unchange) | |
| TDEBT | 0.0202*** | −0.000949 | 0.00706 |
| PROF | 0.278*** | 0.00332 | 0.0261*** |
| GROWTH | −0.759*** | −0.151*** | −0.215*** |
| TANG | 0.107*** | 0.0250*** | −0.0124 |
| SIZE | 2.064*** | 0.554*** | 0.0569 |
Notes: TDEBT is book leverage (total debt/total assets); PROF is profitability (EBITDA/total assets); GROWTH is market to book (market value of equity+debt in current liabilities+long-term debt+preferred stocks−deferred taxes and investment tax credit to total assets); TANG is tangibility (property, plant and equipment/assets); and SIZE is the logarithm of total assets. Mean dif. indicates the difference of means test (t-test).
*Significance at the 5% level.
**Significance at the 1% level.
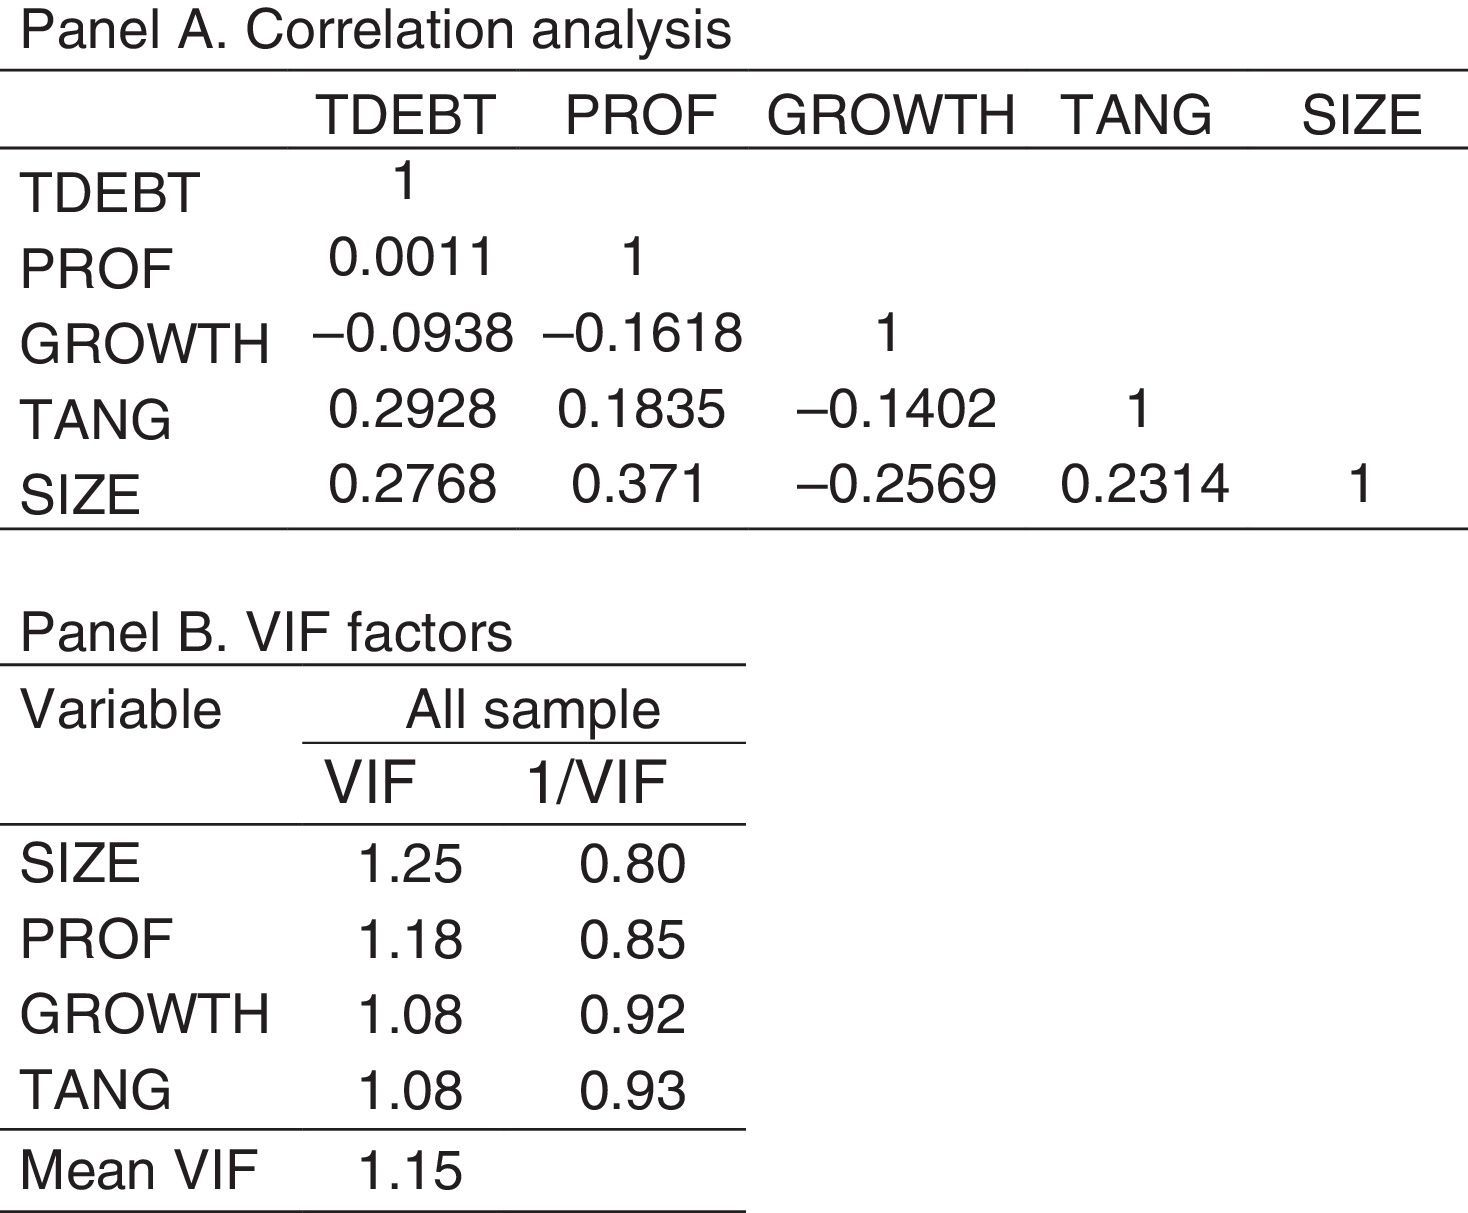
In the Appendix we show the correlation matrix and the VIF factors (Panels A and B). Looking to these correlations and some untabulated results by stage, tangibility and size appear as the most important factors for leverage. According to much of the previous empirical evidence, debt ratios are positively correlated with size and tangibility in the three stages studied, and negatively correlated with profitability in the growth and maturity stages (even though the general sign in the Appendix is positive). The maximum value for the relation with profitability appears during growth. Remarkable differences can be appreciated along the life cycle of the firm. All VIF factors indicate the absence of multicollinearity between the independent variables.
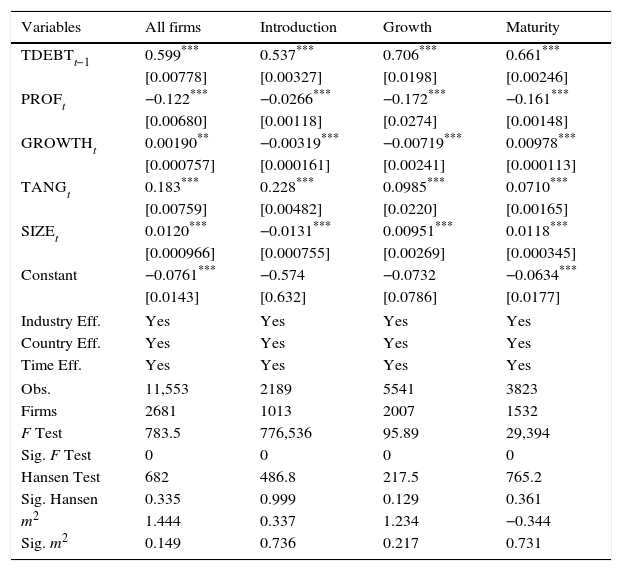
ResultsEmpirical resultsTable 3 compares the results on the determinants of firm leverage and the speed of adjustment across the three life cycle stages studied. In this table, we observe that the traditional determinants of capital structure are significant drivers of the target leverage, but coefficients, signs, and significance change along the three stages. The most stable factors of target leverage from introduction to maturity are profitability and tangible assets. Growth opportunities is a relevant determinant but shows changes of signs across stages, in line with the results obtained by González and González (2012) for small, medium-size, and large firms. Regarding size, it is the factor with stronger influence on the level of debt in our study, even though the sign changes across the stages, showing a lack of linearity, in accordance with the different behavior found by González and González for the debt determinants across different sizes of firms. Our results are consistent with economic changes and corporate actions moving firms either away or toward their target (Titman and Tsyplakov, 2007); however, it is consistent with the leverage target varying in response to the evolution of market imperfections, such as taxes, financial distress costs (TOT), or asymmetric information (POT).
By-stage determinants of firm leverage. System GMM.
| Variables | All firms | Introduction | Growth | Maturity |
|---|---|---|---|---|
| TDEBTt−1 | 0.599*** | 0.537*** | 0.706*** | 0.661*** |
| [0.00778] | [0.00327] | [0.0198] | [0.00246] | |
| PROFt | −0.122*** | −0.0266*** | −0.172*** | −0.161*** |
| [0.00680] | [0.00118] | [0.0274] | [0.00148] | |
| GROWTHt | 0.00190** | −0.00319*** | −0.00719*** | 0.00978*** |
| [0.000757] | [0.000161] | [0.00241] | [0.000113] | |
| TANGt | 0.183*** | 0.228*** | 0.0985*** | 0.0710*** |
| [0.00759] | [0.00482] | [0.0220] | [0.00165] | |
| SIZEt | 0.0120*** | −0.0131*** | 0.00951*** | 0.0118*** |
| [0.000966] | [0.000755] | [0.00269] | [0.000345] | |
| Constant | −0.0761*** | −0.574 | −0.0732 | −0.0634*** |
| [0.0143] | [0.632] | [0.0786] | [0.0177] | |
| Industry Eff. | Yes | Yes | Yes | Yes |
| Country Eff. | Yes | Yes | Yes | Yes |
| Time Eff. | Yes | Yes | Yes | Yes |
| Obs. | 11,553 | 2189 | 5541 | 3823 |
| Firms | 2681 | 1013 | 2007 | 1532 |
| F Test | 783.5 | 776,536 | 95.89 | 29,394 |
| Sig. F Test | 0 | 0 | 0 | 0 |
| Hansen Test | 682 | 486.8 | 217.5 | 765.2 |
| Sig. Hansen | 0.335 | 0.999 | 0.129 | 0.361 |
| m2 | 1.444 | 0.337 | 1.234 | −0.344 |
| Sig. m2 | 0.149 | 0.736 | 0.217 | 0.731 |
Notes: Regressions are estimated using the system GMM estimator for panel data with lagged dependent variables. TDEBT is book leverage (total debt/total assets); PROF is profitability (EBITDA/total assets); GROWTH is market to book (market value of equity+debt in current liabilities+long-term debt+preferred stocks−deferred taxes and investment tax credit to total assets); TANG is tangibility (property, plant and equipment/assets); and SIZE is the logarithm of total assets. Heteroskedasticity consistent asymptotic standard error is in brackets.
*The significance at the 10% level.
Profitability exhibits a negative contribution to the target leverage, in line with the most common result in the previous literature. According to our results, the POT would support the behavior of leverage with respect to profitability along the three life stages considered, suggesting that higher profitability increases retained earnings, thus reducing the target debt. The higher values during growth and maturity confirm our hypothesis H.1b.
High growth opportunities during pre-mature stages of the life cycle usually involve new projects (much better known by insiders), indicating higher information asymmetry. Thus, during earlier stages, the access to new external financing is hampered, and firms are forced to use capital or retained earnings. In addition, low current free cash flows imply little need of debt to provide a tax shield or to control managerial spending. On the other hand, growth opportunities increase both debt capacity and funding needs. During the introduction stage, the negative sign suggests that firms can finance their new investments with capital, as the profitability rate is negative. During the growth stage, the negative sign points to the use of capital or retained earnings to finance the new investments without using additional debt. During maturity, the positive coefficient for growth opportunities indicates higher debt capacity and lower asymmetric information. The small coefficients are consistent with growth opportunities exerting opposite effects on leverage. The mixed evidence found for growth opportunities in previous works (González and González, 2008) would be explained by heterogeneous samples made up of firms in different stages of their life cycles, as well as by the mentioned opposite forces in place during the stages.
As for tangible assets, we obtain a positive relation with leverage, indicating the effect of tangibles as collateral to reduce costs of distress and debt-related agency problems. Contrary to our hypothesis H.1a, during introduction, our results suggest a stronger effect of tangibility on leverage. During growth, and particularly maturity, the coefficient is lower (similar to La Rocca et al., 2011). This is likely because mature firms have access to diverse sources of financing. For example, profitable firms are able to finance the increase of tangible assets with internal funds, as suggested by the correlation matrix.
Size exhibits a different relation with leverage through the life cycle. During introduction, the coefficient is negative. The positive and significant coefficient during growth and maturity is consistent with the traditional arguments of both the TOT and the POT. Distress costs decrease, according to the TOT, while debt capacity increases in larger and mature firms due to their know-how, notoriety and collateral, in line with the POT, supporting our hypothesis H.1a. The access to diverse sources of funds gives firms the option for cheaper sources of debt. In addition, transaction costs decrease due to the reduction of information asymmetry.
A Chow test was applied comparing first the three life cycle stages, and then each stage against the other two. The highly significant values obtained (untabulated) for all the independent variables indicate that the coefficients are different across the stages.
Concerning the speed of adjustment, our comprehensive coefficient on lagged leverage (0.6) is similar to those obtained for literature references using a comparable methodology,10 such as Flannery and Rangan (2006) or Chang and Dasgupta (2009) who obtain 0.62, and Cook and Tang (2010), with most coefficients between 0.5 and 0.67. The column 2 (introduction) indicates a coefficient of 0.537 for Debtt−1, which implies a value of 0.463 for α. As a result, the adjustment to the target leverage is the highest, suggesting a lower effect of transaction costs than during other stages. However, growth and maturity (columns 3 and 4) exhibit higher coefficients, meaning α closer to zero (0.294 and 0.339, respectively) and hence higher transaction costs. The coefficients suggest different levels of transaction costs in the three stages of the life cycle, remarkably higher during growth in comparison with introduction and maturity. Thus, our results do not support our third hypothesis with regard to the comparison of the introduction stage with the other two, although H.3 is supported by the reduction of transaction costs from the growth stage to maturity.
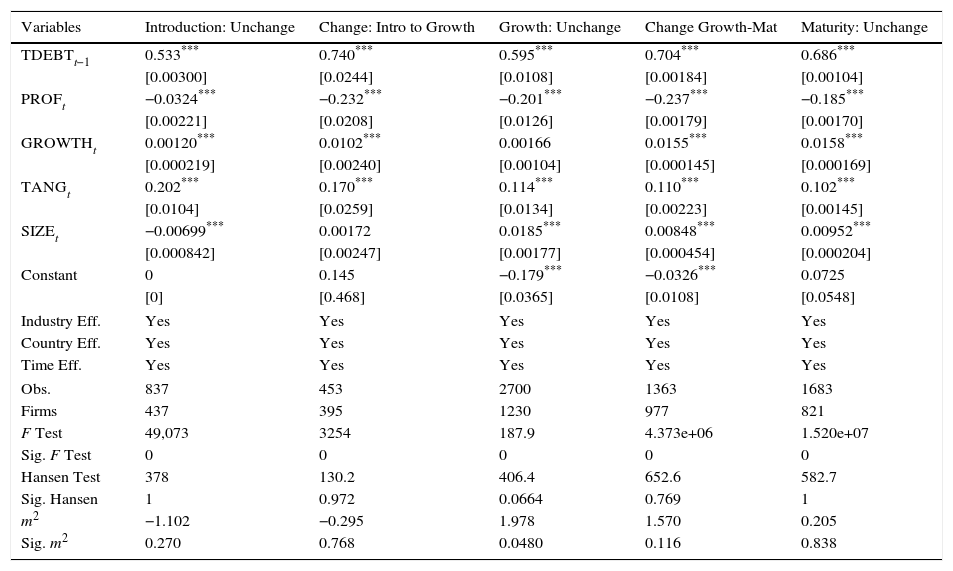
In Table 4, we compare the target leverage determinants between the firms that change and those that remain in the same life stage. Moreover, we distinguish the change from introduction to growth and from growth to maturity. A Chow test was applied comparing the five groups of coefficients, and then the coefficients obtained for the change from introduction to growth against the change from growth to maturity (untabulated), obtaining highly significant values what indicates different coefficients.
Determinants of firm leverage according to the stage change. System GMM.
| Variables | Introduction: Unchange | Change: Intro to Growth | Growth: Unchange | Change Growth-Mat | Maturity: Unchange |
|---|---|---|---|---|---|
| TDEBTt−1 | 0.533*** | 0.740*** | 0.595*** | 0.704*** | 0.686*** |
| [0.00300] | [0.0244] | [0.0108] | [0.00184] | [0.00104] | |
| PROFt | −0.0324*** | −0.232*** | −0.201*** | −0.237*** | −0.185*** |
| [0.00221] | [0.0208] | [0.0126] | [0.00179] | [0.00170] | |
| GROWTHt | 0.00120*** | 0.0102*** | 0.00166 | 0.0155*** | 0.0158*** |
| [0.000219] | [0.00240] | [0.00104] | [0.000145] | [0.000169] | |
| TANGt | 0.202*** | 0.170*** | 0.114*** | 0.110*** | 0.102*** |
| [0.0104] | [0.0259] | [0.0134] | [0.00223] | [0.00145] | |
| SIZEt | −0.00699*** | 0.00172 | 0.0185*** | 0.00848*** | 0.00952*** |
| [0.000842] | [0.00247] | [0.00177] | [0.000454] | [0.000204] | |
| Constant | 0 | 0.145 | −0.179*** | −0.0326*** | 0.0725 |
| [0] | [0.468] | [0.0365] | [0.0108] | [0.0548] | |
| Industry Eff. | Yes | Yes | Yes | Yes | Yes |
| Country Eff. | Yes | Yes | Yes | Yes | Yes |
| Time Eff. | Yes | Yes | Yes | Yes | Yes |
| Obs. | 837 | 453 | 2700 | 1363 | 1683 |
| Firms | 437 | 395 | 1230 | 977 | 821 |
| F Test | 49,073 | 3254 | 187.9 | 4.373e+06 | 1.520e+07 |
| Sig. F Test | 0 | 0 | 0 | 0 | 0 |
| Hansen Test | 378 | 130.2 | 406.4 | 652.6 | 582.7 |
| Sig. Hansen | 1 | 0.972 | 0.0664 | 0.769 | 1 |
| m2 | −1.102 | −0.295 | 1.978 | 1.570 | 0.205 |
| Sig. m2 | 0.270 | 0.768 | 0.0480 | 0.116 | 0.838 |
Notes: Regressions are estimated using the system GMM estimator for panel data with lagged dependent variables. TDEBT is book leverage (total debt/total assets); PROF is profitability (EBITDA/total assets); GROWTH is market to book (market value of equity+debt in current liabilities+long-term debt+preferred stocks−deferred taxes and investment tax credit to total assets); TANG is tangibility (property, plant and equipment/assets); and SIZE is the logarithm of total assets. Heteroskedasticity consistent asymptotic standard error is in brackets.
*The significance at the 10% level.
**The significance at the 5% level.
For firms changing stage, profitability seems to play a more relevant role as a negative determinant of target debt. With higher information asymmetry, firms have more difficulties to obtain debt, in the line of the POT reasoning and the results found by Hirsch and Walz (2011), therefore, profitable firms will turn to capital or retained earnings in higher proportions than when they maintain in the same stage. If we analyze size, we can observe a significant evolution through the stages. During introduction, the relation is negative, which supports the POT because the adverse selection problems considerably decrease in large firms. Then, the relation is not significant during the transition from introduction to growth up to the point of turning positive and considerable higher during growth. The TOT considers size as a sign of the firms’ strength for lenders, in parallel with assets as collateral.
The lowest speed takes place when firms change from introduction to growth (α=0.260) followed by those changing from growth to maturity (α=0.296). These results support our hypotheses H.4a and H.4b and are consistent with higher information asymmetries increasing transaction costs for firms in transitions, being even higher costs when the transition is from introduction to growth.
In addition, the change in the life cycle stage involves new strategies, for which new financing may be necessary, implying different and more difficult ways to access to the market, resulting in higher transaction costs. A change of stage always brings about riskier strategies and decisions, with which the stakeholders may not agree, producing a conflict of interest that noticeably increase the transaction costs. Moreover, asymmetric information can affect all dealings of the firm, hindering their accomplishment or increasing their cost. For example, administrative, enforcement, or fiscal procedures may be delayed by several conflicts.
The coefficient in the second column suggests that the strategies or transactions made by a firm evolving from introduction to growth cause distrust in the market, leading to higher costs in accessing additional financing. Consistent with Hovakimian and Li (2009), firms adjusting to pay off the excess of debt exhibit lower adjustment costs. The presence of both types of firms in this group, those who reduce debt and those who increase it, explains the small difference in adjustment costs with respect to firms that remain in maturity.11
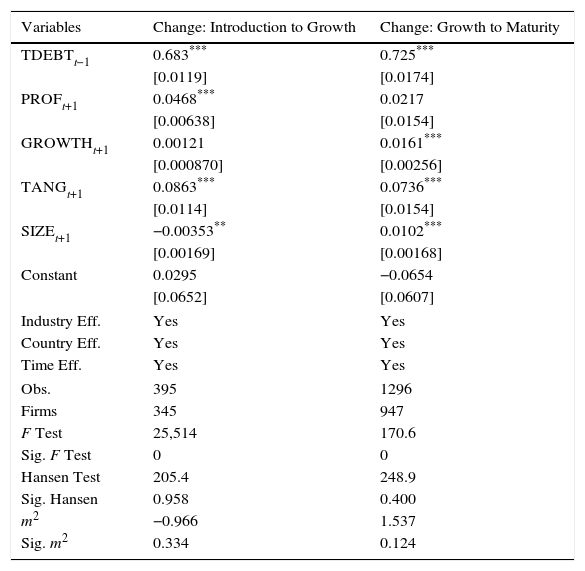
Then, we perform a third group of regressions to test if the target leverage of the next stage acts as a key factor to explain the current leverage when firms have changed life stage. Table 5 indicates how some drivers of the next-year debt target are acting in a completely different way than the same drivers of the current target to explain current debt. This is the case of profitability and size for firms that change from introduction to growth; meanwhile profitability and tangibility are different for the next change. Using the Chow Test (untabulated) we have checked that the coefficients obtained for the change from introduction to growth are significantly different from those obtained for the change from growth to maturity.
Influence of the next target leverage on firm leverage. System GMM.
| Variables | Change: Introduction to Growth | Change: Growth to Maturity |
|---|---|---|
| TDEBTt−1 | 0.683*** | 0.725*** |
| [0.0119] | [0.0174] | |
| PROFt+1 | 0.0468*** | 0.0217 |
| [0.00638] | [0.0154] | |
| GROWTHt+1 | 0.00121 | 0.0161*** |
| [0.000870] | [0.00256] | |
| TANGt+1 | 0.0863*** | 0.0736*** |
| [0.0114] | [0.0154] | |
| SIZEt+1 | −0.00353** | 0.0102*** |
| [0.00169] | [0.00168] | |
| Constant | 0.0295 | −0.0654 |
| [0.0652] | [0.0607] | |
| Industry Eff. | Yes | Yes |
| Country Eff. | Yes | Yes |
| Time Eff. | Yes | Yes |
| Obs. | 395 | 1296 |
| Firms | 345 | 947 |
| F Test | 25,514 | 170.6 |
| Sig. F Test | 0 | 0 |
| Hansen Test | 205.4 | 248.9 |
| Sig. Hansen | 0.958 | 0.400 |
| m2 | −0.966 | 1.537 |
| Sig. m2 | 0.334 | 0.124 |
Notes: Regressions are estimated using the system GMM estimator for panel data with lagged dependent variables. TDEBT is book leverage (total debt/total assets); PROF is profitability (EBITDA/total assets); GROWTH is market to book (market value of equity+debt in current liabilities+long-term debt+preferred stocks−deferred taxes and investment tax credit to total assets); TANG is tangibility (property, plant and equipment/assets); and SIZE is the logarithm of total assets. Heteroskedasticity consistent asymptotic standard error is in brackets.
*The significance at the 10% level.
In contrast with the results using the current target debt, the next-year profitability factor is positively related to debt in all cases, supporting the TOT. Consistent with Ross (1977), considering the new perspectives offered by the changes of stage, higher levels of debt can be used by managers to signal an optimistic future for the firm. In addition, more profitable firms can hold up a higher leverage ratio.
Concerning our third hypothesis, the coefficients indicate a less stable target debt during the growth stage and a more stable target debt during maturity. One year later, growth firms will have a quite different target debt; therefore, the firm contracting its debt with a long-term perspective will exhibit a higher adjustment to the current target. Our results support the findings by Hovakimian and Li (2009), as firms changing from introduction to growth would make adjustments closer to the next-year target than to the current target. Firms changing from growth to maturity will exhibit more stable target debt. Therefore, their speed of adjustment is similar using either the current target or the next-year target (0.296 vs. 0.275). This confirms that the debt target is a strategic decision that addresses the debt policy during several years.
Robustness analysesWe have checked the robustness of our results by replicating estimations with a different measure of leverage, by using an alternative classification of firms into life cycle stages, and by including several additional control variables. Again, we have applied the Chow test to check that the differences between the coefficients obtained for different groups are significant in every additional robustness analysis (untabulated).
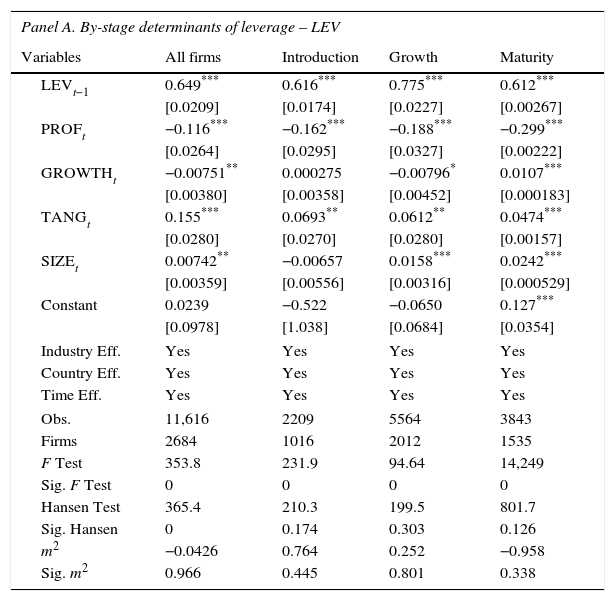
Alternative measure of leverageFollowing Welch (2011), we determine that non-financial liabilities should be considered debt. Hence, our proxy for leverage is the ratio of total liabilities to total assets, in book values. The results are very similar to those obtained with total debt. Differences indicate a slightly lower speed of adjustment along the life cycle stages (Table 6, Panel A), both for firms remaining in the same stage and for firms changing from one stage to another (Panel B). This result suggests that operating liabilities adjust toward the target in a more progressive way. In addition, we can appreciate that profitability is a better driver of leverage during introduction and growth whereas tangibility and size are weaker inductors of debt, mainly during growth and maturity. The lack of significance for the growth coefficient during introduction and the lower significance during growth are consistent with growth opportunities exerting opposite effects on leverage in these stages. Finally, debt exhibits different target determinants when we consider the next year target (Panel C), remarkably in the case of profitability, tangibility, and size. Given that traditional theories pay little attention to operating debt, differences suggest an open research question concerning the use of different sources of funds along the firm life cycle. The stronger effect of tangibility as a determinant of target debt is consistent with the role of tangible assets as collateral in obtaining mainly debt.
Alternative measure of leverage. System GMM procedure.
| Panel A. By-stage determinants of leverage – LEV | ||||
|---|---|---|---|---|
| Variables | All firms | Introduction | Growth | Maturity |
| LEVt−1 | 0.649*** | 0.616*** | 0.775*** | 0.612*** |
| [0.0209] | [0.0174] | [0.0227] | [0.00267] | |
| PROFt | −0.116*** | −0.162*** | −0.188*** | −0.299*** |
| [0.0264] | [0.0295] | [0.0327] | [0.00222] | |
| GROWTHt | −0.00751** | 0.000275 | −0.00796* | 0.0107*** |
| [0.00380] | [0.00358] | [0.00452] | [0.000183] | |
| TANGt | 0.155*** | 0.0693** | 0.0612** | 0.0474*** |
| [0.0280] | [0.0270] | [0.0280] | [0.00157] | |
| SIZEt | 0.00742** | −0.00657 | 0.0158*** | 0.0242*** |
| [0.00359] | [0.00556] | [0.00316] | [0.000529] | |
| Constant | 0.0239 | −0.522 | −0.0650 | 0.127*** |
| [0.0978] | [1.038] | [0.0684] | [0.0354] | |
| Industry Eff. | Yes | Yes | Yes | Yes |
| Country Eff. | Yes | Yes | Yes | Yes |
| Time Eff. | Yes | Yes | Yes | Yes |
| Obs. | 11,616 | 2209 | 5564 | 3843 |
| Firms | 2684 | 1016 | 2012 | 1535 |
| F Test | 353.8 | 231.9 | 94.64 | 14,249 |
| Sig. F Test | 0 | 0 | 0 | 0 |
| Hansen Test | 365.4 | 210.3 | 199.5 | 801.7 |
| Sig. Hansen | 0 | 0.174 | 0.303 | 0.126 |
| m2 | −0.0426 | 0.764 | 0.252 | −0.958 |
| Sig. m2 | 0.966 | 0.445 | 0.801 | 0.338 |
| Panel B. Determinants of leverage according to the stage change | |||||
|---|---|---|---|---|---|
| Variables | Introduction: Unchange | Change: Intro to Growth | Growth: Unchange | Change Growth-Mat | Maturity: Unchange |
| LEVt−1 | 0.554*** | 0.795*** | 0.576*** | 0.705*** | 0.687*** |
| [0.00377] | [0.0159] | [0.00126] | [0.00559] | [0.000927] | |
| PROFt | −0.288*** | −0.317*** | −0.315*** | −0.390*** | −0.280*** |
| [0.00468] | [0.0209] | [0.00168] | [0.00600] | [0.00125] | |
| GROWTHt | 0.00223*** | 0.0207*** | 0.00246*** | 0.00772*** | 0.0190*** |
| [0.000459] | [0.00264] | [8.81e−05] | [0.000547] | [0.000114] | |
| TANGt | 0.327*** | 0.0607*** | 0.00865*** | 0.0953*** | 0.0687*** |
| [0.0107] | [0.0228] | [0.00102] | [0.00970] | [0.00134] | |
| SIZEt | −0.0120*** | 0.00442* | 0.0149*** | 0.0152*** | 0.0129*** |
| [0.00156] | [0.00268] | [0.000307] | [0.00105] | [0.000233] | |
| Constant | 0.582*** | −0.124 | 0.0139 | 0.0226 | 0.125*** |
| [0.164] | [0.445] | [0.0190] | [0.0264] | [0.0152] | |
| Industry Eff. | Yes | Yes | Yes | Yes | Yes |
| Country Eff. | Yes | Yes | Yes | Yes | Yes |
| Time Eff. | Yes | Yes | Yes | Yes | Yes |
| Obs. | 845 | 455 | 2708 | 1369 | 1691 |
| Firms | 441 | 396 | 1233 | 979 | 825 |
| F Test | 2.488e+06 | 2665 | 3.751e+06 | 3852 | 9.580e+07 |
| Sig. F Test | 0 | 0 | 0 | 0 | 0 |
| Hansen Test | 351.4 | 126.1 | 810.2 | 551.1 | 626.1 |
| Sig. Hansen | 0.890 | 0.985 | 0.982 | 0.160 | 1 |
| m2 | 0.156 | −0.448 | 0.626 | −0.520 | −0.900 |
| Sig. m2 | 0.876 | 0.654 | 0.531 | 0.603 | 0.368 |
| Panel C. Influence of the next target on firm leverage | ||
|---|---|---|
| Variables | Change: Introduction to Growth | Change: Growth to Maturity |
| LEVt−1 | 0.659*** | 0.828*** |
| [0.0133] | [0.0165] | |
| PROFt+1 | 0.0793*** | 0.0445* |
| [0.0118] | [0.0268] | |
| GROWTHt+1 | −0.000785 | 0.00592* |
| [0.00126] | [0.00331] | |
| TANGt+1 | −0.0487*** | 0.0768*** |
| [0.0149] | [0.0196] | |
| SIZEt+1 | −0.0158*** | −0.00289 |
| [0.00251] | [0.00182] | |
| Constant | 0.264*** | 0.114 |
| [0.0829] | [0.0763] | |
| Industry Eff. | Yes | Yes |
| Country Eff. | Yes | Yes |
| Time Eff. | Yes | Yes |
| Obs. | 396 | 1309 |
| Firms | 345 | 953 |
| F Test | 210,769 | 132.7 |
| Sig. F Test | 0 | 0 |
| Hansen Test | 216.8 | 263.3 |
| Sig. Hansen | 0.876 | 0.255 |
| m2 | −0.804 | 0.372 |
| Sig. m2 | 0.421 | 0.710 |
Notes: Regressions are estimated using the system GMM estimator for panel data with lagged dependent variables. LEV is book leverage (total liabilities/total assets); PROF is profitability (EBITDA/total assets); GROWTH is market to book (market value of equity+debt in current liabilities+long-term debt+preferred stocks−deferred taxes and investment tax credit to total assets); TANG is tangibility (property, plant and equipment/assets); and SIZE is the logarithm of total assets. Heteroskedasticity consistent asymptotic standard error is in brackets.
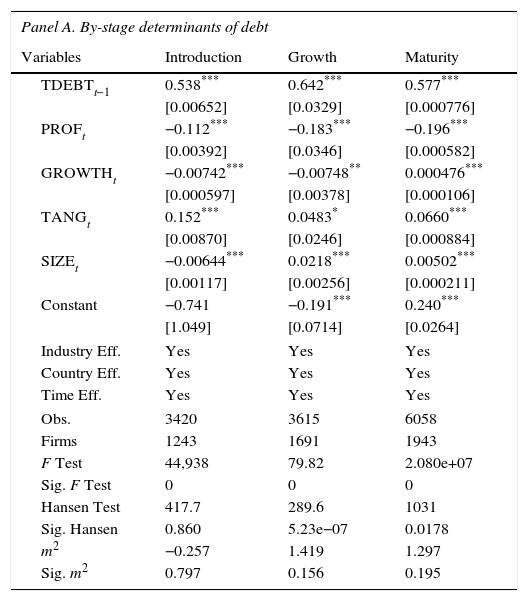
We have checked that our main results do not change when we use the whole Dickinson (2011) model to classify firms into the three life cycle stages. In this case, the signs taken by operating, investing, and financing cash flows are considered (Table 1).
We observe that the speed of adjustment is lower during growth followed by maturity (Table 7, Panel A) and that the lower speed of adjustment is found for firms changing from introduction to growth (Panel B). The same patterns are maintained in the coefficients of the target leverage factors in the three panels, except for growth opportunities in some stages. The opposite effects of growth opportunities supported by both the trade-off and the pecking order reasoning cause variation of signs and significance depending on the life cycle stage, but also on the subsample of firms analyzed.
Alternative measure of life cycle – Dickinson. System GMM.
| Panel A. By-stage determinants of debt | |||
|---|---|---|---|
| Variables | Introduction | Growth | Maturity |
| TDEBTt−1 | 0.538*** | 0.642*** | 0.577*** |
| [0.00652] | [0.0329] | [0.000776] | |
| PROFt | −0.112*** | −0.183*** | −0.196*** |
| [0.00392] | [0.0346] | [0.000582] | |
| GROWTHt | −0.00742*** | −0.00748** | 0.000476*** |
| [0.000597] | [0.00378] | [0.000106] | |
| TANGt | 0.152*** | 0.0483* | 0.0660*** |
| [0.00870] | [0.0246] | [0.000884] | |
| SIZEt | −0.00644*** | 0.0218*** | 0.00502*** |
| [0.00117] | [0.00256] | [0.000211] | |
| Constant | −0.741 | −0.191*** | 0.240*** |
| [1.049] | [0.0714] | [0.0264] | |
| Industry Eff. | Yes | Yes | Yes |
| Country Eff. | Yes | Yes | Yes |
| Time Eff. | Yes | Yes | Yes |
| Obs. | 3420 | 3615 | 6058 |
| Firms | 1243 | 1691 | 1943 |
| F Test | 44,938 | 79.82 | 2.080e+07 |
| Sig. F Test | 0 | 0 | 0 |
| Hansen Test | 417.7 | 289.6 | 1031 |
| Sig. Hansen | 0.860 | 5.23e−07 | 0.0178 |
| m2 | −0.257 | 1.419 | 1.297 |
| Sig. m2 | 0.797 | 0.156 | 0.195 |
| Panel B. Determinants of debt according to the stage change | |||||
|---|---|---|---|---|---|
| Variables | Introduction: Unchange | Change: Intro to Growth | Growth: Unchange | Change Growth-Mat | Maturity: Unchange |
| TDEBTt−1 | 0.511*** | 0.702*** | 0.552*** | 0.579*** | 0.575*** |
| [0.00617] | [0.0226] | [0.00201] | [0.0180] | [0.000281] | |
| PROFt | −0.0313*** | −0.116*** | −0.148*** | −0.295*** | −0.162*** |
| [0.00295] | [0.0160] | [0.00207] | [0.0202] | [0.000265] | |
| GROWTHt | −0.00829*** | 0.00847*** | 0.0134*** | 0.00578*** | −0.000784*** |
| [0.000567] | [0.00242] | [0.000356] | [0.00206] | [3.69e−05] | |
| TANGt | 0.209*** | 0.238*** | 0.181*** | 0.154*** | 0.178*** |
| [0.00533] | [0.0280] | [0.00515] | [0.0243] | [0.000504] | |
| SIZEt | −0.00616*** | 0.0203*** | 0.0156*** | 0.0150*** | 0.00742*** |
| [0.00101] | [0.00369] | [0.000491] | [0.00261] | [0.000145] | |
| Constant | 0.0760 | −0.835** | −0.153 | −0.0774* | −0.00298 |
| [0.0889] | [0.360] | [0.281] | [0.0465] | [0.00683] | |
| Industry Eff. | Yes | Yes | Yes | Yes | Yes |
| Country Eff. | Yes | Yes | Yes | Yes | Yes |
| Time Eff. | Yes | Yes | Yes | Yes | Yes |
| Obs. | 2049 | 456 | 1421 | 1409 | 3496 |
| Firms | 752 | 407 | 785 | 1027 | 1306 |
| F Test | 41,021 | 632.7 | 4.670e+07 | 261.4 | 7.943e+06 |
| Sig. F Test | 0 | 0 | 0 | 0 | 0 |
| Hansen Test | 221.2 | 109.5 | 415.8 | 319.9 | 1005 |
| Sig. Hansen | 1 | 0.995 | 0.780 | 3.57e−10 | 0.902 |
| m2 | −0.192 | −0.916 | 0.478 | 1.996 | −1.111 |
| Sig. m2 | 0.847 | 0.359 | 0.633 | 0.0459 | 0.267 |
| Panel C. Influence of the next target on firm debt | ||
|---|---|---|
| Variables | Change: Introduction to Growth | Change: Growth to Maturity |
| TDEBTt−1 | 0.623*** | 0.391*** |
| [0.0208] | [0.00469] | |
| PROFt+1 | 0.0714*** | 0.0675*** |
| [0.0130] | [0.00293] | |
| GROWTHt+1 | 0.0229*** | 0.000959** |
| [0.00258] | [0.000407] | |
| TANGt+1 | 0.132*** | 0.119*** |
| [0.0236] | [0.00461] | |
| SIZEt+1 | 0.00512 | −0.00489*** |
| [0.00386] | [0.000765] | |
| Constant | 0.573* | 0.186*** |
| [0.345] | [0.0698] | |
| Industry Eff. | Yes | Yes |
| Country Eff. | Yes | Yes |
| Time Eff. | Yes | Yes |
| Obs. | 415 | 1322 |
| Firms | 376 | 978 |
| F Test | 2080 | 351,490 |
| Sig. F Test | 0 | 0 |
| Hansen Test | 139.5 | 556.1 |
| Sig. Hansen | 0.998 | 0.192 |
| m2 | −0.926 | 2.938 |
| Sig. m2 | 0.355 | 0.00331 |
Notes: Regressions are estimated using the system GMM estimator for panel data with lagged dependent variables. TDEBT is book leverage (total debt/total assets); PROF is profitability (EBITDA/total assets); GROWTH is market to book (market value of equity+debt in current liabilities+long-term debt+preferred stocks−deferred taxes and investment tax credit to total assets); TANG is tangibility (property, plant and equipment/assets); and SIZE is the logarithm of total assets. Heteroskedasticity consistent asymptotic standard error is in brackets.
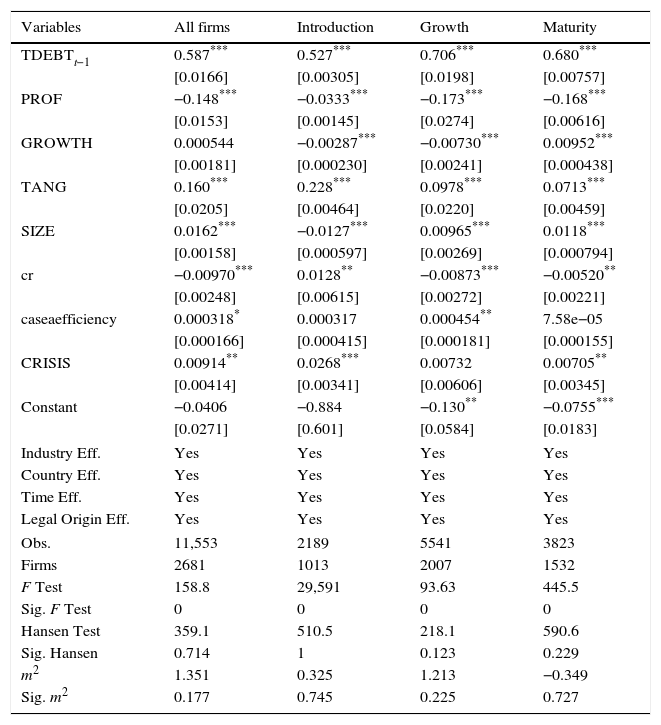
We have controlled by the effect of some legal and institutional factors as well as by the effect of the crisis. We have added the following control variables: creditor rights, legal origin (English, French, German, and Scandinavian), efficiency of debt enforcement, and crisis. The creditor rights are measured using the index developed by LaPorta et al. (2008). The legal origin dummies are constructed following LaPorta et al. (2008). Efficiency of debt enforcement is defined as the present value of the terminal value of the firm after bankruptcy costs (Djankov et al., 2008). The crisis factor is a dummy variable built following Laeven and Valencia (2013). Our results show that all the patterns for speed of adjustment remain unchanged and almost all signs and patterns for leverage drivers maintain (Table 8). Again, growth opportunities appear as the less stable factor. For the effect of creditor rights, legal origin, and efficiency of debt enforcement we do not obtain conclusive results as coefficients show changes of significance and sign. As for the creditor rights factor, previous literature is not conclusive either, showing positive (González and González, 2008) and negative effects (Cho et al., 2014) on leverage. The positive sign during introduction would be consistent with the supply-side forces whereas the negative sign during growth and maturity would be consistent with the demand-side forces.12 The crisis factor shows a more consistent effect, showing a positive influence on leverage across the life cycle stages, though significance is weaker (or null) in some cases.
Results after controlling by institutional factors.
| Variables | All firms | Introduction | Growth | Maturity |
|---|---|---|---|---|
| TDEBTt−1 | 0.587*** | 0.527*** | 0.706*** | 0.680*** |
| [0.0166] | [0.00305] | [0.0198] | [0.00757] | |
| PROF | −0.148*** | −0.0333*** | −0.173*** | −0.168*** |
| [0.0153] | [0.00145] | [0.0274] | [0.00616] | |
| GROWTH | 0.000544 | −0.00287*** | −0.00730*** | 0.00952*** |
| [0.00181] | [0.000230] | [0.00241] | [0.000438] | |
| TANG | 0.160*** | 0.228*** | 0.0978*** | 0.0713*** |
| [0.0205] | [0.00464] | [0.0220] | [0.00459] | |
| SIZE | 0.0162*** | −0.0127*** | 0.00965*** | 0.0118*** |
| [0.00158] | [0.000597] | [0.00269] | [0.000794] | |
| cr | −0.00970*** | 0.0128** | −0.00873*** | −0.00520** |
| [0.00248] | [0.00615] | [0.00272] | [0.00221] | |
| caseaefficiency | 0.000318* | 0.000317 | 0.000454** | 7.58e−05 |
| [0.000166] | [0.000415] | [0.000181] | [0.000155] | |
| CRISIS | 0.00914** | 0.0268*** | 0.00732 | 0.00705** |
| [0.00414] | [0.00341] | [0.00606] | [0.00345] | |
| Constant | −0.0406 | −0.884 | −0.130** | −0.0755*** |
| [0.0271] | [0.601] | [0.0584] | [0.0183] | |
| Industry Eff. | Yes | Yes | Yes | Yes |
| Country Eff. | Yes | Yes | Yes | Yes |
| Time Eff. | Yes | Yes | Yes | Yes |
| Legal Origin Eff. | Yes | Yes | Yes | Yes |
| Obs. | 11,553 | 2189 | 5541 | 3823 |
| Firms | 2681 | 1013 | 2007 | 1532 |
| F Test | 158.8 | 29,591 | 93.63 | 445.5 |
| Sig. F Test | 0 | 0 | 0 | 0 |
| Hansen Test | 359.1 | 510.5 | 218.1 | 590.6 |
| Sig. Hansen | 0.714 | 1 | 0.123 | 0.229 |
| m2 | 1.351 | 0.325 | 1.213 | −0.349 |
| Sig. m2 | 0.177 | 0.745 | 0.225 | 0.727 |
Standard errors in brackets.
We conclude that the target leverage and the speed of adjustment to the optimal capital structure vary across the life cycle stages of the firms in a study using a panel database of non-financial listed firms in fourteen European countries during the period 1990–2012.
To distinguish life cycle stages, we start from Dickinson's (2011) innovative methodology, based on the signs of operating, investing and financing cash flows, but we substitute the financing cash-flow part by an alternative criterion based on a combination of growth and risk factors to separate the firms in introduction and growth from the mature firms.
Taking total debt to assets as a proxy for leverage, we have analyzed the determinants of target leverage by stage. We conclude that profitability and tangibility are the most stable drivers from introduction to maturity, whereas growth opportunities and size are changing but relevant determinants. Profitability has a negative relation along the life of a firm, less influential during introduction. The negative sign supports the POT during the three stages, and the remarkable increase from introduction to growth indicates its role as a source of retained earnings supported by the POT too. However, the factor is not a stronger explanatory factor during maturity, what suggests an offsetting effect of the reasons posed by the TOT for the profitability factor in mature firms.
Tangible assets have a positive contribution, in line with its effect as collateral posed by the POT, being this factor remarkably relevant during introduction, whereas the size factor is positive during growth and maturity, which is supported by both the TOT and the POT reasoning. Therefore, tangibility and size obtain positive signs but only size evolves across the stages according to both theories, TOT and POT, increasing its relevance as the firms grow and mature. On the contrary, tangibility turns into a weaker explanatory factor as other factors (such as size or growth opportunities) gain relevance in subsequent stages.
The growth opportunities variable exhibits small coefficients and a change of sign from growth to maturity, suggesting opposite effects derived from this factor: bigger funding needs and debt capacity in contrast with generation of more cash flows. The negative coefficient during introduction and growth is in line with higher information asymmetry hampering new external funding (POT), whereas the positive relation during maturity suggests that the retained earnings produced by profitable firms are insufficient to cover the additional funding needs. In sum, concerning the prevalence of the theories along the three stages considered of the life cycle of the firm, the results on the determinants of target leverage partially support both the TOT and the POT.
As for the speed of adjustment, our results indicate a high-low-high pattern across the life cycle stages. During introduction and maturity, the speed of adjustment is higher, meaning considerably lower transaction costs. During growth, quoted firms usually enter into other businesses or increase their investments to reach a higher growth, thus increasing the asymmetric information and hindering the access to capital markets. We do not find support in general for the TOT (nor the residual effect of the POT) as regards the evolution of the speed of adjustment across the stages, as the higher speed during the introduction stage than during the growth stage maintains across the different robustness analyses performed.
A lower speed of adjustment is observed in firms that change life stage with respect to those remaining in the same stage, consistent with higher asymmetric information and transaction costs associated with strategy changes. We conclude that new strategies cause frictions on the market affecting costs and capital structure. In addition, our results indicate a lower increase of costs for firms changing from growth to maturity than for firms changing from introduction to growth. This result is consistent with a mixed group of firms concerning adjustments of debt: those reducing debt and those increasing it, considering the asymmetric costs of both types of adjustment (Hovakimian and Li, 2009). Therefore, we find strong support to the POT in respect to the reduction of the speed of adjustment during the changes of stages and in respect to the more intense effect when the firms evolve from introduction to growth, being the result robust to the alternative specification of debt, the alternative definition of life cycle stages, and the introduction of several control variables.
Finally, our results confirm that firms changing from one life stage to another use long-term targets. Furthermore, during the change from introduction to growth, the adjustment to the next-year target is faster than to the current target. In this case, factors proxying for debt target suffer relevant changes from year to year, and debt changes are likely to adjust to needs expected two or three years ahead. By contrast, firms changing from growth to maturity would expect more stable financial needs, and firms are able to perform financing changes in shorter periods. Therefore, next-year targets do not improve the adjustment speed.
Our contribution to the line of research on optimal capital structure is twofold. First, we demonstrate that for European listed firms the capital structure determinants as well as the speed of adjustment to target levels depend on the stage of the firm, as the capital structure theories play different roles along the life cycle stages of firms. Furthermore, we provide evidence for differences in firms changing from one stage to another, both in targets and speed of adjustment. Second, we contribute to the target leverage literature by adding a new explanatory factor: the next-year target debt. Our results confirm that the next-year target is also a relevant factor to explain the current debt and the adjustment behavior of the firms differs between different stages.
Our contributions are relevant for researchers and practitioners as the results indicate that the proportions of firms classifiable into the different life cycle stages determine the interpretation of the results obtained concerning the factors driving both capital structure targets and speed of adjustment. Therefore, researchers should pay much more attention to the sample selection because analyzing a group with firms in different stages of life is likely to result in non-significant or unstable coefficients for those factors whose behavior changes along the life cycle, whereas the selection of by-stage samples avoids the offsetting effect of those factors, contributing to identify the origin of some mixed effects found in the capital structure literature. On the other hand, practitioners should be aware of the life cycle stage a firm is framed in and the differential conditions that favor or limit the capital structure decisions.
The confirmation of the Dickinson's model as a good proxy for assigning firms into the proper life cycle stage is also relevant for both researchers and practitioners. As in the case of capital structure, a good number of business decisions should be taken consciously of the changing (internal and external) conditions across the stages. For example, financial managers could check the assignment of their firms into the life stage by this model in order to compare their firms’ capital structure against that part of the industry (or against some specific firms) in the same stage. Taking into consideration our second contribution, that confirms the long-term planification of relevant capital structure changes, financial managers could contrast their firm's current capital structure with those of firms in the next stage they plan to evolve to in the next future. Thus, managers could anticipate some limitations and/or advantages to be arisen when adjusting the capital structure to face the challenges meaning investment/disinvestment in the new stage.
The authors wish to thank Xosé Vázquez (editor), two anonymous referees, Víctor González, and Manuel Cano for their helpful comments. We are also grateful for the suggestions provided on earlier versions of this article by the participants at the 2014 IFABS International Conference, the 2014 ACEDE Congress, and the XXII Finance Forum.
Financial support from the Spanish Ministry of Science and Innovation (ECO2011-29144-C03-01) and support from the University of Leon (ULE2012-1) are gratefully acknowledged. Paula Castro also acknowledges the Grant FPU (AP2012-1959) from the Spanish Ministry of Education, Culture and Sports.

González and González (2012) pose their hypothesis in terms of firm size instead of distinguishing between life cycle stages. Therefore, for these authors the validity of the predictions of the POT is negatively related to firm size.
Note that H.1b, posed according to the POT, predicts an opposite behavior for profitability as a driver of the target leverage than H.1a, posed according to the TOT.
Changes in the financial structure alter the external perception of the firm's risk. The higher bankruptcy costs derived from the leverage increase implies that the managers are discouraged to give false signals on the future expected returns (Ross, 1977).
We have to consider that shake-out is a difficult stage to delimitate, and companies move into decline directly from a lower stage.
Although operating cash flows allow us to distinguish between firms in the introduction and firms in the growth stage, without considering the financial cash flows all the firms could be classified also into the shake-out stage. By applying the additional criterion (that replaces the financial cash flows) to the whole sample, we discard a number of firms that considering only operating and investing cash flows had been classified into the introduction or the growth stages, but in coherence with the discriminant power of the risk and the growth factors explained by the life cycle theory, they should be considered into the shake-out stage, not analyzed in the current study.
Vid. Fama and French (1997) and the web page of Kenneth French at http://mba.tuck.dartmouth.edu/pages/faculty/ken.french/Data_Library/det_49_ind_port.html.
We have selected book leverage for several reasons. The first one concerns the relevant role of profitability in our study. Considering the effect of profitability on the market value of assets, there are some predicted relations for accounting leverage that are not so clear when using market leverage, such as the effect of profitability for the trade-off theory (Fama and French, 2002). Second, it has been found that book leverage is a more stable measure over the decades than market leverage (Frank and Goyal, 2008). Finally, stock returns adjust when the financing mix changes, thus biasing the market debt ratio (Chang and Dasgupta, 2009).
There are two reasons to select quoted firms for our study: (1) the Dickinson model is generally applicable only to firms issuing the Cash Flow Statement, and this is not mandatory for a main part of non-quoted firms; and (2) the definition of the life cycle stages may vary considerably for quoted vs. non-quoted firms, specially concerning introduction and growth.
Firms that would be classified into the shake-out or the decline are discarded; for example, those firms with both operating and investing cash flows positive, and those ones with negative operating cash flows and positive investing cash flows.
The three references mentioned use book leverage on US samples over long periods (1965–2001, 1971–2004 and 1977–2006, respectively). We can mention some other references on European samples, though using market leverages, except for Öztekin and Flannery that use both market and accounting debt ratios. Thus, the coefficients obtained are 0.20–0.62 by González and González (2008) for the countries included in our sample; 0.69–0.94 by Öztekin and Flannery, for the countries included in our sample; 0.69 by Rubio and Sogorb (2011); 0.59–0.64 by González and González (2012); and 0.31–0.72 by Rubio and Sogorb (2012). González and González (2008) and Öztekin and Flannery (2012) analyze similar periods (1995–2004 and 1991–2006, respectively). Both samples are international, including the European firms taken in our sample (except The Netherlands in the second work). Rubio and Sogorb (2011, 2012) and González and González (2012) analyze Spanish firms during similar periods (1995–2003, 1995–2007 and 1995–2003, respectively).
We can confirm the lack of second-order serial correlation in the two first-difference residuals for firms remaining in maturity only from 5% instead of 10% as in the rest of the regressions.
The supply-side reasoning concerns the improvement of the disposition of creditors to extend credit and take risk in the presence of better creditor protection. As regards the demand-side forces, creditor protection increases the reluctance of corporations to use debt caused by the managers’ and shareholders’ concerns about retaining control in case of financial distress (Cho et al., 2014).