


Evidence about the relation between earnings management and voluntary audits is scarce, and there is no research about the effectiveness of mandatory audits to improve earnings quality. Using a sample of Spanish SMEs, where some companies are mandatorily audited and some are exempt from audit, we examine if audits, either mandatory or voluntary, help to improve accounting quality by constraining earnings management. We also examine differences between voluntary and mandatory audits, as well as the role of Big 4 and Middle-Tier auditors. After controlling for other characteristics that affect earnings management, we find that audited companies have lower absolute discretionary accruals, but do not find significant differences among auditors. Voluntary audits also restrain earnings management, but in a lesser extent than mandatory audits. When we use signed accruals, audits are only effective against income-increasing behaviours, what is explained by the auditor conservatism. Additional analyses support the results obtained.
Literature about earnings management and accounting quality is extensive (García Osma et al., 2005; Dechow et al., 2010). A stream of research that has been deeply studied is the relationship between auditing and earnings management, because it is expected that audits work as a constraint to managerial discretion in reporting earnings and help to improve the reliability and the quality of the financial information. The papers that have studied this relationship have focused on the differential value among auditors to deter earnings management activities, depending on specific dimensions of auditors. However, there is a lack of empirical research in two issues: (i) whether audits, regardless of the characteristics of the auditor, actually constrain earnings management and improve earnings quality; and (ii) whether there are differences between voluntary and mandatory audits.
First, papers commonly examine the differences between auditors with different characteristics (Becker et al., 1998; Balsam et al., 2003; Chung et al., 2005; Carey and Simnett, 2006; Cano, 2007; Basioudis et al., 2008). However, they do not study if audits, regardless the auditors’ characteristics, have a differential value compared to the non-audit case. The fact that most of the literature examines settings where audits are mandatory, such as large private or listed companies, involves that these papers cannot value the differences between unaudited and audited companies. Secondly, the few papers that study audits per se generally show that audited companies have a lower cost of debt than the unaudited ones (Kim et al., 2011; Minnis, 2011), so audited financial statements are perceived to be more reliable and thus seem to provide higher quality information. However, with the exceptions of Minnis (2011), Ojala et al. (2011) and Dedman and Kausar (2012), there is a lack of empirical evidence examining whether the audited companies actually provide higher quality information.
Minnis (2011) and Dedman and Kausar (2012) examine the effects of voluntary audits on accounting quality, but there is no research about the effects of mandatory audits. This is important because accounting quality can be affected in a different way depending on whether audits are voluntary or mandatory. On the one hand, voluntarily audited companies may be willing to send a signal about the quality of the accounting information, and Minnis (2011) and Dedman and Kausar (2012) show that audits improve accounting quality. However, we can expect a “label” effect for the voluntary audit, i.e. companies only choose to be audited to increase their perceived accounting quality (Daske et al., 2013; Koren et al., 2014). On the other hand, mandatory audits are assumed to ensure a minimum quality of the financial information (Ruiz and Gómez, 2008), thus companies that shun the audit requirement would have lower accounting quality. If these differences are not observed, mandatory audits would fail to achieve their basic aim.
SMEs are a natural setting to test the effect of audits on accounting quality. First at all, it is worth noting their relevance in the economy in both the EU and the US (Allee and Yohn, 2009; Wymenga et al., 2012). In Spain, this importance is even higher (EC, 2012). Secondly, the SMEs setting allows us compare audited and unaudited firms, a comparison that is not possible among public and big private companies because all of them are mandatorily audited. Moreover, although there are papers that analyze the relation between audit quality and earnings management in the private setting (Cano, 2007; Van Tendeloo and Vanstraelen, 2008), the value of audits for the smaller of them, however, is not as obvious, because their stakeholders may rely more in alternative information sources (Berger and Udell, 2006; Gill de Albornoz and Illueca, 2007), so the role of auditors may be partially different.
The Spanish case may shed light to this limited value, because of the lower tradition in the use of accounting information compared to common-law countries with a longer history of auditing, such as the UK and the USA. Moreover, similar to most EU countries, Spain requires audits for companies that exceed a certain size. The Spanish Statutory Audit Thresholds (SAT) are lower than those generally applied in the EU, so we can test if audits have a different effect depending on their character (voluntary or mandatory) in a relatively homogeneous sample, i.e. in a sample that only includes small and medium companies.
Furthermore, because of the more limited usefulness of financial information for SMEs, mandatory audits are often considered a potential source of administrative burdens, so the EC is considering the possibility of revising the requirement for mandatory audits for these companies (EC, 2010). Finally, the audit market for SMEs also gives us the opportunity to test the role of Middle-Tier auditors (Boone et al., 2010; Sundgren and Svanström, 2013).
Therefore, using a sample of Spanish SMEs, we examine if audits are a deterrent to earnings management, measured through the signed and absolute values of discretionary accruals, and test whether this effect is driven by a real commitment with accounting quality among voluntarily audited companies, or with a minimum accounting quality ensured by mandatory audits. We also test differences between voluntary and mandatory audits. Moreover, we examine if audit quality, proxied by a three-level classification (Big 4, Middle-Tier and small auditors), means differences on the level of earnings management. Since papers about audit choice have serious endogeneity problems, we use a fixed-effects approach instead of OLS estimations to partially mitigate them (Kim et al., 2011; Lennox et al., 2012)
We find that audited companies have a lower level of absolute discretionary accruals than the non-audited ones; voluntary audits also restrain earnings management, but in a lesser extent than mandatory audits. These results suggest that although both mandatory and voluntary audits improve earnings quality by restricting the magnitude of accruals, the lower visibility and litigation risks faced by auditors in the voluntary setting encourage them to be less restrictive. When we examine separately the signed discretionary accruals, we do not find a significant effect of audits on negative accruals, what may be due to the auditor conservatism, for which auditors are not effective against earnings management behaviours when companies have incentives to manage downward. On the other hand, we do not find that significant differences for companies audited by Big 4 and Middle-Tier auditors. Additional analyses support the results obtained.
The paper contributes to the literature about auditing and the quality of financial information in the following ways: first at all, it extends literature about the audit/non- audit discussion. Although previous papers have studied if auditors, playing an information role, help to improve the credibility of the financial statements, there is a lack of empirical evidence examining whether the audited financial information is actually of higher quality. As far as we know, only Minnis (2011), Ojala et al. (2011) and Dedman and Kausar (2012) have examined the effect of voluntary audits on accounting quality. We complement these studies by examining this association in a code-law country, and by considering also both the effect of mandatory audits and the differences between voluntary and mandatory audits. As far as we know, this is the first study to test whether voluntary audits have a different effect on earnings quality than mandatory audits.
On the other hand, it contributes to the study about the relationship between audit quality and earnings management in private companies (Vander Bauwhede et al., 2003; Cano, 2007; Van Tendeloo and Vanstraelen, 2008). As previous papers show that the relationship between audit quality and earnings management is affected by the level of litigation risk, we examine if this relation is also affected among SMEs. Moreover, we extend the study of audit quality, proxied by the auditor size, by considering a Middle-Tier level of auditors (Boone et al., 2010; Swanquist et al., 2012). Finally, the paper is also relevant for business in ethics, since earnings management is an ethical dilemma for accountants (He and Ho, 2011; He and Yang, 2014), and the ethical perceptions of it may vary between managers and auditors, because of their different motivations (Kaplan, 2001a,b).
The rest of the paper is organized as follows: in Section “Literature review and hypothesis development” we review previous literature and develop our research hypotheses; Section “Empirical study” describes the sample and the research design; Section “Empirical results” reports the results of the main analysis; Section “Additional analyses” reports the results of the additional tests; and Section “Conclusions” presents our conclusions and the limitations of the study.
Literature review and hypothesis developmentAudit vs. non-audit and accounting qualityAuditing, as an activity consisting in the revision of the financial information, performs a relevant role in guaranteeing the credibility and reliability of the financial information. This assurance is provided by three sub-roles of the audit function (Cano and Sánchez, 2012): (i) the information role, which improves the credibility of accounting information and helps to reduce financing costs (Kim et al., 2011); (ii) the monitoring role, which helps to improve the quality of the accounting information, by reducing the opportunistic behaviour of managers (Dedman and Kausar, 2012); and (iii) the insurance role, which guarantees that users can rely on the audited financial information because of the responsibility auditors assume in case of audit failures (Melumad and Thoman, 1990; Khurana and Raman, 2004; Mansi et al., 2004).
Empirical evidence about the information role of audits (Blackwell et al., 1998; Kim et al., 2011; Minnis, 2011; Niemi et al., 2012; Huguet and Gandía, 2014) supports the idea that auditing helps to improve the credibility of the financial statements, i.e. audited information is perceived to be of higher quality that the unaudited one. However, empirical evidence about the monitoring role is scarce. As stated by Dechow et al. (2010), although the basic premise that auditors could mitigate misstatements is straightforward, compelling empirical evidence is limited. Only a few studies (Minnis, 2011; Ojala et al., 2011; Dedman and Kausar, 2012) examine the effect of voluntary audits on accounting quality, while there is no evidence on the role of mandatory audits.
Minnis (2011) examines the role of the auditor in the setting of US private companies, where audits are voluntary, and finds that auditing helps to reduce the cost of debt, because lenders place more weight on audited financial information when setting the interest rate. Furthermore, he finds that this increased credibility of the audited information is due to the increase of the actual accounting quality, because accruals from audited financial statements are better predictors of future cash flows and thus are more informative.
On the other hand, Dedman and Kausar (2012) examine the effects that the change from mandatory to voluntary audits had on the credit ratings for UK private companies and find that those firms that decided to be voluntarily audited, even though reported lower average profits, obtained upgrades to their ratings, i.e. their audited information was perceived as being of higher quality. Moreover, they also find that voluntarily audited companies report more conservative financial statements.
Taking into account what has been previously stated, and in line with the monitoring role, we expect that auditors oversee the relationship between the company and its stakeholders, by checking the accounting and ensuring that financial statements have been properly prepared, thus as audits would be a constraint to earnings management, audited SMEs should have lower discretionary accruals than the non-audited ones:H1a Audited SMEs report a significantly lower level of earnings management than non-audited SMEs.
Nevertheless, we have to note that voluntary audits may not necessarily involve higher accounting quality, because some firms may choose to be voluntarily audited to increase the perceived quality of their financial statements, without a true commitment on accounting quality. Daske et al. (2013) find that some “label” companies adopt voluntarily IAS/IFRS but do not make material changes to their financial reporting, i.e. they are willing to feign that they report according to IAS/IFRS, when they actually do not. In this line, Koren et al. (2014) examine a sample of Slovenian small firms and find that, among voluntarily audited companies, only those audited by Big 4 auditors report financial information of higher quality. Their results suggest that the rest of voluntarily audited companies choose to be audited only to pretend higher perceived quality. Therefore, it is not clear whether voluntary audits actually constrain earnings management:H1b Voluntarily audited SMEs report a significantly lower level of earnings management than non-audited SMEs.
On the other hand, mandatory audits are expected to guarantee a minimum accounting quality (Ruiz and Gómez, 2008). Moreover, as stated by Dedman and Kausar (2012), there is a concern among audit firms that a potential consequence of audit exemption may be a reduction in the quality of the financial reporting. Therefore, companies that shun the audit requirement would report accounting information of lower quality. However, an alternate view is that some mandatorily audited companies may be only passive compliant with the audit requirement, and thus may choose more permissive auditors. Moreover, among the SMEs, it has been argued that the financial information has a more limited usefulness, compared to the larger companies, because lenders rely more in alternative information sources (Berger and Udell, 2006), so mandatory audits would be a legal requirement, rather than a social need (Navarro and Martínez, 2004), what supports the idea of passive compliant companies. Therefore, we also formulate H1 for mandatory audits:H1c Mandatorily audited SMEs report a significantly lower level of earnings management than SMEs non-compliant with the audit requirement.
There is scarce research about whether the differences between voluntary and mandatory audits involve differences in the audit outcomes (Lennox and Pittman, 2011; Kim et al., 2011; Huguet and Gandía, 2014, 2015). Lennox and Pittman (2011) examine a sample of UK small companies and find that voluntary audits have a signalling effect that disappears when companies are mandatorily audited, and companies that choose to be voluntarily audited benefit from upgrades in their credit ratings. These results are similar to those obtained by Kim et al. (2011), who find that Korean companies with voluntary audits have greater interest savings than those mandatorily audited.
In the Spanish setting, Huguet and Gandía (2014) do not find a significant relationship between voluntary audits and the cost of debt, but find that companies that breach the audit requirement have a higher cost of debt that those mandatorily audited, what suggests an asymmetric effect of voluntary/mandatory audits on the cost of debt. In a more recent paper, Huguet and Gandía (2015) examine differences in audit pricing between voluntary and mandatory audits.
Therefore, previous literature generally shows that voluntary and mandatory audits involve differences in their audit outcomes. To date, however, there is no research about whether accounting quality is affected by the audit status. Nevertheless, and considering prior literature, we can expect that differences in earnings quality may arise. Following the reasoning for H1b and H1c, we can expect that voluntarily audited companies have a higher commitment with accounting quality, while some of the mandatorily audited companies may be only passive compliant. It may involve that, although mandatory audits may have a positive effect on earnings quality, the effect of voluntary audits may be even stronger. On a competing view, we can expect that voluntarily audited companies may report higher levels of earnings management than mandatorily audited companies, because auditors face lower visibility and litigation risks in the voluntary setting, and thus may be more permissive than when performing mandatory audits. Therefore, we formulate our second Hypothesis in null form:H2 There are no differences in the level of earnings management between voluntarily audited SMEs and the mandatorily audited ones.
Most of previous literature examines the effect of specific characteristics of audits, proxies for audit quality, on accounting quality and earnings management, because it is considered that high quality audits are a constraint to earnings management and an element that improves accounting quality (Becker et al., 1998; Balsam et al., 2003; Cano, 2007). Several characteristics of auditors have been used as a measure of audit quality, such as auditor specialization (Balsam et al., 2003), audit and non-audit fees (Basioudis et al., 2008; Carmona and Momparler, 2011), or auditor tenure (Chung et al., 2005; Carey and Simnett, 2006), but auditor size, through the dichotomy Big 4/Rest of auditors, is the most common proxy for audit quality, because large auditors are considered more professionally competent (Becker et al., 1998; Francis et al., 1999) and independent (DeAngelo, 1981). Moreover, it is assumed that large auditors face greater losses than the rest of auditors, not only economic losses derived from the insurance role and the perception that large auditors are “deep pockets” (Khurana and Raman, 2004; Mansi et al., 2004), but also reputational (DeAngelo, 1981).
In general, these studies find that Big 4 auditors are associated with higher accounting quality, because Big 4 auditors restrain earnings management more than small auditors (Becker et al., 1998; Francis et al., 1999; Balsam et al., 2003; Cano, 2007; Jara and López, 2007) and are related with a higher level of conditional conservatism (Chung et al., 2003; Francis and Wang, 2008; Cano, 2010). In the Spanish setting, although Navarro and Martínez (2004) do not find a significant effect, later papers on both public and private companies (Jara and López, 2007; Cano, 2007) find that Big 4 auditors are associated to lower levels of earnings management.
Although most of previous literature shows a negative association between auditor size and earnings management, later papers go into the relationship between audit quality and earnings management, by looking for factors that affect this relation, reducing the effectiveness of Big 4 auditors to constrain earnings management, such as the auditor conservatism (Kim et al., 2003; Cano, 2010) and the visibility and litigation risk of auditors (Vander Bauwhede et al., 2003; Van Tendeloo and Vanstraelen, 2008).
Regarding the auditor conservatism, the auditors’ behaviour is generally conservative, in the sense that they have preference for income-decreasing accounting choices instead of income-increasing ones. This behaviour involves two negative effects for accounting quality: (i) it increases not only the level of conditional conservatism, (i.e. asymmetrical recognitions of good and bad news, which is considered desirable), but also the level of unconditional conservatism (early recognition of losses, independently of the news), which can reduce the quality of accounting information (Cano, 2010); and (ii) when managers have incentives to manage downward, Big 4 auditors are not effective to deter earnings management (Kim et al., 2003; Francis and Krishnan, 1999).
With regard to the visibility and litigation risk, we stated before that Big 4 auditors have incentives to perform higher quality audits because of the potential losses they face, both economic (derived from the litigation risk) and reputational (derived from their visibility). In settings with lower litigation risk and visibility, these incentives may be reduced or even disappear, thus Big 4 auditors would not be more effective than the rest of auditors in constraining earnings management (Vander Bauwhede et al., 2003; Van Tendeloo and Vanstraelen, 2008).
On the other hand, previous studies do not test the role of Middle-Tier auditors, in spite of being considered to provide a similar quality than Big 4 auditors (Boone et al., 2010; Sundgren and Svanström, 2013). We examine if Big 4 and Middle-Tier auditors provide similar audit quality. Therefore, we formulate our third Hypothesis for both large auditors (Big 4 and Middle-Tier) and separately for Big 4 auditors:H3a The level of earnings management is significantly lower for SMEs audited by large auditors than for SMEs audited by small auditors. The level of earnings management is significantly lower for SMEs audited by Big 4 auditors than for SMEs audited by non-Big 4 auditors.
For the selection of the sample we have used SABI, a database that contains financial data from financial statements of Spanish companies submitted to Registro Mercantil (Spanish Company Register). Our sample period covers since 2008–2013. We initially select private companies which have been, for the whole sample period, below at least two out of the three following thresholds: €6,000,000 Total Assets, €12,000,000 Turnover and 50 employees. These limits are the upper thresholds established by the Directive, 2013/34/EU to consider a company is small and thus to be exempt from the audit requirement.
In practice, however, most of EU members apply lower Statutory Audit Thresholds (SAT). In Spain, private companies are exempt to be audited if they do not exceed two out of these criteria for two consecutive years: total assets of €2,850,000 (€2,374,000 until 2007); net turnover of €5,700,000 (€4,748,000 until 2007); and (iii) 50 employees. The use of the upper EU limits let us examine the effects of both voluntary and mandatory audits on earnings management, but avoiding an excessive variation in company size within the sample. Therefore, our sample includes small companies below Spanish SAT (and thus “a priori1” exempt from the audit requirement) and the “small” medium companies above Spanish SAT (i.e. required to be audited). Since the selection process excludes the companies that have been above the EU thresholds in some years of the sample period and this could be producing a survivorship bias, we do an additional test by including the companies below the EU thresholds in any of the years of the period (rather than in the whole period).
Furthermore, in order to achieve a sample with more homogeneous characteristics, we only include companies that have been audited at least once over the sample period, because companies that have never been audited are probably much smaller than those near SAT, and the accounting information of audited companies and never-audited companies may be not comparable. In an additional test, in order to test if this exclusion affects our results, we include the observations of the never-audited companies.
For the same reason, we also exclude the observations of companies that are considered micro-firms under Directive, 2013/34/EU (companies that do not meet two of the following thresholds: (i) €350,000 in total assets; (ii) €700,000 in net turnover; and (iii) less than 10 employees). Companies belonging to financial and insurance industries, firms having unlimited liability2 and firms with share participation by public entities are also excluded. Finally, we eliminate observations that have no information to calculate accruals and also observations with strange values (negative values for assets, debt or financing expenses).
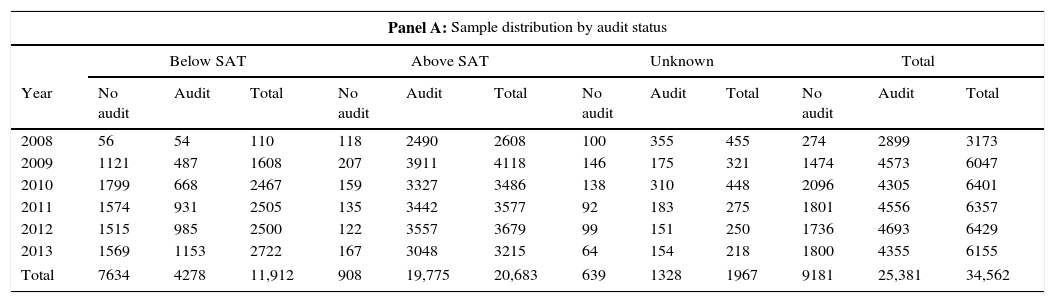
Table 1 Panel A shows that the final sample has 34,562 firm-year observations from 8066 companies, with 9181 observations from non-audited companies (7634 of them are from observations below SAT and 908 are observations from companies that breach the audit requirement), and 25,381 observations from audited companies (4278 below SAT and 20,683 above SAT and thus mandatorily audited because of size). As companies must meet the thresholds for two consecutive years, 1967 observations (1328 from audited companies and 639 from unaudited companies) are not classified in either range because they do not satisfy the criteria to be considered either below or above SAT and thus are excluded from our analysis. We have to remark that the relatively low number of observations below SAT is explained by the exclusion of the never-audited companies. As we have stated before, we do an additional analysis including the never-audited companies to test how results are affected.
Sample distribution.
| Panel A: Sample distribution by audit status | ||||||||||||
|---|---|---|---|---|---|---|---|---|---|---|---|---|
| Below SAT | Above SAT | Unknown | Total | |||||||||
| Year | No audit | Audit | Total | No audit | Audit | Total | No audit | Audit | Total | No audit | Audit | Total |
| 2008 | 56 | 54 | 110 | 118 | 2490 | 2608 | 100 | 355 | 455 | 274 | 2899 | 3173 |
| 2009 | 1121 | 487 | 1608 | 207 | 3911 | 4118 | 146 | 175 | 321 | 1474 | 4573 | 6047 |
| 2010 | 1799 | 668 | 2467 | 159 | 3327 | 3486 | 138 | 310 | 448 | 2096 | 4305 | 6401 |
| 2011 | 1574 | 931 | 2505 | 135 | 3442 | 3577 | 92 | 183 | 275 | 1801 | 4556 | 6357 |
| 2012 | 1515 | 985 | 2500 | 122 | 3557 | 3679 | 99 | 151 | 250 | 1736 | 4693 | 6429 |
| 2013 | 1569 | 1153 | 2722 | 167 | 3048 | 3215 | 64 | 154 | 218 | 1800 | 4355 | 6155 |
| Total | 7634 | 4278 | 11,912 | 908 | 19,775 | 20,683 | 639 | 1328 | 1967 | 9181 | 25,381 | 34,562 |
| Panel B: Sample distribution of audited companies by auditor choice | ||||||||||||
|---|---|---|---|---|---|---|---|---|---|---|---|---|
| Below SAT | Above SAT | Unknown | Total | |||||||||
| Year | Small | M-Tier | Big | Small | M-Tier | Big | Small | M-Tier | Big | Small | M-Tier | Big |
| 2008 | 32 | 14 | 8 | 2083 | 240 | 167 | 306 | 31 | 18 | 2421 | 285 | 193 |
| 2009 | 367 | 68 | 52 | 3238 | 406 | 267 | 135 | 18 | 22 | 3740 | 492 | 341 |
| 2010 | 496 | 91 | 81 | 2684 | 362 | 281 | 249 | 38 | 23 | 3429 | 491 | 385 |
| 2011 | 715 | 111 | 105 | 2761 | 381 | 300 | 147 | 25 | 11 | 3623 | 517 | 416 |
| 2012 | 729 | 135 | 121 | 2849 | 379 | 329 | 106 | 27 | 18 | 3684 | 541 | 468 |
| 2013 | 858 | 160 | 135 | 2435 | 350 | 263 | 121 | 18 | 15 | 3414 | 528 | 413 |
| Total | 3197 | 579 | 502 | 16,050 | 2118 | 1607 | 1064 | 157 | 107 | 20,311 | 2854 | 2216 |
| (%) | (74.73%) | (13.53%) | (11.73%) | (81.16%) | (10.71%) | (8.13%) | (80.12%) | (11.82%) | (8.06%) | (80.02%) | (11.24%) | (8.73%) |
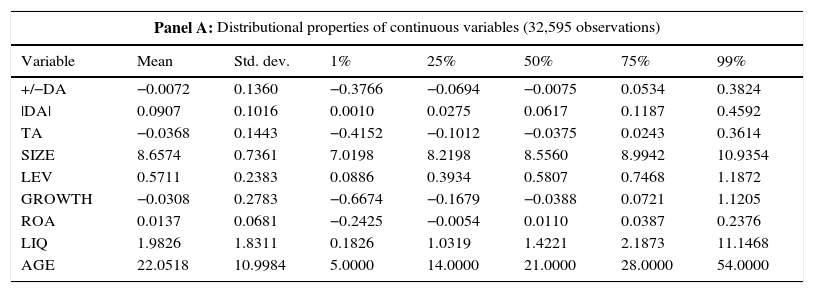
Table 1 Panel B shows the sample distribution of audited SMEs by auditor choice (Big 4/Middle-Tier/rest of auditors). It should be pointed out the low proportion of companies audited by large auditors, although the proportion of companies that choose to be audited by either a Big 4 or a Middle-Tier auditor is higher among the observations below SAT than among the larger ones. In Table 2 we show the descriptive statistics of the continuous variables. We observe that, on average, discretionary accruals are negative, thus consistent with prior literature (Arnedo et al., 2007; García Lara et al., 2005), earnings-decreasing behaviour is more pervasive among private firms. On the other hand, on average, unaudited companies have more negative total accruals and higher absolute discretionary accruals. Moreover, audited companies are larger, have higher leverage and less liquidity, and are older.
Descriptive statistics of continuous variables.
| Panel A: Distributional properties of continuous variables (32,595 observations) | |||||||
|---|---|---|---|---|---|---|---|
| Variable | Mean | Std. dev. | 1% | 25% | 50% | 75% | 99% |
| +/−DA | −0.0072 | 0.1360 | −0.3766 | −0.0694 | −0.0075 | 0.0534 | 0.3824 |
| |DA| | 0.0907 | 0.1016 | 0.0010 | 0.0275 | 0.0617 | 0.1187 | 0.4592 |
| TA | −0.0368 | 0.1443 | −0.4152 | −0.1012 | −0.0375 | 0.0243 | 0.3614 |
| SIZE | 8.6574 | 0.7361 | 7.0198 | 8.2198 | 8.5560 | 8.9942 | 10.9354 |
| LEV | 0.5711 | 0.2383 | 0.0886 | 0.3934 | 0.5807 | 0.7468 | 1.1872 |
| GROWTH | −0.0308 | 0.2783 | −0.6674 | −0.1679 | −0.0388 | 0.0721 | 1.1205 |
| ROA | 0.0137 | 0.0681 | −0.2425 | −0.0054 | 0.0110 | 0.0387 | 0.2376 |
| LIQ | 1.9826 | 1.8311 | 0.1826 | 1.0319 | 1.4221 | 2.1873 | 11.1468 |
| AGE | 22.0518 | 10.9984 | 5.0000 | 14.0000 | 21.0000 | 28.0000 | 54.0000 |
| Panel B: Mean and standard deviation of variables by audit status | |||||||||
|---|---|---|---|---|---|---|---|---|---|
| Non audited | Audited | Test for mean differences | |||||||
| Variable | Obs. | Mean | S. dev. | Obs. | Mean | S. dev. | diff | t | p-Value |
| +/−DA | 8542 | −0.0058 | 0.1432 | 24,053 | −0.0077 | 0.1334 | 0.0020 | 1.14 | 0.127 |
| |DA| | 8542 | 0.0935 | 0.1086 | 24,053 | 0.0897 | 0.0990 | 0.0038 | 2.94 | 0.002 |
| TA | 8542 | −0.0396 | 0.1611 | 24,053 | −0.0358 | 0.1378 | −0.0038 | −2.07 | 0.019 |
| SIZE | 8542 | 8.4460 | 0.7856 | 24,053 | 8.7324 | 0.7026 | −0.2865 | −31.36 | 0.000 |
| LEV | 8542 | 0.5663 | 0.2467 | 24,053 | 0.5728 | 0.2352 | −0.0065 | −2.17 | 0.015 |
| GROWTH | 8542 | 0.0212 | 0.3519 | 24,053 | −0.0492 | 0.2443 | 0.0704 | 20.22 | 0.000 |
| ROA | 8542 | 0.0079 | 0.0735 | 24,053 | 0.0157 | 0.0659 | −0.0078 | −9.16 | 0.000 |
| LIQ | 8542 | 2.0992 | 2.0184 | 24,053 | 1.9411 | 1.7580 | 0.1581 | 6.86 | 0.000 |
| AGE | 8542 | 20.9348 | 10.5710 | 24,053 | 22.4485 | 11.1195 | −1.5137 | −10.95 | 0.000 |
| Non audited below SAT | Audited below SAT | Test for mean differences | |||||||
|---|---|---|---|---|---|---|---|---|---|
| Variable | Obs. | Mean | S. dev. | Obs. | Mean | S. dev. | Diff | t | p-Value |
| +/−DA | 7634 | −0.0057 | 0.1440 | 4278 | −0.0111 | 0.1402 | 0.0054 | 1.98 | 0.024 |
| |DA| | 7634 | 0.0938 | 0.1094 | 4278 | 0.0901 | 0.1080 | 0.0036 | 1.75 | 0.040 |
| TA | 7634 | −0.0402 | 0.1634 | 4278 | −0.0479 | 0.1491 | 0.0077 | 2.53 | 0.006 |
| SIZE | 7634 | 8.4186 | 0.7993 | 4278 | 8.5446 | 0.9172 | −0.1261 | −7.83 | 0.000 |
| LEV | 7634 | 0.5610 | 0.2482 | 4278 | 0.5426 | 0.2537 | 0.0184 | 3.86 | 0.000 |
| GROWTH | 7634 | 0.0319 | 0.3619 | 4278 | 0.0261 | 0.3329 | 0.0058 | 0.86 | 0.195 |
| ROA | 7634 | 0.0070 | 0.0739 | 4278 | 0.0052 | 0.0745 | 0.0018 | 1.31 | 0.096 |
| LIQ | 7634 | 2.1361 | 2.0638 | 4278 | 2.0788 | 2.1163 | 0.0573 | 1.44 | 0.075 |
| AGE | 7634 | 20.9925 | 10.6194 | 4278 | 22.4353 | 11.9685 | −1.4427 | −6.79 | 0.000 |
| Non audited above SAT | Audited above SAT | Test for mean differences | |||||||
|---|---|---|---|---|---|---|---|---|---|
| Variable | Obs. | Mean | S. dev. | Obs. | Mean | S. dev. | Diff | t | p-Value |
| +/−DA | 908 | −0.0065 | 0.1364 | 19,775 | −0.0070 | 0.1318 | 0.0005 | 0.12 | 0.453 |
| |DA| | 908 | 0.0908 | 0.1020 | 19,775 | 0.0896 | 0.0970 | 0.0011 | 0.35 | 0.364 |
| TA | 908 | −0.0343 | 0.1410 | 19,775 | −0.0332 | 0.1351 | −0.0011 | −0.24 | 0.406 |
| SIZE | 908 | 8.6765 | 0.6132 | 19,775 | 8.7731 | 0.6397 | −0.0966 | −4.46 | 0.000 |
| LEV | 908 | 0.6108 | 0.2292 | 19,775 | 0.5794 | 0.2305 | 0.0315 | 4.02 | 0.000 |
| GROWTH | 908 | −0.0684 | 0.2348 | 19,775 | −0.0655 | 0.2171 | −0.0029 | −0.39 | 0.349 |
| ROA | 908 | 0.0148 | 0.0693 | 19,775 | 0.0180 | 0.0637 | −0.0032 | −1.46 | 0.072 |
| LIQ | 908 | 1.7892 | 1.5525 | 19,775 | 1.9114 | 1.6689 | −0.1222 | −2.16 | 0.015 |
| AGE | 908 | 20.4493 | 10.1479 | 19,775 | 22.4514 | 10.9274 | −2.0020 | −5.41 | 0.000 |
We test the Hypotheses with the following regression models:
The dependent variable in both models is the level of earnings management (EM). Since this variable is not directly observed, we use a proxy based on the level of discretionary accruals (DA). The discretionary accruals models assume that the accruals that are not explained by innate factors, which are a consequence of the company's activities, are a measure of the level of earnings management. We estimate discretionary accruals3 using the Jones Model (1991) and the absolute value of the discretionary accruals is considered the measure of earnings management.
Some studies (Hribar and Nichols, 2007; Francis and Wang, 2008; Dedman and Kausar, 2012) use the signed discretionary accruals rather than their absolute value. Following Arnedo et al. (2007), we consider that SMEs may have incentives to manage earnings downward because of tax issues, whereas income increasing behaviours may be less frequent because of the limited usefulness of accounting information for lenders (García Lara et al., 2005; Berger and Udell, 2006; Gill de Albornoz and Illueca, 2007). Therefore, we also regress the models separately for positive and negative accruals. In an additional analysis, we use alternative measures of earnings management.
Model [1] includes AUDIT, which equals 1 when companies are audited and 0 otherwise. We have to note, however, that SABI presents problems with the identification of audited companies. When a company is not audited in t, the data is left blank in the database. However, some of these blank data are really missing observations. Therefore, “blank data” may be either unaudited or audited (but missing) observations, thus some audited observations may be erroneously considered non-audited. This limitation can be partially overcome by changing some of these “blank data” observations to “audited” observations (Huguet and Gandía, 2014). Considering that the shortest auditor tenure in Spain is three years, if: (a) a company is audited in t−1 and t+1; and (b) is above SAT in t, we consider the company is audited in t. We applied this improvement and 664 observations with blank data were changed to audited observations.
Furthermore, we include VOL, which equals 1 when company is voluntarily audited and 0 otherwise. The introduction of this variable let us test the differential effect of voluntary audits over mandatory audits: the effect of mandatory audits is observed from β1, while the sum of β1+β2 captures the effect of voluntary audits. Therefore, we can test simultaneously the differences between audited and unaudited observations (Hypothesis 1), as well as the differences between voluntary and mandatory audits (Hypothesis 3).
On the other hand, the auditor choice may affect the level of earnings management among the audited companies, so we include two audit-based variables more: BIG, which equals 1 for companies audited by a Big 4 auditor and 0 otherwise; and LARGE, which equals 1 when companies are audited by large auditors (either Middle-Tier or Big 4 audit firms) and 0 otherwise. We have considered an audit firm is a Middle-Tier auditor when this firm has revenues for audit fees higher than €9,000,000 in 2010 and 2011.4 These firms, although smaller than the Big 4, operate in several regions of the country and have also significant revenues from consulting and tax services. BIG captures the differences between Big 4 and Middle-Tier auditors, while LARGE captures the differences between both types of large audit firms and the rest of auditors. Since the effect of the Big 4 and Middle-Tier auditors may change between the voluntary and the mandatory setting, we also include the interaction terms between these two variables and VOL.
Regarding Model [2], we use this model in the sample of audited companies, and thus we exclude AUDIT from it. Results from this model support the results of Model [1] for Hypotheses 2 and 3, but focusing only on the differences between auditors.
We include in both models a set of control variables that have been used in previous research, which are defined in Appendix. Company size (SIZE) is measured as the natural logarithm of total assets (Balsam et al., 2003; Kim et al., 2003; Van Tendeloo and Vanstraelen, 2008). Although earlier papers predict a positive association between earnings management and size as a consequence of decreasing-income accruals to avoid political costs (Jensen and Meckling, 1976; Watts and Zimmerman, 1986), recent papers show that company size is positively associated with earnings quality (from whom earnings management is an inverse measure) because of the economies of scale to produce higher quality information (Ashbaugh-Skaife et al., 2007) and a stricter control by the public and government (Arnedo et al., 2007). On the other hand, we measure leverage (LEV) as the ratio of total liabilities to total assets (DeFond and Jiambalvo, 1994; Becker et al., 1998; Reynolds and Francis, 2000). Since managers have incentives to not meet the debt covenants, we expect a positive association between leverage and earnings management (DeFond and Jiambalvo, 1994).
Company growth (GROWTH) is measured as the sales growth (Khurana and Raman, 2004; Chen et al., 2008). We expect that companies with problems have more incentives to engage in earnings management, so the association between GROWTH and EM should be negative. Profitability (ROA) is measured as the Return-On-Assets, calculated as the ratio of earnings before interest and taxes to total assets at the beginning of the period (Velury and Jenkins, 2006; Van Tendeloo and Vanstraelen, 2008). We measure liquidity (LIQ) as the ratio of current assets to current liabilities (Butler et al., 2004; Caramanis and Lennox, 2008). N_EARN is a dummy that equals 1 if the company has negative earnings and 0 otherwise (Francis et al., 1999; Jara and López, 2007). We expect a positive association between N_EARN and EM. Finally, the age of the company (AGE) is measured as its age since its creation (Myers et al., 2003; Chen et al., 2008). The models include year dummies to control for unobserved time-specific effects common to all companies.
Previous literature shows that the use of audit-based variables is often affected by endogeneity problems (Kim et al., 2011; Cano and Sánchez, 2012). They may appear because the test variables LARGE and BIG are the result of a corporate decision to choose the type of auditor rather than a random assignment, a problem also present in AUDIT and VOL for observations below SAT considering that these firms decide to be (or not) audited. Therefore, OLS estimations are not proper because they are biased. Some studies try to mitigate the endogeneity problems through a Heckman two-stage approach (Chaney et al., 2004; Mansi et al., 2004; Pittman and Fortin, 2004; Monterrey and Sánchez, 2007). Nevertheless, recent literature (Clatworthy et al., 2009; Larcker and Rusticus, 2010; Lennox et al., 2012) shows that the Heckman results depend on a proper selection of the instrumental variables, are fragile, and can be even more unreliable than the OLS estimation. Kim et al. (2011) and Lennox et al. (2012) state that the use of fixed-effects regressions can mitigate the potential endogeneity issues as long as the unobserved source of endogeneity is time-invariant. Therefore, we estimate Eqs. (1) and (2) using a firm fixed-effects (FE) regression procedure.
However, it is worth noting that the FE estimation is only a partial solution to endogeneity problems, because it does not allow a simultaneous equation approach when the relation between the dependent and the test variable is bidirectional, and because the FE regression only solves the endogeneity problem when the source of endogeneity is fixed over time.
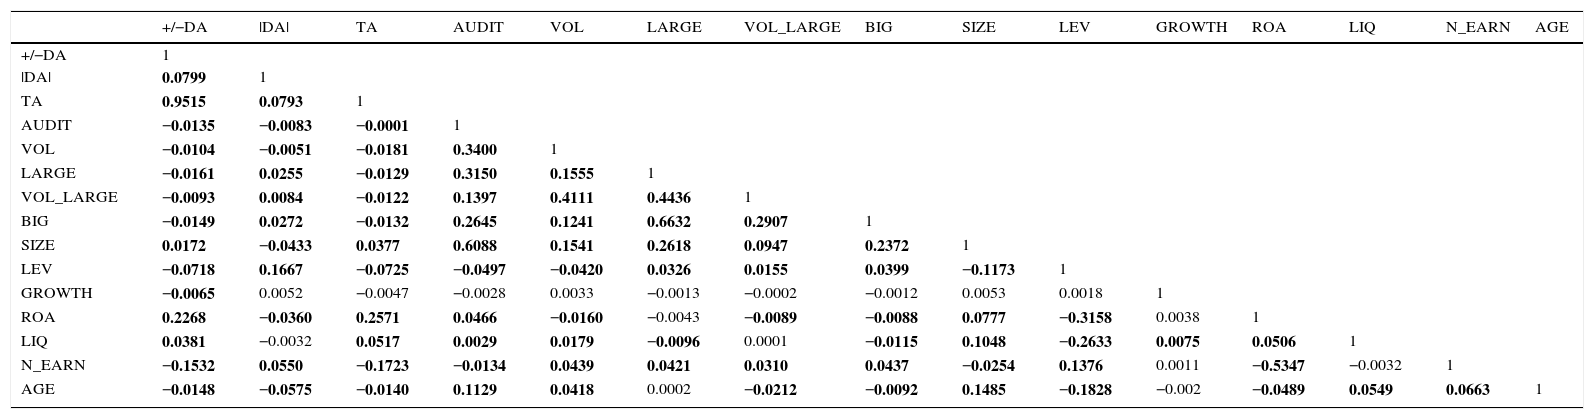
Empirical resultsThis section presents the results of the main analysis. First, we compute a correlation matrix (Table 3) to examine potential multicollinearity problems. The highest correlation is 0.9515 between discretionary and total accruals, showing that most of accruals are abnormal according to our model to estimate discretionary accruals. Nevertheless, TA is not used in the regressions, so there are no problems associated with this association. Furthermore, we use TA as the dependent variable in an additional analysis. Other high correlations are among AUDIT and SIZE (0.6088), BIG and LARGE (0.6632), and ROA and NEG_EARN (0.5347). However, as all the correlations are below 0.80, we do not expect collinearity problems (Judge et al., 1988; Firth, 1997; Carmona and Momparler, 2011).
Correlation matrix.
| +/−DA | |DA| | TA | AUDIT | VOL | LARGE | VOL_LARGE | BIG | SIZE | LEV | GROWTH | ROA | LIQ | N_EARN | AGE | |
|---|---|---|---|---|---|---|---|---|---|---|---|---|---|---|---|
| +/−DA | 1 | ||||||||||||||
| |DA| | 0.0799 | 1 | |||||||||||||
| TA | 0.9515 | 0.0793 | 1 | ||||||||||||
| AUDIT | −0.0135 | −0.0083 | −0.0001 | 1 | |||||||||||
| VOL | −0.0104 | −0.0051 | −0.0181 | 0.3400 | 1 | ||||||||||
| LARGE | −0.0161 | 0.0255 | −0.0129 | 0.3150 | 0.1555 | 1 | |||||||||
| VOL_LARGE | −0.0093 | 0.0084 | −0.0122 | 0.1397 | 0.4111 | 0.4436 | 1 | ||||||||
| BIG | −0.0149 | 0.0272 | −0.0132 | 0.2645 | 0.1241 | 0.6632 | 0.2907 | 1 | |||||||
| SIZE | 0.0172 | −0.0433 | 0.0377 | 0.6088 | 0.1541 | 0.2618 | 0.0947 | 0.2372 | 1 | ||||||
| LEV | −0.0718 | 0.1667 | −0.0725 | −0.0497 | −0.0420 | 0.0326 | 0.0155 | 0.0399 | −0.1173 | 1 | |||||
| GROWTH | −0.0065 | 0.0052 | −0.0047 | −0.0028 | 0.0033 | −0.0013 | −0.0002 | −0.0012 | 0.0053 | 0.0018 | 1 | ||||
| ROA | 0.2268 | −0.0360 | 0.2571 | 0.0466 | −0.0160 | −0.0043 | −0.0089 | −0.0088 | 0.0777 | −0.3158 | 0.0038 | 1 | |||
| LIQ | 0.0381 | −0.0032 | 0.0517 | 0.0029 | 0.0179 | −0.0096 | 0.0001 | −0.0115 | 0.1048 | −0.2633 | 0.0075 | 0.0506 | 1 | ||
| N_EARN | −0.1532 | 0.0550 | −0.1723 | −0.0134 | 0.0439 | 0.0421 | 0.0310 | 0.0437 | −0.0254 | 0.1376 | 0.0011 | −0.5347 | −0.0032 | 1 | |
| AGE | −0.0148 | −0.0575 | −0.0140 | 0.1129 | 0.0418 | 0.0002 | −0.0212 | −0.0092 | 0.1485 | −0.1828 | −0.002 | −0.0489 | 0.0549 | 0.0663 | 1 |
Coefficients in bold denote statistical significance at the 5% level.
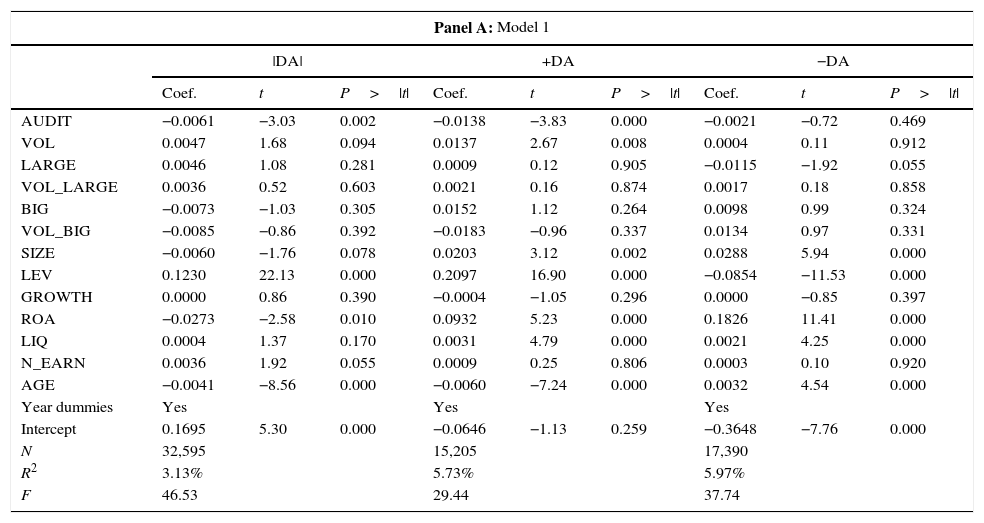
We then run models [1] and [2] in the samples explained in Section “Sample and descriptive statistics” using absolute and signed discretionary accruals as our measure of earnings quality. Table 4 Panel A shows the results from Model [1], whereas Panel B shows the results from Model [2] in the sub-sample of audited companies.
Regression results.
| Panel A: Model 1 | |||||||||
|---|---|---|---|---|---|---|---|---|---|
| |DA| | +DA | −DA | |||||||
| Coef. | t | P>|t| | Coef. | t | P>|t| | Coef. | t | P>|t| | |
| AUDIT | −0.0061 | −3.03 | 0.002 | −0.0138 | −3.83 | 0.000 | −0.0021 | −0.72 | 0.469 |
| VOL | 0.0047 | 1.68 | 0.094 | 0.0137 | 2.67 | 0.008 | 0.0004 | 0.11 | 0.912 |
| LARGE | 0.0046 | 1.08 | 0.281 | 0.0009 | 0.12 | 0.905 | −0.0115 | −1.92 | 0.055 |
| VOL_LARGE | 0.0036 | 0.52 | 0.603 | 0.0021 | 0.16 | 0.874 | 0.0017 | 0.18 | 0.858 |
| BIG | −0.0073 | −1.03 | 0.305 | 0.0152 | 1.12 | 0.264 | 0.0098 | 0.99 | 0.324 |
| VOL_BIG | −0.0085 | −0.86 | 0.392 | −0.0183 | −0.96 | 0.337 | 0.0134 | 0.97 | 0.331 |
| SIZE | −0.0060 | −1.76 | 0.078 | 0.0203 | 3.12 | 0.002 | 0.0288 | 5.94 | 0.000 |
| LEV | 0.1230 | 22.13 | 0.000 | 0.2097 | 16.90 | 0.000 | −0.0854 | −11.53 | 0.000 |
| GROWTH | 0.0000 | 0.86 | 0.390 | −0.0004 | −1.05 | 0.296 | 0.0000 | −0.85 | 0.397 |
| ROA | −0.0273 | −2.58 | 0.010 | 0.0932 | 5.23 | 0.000 | 0.1826 | 11.41 | 0.000 |
| LIQ | 0.0004 | 1.37 | 0.170 | 0.0031 | 4.79 | 0.000 | 0.0021 | 4.25 | 0.000 |
| N_EARN | 0.0036 | 1.92 | 0.055 | 0.0009 | 0.25 | 0.806 | 0.0003 | 0.10 | 0.920 |
| AGE | −0.0041 | −8.56 | 0.000 | −0.0060 | −7.24 | 0.000 | 0.0032 | 4.54 | 0.000 |
| Year dummies | Yes | Yes | Yes | ||||||
| Intercept | 0.1695 | 5.30 | 0.000 | −0.0646 | −1.13 | 0.259 | −0.3648 | −7.76 | 0.000 |
| N | 32,595 | 15,205 | 17,390 | ||||||
| R2 | 3.13% | 5.73% | 5.97% | ||||||
| F | 46.53 | 29.44 | 37.74 | ||||||
| Panel B: Model 2 | |||||||||
|---|---|---|---|---|---|---|---|---|---|
| |DA| | +DA | −DA | |||||||
| Coef. | t | P>|t| | Coef. | t | P>|t| | Coef. | t | P>|t| | |
| VOL | 0.0051 | 1.63 | 0.102 | 0.0113 | 3.78 | 0.000 | −0.0002 | −0.04 | 0.972 |
| LARGE | 0.0056 | 1.02 | 0.308 | 0.0062 | 0.62 | 0.538 | −0.0075 | −0.97 | 0.334 |
| VOL_LARGE | −0.0078 | −0.92 | 0.360 | −0.0270 | −1.58 | 0.115 | 0.0047 | 0.40 | 0.690 |
| BIG | −0.0157 | −1.67 | 0.094 | −0.0058 | −0.34 | 0.730 | 0.0209 | 1.50 | 0.134 |
| VOL_BIG | −0.0189 | −1.57 | 0.117 | 0.0002 | 0.01 | 0.995 | 0.0488 | 2.81 | 0.005 |
| SIZE | −0.0119 | −2.70 | 0.007 | −0.0094 | −1.07 | 0.285 | 0.0305 | 4.72 | 0.000 |
| LEV | 0.1290 | 20.56 | 0.000 | 0.2997 | 20.60 | 0.000 | −0.0807 | −9.49 | 0.000 |
| GROWTH | 0.0000 | −0.03 | 0.973 | −0.0001 | −0.19 | 0.851 | 0.0000 | 0.43 | 0.665 |
| ROA | −0.0455 | −3.23 | 0.001 | 0.2597 | 8.96 | 0.000 | 0.2057 | 9.82 | 0.000 |
| LIQ | 0.0009 | 2.06 | 0.040 | 0.0032 | 3.90 | 0.000 | 0.0031 | 3.83 | 0.000 |
| N_EARN | 0.0018 | 0.79 | 0.428 | 0.0075 | 1.66 | 0.096 | 0.0025 | 0.77 | 0.442 |
| AGE | −0.0038 | −7.27 | 0.000 | −0.0040 | −4.30 | 0.000 | 0.0028 | 3.51 | 0.000 |
| Year dummies | Yes | Yes | Yes | ||||||
| Intercept | 0.2103 | 5.07 | 0.000 | 0.0877 | 1.15 | 0.250 | −0.3829 | −6.12 | 0.000 |
| N | 24,053 | 11,151 | 12,902 | ||||||
| R2 | 4.06% | 10.81% | 6.48% | ||||||
| F | 43.36 | 39.14 | 28.26 | ||||||
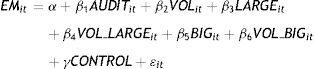
Panel A reports the firm FE regressions of the following model: EMit=α+β1AUDITit+β2VOLit+β3LARGEit+β4VOL_LARGEit+β5BIGit+β6VOL_BIGit+γCONTROL+εit.
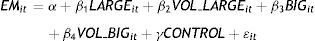
Panel B reports the firm FE regressions of the following model: EMit=α+β1VOLit+β2LARGEit+β3BIGit+β4VOL_LARGEit+β5VOL_BIGit+γCONTROL+εit.
EM is proxied by the absolute value of discretionary accruals (|DA|) and the signed accruals (+/−DA).
Coefficients of year dummies are not included for parsimony.
Regarding Hypothesis 1, we observe in Column 1 of Panel A that AUDIT is significantly negative when we consider unsigned accruals, what is consistent with the idea that auditing provides a constraint for earnings management activities. Its coefficient remains significant when we consider positive accruals but becomes insignificant when we use negative accruals. These results suggest that audits help to mitigate increasing earnings management, but they do not have a significant effect when companies have incentives to manage downwards. This is consistent with the explanation that when small companies have incentives for decreasing earnings behaviours, e.g. for tax purposes, audits do not work to restrain them, probably because the auditor conservatism considers this behaviour somewhat acceptable.
With regard to Hypothesis 2, VOL is significantly positive in columns 1 and 2 but its coefficient is lower than that of AUDIT. These results, also supported in Panel B of Table 4, suggest that although both voluntary and mandatory audits help to mitigate increasing earnings management, the effect of voluntary audits is somewhat lower. Therefore, auditors seem to be more permissive when performing voluntary audits, what may be explained by the lower visibility and litigation risks faced by auditors in this setting.
With regard to Hypothesis 3, results do not support a significant effect of Big 4 or Middle-Tier auditors on accounting quality and suggest that high quality auditors are not more effective than the rest of auditors against earnings managements in the SMEs setting. Only Column 1 of Panel B shows a negative (though weakly significant) coefficient for BIG, while the negative coefficient of LARGE in Panel A when considering negative accruals is in line with auditors being more permissive with decreasing earnings behaviours because of their conservatism. Therefore, in response to Hypothesis 3, we cannot find evidence that SMEs audited by large auditors (either Big 4 or Middle-Tier auditors) engage less in earnings management than the companies audited by the smaller auditors, a result that may be a consequence of the low litigation risk in the SMEs environment.
Van Tendeloo and Vanstraelen (2008) show that, although the litigation risk in the setting of private companies is lower than the setting of the listed ones, Big 4 auditors continue to be more effective in countries where there is a high alignment between accounting and tax, because of the authorities’ scrutinize of the financial statements replaces the role of investors, which increases the likelihood of detecting an auditor failure and therefore affecting negatively the auditor reputation. In the case of the SMEs, because of their little visibility and lacking litigation risk, larger auditors may not have incentives to do a better job than the rest of the auditors.
Regarding the control variables, SIZE, LEV, ROA, LIQ, NEG_EARN and AGE are significant and have the predicted sign in most of the regressions.
Additional analysesAlternative samplesWe explained in Section “Sample and descriptive statistics” that the sample is composed of companies that have been audited at least once for the period 2008–2013. We exclude the never-audited companies because we think that they may be quite different from those which have been audited. However, results may be affected by this exclusion. Therefore, to test if this selection procedure affects the results we expand the sample with the observations of the companies that have never been audited for the period sample. We only re-run Model [1] for the expanded sample, because the sub-sample of audited companies remains unchanged.
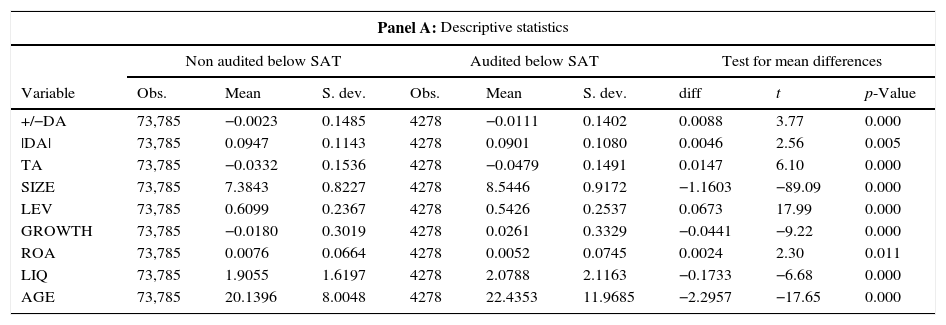
Table 5 reports the descriptive statistics and regression results for this sample. We can see that the total sample is increased up to 99,088 observations, 78,063 of them belonging to the sub-sample below SAT.5 We can see that results for the test variables are qualitatively similar to those reported in Table 4 Panel A.
Additional analysis with expanded sample.
| Panel A: Descriptive statistics | |||||||||
|---|---|---|---|---|---|---|---|---|---|
| Non audited below SAT | Audited below SAT | Test for mean differences | |||||||
| Variable | Obs. | Mean | S. dev. | Obs. | Mean | S. dev. | diff | t | p-Value |
| +/−DA | 73,785 | −0.0023 | 0.1485 | 4278 | −0.0111 | 0.1402 | 0.0088 | 3.77 | 0.000 |
| |DA| | 73,785 | 0.0947 | 0.1143 | 4278 | 0.0901 | 0.1080 | 0.0046 | 2.56 | 0.005 |
| TA | 73,785 | −0.0332 | 0.1536 | 4278 | −0.0479 | 0.1491 | 0.0147 | 6.10 | 0.000 |
| SIZE | 73,785 | 7.3843 | 0.8227 | 4278 | 8.5446 | 0.9172 | −1.1603 | −89.09 | 0.000 |
| LEV | 73,785 | 0.6099 | 0.2367 | 4278 | 0.5426 | 0.2537 | 0.0673 | 17.99 | 0.000 |
| GROWTH | 73,785 | −0.0180 | 0.3019 | 4278 | 0.0261 | 0.3329 | −0.0441 | −9.22 | 0.000 |
| ROA | 73,785 | 0.0076 | 0.0664 | 4278 | 0.0052 | 0.0745 | 0.0024 | 2.30 | 0.011 |
| LIQ | 73,785 | 1.9055 | 1.6197 | 4278 | 2.0788 | 2.1163 | −0.1733 | −6.68 | 0.000 |
| AGE | 73,785 | 20.1396 | 8.0048 | 4278 | 22.4353 | 11.9685 | −2.2957 | −17.65 | 0.000 |
| Non audited above SAT | Audited above SAT | Test for mean differences | |||||||
|---|---|---|---|---|---|---|---|---|---|
| Variable | Obs. | Mean | S. dev. | Obs. | Mean | S. dev. | diff | t | p-Value |
| +/−DA | 1250 | −0.0053 | 0.1372 | 19,775 | −0.0070 | 0.1318 | 0.0017 | 0.44 | 0.328 |
| |DA| | 1250 | 0.0927 | 0.1012 | 19,775 | 0.0896 | 0.0970 | 0.0031 | 1.09 | 0.138 |
| TA | 1250 | −0.0324 | 0.1405 | 19,775 | −0.0332 | 0.1351 | 0.0008 | 0.20 | 0.420 |
| SIZE | 1250 | 8.5820 | 0.5859 | 19,775 | 8.7731 | 0.6397 | −0.1911 | −10.29 | 0.000 |
| LEV | 1250 | 0.6095 | 0.2241 | 19,775 | 0.5794 | 0.2305 | 0.0301 | 4.49 | 0.000 |
| GROWTH | 1250 | −0.0814 | 0.2480 | 19,775 | −0.0655 | 0.2171 | −0.0159 | −2.49 | 0.006 |
| ROA | 1250 | 0.0185 | 0.0668 | 19,775 | 0.0180 | 0.0637 | 0.0005 | 0.29 | 0.385 |
| LIQ | 1250 | 1.7767 | 1.4823 | 19,775 | 1.9114 | 1.6689 | −0.1346 | −2.78 | 0.003 |
| AGE | 1250 | 20.5920 | 9.5827 | 19,775 | 22.4514 | 10.9274 | −1.8594 | −5.87 | 0.000 |
| Panel B: Regression results Model 1 | |||||||||
|---|---|---|---|---|---|---|---|---|---|
| |DA| | +DA | −DA | |||||||
| Coef. | t | P>|t| | Coef. | t | P>|t| | Coef. | t | P>|t| | |
| AUDIT | −0.0085 | −4.13 | 0.000 | −0.0196 | −5.63 | 0.000 | −0.0019 | −0.69 | 0.490 |
| VOL | 0.0062 | 2.13 | 0.033 | 0.0174 | 3.46 | 0.001 | 0.0004 | 0.09 | 0.925 |
| LARGE | 0.0043 | 0.95 | 0.342 | −0.0003 | −0.03 | 0.973 | −0.0119 | −2.01 | 0.045 |
| VOL_LARGE | 0.0040 | 0.56 | 0.579 | 0.0034 | 0.26 | 0.795 | 0.0022 | 0.24 | 0.813 |
| BIG | −0.0073 | −0.98 | 0.327 | 0.0159 | 1.18 | 0.236 | 0.0090 | 0.91 | 0.364 |
| VOL_BIG | −0.0077 | −0.74 | 0.459 | −0.0176 | −0.93 | 0.353 | 0.0172 | 1.26 | 0.209 |
| SIZE | 0.0116 | 4.59 | 0.000 | 0.0610 | 12.63 | 0.000 | 0.0213 | 5.92 | 0.000 |
| LEV | 0.1197 | 28.38 | 0.000 | 0.1307 | 13.68 | 0.000 | −0.1198 | −21.11 | 0.000 |
| GROWTH | 0.0000 | 2.00 | 0.046 | 0.0001 | 1.66 | 0.097 | 0.0000 | −1.22 | 0.224 |
| ROA | 0.0560 | 7.63 | 0.000 | 0.1351 | 9.78 | 0.000 | 0.2199 | 19.11 | 0.000 |
| LIQ | 0.0002 | 1.59 | 0.112 | 0.0041 | 8.30 | 0.000 | 0.0024 | 6.02 | 0.000 |
| N_EARN | 0.0105 | 8.19 | 0.000 | 0.0003 | 0.12 | 0.902 | 0.0033 | 1.81 | 0.071 |
| AGE | −0.0033 | −7.03 | 0.000 | −0.0064 | −8.25 | 0.000 | 0.0030 | 4.58 | 0.000 |
| Year dum | Yes | Yes | Yes | ||||||
| Intercept | 0.0045 | 0.20 | 0.839 | −0.3209 | −8.22 | 0.000 | −0.2530 | −7.71 | 0.000 |
| N | 99,088 | 47,921 | 51,167 | ||||||
| R2 | 1.82% | 3.96% | 7.76% | ||||||
| F | 67.22 | 46.84 | 107.99 | ||||||
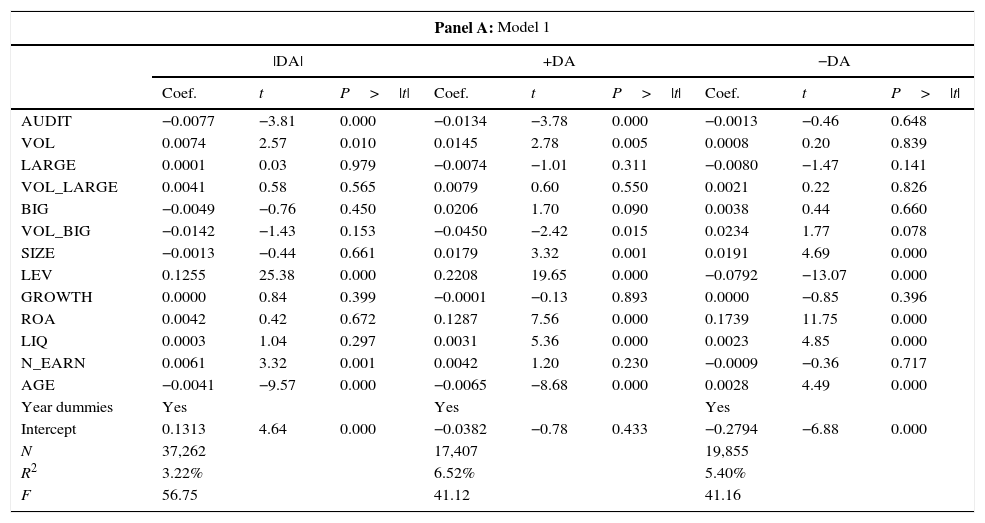
On the other hand, our selection process also excludes the companies that have been above the upper EU thresholds in some years of the sample period. Since this exclusion could be producing a survivorship bias, we do an additional test by including the companies below those thresholds in any of the years of the period, increasing our sample in 4667 observations. Results are reported in Table 6 and are qualitatively similar to those reported in “Empirical results”. The only remarkable difference is that VOL_BIG is significantly negative (positive) when using positive (negative) accruals, suggesting that Big 4 auditors restrain earnings management. However, since results in Tables 4 and 5, as well as results for absolute accruals in Table 6, do not support them, we cannot state that Big 4 auditors are more restrictive than the rest of auditors in the voluntary setting.
Inclusion of companies above EU SAT.
| Panel A: Model 1 | |||||||||
|---|---|---|---|---|---|---|---|---|---|
| |DA| | +DA | −DA | |||||||
| Coef. | t | P>|t| | Coef. | t | P>|t| | Coef. | t | P>|t| | |
| AUDIT | −0.0077 | −3.81 | 0.000 | −0.0134 | −3.78 | 0.000 | −0.0013 | −0.46 | 0.648 |
| VOL | 0.0074 | 2.57 | 0.010 | 0.0145 | 2.78 | 0.005 | 0.0008 | 0.20 | 0.839 |
| LARGE | 0.0001 | 0.03 | 0.979 | −0.0074 | −1.01 | 0.311 | −0.0080 | −1.47 | 0.141 |
| VOL_LARGE | 0.0041 | 0.58 | 0.565 | 0.0079 | 0.60 | 0.550 | 0.0021 | 0.22 | 0.826 |
| BIG | −0.0049 | −0.76 | 0.450 | 0.0206 | 1.70 | 0.090 | 0.0038 | 0.44 | 0.660 |
| VOL_BIG | −0.0142 | −1.43 | 0.153 | −0.0450 | −2.42 | 0.015 | 0.0234 | 1.77 | 0.078 |
| SIZE | −0.0013 | −0.44 | 0.661 | 0.0179 | 3.32 | 0.001 | 0.0191 | 4.69 | 0.000 |
| LEV | 0.1255 | 25.38 | 0.000 | 0.2208 | 19.65 | 0.000 | −0.0792 | −13.07 | 0.000 |
| GROWTH | 0.0000 | 0.84 | 0.399 | −0.0001 | −0.13 | 0.893 | 0.0000 | −0.85 | 0.396 |
| ROA | 0.0042 | 0.42 | 0.672 | 0.1287 | 7.56 | 0.000 | 0.1739 | 11.75 | 0.000 |
| LIQ | 0.0003 | 1.04 | 0.297 | 0.0031 | 5.36 | 0.000 | 0.0023 | 4.85 | 0.000 |
| N_EARN | 0.0061 | 3.32 | 0.001 | 0.0042 | 1.20 | 0.230 | −0.0009 | −0.36 | 0.717 |
| AGE | −0.0041 | −9.57 | 0.000 | −0.0065 | −8.68 | 0.000 | 0.0028 | 4.49 | 0.000 |
| Year dummies | Yes | Yes | Yes | ||||||
| Intercept | 0.1313 | 4.64 | 0.000 | −0.0382 | −0.78 | 0.433 | −0.2794 | −6.88 | 0.000 |
| N | 37,262 | 17,407 | 19,855 | ||||||
| R2 | 3.22% | 6.52% | 5.40% | ||||||
| F | 56.75 | 41.12 | 41.16 | ||||||
| Panel B: Model 2 | |||||||||
|---|---|---|---|---|---|---|---|---|---|
| |DA| | +DA | −DA | |||||||
| Coef. | t | P>|t| | Coef. | t | P>|t| | Coef. | t | P>|t| | |
| VOL | 0.0108 | 2.84 | 0.005 | 0.0207 | 2.85 | 0.004 | −0.0003 | −0.05 | 0.958 |
| LARGE | −0.0014 | −0.26 | 0.792 | −0.0063 | −0.65 | 0.514 | −0.0015 | −0.22 | 0.822 |
| VOL_LARGE | −0.0095 | −1.06 | 0.291 | −0.0300 | −1.66 | 0.096 | 0.0072 | 0.60 | 0.548 |
| BIG | −0.0025 | −0.30 | 0.766 | 0.0031 | 0.20 | 0.841 | 0.0074 | 0.64 | 0.522 |
| VOL_BIG | −0.0187 | −1.52 | 0.128 | −0.0418 | −1.75 | 0.081 | 0.0377 | 2.24 | 0.025 |
| SIZE | −0.0037 | −1.00 | 0.318 | 0.0026 | 0.37 | 0.709 | 0.0198 | 3.89 | 0.000 |
| LEV | 0.1319 | 23.86 | 0.000 | 0.2881 | 21.63 | 0.000 | −0.0751 | −11.32 | 0.000 |
| GROWTH | 0.0000 | 0.01 | 0.995 | 0.0005 | 0.99 | 0.321 | 0.0000 | 0.37 | 0.709 |
| ROA | −0.0173 | −1.34 | 0.181 | 0.1592 | 6.35 | 0.000 | 0.1918 | 10.39 | 0.000 |
| LIQ | 0.0004 | 0.99 | 0.320 | 0.0036 | 4.80 | 0.000 | 0.0045 | 6.33 | 0.000 |
| N_EARN | 0.0052 | 2.35 | 0.019 | 0.0058 | 1.33 | 0.183 | 0.0005 | 0.16 | 0.871 |
| AGE | −0.0041 | −8.41 | 0.000 | −0.0058 | −6.70 | 0.000 | 0.0023 | 3.39 | 0.001 |
| Year dummies | Yes | Yes | Yes | ||||||
| Intercept | 0.1432 | 4.01 | 0.000 | 0.0343 | 0.54 | 0.590 | −0.2877 | −5.64 | 0.000 |
| N | 28,483 | 13,239 | 15,244 | ||||||
| R2 | 3.97% | 9.73% | 6.10% | ||||||
| F | 53.13 | 45.31 | 34.35 | ||||||
Panel A reports the firm FE regressions of the following model: EMit=α+β1AUDITit+β2VOLit+β3LARGEit+β4VOL_LARGEit+β5BIGit+β6VOL_BIGit+γCONTROL+εit.
Panel B reports the firm FE regressions of the following model: EMit=α+β1VOLit+β2LARGEit+β3BIGit+β4VOL_LARGEit+β5VOL_BIGit+γCONTROL+εit.
EM is proxied by the absolute value of discretionary accruals (|DA|). and the signed accruals (+/−DA).
Coefficients of year dummies are not included for parsimony.
Our definition of Middle-Tier auditor is wider than that one used in previous papers (Boone et al., 2010; Swanquist et al., 2012; Sundgren and Svanström, 2013), and it can be considered a bit arbitrary. For this reason, we consider a more restrictive definition of this variable, by considering only BDO and Grant-Thornton as Middle-Tier auditors. Unreported results do not show a significant association between large auditors and earnings management, so results in this section support those ones reported in the main analysis.
On the other hand, the lack of a significant relationship between large auditors and earnings management may involve that these auditors issue more modified audit reports than the rest of auditors. For this reason, we include a dummy variable, MOD, which equals 0 when the audit firms issue a clean opinion and 1 otherwise. Unreported results show that this variable is not significant in any regression, and results for AUDIT, BIG and LARGE are similar to those reported in the main analysis.
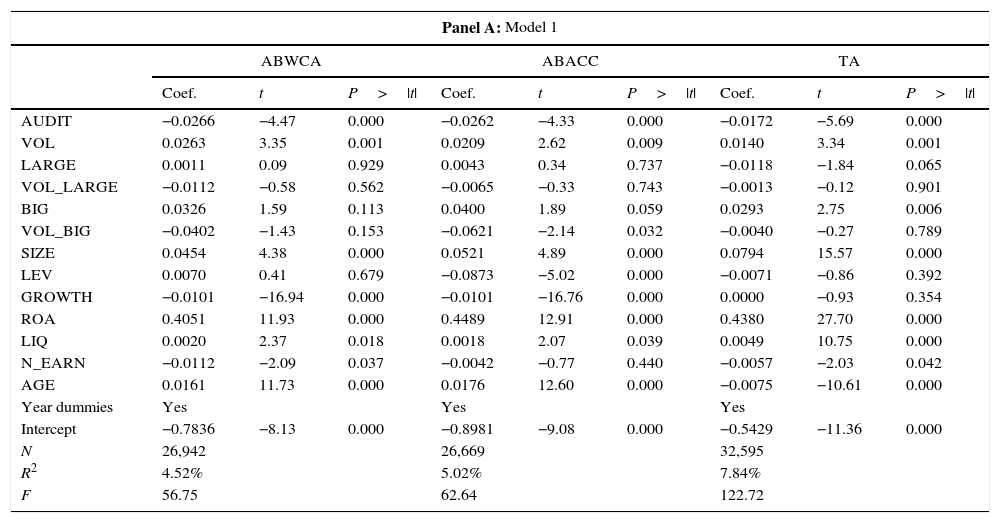
Alternative measures of earnings managementTo test if the results are sensitive to the measure of earnings management we used, we also estimate discretionary accruals using a variation of the original Jones Model, modified by Dechow et al. (1995). Unreported results are similar to those reported in Section “Empirical results” and support the conclusions of the main analysis. Moreover, we also use the total accruals (TA) as our measure of earnings management, as well as two measures no based in the Jones Model, in particular the measures used by DeFond and Park (2001) and Francis and Wang (2008), who use a linear expectation model in which predicted accruals are based on a firm's prior year ratio of current accruals to sales (ABWCA, DeFond and Park, 2002), and the prior year's ratio of depreciation to property, plant and equipment (ABACC, Francis and Wang, 2008), and abnormal accruals are calculated as the difference between real and predicted accruals:

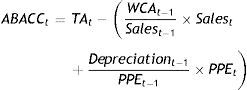
The main advantage of this approach is that it implicitly controls for differences among companies in the same industry, because it uses a firm as its own control to compute abnormal accruals. Abnormal accruals are scaled by a firm's lagged total assets. On the other hand, since data for two consecutive years are needed to calculate abnormal accruals, our sample for these measures runs from 2009 to 2013. Results for TA, ABWCA and ABACC are reported in Table 7. We can see that results for AUDIT and VOL are consistent with those reported in the previous analysis.
Alternative measures of EM.
| Panel A: Model 1 | |||||||||
|---|---|---|---|---|---|---|---|---|---|
| ABWCA | ABACC | TA | |||||||
| Coef. | t | P>|t| | Coef. | t | P>|t| | Coef. | t | P>|t| | |
| AUDIT | −0.0266 | −4.47 | 0.000 | −0.0262 | −4.33 | 0.000 | −0.0172 | −5.69 | 0.000 |
| VOL | 0.0263 | 3.35 | 0.001 | 0.0209 | 2.62 | 0.009 | 0.0140 | 3.34 | 0.001 |
| LARGE | 0.0011 | 0.09 | 0.929 | 0.0043 | 0.34 | 0.737 | −0.0118 | −1.84 | 0.065 |
| VOL_LARGE | −0.0112 | −0.58 | 0.562 | −0.0065 | −0.33 | 0.743 | −0.0013 | −0.12 | 0.901 |
| BIG | 0.0326 | 1.59 | 0.113 | 0.0400 | 1.89 | 0.059 | 0.0293 | 2.75 | 0.006 |
| VOL_BIG | −0.0402 | −1.43 | 0.153 | −0.0621 | −2.14 | 0.032 | −0.0040 | −0.27 | 0.789 |
| SIZE | 0.0454 | 4.38 | 0.000 | 0.0521 | 4.89 | 0.000 | 0.0794 | 15.57 | 0.000 |
| LEV | 0.0070 | 0.41 | 0.679 | −0.0873 | −5.02 | 0.000 | −0.0071 | −0.86 | 0.392 |
| GROWTH | −0.0101 | −16.94 | 0.000 | −0.0101 | −16.76 | 0.000 | 0.0000 | −0.93 | 0.354 |
| ROA | 0.4051 | 11.93 | 0.000 | 0.4489 | 12.91 | 0.000 | 0.4380 | 27.70 | 0.000 |
| LIQ | 0.0020 | 2.37 | 0.018 | 0.0018 | 2.07 | 0.039 | 0.0049 | 10.75 | 0.000 |
| N_EARN | −0.0112 | −2.09 | 0.037 | −0.0042 | −0.77 | 0.440 | −0.0057 | −2.03 | 0.042 |
| AGE | 0.0161 | 11.73 | 0.000 | 0.0176 | 12.60 | 0.000 | −0.0075 | −10.61 | 0.000 |
| Year dummies | Yes | Yes | Yes | ||||||
| Intercept | −0.7836 | −8.13 | 0.000 | −0.8981 | −9.08 | 0.000 | −0.5429 | −11.36 | 0.000 |
| N | 26,942 | 26,669 | 32,595 | ||||||
| R2 | 4.52% | 5.02% | 7.84% | ||||||
| F | 56.75 | 62.64 | 122.72 | ||||||
| Panel B: Model 2 | |||||||||
|---|---|---|---|---|---|---|---|---|---|
| ABWCA | ABACC | TA | |||||||
| Coef. | t | P>|t| | Coef. | t | P>|t| | Coef. | t | P>|t| | |
| VOL | 0.0168 | 1.61 | 0.108 | 0.0138 | 1.60 | 0.111 | 0.0111 | 2.01 | 0.044 |
| LARGE | 0.0204 | 1.27 | 0.205 | 0.0213 | 1.30 | 0.195 | −0.0116 | −1.41 | 0.160 |
| VOL_LARGE | 0.0120 | 0.50 | 0.618 | 0.0137 | 0.55 | 0.580 | 0.0045 | 0.35 | 0.725 |
| BIG | 0.0007 | 0.03 | 0.979 | 0.0131 | 0.47 | 0.641 | 0.0353 | 2.49 | 0.013 |
| VOL_BIG | −0.0444 | −1.30 | 0.195 | −0.0631 | −1.77 | 0.076 | 0.0064 | 0.35 | 0.724 |
| SIZE | 0.0746 | 5.53 | 0.000 | 0.0783 | 5.62 | 0.000 | 0.0914 | 13.65 | 0.000 |
| LEV | −0.0164 | −0.83 | 0.405 | −0.1437 | −7.14 | 0.000 | −0.0037 | −0.39 | 0.696 |
| GROWTH | 0.0233 | 2.66 | 0.008 | 0.0080 | 0.89 | 0.375 | 0.0000 | −0.13 | 0.896 |
| ROA | 0.3709 | 8.67 | 0.000 | 0.4029 | 9.13 | 0.000 | 0.3161 | 14.82 | 0.000 |
| LIQ | 0.0036 | 2.84 | 0.005 | 0.0028 | 2.15 | 0.031 | 0.0070 | 10.24 | 0.000 |
| N_EARN | −0.0083 | −1.28 | 0.199 | −0.0019 | −0.28 | 0.781 | −0.0125 | −3.64 | 0.000 |
| AGE | 0.0155 | 9.72 | 0.000 | 0.0165 | 10.07 | 0.000 | −0.0084 | −10.58 | 0.000 |
| Year dummies | Yes | Yes | Yes | ||||||
| Intercept | −1.0451 | −8.23 | 0.000 | −1.1034 | −8.44 | 0.000 | −0.6477 | −10.34 | 0.000 |
| N | 19,953 | 19,777 | 24,053 | ||||||
| R2 | 3.70% | 4.26% | 6.71% | ||||||
| F | 32.53 | 37.26 | 73.62 | ||||||
Panel A reports the firm FE regressions of the following model: EMit=α+β1AUDITit+β2VOLit+β3LARGEit+β4VOL_LARGEit+β5BIGit+β6VOL_BIGit+γCONTROL+εit.
Panel B reports the firm FE regressions of the following model: EMit=α+β1VOLit+β2LARGEit+β3BIGit+β4VOL_LARGEit+β5VOL_BIGit+γCONTROL+εit.
EM is proxied by the signed abnormal working capital accruals (ABWCA, DeFond and Park, 2001), the signed abnormal accruals (ABACC, Francis and Wang, 2008) and the total accruals (TA).
Coefficients of year dummies are not included for parsimony.
It is widely accepted that auditing helps to improve the quality of the financial information and some papers provide evidence of audited financial statements being perceived of higher quality and thus, related with a lower cost of debt. However, it is not clear whether audited financial information is actually of higher quality. In this sense, previous literature about auditing and earnings management has focused on audit quality, proxied by auditor size or auditor tenure, but there is a lack of empirical research about the “audit vs. no audit” discussion. Moreover, there is no research about the differences between voluntary and mandatory audits on accounting quality. This paper provides empirical evidence about both questions among Spanish SMEs.
We find evidence that auditing helps to limit earnings management, proxied by the absolute value of discretionary accruals; voluntary audits also deter earnings management, but in a lesser extent than the mandatory ones. These results suggest that auditors seem more permissive when performing voluntary audits, what may be explained by the lower visibility and litigation risks faced by them in the voluntary setting. When we examine separately positive and negative discretionary accruals, we find that audits help to mitigate income-increasing behaviours, but they are not effective when companies manage downward. These results can be explained by the auditor conservatism, for which auditors are not effective against earnings management when companies have incentives to manage downward.
On the other hand, we do not find significant differences for SMEs audited by large auditors, thus it suggests that high quality auditors do not have incentives to be more restrictive than the rest of auditors in a setting with low litigation risk. Results are robust to the use of four different measures of earnings management, alternative samples, a different definition for Middle-Tier auditors, and the inclusion of the audit report as a control variable.
The paper has several limitations. First, results may be affected by endogeneity problems. Although we tackle them using fixed-effects regressions, we cannot rule out completely that they have been solved. Another limitation is the measure of earnings management. The estimation of our proxy for discretionary accruals involves errors of measure and requires the previous calculation of real accruals and estimated accruals. We have used alternative measures for earnings management, and they show similar results. Finally, as we cannot ensure that companies below SAT are voluntarily audited, conclusions about voluntary audits must be interpreted with caution.
There are several streams of future research related with this paper. First at all, although we do not find evidence that audit quality does not affect earnings management in the setting of SMEs, it is interesting to examine if high quality auditors have an additional value, such as an improvement of the credibility of the financial statements, regardless their actual quality or the value of audit quality in specific settings with different litigation risk, such as SMEs involved in creditors’ meetings or tax inspections. Secondly, the results about large auditors suggest that audit quality in the SMEs setting should be examined using other proxies for it, such as auditor tenure or audit fees, rather than auditor size.
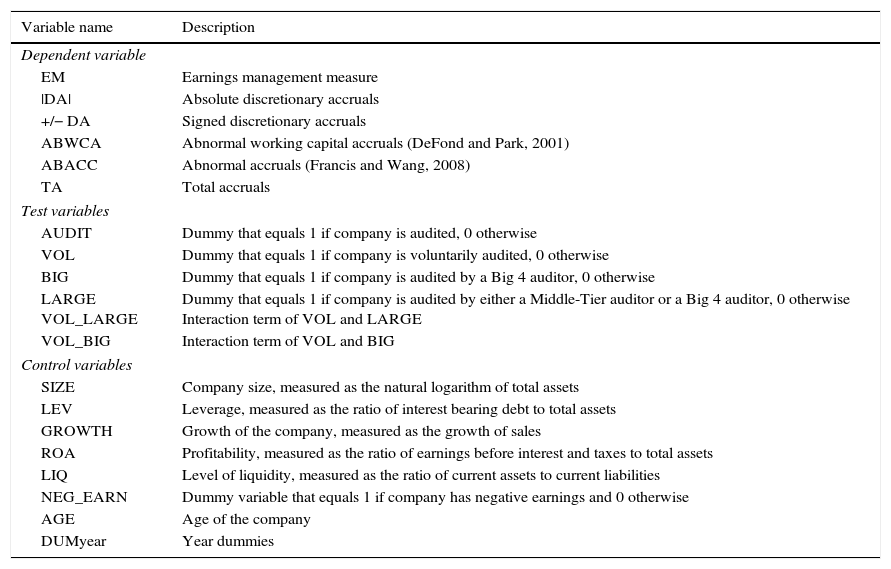
See Table A1.
Description of variables.
| Variable name | Description |
|---|---|
| Dependent variable | |
| EM | Earnings management measure |
| |DA| | Absolute discretionary accruals |
| +/− DA | Signed discretionary accruals |
| ABWCA | Abnormal working capital accruals (DeFond and Park, 2001) |
| ABACC | Abnormal accruals (Francis and Wang, 2008) |
| TA | Total accruals |
| Test variables | |
| AUDIT | Dummy that equals 1 if company is audited, 0 otherwise |
| VOL | Dummy that equals 1 if company is voluntarily audited, 0 otherwise |
| BIG | Dummy that equals 1 if company is audited by a Big 4 auditor, 0 otherwise |
| LARGE VOL_LARGE | Dummy that equals 1 if company is audited by either a Middle-Tier auditor or a Big 4 auditor, 0 otherwise Interaction term of VOL and LARGE |
| VOL_BIG | Interaction term of VOL and BIG |
| Control variables | |
| SIZE | Company size, measured as the natural logarithm of total assets |
| LEV | Leverage, measured as the ratio of interest bearing debt to total assets |
| GROWTH | Growth of the company, measured as the growth of sales |
| ROA | Profitability, measured as the ratio of earnings before interest and taxes to total assets |
| LIQ | Level of liquidity, measured as the ratio of current assets to current liabilities |
| NEG_EARN | Dummy variable that equals 1 if company has negative earnings and 0 otherwise |
| AGE | Age of the company |
| DUMyear | Year dummies |
SABI does not contain information about the reason companies are audited, thus we cannot differentiate between mandatory or voluntary audits when companies are below legal thresholds.
The authors gratefully acknowledge the financial contribution of the Spanish Ministry of Economy and Competitiveness (research project ECO2013-48208-P).
We are grateful to the participants at 36th EAA Congress (2013), to the participants at IX Accounting Research Symposium (2013), to the participants at the 9th Workshop on European Financial Reporting and to the comments of Alexander Brüggen, Nadine Funcke, Ann Vanstraelen, Caren Schelleman, Annelies Renders, Patrick Vorst and Jonas Hesse.
Spanish companies with limited liability are the Sociedad Anónima (SA) and Sociedad Limitada (SL).
articles