


It is widely accepted in word-of-mouth (WOM) research that weak ties have a greater macro-level impact than strong ties on the spread of WOM and that marketers should thus intentionally stimulate WOM between weak ties to optimize a given WOM campaign. Here, we challenge this idea based on the fact that, in practice, marketers often incorporate a WOM campaign into other forms of marketing activities, typically advertising. Using an agent-based modeling approach, we demonstrate that while advertising serves as one source of information flow, the WOM that is most effective at driving product growth is created by strong rather than weak ties. The rationale behind this is simple: advertising competes against weak ties in disseminating information globally, and it is this global reach that has been widely considered the vital strength of weak ties over strong ties.
Utilizing word-of-mouth (WOM) marketing to launch new products is commonly practiced in various industries such as food, clothing, electronics, publishing, and software (Rosen, 2009). People are more inclined to listen to their peers and friends before they trust what a salesman says; thus, WOM can often have a greater marketing effectiveness than other, non-personal forms of marketing activities like advertising (Hughes, 2005). This difference in effectiveness is even more pronounced today, when WOM interactions are readily available through online platforms and consumers have become more resistant to firm-generated messages (Trusov et al., 2009). It is no surprise that firms have been increasing investments in WOM marketing, well ahead of print media, product sampling, and television advertising (Word-of-Mouth Marketing Association, 2014). Against this backdrop, the key factors underlying the spread of WOM are of great academic interest and managerial importance.
In this paper, we focus on one such factor: strong ties versus weak ties. Strong ties exist between close-knit members with frequent interactions, such as family and close friends. By contrast, weak ties are typified by distant social relationships and infrequent interactions, which are commonly observed between acquaintances or strangers (Granovetter, 1973). A widely accepted notion in WOM research is that weak ties have a greater impact on the market-level spread of WOM, even though strong ties have a greater interpersonal influence (Brown and Reingen, 1987; Frenzen and Nakamoto, 1993; Godes and Mayzlin, 2009; Goldenberg et al., 2001, 2007). From a managerial point of view, this is encouraging and suggests intentionally stimulating WOM between weak ties prior to stimulating WOM between strong ties. Here, we challenge this notion and argue that strong ties are more valuable to WOM marketing.
Our main motivation for reconsidering the role of strong versus weak ties is that there are many situations in which WOM campaigns are conducted in combination with advertising or other non-personal forms of marketing activities (Word-of-Mouth Marketing Association, 2014). It has been claimed that weak ties are important because they are particularly helpful for spreading information from one group to another (Brown and Reingen, 1987) or from a specific group to the entire market (Smith et al., 2007). However, advertising has exactly the same function – disseminating information globally – as weak ties. Such a functional competition would notably weaken the importance of weak ties.
Using a formal agent-based model (Goldenberg et al., 2001) and a series of computer experiments, we find support for our argument. The results show that while advertising serves as one information source, WOM between strong ties is more effective than that between weak ties for driving the growth process of a newly launched product. This finding proves to be highly robust across market conditions associated with the level of advertising, the average connectivity of consumers (i.e., mean number of contacts a consumer has with others), and the proportion of weak ties in a consumer network. The only exception is when weak ties account for a very large proportion (above 90%) of the network. However, that would hardly ever be the case in real life, due to the regular tendency of individuals to associate and bond with similar others, as in the proverb “birds of a feather flock together” (McPherson et al., 2001).
The remainder of this paper is structured as follows: the following section elaborates on the background and proposes our research hypotheses. In the third section, the agent-based model is introduced, while the fourth section presents the outcomes of the computer simulations conducted to test our hypotheses. The fifth and final section is devoted to theoretical and managerial implications and to future research directions.
Background and hypothesesWOMThe original definition of WOM is that of oral, person-to-person communication regarding a brand, product, or service between a receiver and a sender whom the receiver perceives as non-commercial (Arndt, 1967). In today's world, this communication process has been extended from the face-to-face context to the online context. Consumers write their opinions about products, brands, or companies using many digital communication tools and online platforms, including e-mail, forums, blogs, and social networking sites (SNSs). This does not change the nature of WOM, which remains a consumer-dominated channel of marketing communication where the sender is independent of the market.
Owing to its non-commercial nature, WOM can have a far more persuasive impact than other forms of marketing activities on consumer attitudes and behaviors. For example, Katz and Lazarsfeld (1955) find that WOM is seven times more effective than newspapers and magazines, four times more effective than personal selling, and twice as effective as radio advertising in influencing consumers to switch brands. Day (1971) computes that WOM is nine times more effective than advertising at converting unfavorable or neutral predispositions into positive attitudes. Several more recent surveys report that both offline and online WOM are prior influencers in the purchasing decisions of individual consumers and business-to-business buyers (Base One, 2015; Google et al., 2014; Nielsen, 2015).
Another important feature of WOM is its ability to “go viral” through self-replicating processes, just as biological viruses do. A classic case is the Fabergé Organic Shampoo commercials of the 1970s, which showed a woman who “told two friends” about the product and related how “they told two friends … and so on … and so on” (Willmott, 1999). With the emergence of the internet, particularly social media, the power of going viral has become unprecedented. One instructive example is the social media campaign for Old Spice body wash launched by Proctor & Gamble in 2010. This tongue-in-cheek campaign, with the tag line “The man your man could smell like,” attracted 23 million views on YouTube in just 36h and generated a sales increase of 107% within one month (Kaplan and Haenlein, 2011). With these two features, WOM allows marketers to spend fewer marketing dollars and achieve better performance at improving the sales of new products (Rosen, 2009).
Strength of weak ties theoryIn his pioneering study, Granovetter (1973, p. 1361) classifies social ties into strong and weak in terms of tie strength, which is defined as “a combination of the amount of time, the degree of emotional intensity, the level of intimacy, and the degree of reciprocity between two individuals.” He also reports a compelling finding that weak ties with acquaintances are much more important than strong ties with close friends in how people find jobs. Specifically, the information about jobs that led to employment is more likely to come from acquaintances than from closer friends.
This finding initially appears paradoxical because strong ties can be expected to more helpful in job-seeking for several reasons. First, members in a strong-tie relationship tend to interact with one another more frequently than those with weak ties (Granovetter, 1973). Second, those with strong ties are likely to be in close physical or psychological proximity to each other, which facilitates the behavior of information seeking and sharing (Reingen and Kernan, 1986). Finally, strong ties mean more familiarity with one another's needs and preferences, which encourages the provision of relevant advice (Chung and Tsai, 2009).
Besides having relational strength, however, strong ties also have both an informative and a structural weakness. The informative weakness refers to the fact that information transmitted through strong ties tends to be redundant, because people with strong ties often share similar interests, professions, or geographical location. The structural weakness lies in transitive closure. In a friendship network, for example, this means that any one member's friends are also friends with one another. Information is difficult to spread from such closed triads to outside parties. In contrast, weak ties exist between individuals who do not have much in common, including other contacts and the information they can access. Weak ties thus not only provide non-redundant information but also create crucial bridges through which information can move rapidly and widely in a network. Accordingly, Granovetter (1973, p. 1366) theorizes that “whatever is to be diffused can reach a larger number of people, and traverse a greater social distance, when passed through weak ties rather than strong,” which is known as the “strength of weak ties” theory.
Weak-tie hypothesis in WOM researchInspired by Granovetter (1973), the weak-tie hypothesis has become a truism in the WOM literature, which states that weak ties are more important than strong ties for the market-wide spread of WOM. Beginning with Brown and Reingen (1987), however, the question of how to empirically validate this hypothesis has troubled marketing researchers, as it requires data about both the aggregate growth process of WOM and what happens at the individual level in a network. To the best of our knowledge, Godes and Mayzlin (2009) offer the only empirical evidence as to the hypothesis. Through a large-scale field test, they show that WOM between weak ties is more effective than that between strong ties at driving sales.
Alternatively, some researchers have used methods that are not limited to observed data to test the weak-tie hypothesis. For example, Goldenberg et al. (2001) use cellular automata and demonstrate that WOM transmitted between weak ties should ultimately lead to higher awareness of a new product than if it had been transmitted between strong ties. Analogous simulation-based demonstrations can also be found in Frenzen and Nakamoto (1993) and Goldenberg et al. (2007). Zhang et al. (2015), meanwhile, use a differential equation model to show that weak ties can generate greater sales than strong ties, especially for a high-quality firm. This is because consumers can make more accurate inferences about quality based on the non-convergent information from weak ties. In any case, all these studies advocate the weak-tie hypothesis that weak ties are more valuable to marketing.
Reconsidering strong versus weak tiesDespite the prevalence of the weak-tie hypothesis, the marketing value of strong versus weak ties needs to be reconsidered carefully. As introduced before, the strength of weak ties rests upon their informative and structural advantages compared to strong ties. However, providing non-redundant information appears to no longer be an advantage of weak ties in the context of WOM marketing. Recall that in the case of job seeking, non-redundant information is referred to from the viewpoint of the job seeker. This underlines that strong and weak ties would recommend different jobs and that the job seeker probably already know about the jobs offered by strong ties. For a WOM campaign, by contrast, there is only one product involved, which is supposed to be novel for its target consumers. The focus here is thus on whether consumers discuss the product and, ultimately, adopt it. In this case, strong ties are particularly valuable because of their frequent interactions and strong interpersonal influence.
This suggests that the weak-tie hypothesis all depends on the structural advantage of weak ties. Unfortunately, such an advantage is somewhat overestimated. There is now growing evidence to suggest that sometimes closed strong-tie triads enhance the spread of WOM (Centola, 2010, 2011). Unlike diseases or computer viruses that can be transferred though a single contact between two individuals, WOM referrals may need to be heard from multiple contacts before being adopted, a phenomenon called “complex contagion” (Centola and Macy, 2007). In the complex contagion scenario, the decisive event may not be simply hearing about a product but observing enough people participating to be convinced that the product is worth adopting (Granovetter, 1978; Watts and Dodds, 2007). The presence of a closed triad improves the probability that WOM will be adopted. When two neighboring friends are infected, they have a greater probability to infect their shared friends, who will now be hearing about the product from multiple sources. Although strong ties may translate in a not-adopting social pressure at the beginning of the diffusion process (Delre et al., 2007; Goldenberg et al., 2010), the strong pressure to adopt is in favor of the later stages of diffusion.
More importantly, although weak ties acting long bridges help WOM spread out of a strong-tie group to the wider network, this bridging function is confronted by a serious challenge from advertising or other non-personal forms of marketing. If consumers can receive information from television, newspapers, portal websites, or other channels that would greatly impair the ability of weak ties to spread information globally (Lai and Wong, 2002; Siegel, 2013). Consider the following scenario: after a newly designed motorcycle is announced on Harley-Davidson's brand website, animated discussions soon begin in Harley-Davidson biker communities around the world. In this example, weak ties are barely functional; advertising delivers the initial information directly into each community, and intra-community interactions (i.e., strong ties) drive the follow-up spreading process (Dye, 2000). This example also suggests that advertising has an amplifier effect on strong ties. Since advertising expands the market reach of information, it unleashes the strength of strong ties to nurture inside conversations, which is otherwise constrained by the ability of weak ties to import information from the outside (Goldenberg et al., 2001).
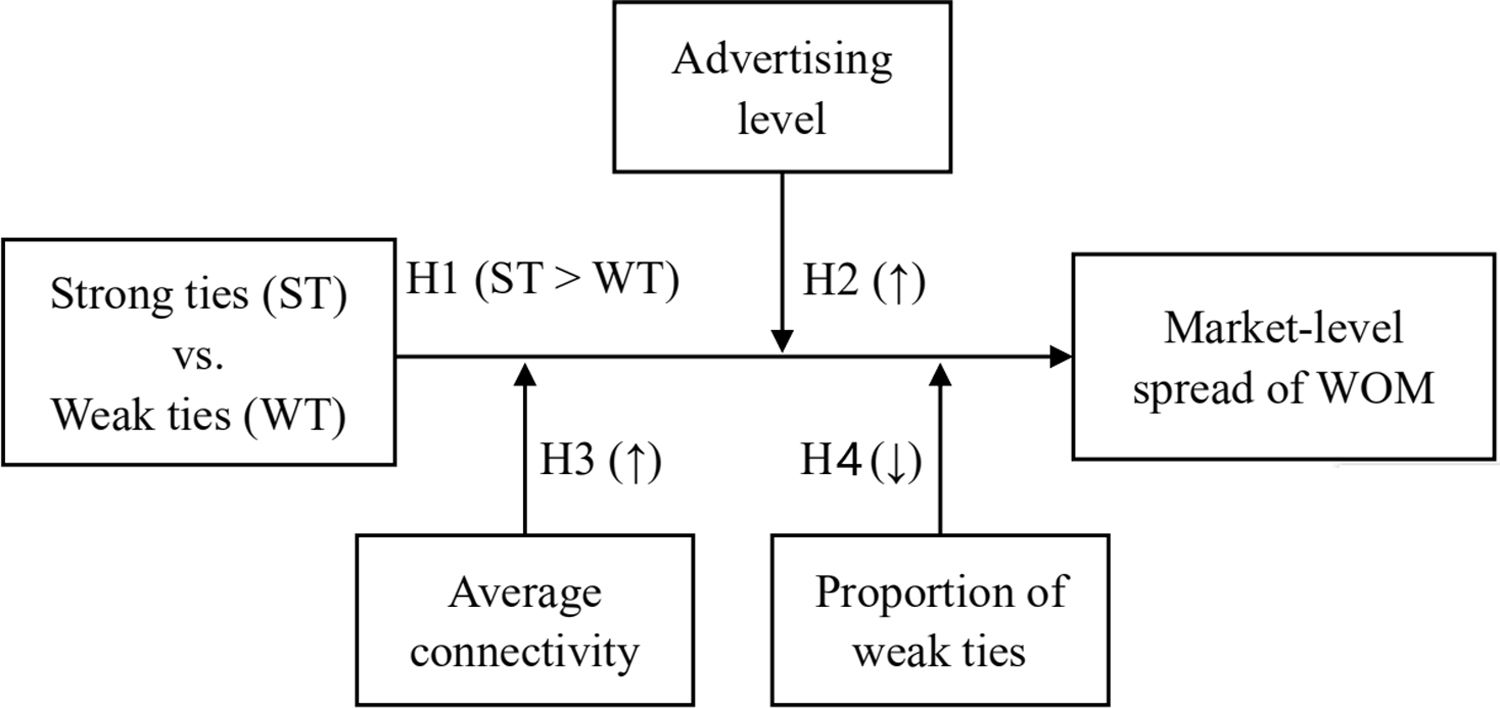
According to the above points, we argue that strong ties play a more important role than weak ties in the spread of WOM. Moreover, we reasonably posit that the superiority of strong ties over weak ties would increase with the level of advertising, due to the opposite effects that advertising has on strong and weak ties. Our hypotheses are therefore as follows:H1 Strong ties have a greater aggregate impact than weak ties on the spread of WOM. As the level of advertising increases, the superiority of strong ties over weak ties becomes more pronounced.
Here we consider two structural factors of consumer networks that have been demonstrated to be critical influences in information dissemination and analyze how they moderate the impact of strong versus weak ties. The first is average connectivity. Our motivation for considering this matter is that people can now easily expand their personal networks and maintain hundreds of relationships through social media (Ellison et al., 2007). The second factor is the proportion of weak ties in a network; we focus on this partly because it varies across cultural contexts. Evidence shows that, whether online or offline, people from collectivistic countries (e.g., Chinese) tend to have a much smaller proportion of weak ties than their counterparts from individualistic countries (e.g., Americans) (Cardon et al., 2009; Choi et al., 2011; Chu and Choi, 2011). Another reason is that the proportion of weak ties has been shown to be different for users of different social media platforms (Phua et al., 2017). Understanding the moderating effect of these two factors can help marketers design an appropriately contextualized WOM-stimulation strategy.
We predict that an increase in average connectivity would enhance the superiority of strong ties over weak ties. Note that “increase in average connectivity” indicates that strong and weak ties are proportionally increased for individuals, corresponding to the fact that users of Facebook and Twitter tend to expand strong and weak online relationships according to their offline networks (Cardon et al., 2009; Choi et al., 2011). The increase in volume, of course, improves the impacts of both strong and weak ties on the spread of WOM. We posit, however, that the improvement is larger for strong ties than for weak ties. On the one hand, increasing average connectivity extends the boundary of strong-tie groups, which amplifies the scope of information transmitted between strong ties and enhances the ability of strong ties to activate WOM through multiple reinforcements (Hu et al., 2014; Siegel, 2009). On the other hand, it shortens the average distance between any two consumers and provides more backup paths for WOM to be transmitted between strong-tie groups, both of which weaken the importance of weak ties in their role as indispensable, long bridges (Hu et al., 2015a). Therefore, we test the following hypothesis:H3 As average connectivity increases, the superiority of strong ties over weak ties becomes more pronounced.
Given an average connectivity, increasing the proportion of weak ties results in more weak-tie paths and fewer strong-tie paths through which WOM can travel. On the whole, this would improve the impact of weak ties and decrease that of strong ties on the spread of WOM. What we are interested in here is whether strong ties consequently lose their superiority in impact. Given that WOM is a complex contagion, a large cascade of WOM requires a delicate balance between the effectiveness of WOM in being activated and the ease of it in being spread; the former is usually a high priority (Centola, 2010, 2011; Centola and Macy, 2007). Moreover, evidence shows that the average distance between two individuals can be surprisingly short when a few weak ties exist in a network (Watts and Strogatz, 1998), suggesting that an extra increase in weak ties would have only a minor effect on ease of spreading. We accordingly predict that strong ties can sustain their superiority, albeit becoming weaker, as the proportion of weak ties increases. This may not be true at the level of a very large proportion of weak ties, a situation in which weak ties appear to take control of the WOM-spreading process due to their absolute quantitative predominance. Our hypothesis is therefore as follows:H4 Although declining with the proportion of weak ties, the superiority of strong ties over weak ties sustains until the proportion of weak ties becomes very large.
To summarize, this research focuses on the relative impact of strong versus weak ties on the market-level spread of WOM and investigates how the difference in impact changes across various market conditions. Fig. 1 presents the research framework for the study.
Method
Testing our hypotheses is too complex for conventional analytical and empirical approaches. We thus use agent-based modeling (ABM), a powerful simulation approach that has seen extensive applications in complicated marketing problems (for a review, see Nejad, 2016). This approach allows for examining a wide range of market conditions that may occur in the real world. In simulated markets, virtual consumers act autonomously according to a strictly specified set of assumptions about their reactions to marketing efforts (e.g., advertising) and consumer-to-consumer interactions (e.g., WOM). Through computer simulations, we can observe how strong and weak ties drive the spreading process of WOM and then identify their relative impacts at the market level. The remainder of this section elaborates on the model and experiment design and provides a validation of the model, drawing on Rand and Rust (2011).
The modelThe model (Goldenberg et al., 2001) that we use here is a variation of the Bass model of new product growth (Bass, 1969). Consider a scenario in which a firm is introducing a new product into a market. In response, each potential consumer in the market needs to decide whether or not to adopt the product, a decision that is stochastically influenced by advertising and WOM interactions with other individuals who have already adopted it (these are the external and internal influences of the Bass model, respectively). The influence of advertising on each potential consumer is specified as probability a, which captures the firm's expenditure on advertising and the consumer's propensity to trust the advertisement. The influence of the WOM from each strong (weak) tie is denoted as probability b (c, respectively), capturing the sender's propensity to make a referral and the receiver's propensity to accept the referral. Thus, the probability of adoption for a potential consumer at each time period is as follows:
where si(t) and wi(t) indicate the number of adopters in one's strong- and weak-tie networks at time period t, respectively.
For each individual, the state transition from potential adopter to adopter uses the following rule. Once the probability of adoption pi(t) is computed, a uniform random deviate r is generated. If r<pi(t), then the individual becomes an adopter; otherwise, she stays potential adopter. Following the conventions in the literature (Goldenberg et al., 2001, 2010; Haenlein and Libai, 2013; Nejad et al., 2015), we made three assumptions in order to avoid unnecessary complexities: (1) the parameters a, b, and c are time-independent; (2) adopters do not disadopt the product once they adopt it; and (3) adopters initiate only positive WOM and potential adopters do not spread WOM.
Consumer networkGiven the complexity of our research questions, we use hypothetical consumer networks instead of real network data to set up the experiments. The generative algorithm of networks (Hu et al., 2015b) is a three-step process. It starts by creating a two-dimensional social space (the virtual market) in which a finite number of consumers are randomly located. The position of an individual in this space represents her attributes, such as occupation, geographical location, age, and social status. The Euclidean distance between two individuals oppositely measures their social similarity; the closer two individuals are in the space, the more socially similar they are to each other.
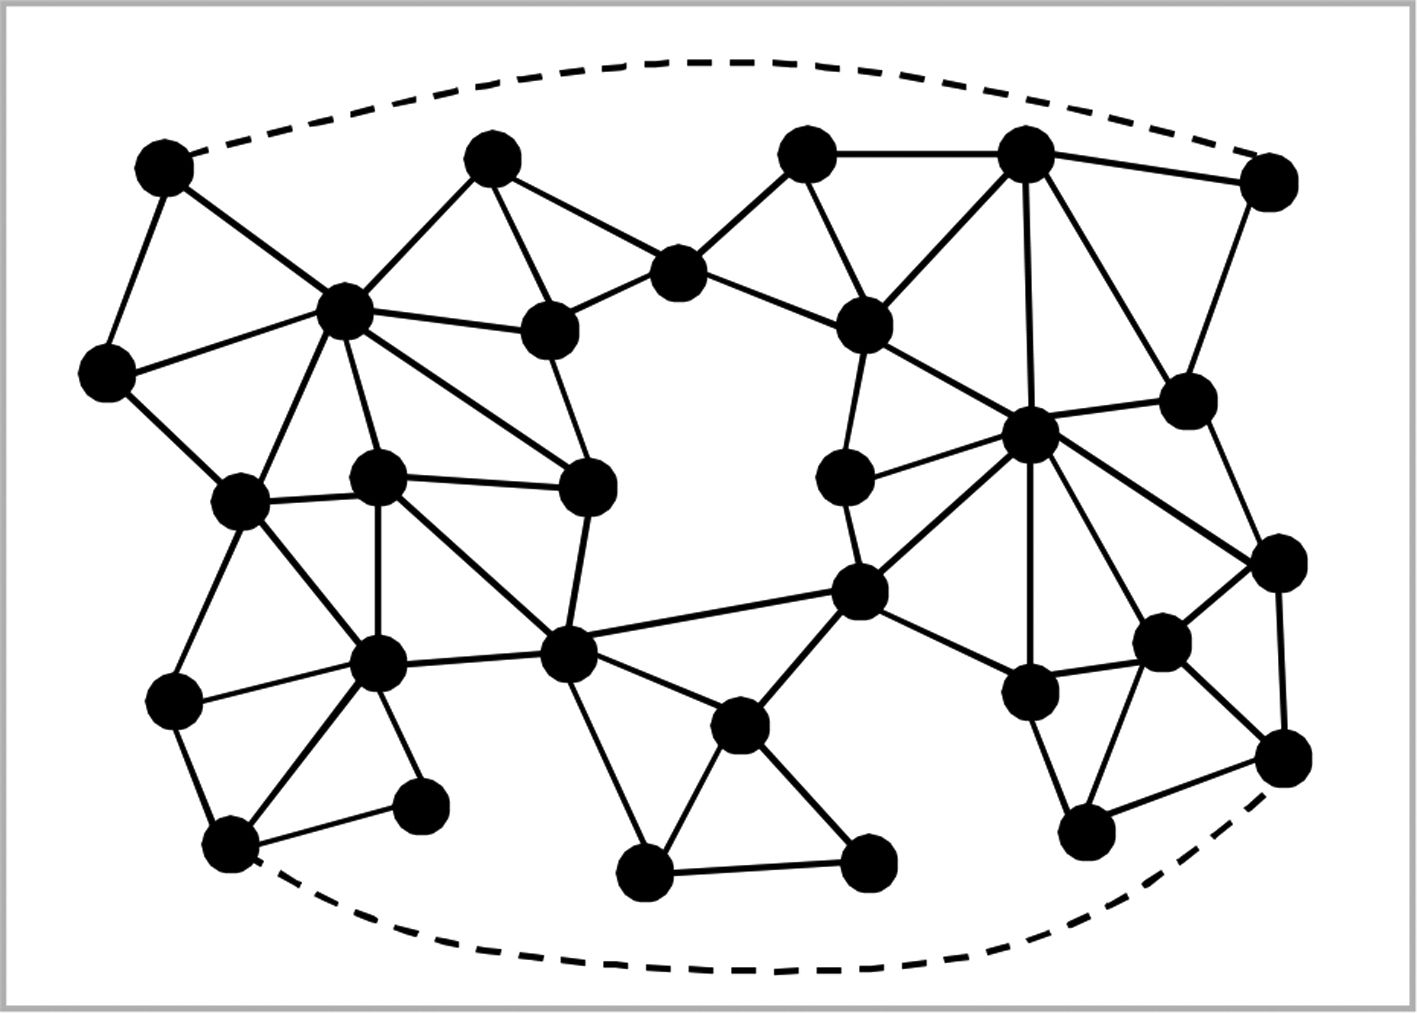
Strong ties are then added into the population one by one. As a high degree of social similarity is often observed between strong-tie members (Granovetter, 1973; McPherson et al., 2001), we consider strong ties to be short, local links between individuals close in the social space. For each strong tie, technically, an individual is first randomly chosen from the population and is then connected to the one who is closest in the social space and to whom the individual is not yet connected. In this case, strong ties are highly likely to form closed triads (see example in Fig. 2), in accordance with the fact that good friends or close professional contacts will know at least some people in common. Moreover, there is no obvious boundary between strong-tie groups, which reflects the fact that often engage in multiple social groups, such as family, friends, and colleagues, that do not completely overlap. Note that the network is unlikely to be completely fragmented even if all weak ties are omitted (Shi et al., 2006). This is an important difference between our network model and that used in analogical studies, such as Goldenberg et al. (2001).
")
Finally, weak ties are built in order. By convention, weak ties are defined as random, long links from individuals to any others outside strong-tie memberships (Centola and Macy, 2007; Siegel, 2009; Watts and Strogatz, 1998). Technically, a weak tie is formed between two individuals who are both chosen from the population randomly and do not yet have either a strong tie or a weak tie. Note that in this model weak ties are fixed over time. We could alternatively model them as interactions randomly activated in each period of the diffusion process. From a practical point of view, however, the result is exactly the same (Goldenberg et al., 2007).
In addition, note that this generative algorithm always produces an unequal number of social ties that individuals have, subject to Poisson distribution (Hu et al., 2015b). In this case, some individuals have far more contacts than average, acting as hubs, opinion leaders, or influentials and playing a key role in diffusion (Goldenberg et al., 2009; Hu et al., 2018; van Eck et al., 2011; Watts and Dodds, 2007). Although they are not the focus of this study, including them in the network makes our model more credible.
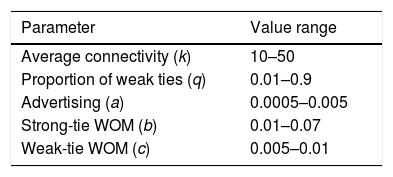
Experiment designWe rely on previous research on WOM, social networks, and ABM to create the parameter sets for our experiments. Throughout all experiments, the virtual market contains a fixed number of 10,000 consumers. Five parameters of interest are considered in a full factorial design (see Table 1); each is manipulated on seven levels in order to allow a wide enough variance in the parameter analysis.
Two of the parameters relate to consumer networks, namely, average connectivity (k) and the proportion of weak ties (q). Average connectivity ranges from 10 to 50, mapping the worlds from offline to online. One may criticize this range as illogical, due to the fact that people can often have hundreds of online relationships. However, several large-scale surveys (Eisingerich et al., 2015; Keller and Fay, 2012) show that the vast majority of conversations about products and brands are actually offline rather than online; put another way, the average person in the online context can influence and be influenced by a few others during a WOM campaign (Hinz et al., 2011; Trusov et al., 2010). In this sense, the networks modeled in this study are WOM-influence networks more than actual relationship networks. The proportion of weak ties in consumer networks ranges from 0.01 to 0.9. This range can cover almost any possible type of real-world social network, from a traditional village network (consisting of many strong ties within a village but very few weak ties across villages) to an online review network (in which random encounters predominate). The descriptive statistics about the networks used are reported in Appendix A.
In accord with previous ABM studies (Goldenberg et al., 2001, 2007), the influences of advertising (a), strong-tie WOM (b), and weak-tie WOM (c) have the ranges [0.0005, 0.005], [0.01, 0.07], and [0.005, 0.01], respectively. These values are logically translated from aggregate diffusion modeling results and standard diffusion parameters (Bass, 1969; Jiang et al., 2006). They reflect both theory and previous research that a single strong-tie referral has the greatest influence on consumer behavior, followed by a single weak-tie referral, and then advertising (Brown and Reingen, 1987); however, this does not mean that the aggregate effects behave similarly (Goldenberg et al., 2001, 2007). Note that the increment in the values of b and c can also be interpreted as the outcome of a WOM marketing activity like a referral reward program.
All combinations of the five parameters produce a total of 75=16,807 experiments. Each experiment runs in two stages. Stage 1 creates the virtual market environment and assigns attributes to the consumer network (k and q) and to each consumer (a, b, and c). In stage 2, the diffusion proceeds through a number of simulation periods in which consumers act according to formula (1). It ends when the product reaches the entire market, once all consumers have become adopters. Once an experiment is completed, we store the parameters and the diffusion process in a data file for later analysis. To minimize the random effects due to the particular realization of the stochastic simulation, we run the program 30 times for each parameter combination. All data analyzed later is based on an average of 30 runs.
Validation of the modelFollowing a structured guide developed by Rand and Rust (2011), we rigorously validate our simulation model in four steps. The first is to validate the micro-face of the model, ensuring that the mechanisms and properties of the model mimic those in the real world. We achieve this by adopting the assumptions about consumer decision making from the Bass model, which has a high predictive capability that is supported by over 40 years of empirical research (Bass, 2004). The second step is to ensure the aggregate pattern of the model is in line with reality, which is called macro-face validation. This is achieved by the S-shaped growth of the simulated product, as has been documented in many studies (Hauser et al., 2006).
The third step, empirical input validation, is to ensure that the data input to the simulation is empirically valid. Previous studies often achieve this by using real data regarding consumer networks (Libai et al., 2013; Nejad et al., 2015) or decision-making processes (Delre et al., 2016). Despite not using real data in this study, we generate parameter sets very carefully according to the relevant empirical research, as explained in the Experiment design section. The final step, empirical output validation, focuses on the degree to which the findings of the simulation accord with real-world observations. It is difficult to directly test our research questions in the real world, so as an alternative we rely on previous research and real marketing cases to back up our findings. As stated in the Analysis of main effects section, for example, our finding regarding the effect of the proportion of weak ties on product growth accord with those of previous studies (Centola, 2010, 2011). In the Theoretical implications section, we provide two supportive cases (the commercial rumor in Hong Kong in 1997 and the Google's viral Gmail campaign) for our main finding that strong ties can be more effective than weak ties in the spread of WOM.
ResultsTo efficiently compare the impact of strong and weak ties, we use a one-dimensional measure, the net present value (NPV) of the product growth process, i.e., the sum of the present values of sales at every diffusion period discounted over time. As our model defines that adoption is propelled by WOM and advertising and assumes that only adopters spread WOM, NPV is suitable for measuring the spread of WOM. We assume that each unit adoption supplies one monetary unit and calculate NPV using a 10% discount rate per period of the growth process, which is a reasonable yearly rate for many markets and fixed profit margins (Goldenberg et al., 2007, 2010; Haenlein and Libai, 2013; Libai et al., 2013). This measure not only captures the aggregate adoption numbers but also highlights the time value of adoption (also, WOM). This is an important consideration, as early adoptions are more valuable to a firm than late ones.
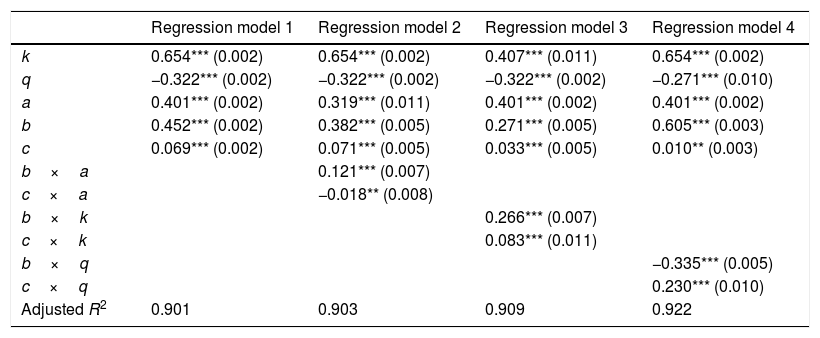
We use ordinary least squares (OLS) regression to examine the effect of the study factors on NPV. The results are presented in Table 2. As the high values of the proportion of weak ties (q=0.7 and 0.9) are quite unrealistic, we also conduct robustness checks by omitting relevant data (see Appendix B), demonstrating that our main conclusions do not depend on the unrealistic values of parameter q.
Regression analysis results (dependent variable: NPV).
| Regression model 1 | Regression model 2 | Regression model 3 | Regression model 4 | |
|---|---|---|---|---|
| k | 0.654*** (0.002) | 0.654*** (0.002) | 0.407*** (0.011) | 0.654*** (0.002) |
| q | −0.322*** (0.002) | −0.322*** (0.002) | −0.322*** (0.002) | −0.271*** (0.010) |
| a | 0.401*** (0.002) | 0.319*** (0.011) | 0.401*** (0.002) | 0.401*** (0.002) |
| b | 0.452*** (0.002) | 0.382*** (0.005) | 0.271*** (0.005) | 0.605*** (0.003) |
| c | 0.069*** (0.002) | 0.071*** (0.005) | 0.033*** (0.005) | 0.010** (0.003) |
| b×a | 0.121*** (0.007) | |||
| c×a | −0.018** (0.008) | |||
| b×k | 0.266*** (0.007) | |||
| c×k | 0.083*** (0.011) | |||
| b×q | −0.335*** (0.005) | |||
| c×q | 0.230*** (0.010) | |||
| Adjusted R2 | 0.901 | 0.903 | 0.909 | 0.922 |
Note: All variables are zero-centered and standardized. Standard errors are presented in bracket below the coefficient estimates.
Table 2 shows that average connectivity (k) has a positive effect on NPV (β=0.654, p<0.001), which accords with the general phenomenon that WOM can spread more rapidly and widely in online networks that often show a large average connectivity than in offline ones. The effect of the proportion of weak ties (q) is found to be negative (β=−0.332, p<0.001), which confirms the theoretical conclusions that networks with many clustered (strong) ties and a high level of separation can be more effective for social contagion than networks with many scattered (weak) ties that provide shortcuts across the social space (Centola, 2010, 2011; Centola and Macy, 2007).
All three diffusion parameters (a, b, and c) show a positive effect on NPV. Specifically, strong-tie WOM generates the largest effect (β=0.452, p<0.001), followed by advertising (β=0.401, p<0.001), and weak-tie WOM (β=0.069, p<0.001). Regression models 2–4 show that including interaction terms does not alter much the coefficients of the main effects. The over six-fold difference in effect between strong- and weak-tie WOM supports hypothesis H1, which predicts that strong ties will play a bigger role than weak ties in the spread of WOM.
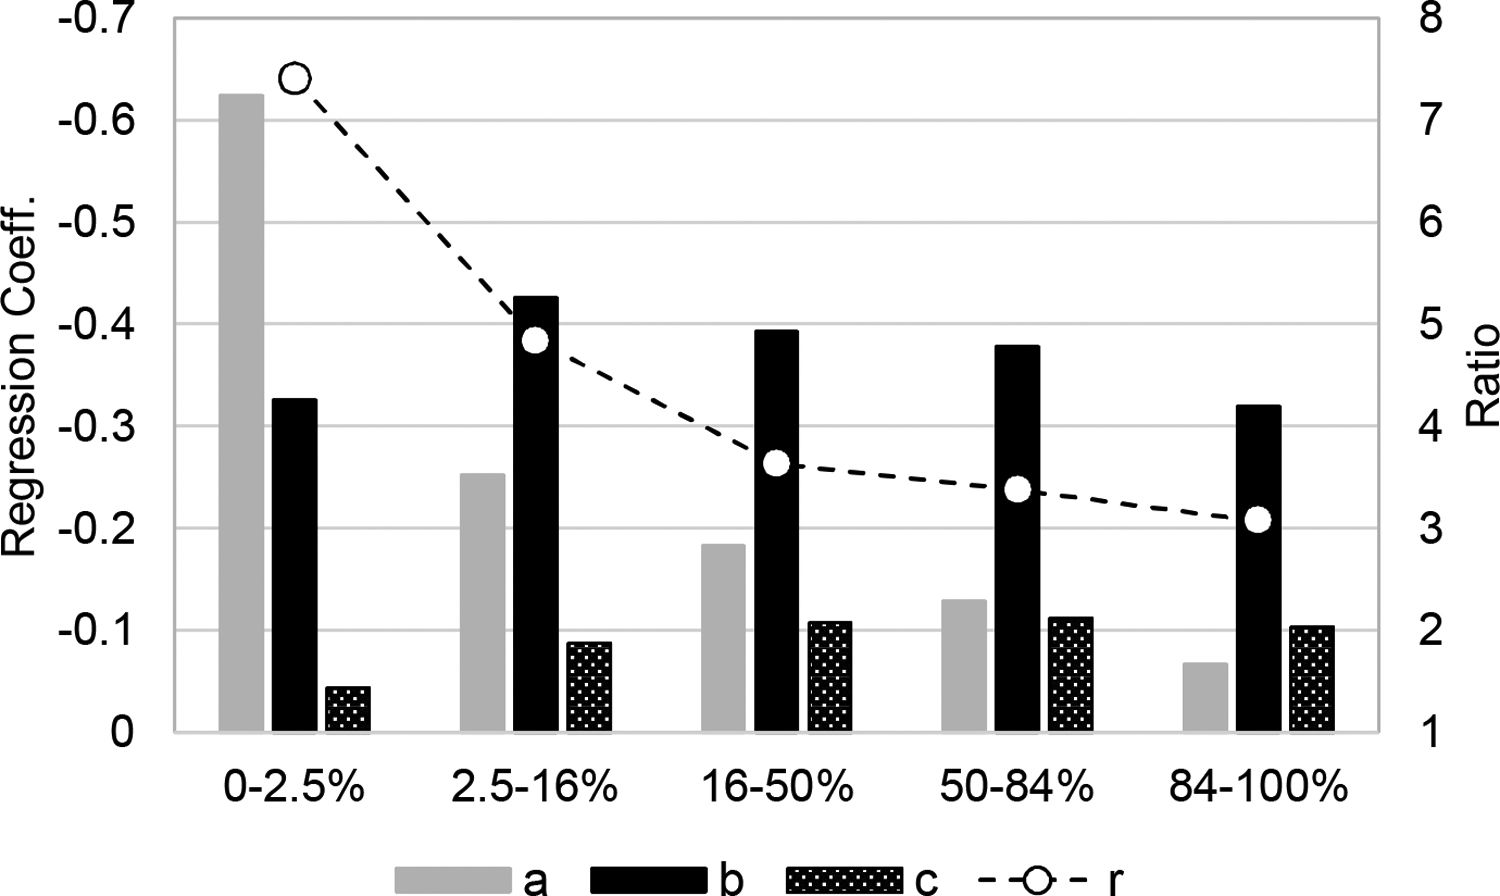
Note that the NPV with a 10% discount rate assumes that the profit from any additional adoption after 30 time periods have elapsed is negligible (Libai et al., 2013). Here, we explore the product growth processes in more detail in order to ensure that the superiority of strong ties (and advertising) over weak ties does not depend on the chosen discount rate. Following Rogers (1995), we divide a process into five stages: 0–2.5%, 2.5–16%, 16–50%, 50–84%, and 84–100% of the market being reached. We then compute the number of elapsed time periods for each stage, variable T, which oppositely measures the speed of the product growth; the smaller the T, the faster the speed of growth. Finally, OLS regression is conducted in each stage, with T as the dependent variable and the five study factors as covariates. Fig. 3 reports the coefficients of the factors of interest here.
")
Regression analyses in different stages. (For each regression, all coefficients are standardized with p<0.001 and the adjusted R2 is above 0.6. Variable r specifies the ratio of the coefficient of b divided by that of c, applied to the right y-axis. Note that the left y-axis is in reverse order.)
The following results are apparent from Fig. 3. In the initial stage (0–2.5%), advertising is the primary driver of product growth, as it is responsible for nurturing innovators (Rogers, 1995). Starting with the second stage (2.5–16%), the effect of advertising shows a continued, rapid decline, and strong-tie WOM becomes the primary driver. During the entire process, the effect of weak-tie WOM continues to increase, but it is always far lower than that of strong-tie WOM and it is only in the final stage that weak ties can have a greater effect than advertising. These results suggest that varying the discount rate would not fundamentally change the main findings presented in Table 2.
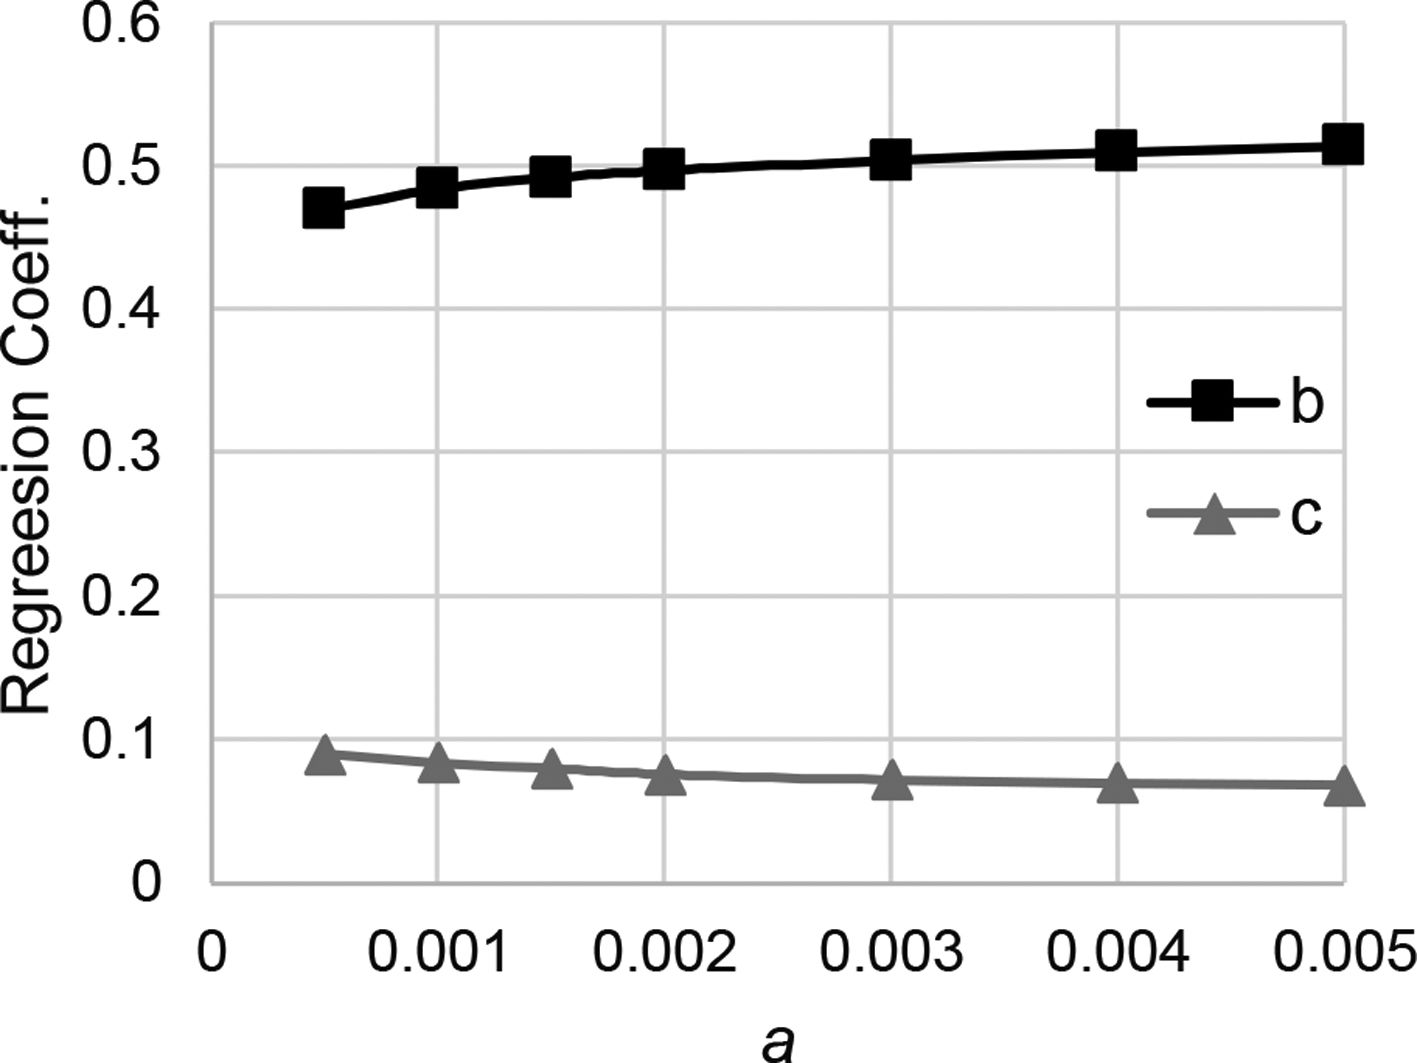
Analysis of moderating effectsHypothesis H2 predicts that advertising enhances the superiority of strong ties over weak ties. As shown in Table 2, the positive coefficient of the interaction term b×a (β=0.121, p<0.001) and the negative coefficient of the interaction term c×a (β=−0.018, p<0.01) support this hypothesis. To illustrate the moderating effect of advertising more clearly, we perform OLS regression for each advertising parameter value, with the other four parameters as independent variables and NPV as the dependent variable. Fig. 4 depicts the relevant results, which clearly show that strong ties always enjoy superiority and that advertising has a substitutive effect on weak ties and an amplifier effect on strong ties.

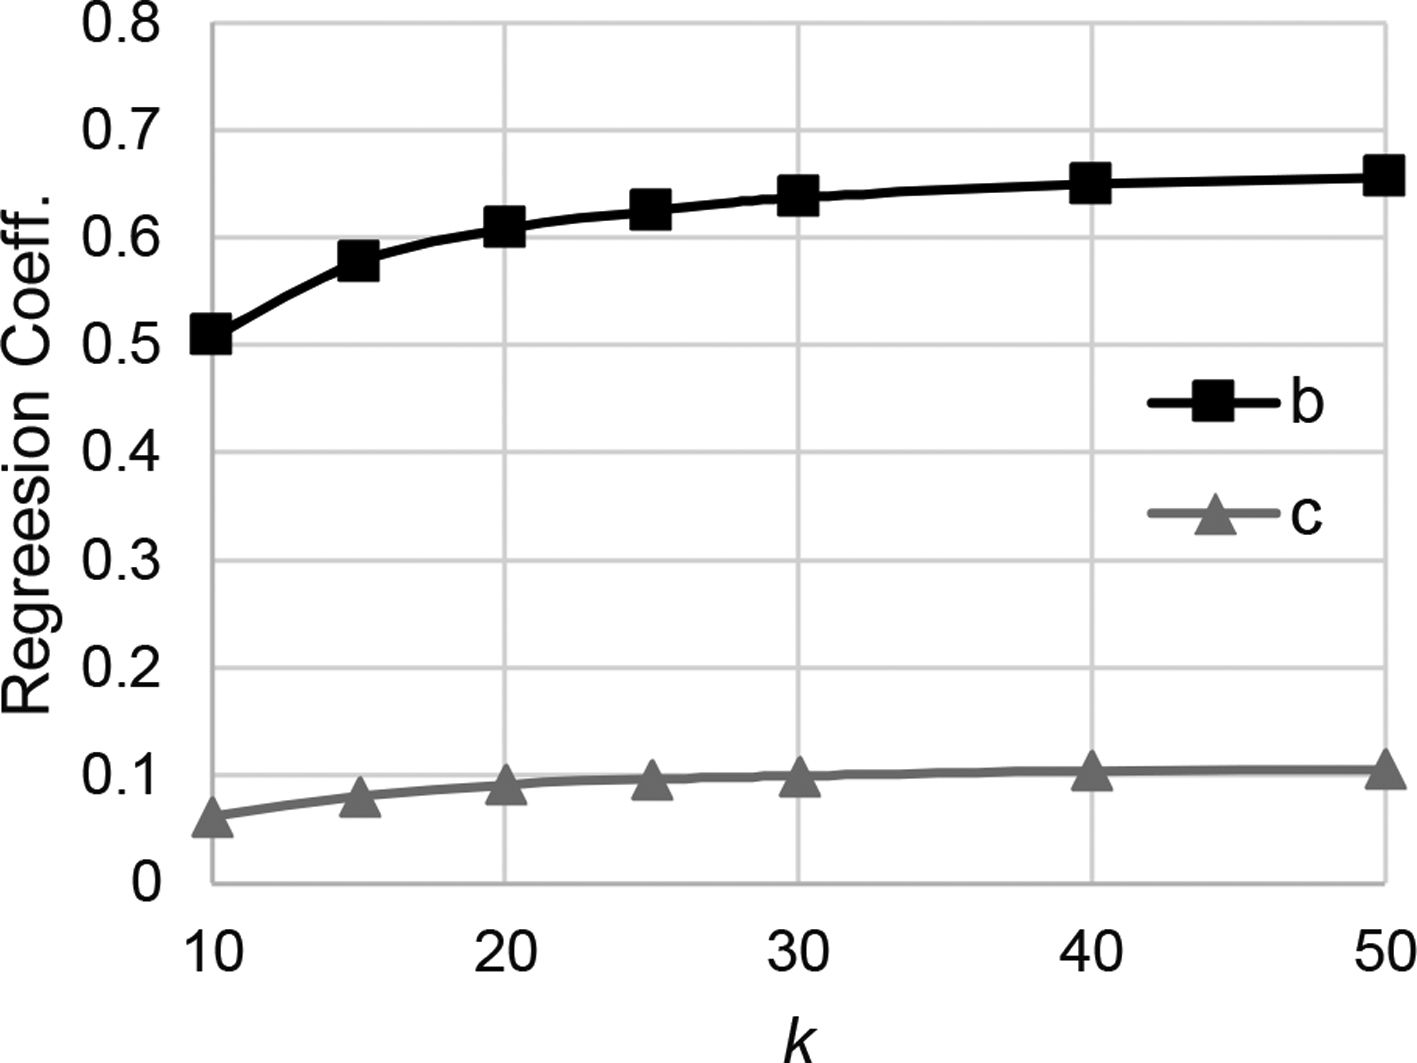
Hypothesis H3 proposes that average connectivity positively affects the superiority of strong ties over weak ties. The high magnitude of the coefficient of the interaction term b×k (β=0.266, p<0.001) and the small value of the coefficient of the interaction term c×k (β=0.083, p<0.001) support this hypothesis. The coefficients of strong- and weak-tie WOM at each value of average connectivity are presented in Fig. 5, in which one can observe in detail how the effect gap between strong- and weak-tie WOM enlarges, albeit marginally, with average connectivity.

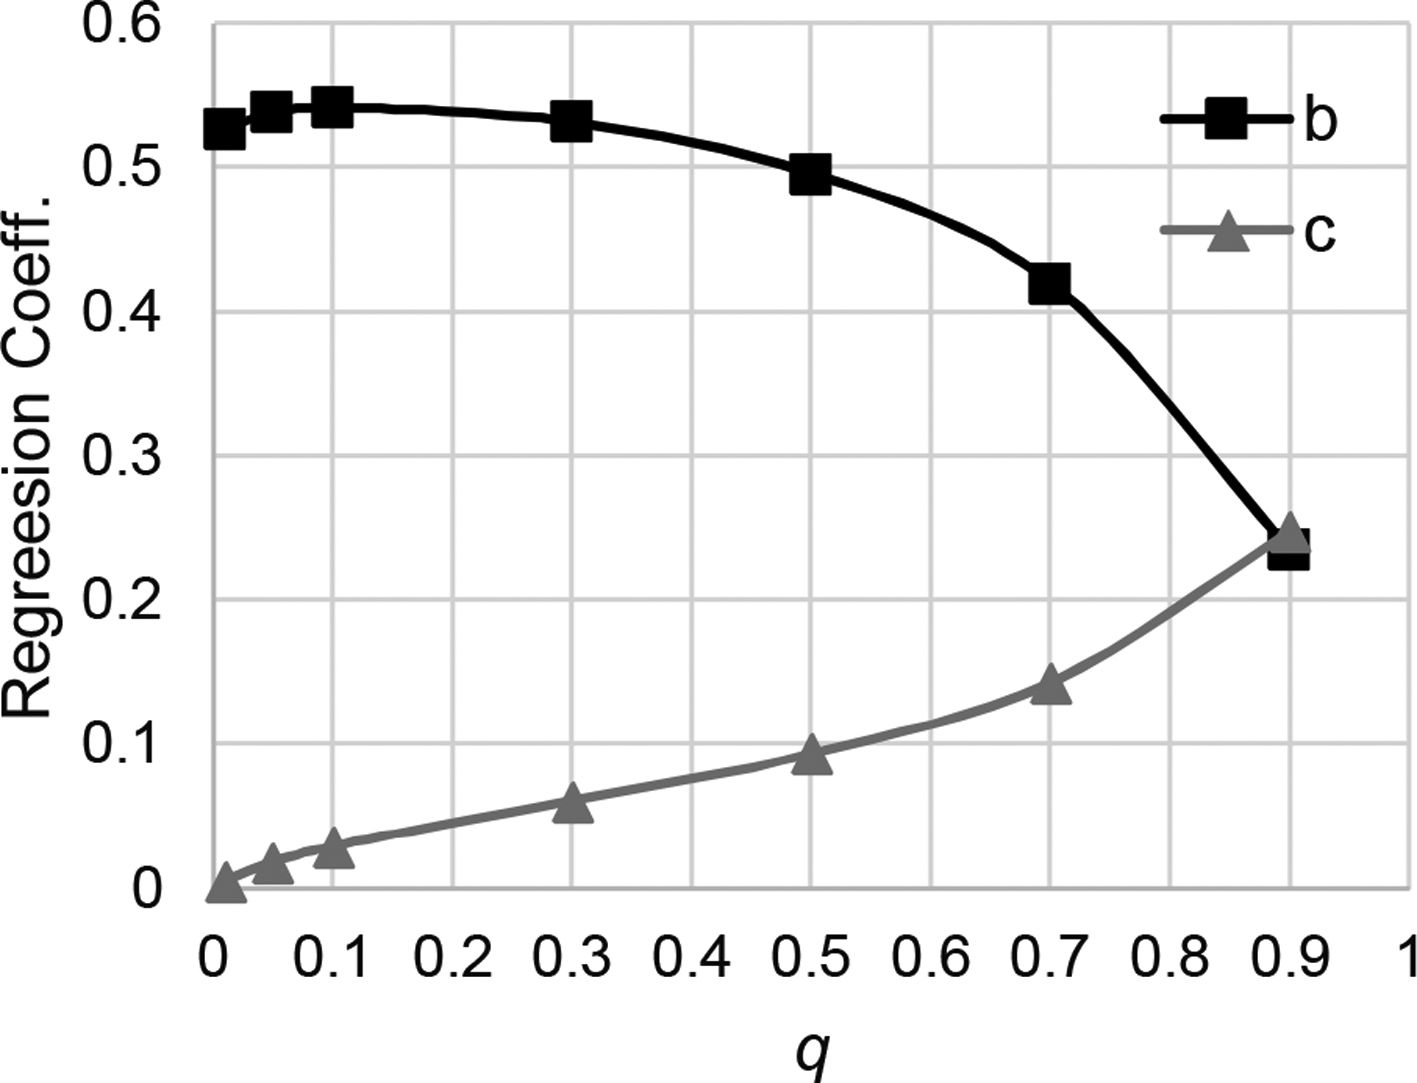
Hypothesis H4 proposes that the superiority of strong ties weakens with the proportion of weak ties but only disappears if the proportion becomes considerably large. The results shown in Table 2 support the first part of this hypothesis. The negative value of the coefficient of the interaction term b×q (β=−0.335, p<0.001) and the positive value of the coefficient of the interaction term c×q (β=0.230, p<0.001) suggest that the proportion of weak ties negatively affects the superiority of strong ties. The results shown in Fig. 6 support the second part of H4: the effect of weak-tie WOM exceeds that of strong-tie WOM only once the proportion of weak ties reaches 0.9.

Notably, Fig. 5 shows that the relationship between the proportion of weak ties and the effect of strong-tie WOM is not monotonously negative. When weak ties are unduly scarce in the network, a proper increase in weak ties reinforces the effect of strong ties. Beyond that, any continued increase would be counterproductive. This is the oft-mentioned trade-off between the effectiveness of activating WOM and the ease of spreading WOM.
DiscussionTheoretical implicationsIn this paper, we use an agent-based modeling approach to demonstrate that the impact of strong ties on the market-level spread of WOM can be significantly greater than that of weak ties, which challenges the widely accepted weak-tie hypothesis in the WOM literature. The causes for this finding are manifold; the most important reason is the presence of advertising. In previous research, the importance of weak ties has been associated with the fact that they are likely to be long bridges that allow information to spread globally. In practice, however, firms constantly expend efforts to raise the market awareness of their products through advertising or other public tools. This, of course, substantially offsets the importance of weak ties and instead increases the importance of strong ties in activating WOM. As Fig. 4 shows, the higher the level of advertising is, the more obvious the offset and increase are. Therefore, marketing researchers must take the effect of non-personal marketing efforts into consideration when studying the marketing functions and effectiveness of strong and weak ties.
Some real-world cases provide evidence, if somewhat indirect evidence, for our key finding. For example, a study focused on an extensive commercial rumor in Hong Kong in 1997 (Lai and Wong, 2002) shows that while mass media, particularly television, served as a channel of information flow, communications between strong ties (not weak ties) took the main responsibility for the rapid growth of the rumor. Another case is Google's viral Gmail campaign. At the beginning of its launch period, Gmail and its large inbox storage space (500 times larger than that Hotmail was offering) made headlines in newspaper and Internet reports. This led to great enthusiasm in the market. However, Gmail was launched in a limited, invite-only release. Each existing user only had a small number of invitations and had to provide Google with the private information of their invitees. In this case, invitations were mostly distributed between friends and family. The end of the story is well known: Gmail has become an international phenomenon that has connected millions, if not billions, of people. Although we cannot say that weak ties had no effect in this case, the predominant effect of strong ties is obvious.
In addition, we develop and test two research hypotheses focused on selective factors of consumer networks in order to affirm that the superiority of strong ties is not contingent upon market conditions. The results in Fig. 5 show that the superiority of strong ties increases with the average connectivity of consumers, with the implication that strong ties are particularly valuable in the online world. Previous studies often attribute the rapid and large cascades found in online WOM to the expansion of people's weak-tie networks (López and Sicilia, 2013), but our results suggest the opposite. Even if encounters between strangers are more common in the online world (Chatterjee, 2001), strong ties are still the primary driver of the spread of WOM, as the results in Fig. 6 show. Although those results also show that the superiority of strong ties disappears when strong ties are extremely scarce in consumer networks, the actual effect of that is minor at most, because people, in both online and offline contexts, have a pronounced tendency to bond and communicate with people who are like them (Ellison et al., 2007; McPherson et al., 2001).
Managerial implicationsThe main managerial implication of this study is straightforward: to harness the considerable benefit of WOM, marketers should give consumers unique information and encourage them to talk with strong-tie members, such as friends and family. For example, when designing a reward referral program, marketers need to distinguish the rewards for strong-tie and weak-tie referrals and make the former more attractive. According to our results, such a strong-tie-centered strategy can be more effective in online WOM campaigns, as online individuals have a larger personal network than is typically found offline. Given that the creation patterns of strong and weak ties vary widely across online platforms (Phua et al., 2017), this strategy can be optimized by identifying the correct online platform for a given effort. Furthermore, our results suggest that applying this strategy to Asian markets may be more effective than in Western markets, because many Asian cultures (e.g., Chinese and Koreans) tend to have more strong ties and Western cultures (e.g., Americans and Europeans) tend to have more weak ties (Cardon et al., 2009; Choi et al., 2011; Chu and Choi, 2011).
Limitations and future researchThis study is subject to some limitations and can be extended in several ways. In our model, consumers are assumed to spread only positive WOM. Negative WOM is inevitable in a market, and it can travel faster than positive WOM (Goldenberg et al., 2007). Moreover, there is the interesting fact that consumers tend to share negative WOM with strong ties, but positive WOM with weak ties (Dubois et al., 2016). It would be useful to explore how the relative impact of strong and weak ties may alter if these assumptions are changed. We also assume that all consumers react equally and time-independently to advertising and WOM. Future research should investigate how these reactions differ across consumer groups (e.g., early adopters, laggards, or opinion leaders) and how these reactions evolve in the product growth process. As acknowledged in the Validation of the model section, the lack of real data as the input of the model is a great limitation of this study. Using real data would substantially improve the quality of the model and thus the reliability of the results (Rand and Rust, 2011). Taking this one step further, it would be meaningful to test our hypotheses in a laboratory study and, if possible, an empirical field study.
FundingThis work was supported by the National Natural Science Foundation of China [grant numbers 71502070]; the Fundamental Research Funds for the Central Universities [grant numbers 2662015PY178, 2662015QC051]; the Project of Nanjing University of Posts and Telecommunications [grant number NYS213005, NY214113, NY215095]; and the Project of the Key Research Base for Philosophy and Social Sciences in Shaanxi (grant number 18JZ037).
Conflict of interestNone declared.
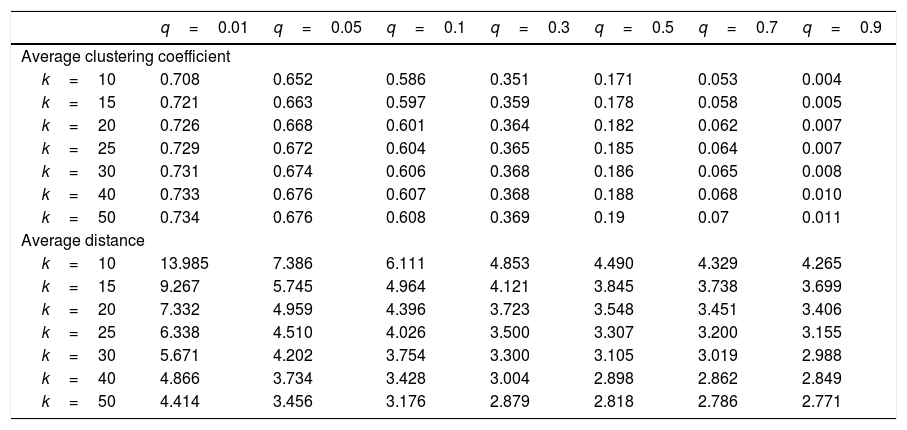
Table A1 shows the average clustering coefficient and average distance for networks used in this research. The average distance is defined as the average number of ties in the shortest path between all individual pairs. The average clustering coefficient measures the degree to which closed triads exist in the network, which is defined as follows. Suppose that consumer i has mi peers. Then, peers have at most mi(mi−1)/2 ties between them. Let Ci denote the fraction of actual ties. The average clustering coefficient is the mean of Ci of all consumers.
Average clustering coefficient and average distance.
| q=0.01 | q=0.05 | q=0.1 | q=0.3 | q=0.5 | q=0.7 | q=0.9 | |
|---|---|---|---|---|---|---|---|
| Average clustering coefficient | |||||||
| k=10 | 0.708 | 0.652 | 0.586 | 0.351 | 0.171 | 0.053 | 0.004 |
| k=15 | 0.721 | 0.663 | 0.597 | 0.359 | 0.178 | 0.058 | 0.005 |
| k=20 | 0.726 | 0.668 | 0.601 | 0.364 | 0.182 | 0.062 | 0.007 |
| k=25 | 0.729 | 0.672 | 0.604 | 0.365 | 0.185 | 0.064 | 0.007 |
| k=30 | 0.731 | 0.674 | 0.606 | 0.368 | 0.186 | 0.065 | 0.008 |
| k=40 | 0.733 | 0.676 | 0.607 | 0.368 | 0.188 | 0.068 | 0.010 |
| k=50 | 0.734 | 0.676 | 0.608 | 0.369 | 0.19 | 0.07 | 0.011 |
| Average distance | |||||||
| k=10 | 13.985 | 7.386 | 6.111 | 4.853 | 4.490 | 4.329 | 4.265 |
| k=15 | 9.267 | 5.745 | 4.964 | 4.121 | 3.845 | 3.738 | 3.699 |
| k=20 | 7.332 | 4.959 | 4.396 | 3.723 | 3.548 | 3.451 | 3.406 |
| k=25 | 6.338 | 4.510 | 4.026 | 3.500 | 3.307 | 3.200 | 3.155 |
| k=30 | 5.671 | 4.202 | 3.754 | 3.300 | 3.105 | 3.019 | 2.988 |
| k=40 | 4.866 | 3.734 | 3.428 | 3.004 | 2.898 | 2.862 | 2.849 |
| k=50 | 4.414 | 3.456 | 3.176 | 2.879 | 2.818 | 2.786 | 2.771 |
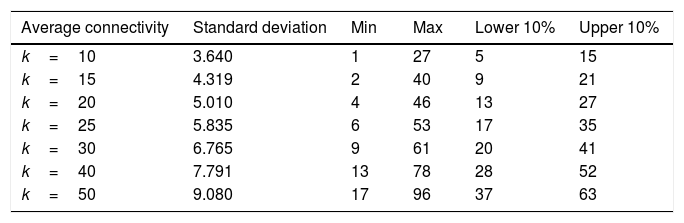
Table A2 presents the connectivity distribution of the networks. As the proportion of weak ties hardly change the distribution of connectivity (Hu et al., 2015b), we only report the statistics at q=0.9.
Table B1 shows the robustness checks of the results reported in Table 2. Specifically, we delete these records with q=0.7 and 0.9 that are unrealistic and run OLS regressions. The results show that our main conclusions are robust.
Robustness check.
| Regression model 1 | Regression model 2 | Regression model 3 | Regression model 4 | |
|---|---|---|---|---|
| k | 0.678*** (0.002) | 0.678*** (0.002) | 0.489*** (0.011) | 0.678*** (0.002) |
| q | −0.095*** (0.002) | −0.095*** (0.002) | −0.095*** (0.002) | −0.145*** (0.012) |
| a | 0.425*** (0.002) | 0.349*** (0.012) | 0.425*** (0.002) | 0.425*** (0.002) |
| b | 0.524*** (0.002) | 0.446*** (0.005) | 0.357*** (0.005) | 0.561*** (0.004) |
| c | 0.041*** (0.002) | 0.049*** (0.005) | 0.027*** (0.005) | 0.011** (0.004) |
| b×a | 0.135*** (0.007) | |||
| c×a | −0.025* (0.011) | |||
| b×k | 0.247*** (0.007) | |||
| c×k | 0.031** (0.011) | |||
| b×q | −0.084*** (0.006) | |||
| c×q | 0.126*** (0.011) | |||
| Adjusted R2 | 0.926 | 0.929 | 0.933 | 0.928 |
Note: All variables are zero-centered and standardized. Standard errors are presented in bracket below the coefficient estimates.