


This paper analyses the influence of bank ownership and lending on capital structure for a sample of listed and unlisted Spanish firms in the period 2005–2012. The results suggest that bank ownership allows banks to obtain better information and reduce the agency costs of debt, as it has a positive relationship with the maturity of debt and a negative relationship with the cost of debt. These results are consistent with the predominance of the monitoring effect in bank ownership over the expropriation effect. The role of banks as shareholders and lenders also contributes to reduce agency cost of debt, as it reduces debt cost.
The role of banks in the governance of non-financial firms has been one of the most interesting and controversial issues analyzed in the literature of corporate governance. It is commonplace in some countries for banks to act as a large shareholder in the firm. La Porta et al. (1999) show that most listed firms around the world have dominant shareholders in contrast to the image of dispersed ownership of the modern corporation. Although the average percentage of firms controlled by financial institutions is around 8% for the entire sample considered by La Porta et al. (1999), financial institutions control 35% of firms in Belgium, 30% in Sweden, 25% in Finland and Germany, 20% in Portugal, 15% in Spain and 10% in Argentina and Norway.
Banks may potentially influence corporate governance in several ways (Azofra-Palenzuela et al., 2008). First, banks may exert the control rights of their ownership stakes participation in firm shares and may even hold a seat at the board of directors. Second, the dual role of banks as lenders and shareholders allows to reduce the conflicts of interest (underinvestment and substitution of assets problems) between both groups. Prowse (1990) show evidence consistent with the notion that the agency problems between shareholders and lenders are mitigated to a greater degree in Japan, where financial institutions take large equity positions in firms to which they lend, than in the U.S. Finally, the presence of banks as shareholders discloses positive information about the firm quality. Diamond (1984, 1991) and Rajan (1992) argue that bank lenders are comparatively superior monitors to public bondholders. Arikawa and Miyajima (2005) find evidence indicating that bank monitoring by closely related banks facilitate access to debt financing for firms with poor growth prospects and small firms facing strong problems of information asymmetry. Additionally, banks may enjoy access to better information on borrowers due to their role as shareholders. Equity stakes usually provide the opportunity to have a seat at the board of directors, allowing better managerial control through improved access to information about the actions of executives and limiting, for example, the problem of asset substitution. It becomes easier to assess the quality of management when taking an equity stake in the firm. From this point of view, banks owning equity signal to the market their assessment about firm quality, which makes it easier for firms to attract equity and debt.
Our paper analyzes the benefits and costs of bank ownership, studying the effect of bank ownership on corporate capital structure. We analyze the influence of bank ownership not only on the amount of debt, but also on the maturity and cost of debt for a sample of Spanish listed and unlisted firms for the period 2005–2012. Spain is a natural setting for examining these issues especially for two reasons. First, Spain is a country with a bank-oriented financial system, where despite of the development of the financial markets, banks are central in the financing of firms. The size of the financial intermediaries in Spain, measured either as the liquid liabilities or the total assets, is similar to other European countries, meanwhile the weight of bank intermediaries compared to non-bank intermediaries is much higher in Spain than in other European countries,1 suggesting the important role of banks in the financing of the private sector. Second, Spain features relatively weak protection of minority shareholders, high ownership concentration and a significant level of bank ownership. Consequently, Spain is a country where close bank-firm relationships potentially allow banks to play an important role in corporate governance structure. Unlike the US, where the financial and monitoring functions of the markets are dominant, Spanish banks act as the main source of debt financing and also play a major role as significant shareholders. These characteristics are common to many countries (La Porta et al., 1999) and hence the obtained results may be extrapolated.
We contribute to the literature in several ways. First, to the best of our knowledge, this is the first paper that jointly analyzes the effect of bank ownership on the amount, maturity and cost of debt. The role of banks as shareholders has often been at the center of the debate on the design of the appropriate financial system. The current financial crisis is no exception. Papers that have studied the role of banks as shareholders have not considered its effect on capital structure, but rather have focused on its influence on corporate performance.
Second, our paper analyzes the effect of bank ownership on capital structure for a sample of listed and unlisted firms. Several papers have studied the effect of ownership structure on the capital structure of firms. Within an international context, Lin et al. (2011) find that the cost of debt financing is significantly higher for companies with a wider divergence between the largest ultimate owner's control rights and cash flow rights. For Spain, Ochoa (1998), Cuervo-Cazurra (1999), García-Teruel and Martínez-Solano (2010) and Sánchez-Ballesta and García-Meca (2011) have analyzed the relationship between ownership concentration and debt maturity and the cost of debt for samples of listed Spanish firms. These papers do not always consider the special role of bank ownership; moreover, they only focus on listed firms.2Petersen and Rajan (1994) and Berger and Udell (1995) examine the role of relationship lending in small firm finance, taking into account the idea that the effect of relationship banking could be greater for these firms, as the information asymmetries between small firms and potential public investors may be large. Large firms have better access to domestic and international markets and are therefore usually less dependent on bank credit. However, unlisted firms are smaller and they will depend on bank credit to a higher extent, being especially relevant to know the role played by banks as creditors and shareholders. By considering listed and unlisted firms, we may obtain evidence of whether the role played by banks as shareholders differs between these two types of companies.
Third, our paper distinguishes whether the bank that holds a stake in firm ownership is also a lender of the firm or not. By doing so, we are able to obtain evidence related to the role of banks as shareholders depending on the existence of a lending relationship. Gao (2008) has examined the effects of the equity stakes and debt claims of banks on firm performance in Japan. Andrés et al. (2010) has analyzed the effect of the dual role of banks as shareholders and lenders on the Spanish firms’ value.
Finally, bearing in mind that we consider a period of financial crisis, we also provide evidence on the influence of the financial crisis on the relationship between bank ownership and capital structure. Evidence for US firms has revealed that lending has decreased because of the crisis, while borrowing costs have increased (Ivashina and Scharfstein, 2010; Santos, 2011). Similarly, Crespí and Martín-Oliver (2015) provide evidence indicating that Spanish private firms suffer a reduction in their leverage ratios due to credit restrictions during the global financial crisis. We analyze whether the effect of bank ownership on debt amount, debt maturity and debt cost has differed when considering the periods before and during the financial crisis.
The remainder of the study is organized as follows: Section ``Previous literature and hypotheses’’ presents a review of the relevant literature regarding the relationship between bank ownership and capital structure and the hypotheses tested. Section ``Data and methodology’’ describes the data and methodology employed, while Section ``Results’’ presents and discusses the results; and, finally, Section ``Conclusion’’ summarizes and presents the conclusions of the study.
Previous literature and hypothesesLarge shareholders and ownership concentration constitute a response to the lack of shareholders’ legal protection. If legal protection does not provide sufficient control rights to small investors, then investors can probably obtain more effective control rights by being large (Shleifer and Vishny, 1997; La Porta et al., 1998). Large shareholders have incentives to collect information and monitor management and thus address the agency problem as they have both a general interest in value maximization and sufficient control over the assets of the firm to make their interests respected (the “monitoring effect”). However, when ownership is concentrated the nature of the agency problem shifts from manager-shareholder conflicts to conflicts between the major shareholder/s and minority shareholders (Jensen and Meckling, 1976). Large shareholders may represent their own interests, using their control rights to enforce decisions that afford them private benefits of control at the expense of minority shareholders (the “expropriation effect”). Minority shareholders face the uncertainty of not knowing whether the controlling owner may opportunistically deprive them of their rights.
The evidence regarding the role of large shareholders in exercising corporate governance is conflicting. Among others, Kaplan and Minton (1994) and Gorton and Schmid (2000) have upheld the view that large shareholders play an active role in corporate governance. However, Morck et al. (1988) and Weinstein and Yafeh (1998) present evidence that large shareholders obtain benefits from their control over firms. Similarly, Wang (2014) show that large shareholders become entrenched and expropriate small shareholders when there is an excess of their control rights over their cash flow rights.
The financial literature has analyzed the benefits and costs of bank ownership, studying its influence on firm performance, providing mixed results. On the one hand, some papers have shown a negative effect, implying an expropriation effect on the part of banks in those firms in which they are shareholders (Morck et al., 2000). On the other hand, other papers have revealed a positive effect resulting from the monitoring of firms by banks (Cable, 1985; Gorton and Schmid, 2000). Pucheta-Martínez and García-Meca (2014) obtain evidence for the Spanish market of such monitoring activities and report that the presence of savings banks on the board improves financial reporting quality. Boehmer (2000) and Tribó and Casasola (2010) find that the effect of the bank's shareholdings on firm performance depends on the bank being the largest shareholder or its ability to form coalitions with other shareholders.
Within this context we analyze whether bank ownership affects the amount, maturity and the cost of debt. If banks play an active role as shareholders reducing the agency costs of debt, we will expect that bank ownership facilitates the access to debt and improves the debt conditions. Consequently, the presence of banks as shareholders will have a positive relationship with the amount of debt and debt maturity and a negative relationship with the cost of debt. However, the expected relationships will be the opposite if the expropriation effect for bank shareholders is predominant.
The existence of opposing arguments for the role of bank ownership and mixed empirical evidence means that bank ownership may have different effects on capital structure depending on the prevalence of monitoring or expropriation effect. Having two opposing effects, our expectations remain open and we pose two hypotheses:H1a Banks stock ownership has a positive influence on debt and debt maturity and a negative effect on debt cost if the monitoring effect is prevalent. Banks stock ownership has a negative influence on debt and debt maturity and a positive effect on debt cost if the expropriation effect is prevalent.
Bank shareholders may also assume the role of lender of firms. When the banks play the dual role of shareholders and lenders the previous arguments for the effect of bank ownership on the amount of debt and on its cost and maturity will result affected. On the one hand, this dual role of banks may imply better access and conditions in financing for at least three reasons. First, banks may enjoy access to better information on borrowers due to their role as shareholders and use this information in their lending decisions. The presence of banks on the firm's board allows better managerial control limiting the problems of asset substitution and underinvestment and in general will contribute to mitigate the asymmetric information problems allowing firms to raise funds more easily (Dennis et al., 2000).
Second, the simultaneous ownership of both equity and debt claims by banks may lead to divergent goals in the management of the firm as a result of the different payoff structures associated with debt and equity (Jensen and Meckling, 1976; Dewatripont and Tirole, 1994). Shareholders prefer to assume higher risk than lenders, whereas lenders prefer firms to maximize the probability of repayment. In this context, banks may prioritize their role as lenders, influencing management to undertake projects with less risk or to issue equity to reduce debt. The capability of bank shareholders to block loan concessions or renewals provides them with leverage to make managers align their interests with those of lenders.
Third, the dual role of banks as both shareholders and lenders may additionally lead to a negative information effect about the quality of the firm's assets if the shareholder bank decides not to lend funds to the firm. This decision of not lending to the firm by the insider, i.e. the shareholder bank, is a negative signal for other lenders and leads to worse conditions (higher debt cost and lower maturity) in loans lent by other banks or bondholders.
These three arguments justify the dual role of banks as shareholders and lenders having a positive effect on the amount of debt and debt maturity and a negative effect on debt cost.
As for the negative effects of the dual role of banks as both shareholders and lenders on the access to financing and the debt conditions, the ability to obtain private benefits increases when the large shareholder is a bank which is also a lender to the firm. For example, diverting cash flows away from the firms’ shareholders via the cost of financing and other terms of bank loans. Similarly, Sharpe (1990) and Rajan (1992) suggest that the firm-specific information acquired by the bank may create a hold up problem, where informational rents may be extracted by banks ex post. The argument rests on the idea that lenders subsidize borrowers in early periods and expect to obtain benefits from this subsidy in the future. The hold up problem is more serious when the bank is not only a lender but also a shareholder.
As we have opposing arguments for the effect of the dual role of banks as shareholders and lenders on the amount, the cost and the maturity of debt, our expectations remain open and we pose two hypotheses:H2a The dual role of banks as both shareholders and lenders has a positive influence on debt amount and maturity and a negative effect on debt cost if the bank acts as a monitor of the borrowers, prioritizes its role as a lender or there is a positive information effect. The dual role of bank as both shareholders and lenders has a negative influence on debt amount and maturity and a positive effect on debt cost if the bank obtains private benefits from the borrowers.
The degree to which bank ownership affects firm capital structure and the maturity and cost of debt is analyzed for a sample of listed and unlisted non-financial Spanish firms over the period 2005–2012. The Spanish banking system is formed by commercial banks, credit cooperatives and saving banks. Although in the last years saving banks have gone through a process of concentration and conversion into ordinary commercial banks, our period of study (2005–2012) is characterized by a significant presence of saving banks, and therefore the three categories of banking institutions have been included in our analysis. Ownership and financial data were collected from SABI (Bureau Van Dijk), which is a database containing financial information on more of 1.4 million Spanish and Portuguese firms. We exclude: (1) financial firms, because their financing decision follows other determinants; (2) firms lacking ownership structure data; and (3) firms for which the data required in our analyses were unavailable (except for cost of debt). Finally, the number of firms included in the sample was 3,044 and the sample consisted of 14,675 firm-year observations.
Empirical modelThe objective of the paper is to analyze the influence of bank ownership on capital structure, considering whether the bank is also a creditor or not. To do so, we control for the determinants of leverage, debt maturity and debt cost that have been considered in the literature to explain these variables. The values of these control variables have been taken at the beginning of the period. The following regression equations are estimated to empirically test our hypotheses related to three alternative outcomes: amount of debt (DEBT), maturity of debt (DEBTMAT) and cost of debt (DEBTCOST):


In addition to firm-level variables, we also include different proxies of bank ownership (BO) in each regression equation, as well as considering a dummy variable (D_SL) that takes into account whether the shareholder bank is also a lender of the firm. ∑t=20052012Yt is a set of dummy time variables for each year capturing any unobserved macro level effects not included in the regression. We also include SIC industry dummy variables (∑j=1nIj) to capture any industry effects not included in the explanatory variables. εit is the error term. Standard errors are clustered at the firm level. Petersen (2009) shows that, in the presence of a firm effect, the standard errors clustered by firm are unbiased and produce correctly sized confidence intervals regardless of whether the firm effect is permanent or temporary. The presence of the firm effect is a common characteristic when considering leverage.
VariablesAppendix A describes how we define the variables used in the empirical analysis. Most of the variables are self-explanatory and have been used in other studies on capital structure. We therefore only describe the proxies for our main variables in detail, namely the dependent variables and bank ownership and lending variables.
We have considered two proxies for leverage. Following Welch (2011), the first dependent variable is the ratio between the sum of long- and short-term debt and the book value of assets and comprises a measure of the total debt of the firm (DEBT). The second proxy for leverage (DEBTFIN), defined as the ratio of financial long- and short-term debt scaled by the book value of assets is a proxy for the financial debt of firms. This second proxy for leverage is included because we are interested in ascertaining the effect of bank ownership on the part of the debt directly linked to the bank's lending decisions. Following Rajan and Zingales (1995) and Flannery and Rangan (2006), we consider the following variables as determinants of leverage: profitability (PROFIT), growth opportunities (GROWTH), asset tangibility (PPE), size (SIZE), and non-debt tax shields (NDTS).
The second dependent variable is debt maturity and, as with leverage, we consider two proxies. The first measure is defined as the percentage of the firm's total debt that has a maturity of more than one year3 (DEBTMAT), while the second proxy, DEBTMAT_FIN, measures the percentage of financial debt that has a maturity of more than one year. We control for the effect of firm features such as asset maturity (ASSET_MAT), growth opportunities (GROWTH), size (SIZE), firm quality (FIRM_QUALITY), volatility of earnings (VOL_EBIT), and leverage (DEBT) identified in the literature as relevant determinants of debt maturity (Myers, 1977; Barnea et al., 1980; Flannery, 1986; Barclay and Smith, 1995; Stohs and Mauer, 1996; Guedes and Opler, 1996; Ozkan, 2000; Scherr and Hulburt, 2001).
Finally, our third dependent variable, the cost of debt (DEBTCOST), is defined as the interest expense for the year divided by the average interest-bearing debt. The average interest-bearing debt has been calculated as the mean value of this variable at the beginning and at the end of the fiscal year. Following previous studies such as Petersen and Rajan (1994), Pittman and Fortin (2004), and Sánchez-Ballesta and García-Meca (2011), we have considered the following variables as determinants of debt cost: the prime rate (PRIME), the default spread (DEFAULT), financial leverage (DEBTFIN), profitability (PROFIT), size (SIZE), asset tangibility (PPE), current ratio (LIQUIDITY), interest coverage (INT_COV), financial distress (DNEG_EQUITY), sales growth (GROWTH), and age (AGE).
As for the set of variables of interest, we use several measures of bank ownership that are alternatively considered in the regressions as proxies of BO: (1) OWN_BANKS is the percentage of the firm's equity held by banks; (2) OWN_BANK is the percentage of the firm's equity held by the largest bank shareholder; (3) DBANK_MAIN is a dummy variable that takes the value of one if a bank is the largest shareholder of the firm and zero otherwise; (4) DBANKS_5 is a dummy variable that takes the value of one if the percentage of the firm's equity held by banks is higher than 5% and zero otherwise; and (5) DBANKS_20 is a dummy variable that takes the value of one if the percentage of the firm's equity held by banks is higher than 20% and zero otherwise. We consider a dummy variable (D_SL) that takes the value of one if the shareholder bank is also a lender of the firm and zero otherwise.4 We also include the ownership stake of the largest shareholder (LARGE1) to control for the ownership structure of the firm and a dummy variable that takes the value of 1 if the shareholder bank has any representative serving on the board of directors and 0 otherwise (BOARD) to control for the effect of the presence of the bank in the board of directors.
One concern about the influence of bank ownership on firm's capital structure is the issue of endogeneity. We try to address this issue estimating instrumental variables regressions.5 Following, Laeven and Levine (2009) and Lin et al. (2011, 2013) we instrument for each bank's ownership proxy using the initial industry average bank's ownership, which captures industry factors explaining bank equity stakes. Subsequently, we perform a Durbin–Wu–Hausman (DWH) test of overidentifying restrictions for each estimation. The DWH test verifies the null hypothesis that the introduction of instrumental variables has no influence on the coefficients of the estimations. The results of the DWH F test are reported in the bottom row of each table. When the p-value of the F test falls below 10 percent, the null hypothesis is rejected and the instrumental variables estimations are reported.6 Otherwise, the estimations with the observed values of bank's ownership variables are provided.
Descriptive statisticsPanel A of Table 1 provides descriptive statistics on the dependent and independent variables used in this paper. The descriptive statistics are shown for the overall sample and the subsamples of firms with bank ownership and firms in which a bank is the major shareholder. The mean values for the overall sample of DEBT, DEBTFIN, DEBTMAT, DEBTMAT_FIN and DEBTCOST are respectively 60.02%, 31.66%, 31.98%, 57.34%, and 7.38%. Firms with bank ownership or with a bank as the main shareholder have more financial debt (DEBTFIN) and maturity of debt (DEBTMAT, DEBTMAT_FIN) and a lower total-liabilities-assets ratio (DEBT) and cost of debt (DEBTCOST). The higher financial-debt-to-assets ratio and debt maturity and lower cost of debt of firms with bank ownership consistent with the reduction in the agency costs of debt associated with bank ownership.
Descriptive statistics.
| Panel A. Descriptive statistics of dependent and independent variables for the overall sample and for subsamples according bank ownership | ||||||||||||||
|---|---|---|---|---|---|---|---|---|---|---|---|---|---|---|
| Overall sample | Bank ownership > 0% | No bank ownership | Major bank shareholder | No-major bank shareholder | ||||||||||
| Number of observations | Mean (median) | Number of observations | Mean (median) | Number of observations | Mean (median) | Number of observations | Mean (median) | Number of observations | Mean (median) | |||||
| DEBT (%) | 14,675 | 60.02 (60.97) | 856 | 57.38 (57.75) | 13,819 | 60.18 (61.15) | 268 | 55.37 (54.26) | 14,407 | 60.10 (61.05) | ||||
| DEBTFIN (%) | 11,163 | 31.66 (29.31) | 733 | 33.08 (30.48) | 10,430 | 31.55 (29.26) | 207 | 36.81 (34.20) | 10,956 | 31.56 (29.25) | ||||
| DEBTMAT (%) | 14,675 | 31.98 (24.91) | 856 | 42.75 (42.69) | 13,819 | 31.31 (23.72) | 268 | 40.66 (38.32) | 14,407 | 31.82 (24.66) | ||||
| DEBTMAT_FIN (%) | 11,152 | 57.34 (62.21) | 733 | 66.87 (75.72) | 10,419 | 56.67 (61.17) | 207 | 63.00 (72.70) | 10,945 | 57.24 (62.04) | ||||
| DEBTCOST (%) | 10,217 | 7.38 (5.14) | 674 | 6.54 (5.31) | 9,543 | 7.44 (5.13) | 184 | 5.97 (4.85) | 10,033 | 7.41 (5.15) | ||||
| PROFIT (%) | 14,675 | 5.63 (5.01) | 856 | 4.79 (4.17) | 13,819 | 5.68 (5.05) | 268 | 4.50 (3.75) | 14,407 | 5.65 (5.03) | ||||
| GROWTH (%) | 14,675 | 21.46 (1.68) | 856 | 40.10 (4.40) | 13,819 | 20.30 (1.52) | 268 | 39.35 (4.44) | 14,407 | 21.13 (1.64) | ||||
| PPE (%) | 14,675 | 16.29 (10.32) | 856 | 15.08 (6.34) | 13,819 | 16.37 (10.56) | 268 | 14.69 (4.65) | 14,407 | 16.32 (10.43) | ||||
| SIZE | 14,675 | 11.02 (10.81) | 856 | 12.45 (12.18) | 13,819 | 10.94 (10.75) | 268 | 11.43 (11.21) | 14,407 | 10.02 (10.80) | ||||
| NDTS (%) | 14,675 | 2.49 (1.61) | 856 | 2.26 (1.20) | 13,819 | 2.50 (1.64) | 268 | 2.45 (1.09) | 14,407 | 2.49 (1.62) | ||||
| ASSET_MAT | 14,298 | 9.64 (5.80) | 843 | 9.62 (5.56) | 13,455 | 9.64 (5.81) | 253 | 7.66 (4.14) | 14,045 | 9.68 (5.83) | ||||
| FIRM_QUALITY | 14,675 | 0.17 (0.08) | 856 | 0.19 (0.07) | 13,819 | 0.17 (0.08) | 268 | 0.33 (0.07) | 14,407 | 0.17 (0.08) | ||||
| VOL_EBIT | 14,675 | 2.30 (0.58) | 856 | 2.75 (0.57) | 13,819 | 2.27 (0.58) | 268 | 2.88 (0.65) | 14,407 | 2.29 (0.58) | ||||
| PRIME (%) | 10,217 | 5.11 (5.13) | 674 | 5.12 (5.13) | 9,543 | 5.11 (5.13) | 184 | 5.08 (5.09) | 10,033 | 5.11 (5.13) | ||||
| DEFAULT (%) | 10,217 | 0.77 (0.97) | 674 | 0.76 (0.97) | 9,543 | 0.77 (0.97) | 184 | 0.78 (0.97) | 10,033 | 0.77 (0.97) | ||||
| DNEG_EQUITY | 10,217 | 0.03 (0.00) | 674 | 0.03 (0.00) | 9,543 | 0.03 (0.00) | 184 | 0.06 (0.00) | 10,033 | 0.03 (0.00) | ||||
| LIQUIDITY | 10,217 | 1.57 (1.20) | 674 | 1.47 (1.15) | 9,543 | 1.58 (1.20) | 184 | 1.85 (1.21) | 10,033 | 1.57 (1.20) | ||||
| INT_COV | 10,217 | 15.22 (1.84) | 674 | 11.69 (1.46) | 9,543 | 15.47 (1.86) | 184 | 25.11 (1.18) | 10,033 | 15.04 (1.85) | ||||
| AGE | 10,217 | 29.14 (25.00) | 674 | 37.93 (29.00) | 9,543 | 28.52 (25.00) | 184 | 27.74 (24.50) | 10,033 | 29.16 (25.00) | ||||
| OWN_BANKS (%) | 14,675 | 1.33 (0.00) | 856 | 22.62 (13.06) | 13,819 | 0.00 (0.00) | 268 | 36.51 (25.00) | 14,407 | 0.66 (0.00) | ||||
| OWN_BANK (%) | 14,675 | 1.08 (0.00) | 856 | 18.53 (9.00) | 13,819 | 0.00 (0.00) | 268 | 32.41 (20.00) | 14,407 | 0.50 (0.00) | ||||
| D_SL | 14,675 | 0.03 (0.00) | 856 | 0.41 (0.00) | 13,819 | 0.00 (0.00) | 268 | 0.50 (1.00) | 14,407 | 0.02 (0.00) | ||||
| BOARD | 14,675 | 0.03 (0.00) | 856 | 0.52 (1.00) | 13,819 | 0.00 (0.00) | 268 | 0.38 (0.00) | 14,407 | 0.02 (0.00) | ||||
| LARGE1 (%) | 14,675 | 63.48 (57.50) | 856 | 41.30 (36.61) | 13,819 | 64.85 (60.08) | 268 | 40.19 (30.00) | 14,407 | 63.91 (58.93) | ||||
| Panel B. Descriptive statistics of ownership variables for listed and unlisted firms | ||||
|---|---|---|---|---|
| Listed firms | Unlisted firms | |||
| Number of observations | Mean (median) | Number of observations | Mean (median) | |
| OWN_BANKS (%) | 584 | 6.24 (3.56) | 14,091 | 1.12 (0.00) |
| OWN_BANK (%) | 584 | 3.96 (3.11) | 14,091 | 0.96 (0.00) |
| D_SL | 584 | 0.24 (0.00) | 14,091 | 0.02 (0.00) |
| BOARD | 584 | 0.34 (0.00) | 14,091 | 0.02 (0.00) |
| LARGE1 | 584 | 30.83 (24.95) | 14,091 | 64.83 (60.00) |
The table reports the descriptive statistics of variables for the overall sample and for the subsamples according to bank ownership. DEBT is the ratio between long- and short-term debt and the book value of assets; DEBTFIN is the ratio between financial long- and short-term debt and the book value of assets; DEBTMAT is the percentage of the firm's total debt that has a maturity of more than one year; DEBTMAT_FIN is the percentage of the firm's financial debt that has a maturity of more than one year; DEBTCOST is the interest expense for the year divided by the average interest-bearing debt; PROFIT is the ratio between earnings before interest and taxes plus depreciation expenses and provisions (non-cash deductions from earnings) divided by total assets; GROWTH is the growth rate of sales; PPE is the percentage of property, plant and equipment in total assets; SIZE is the natural logarithm of total assets; NDTS is the ratio of depreciation over total assets; ASSET_MAT is the ratio between property, plant and equipment and the annual depreciation; FIRM_QUALITY is the ratio of net income plus depreciation to net debt; VOL_EBIT is the absolute value of change in earnings before interest and taxes; PRIME is the average prime rate for the year; DEFAULT is the difference between the yield on 10-year corporate bonds and the yield on 10-year Spanish government bonds for the year; DNEG_EQUITY is a dummy value that takes the value of 1 if the firm's book value of common equity is negative and 0 otherwise; LIQUIDITY is the ratio between current assets and current liabilities; INT_COV is the ratio between earnings before interest and taxes and the interest expense; AGE is the number of years from the creation of the firm and each year; OWN_BANKS is the percentage of the firm's equity held by banks; OWN_BANK is the percentage of the firm's equity held by the largest shareholder bank; DBANKS_20 is a dummy variable that takes the value of 1 if the percentage of the firm's equity held by banks is higher than 20% and 0 otherwise; DBANKS_5 is a dummy variable that takes the value of 1 if the percentage of the firm's equity held by banks is higher than 5% and 0 otherwise; DBANK_MAIN is a dummy variable that takes the value of 1 if a bank is the largest shareholder in the firm and 0 otherwise; D_SL is a dummy variable that takes the value of 1 if the shareholder bank is also a lender of the firm and 0 otherwise; BOARD is a dummy variable that takes the value of 1 if the shareholders bank has any representative serving on the board of directors and 0 otherwise; LARGE1 is the percentage of shares held by the largest shareholder in the firm. All control variables are winsorized at the 1st and 99th.
The main banking stake in non-financial firms and the ownership concentration for our sample are also reported in Table 1. In 5.83% of the firm-year observations, a bank holds a percentage of the firm's equity. Whereas La Porta et al. (1999) show that banks take important stakes in Spanish firms, the mean percentage of the largest bank shareholder ownership in our sample is only 1.08%. The lower values of bank ownership compared to those reported by La Porta et al. (1999) are caused by the inclusion in our sample of a significant proportion of unlisted firms. Panel B of Table 1 reports a 3.96% average value of the main bank ownership.7
Spanish firms are also characterized by a high ownership concentration; with a mean (median) value of the equity stake held by the largest shareholder of 63.48 (57.50)%. Becht and Röell (1999) report a median largest voting block of 34.2% for 193 Spanish firms. Once again, our data differ with respect to previous studies due to the consideration of unlisted firms. The mean percentage of equity held by the major shareholder is 30.83% when we only consider listed firms, meanwhile this percentage is 64.83% for unlisted firms.
Table 2 shows the correlation matrix. DEBT and DEBTFIN correlate positively to profitability and negatively to firms size. DEBTMAT and DEBTMAT_FIN show a positive correlation with tangibility, size, growth and bank ownership, but correlate negatively with firm profitability. DEBT_COST has a positive correlation with liquidity, age, and the proxy of financial distress (DNEG_EQUITY), but correlates negatively with profitability and DEFAULT. The correlation between the independent variables is low, with only exception of non-debt tax shields and tangibility which are heavily correlated and the group of bank ownership proxies, which by nature capture the same type of information.
Correlations.
| DEBT | DEBTFIN | DEBTMAT | DEBTMAT_FIN | DEBTCOST | PROFIT | GROWTH | PPE | SIZE | NDTS | ASSET_MAT | FIRM_QUALITY | VOL_EBIT | PRIME | DEFAULT | DNEG_EQUITY | LIQUIDITY | INT_COV | AGE | OWN_BANKS | OWN_BANK | D_SL | BOARD | |
|---|---|---|---|---|---|---|---|---|---|---|---|---|---|---|---|---|---|---|---|---|---|---|---|
| DEBTFIN | 0.62*** | ||||||||||||||||||||||
| DEBTMAT | 0.14*** | 0.58*** | |||||||||||||||||||||
| DEBTMAT_FIN | 0.04*** | 0.17*** | 0.70*** | ||||||||||||||||||||
| DEBTCOST | 0.01 | −0.07*** | −0.03*** | −0.02* | |||||||||||||||||||
| PROFIT | −0.24*** | −0.25*** | −0.16*** | −0.05*** | −0.02** | ||||||||||||||||||
| GROWTH | 0.02** | 0.06 | 0.08*** | 0.05*** | −0.01 | 0.05*** | |||||||||||||||||
| PPE | −0.02** | 0.03*** | 0.07*** | 0.08*** | −0.01 | 0.17*** | −0.08*** | ||||||||||||||||
| SIZE | 0.09*** | 0.09*** | 0.17*** | 0.19*** | 0.01 | −0.01 | −0.05*** | −0.06*** | |||||||||||||||
| NDTS | 0.05*** | −0.06*** | −0.05*** | 0.02** | −0.01 | 0.28*** | −0.07*** | 0.56*** | −0.09*** | ||||||||||||||
| ASSET_MAT | −0.05*** | 0.10*** | 0.13*** | 0.08*** | −0.00 | −0.07*** | 0.04*** | 0.27*** | 0.01 | −0.21*** | |||||||||||||
| FIRM_QUALITY | −0.41*** | −0.32*** | −0.11*** | −0.01 | −0.02* | 0.33*** | 0.06*** | 0.02** | −0.06*** | 0.04*** | 0.01 | ||||||||||||
| VOL_EBIT | 0.02** | 0.06*** | 0.07*** | 0.04*** | −0.01 | −0.10*** | 0.24*** | −0.06*** | 0.02*** | −0.05*** | 0.01 | −0.00 | |||||||||||
| PRIME | −0.00 | 0.03*** | 0.02*** | 0.00 | −0.00 | −0.04 | −0.01 | 0.01 | 0.03*** | −0.01 | −*0.01 | −0.03*** | 0.02** | ||||||||||
| DEFAULT | −0.03*** | 0.05*** | 0.07*** | 0.07*** | −0.03*** | −0.11*** | −0.04*** | −0.01* | 0.02** | −0.03*** | −0.05*** | −0.05*** | 0.01 | 0.53*** | |||||||||
| DNEG_EQUITY | 0.51*** | 0.35*** | 0.14*** | 0.07*** | 0.02** | −0.29*** | 0.01 | −0.01 | −0.02** | 0.05*** | −0.05*** | −0.12*** | 0.04*** | 0.01 | 0.02*** | ||||||||
| LIQUIDITY | −0.31*** | −0.03*** | 0.18*** | 0.15*** | 0.06*** | −0.02** | 0.02*** | −0.11*** | −0.05*** | −0.13*** | 0.05*** | 0.36*** | 0.03*** | −0.00 | 0.02** | −0.04*** | |||||||
| INT_COV | −0.17*** | −0.14*** | −0.11*** | 0.00 | −0.00 | 0.21*** | 0.02** | −0.00 | −0.04*** | 0.01 | −0.01 | 0.25*** | −0.01* | −0.02** | −0.02** | −0.04*** | 0.10*** | ||||||
| AGE | −0.06*** | −0.12*** | −0.08*** | −0.03*** | 0.04*** | 0.02*** | −0.10*** | 0.10*** | 0.23*** | 0.05*** | −0.01* | −0.00 | −0.06*** | 0.01 | 0.04*** | −0.04*** | −0.02*** | −0.01 | |||||
| OWN_BANKS | 0.00 | 0.04*** | 0.05*** | 0.03*** | −0.00 | −0.02*** | 0.03*** | −0.02* | 0.09*** | −0.00 | −0.02** | 0.03*** | 0.02** | −0.01 | −0.02* | 0.01 | 0.05*** | −0.01 | 0.00 | ||||
| OWN_BANK | −0.00 | 0.04*** | 0.04*** | 0.03*** | −0.00 | −0.02*** | 0.03*** | −0.01 | 0.06*** | −0.00 | −0.02** | 0.04*** | 0.02** | −0.01 | −0.01* | 0.01 | 0.05*** | −0.01 | −0.02* | 0.96*** | |||
| D_SL | −0.01 | 0.02* | 0.06*** | 0.05*** | −0.01 | −0.02** | 0.02* | 0.01 | 0.16*** | −0.01 | −0.00 | 0.02*** | 0.02* | −0.00 | −0.00 | −0.01 | 0.01 | −0.00 | 0.02** | 0.42*** | 0.38*** | ||
| BOARD | −0.02** | 0.01 | 0.09*** | 0.08*** | −0.01 | 0.01 | 0.02*** | −0.00 | 0.24*** | −0.03*** | 0.02* | 0.00 | 0.02** | 0.00 | −0.00 | −0.02** | 0.01 | −0.02* | 0.06*** | 0.44*** | 0.36*** | 0.45*** | |
| LARGE1 | 0.09*** | −0.03*** | −0.05*** | 0.03*** | 0.03*** | −0.03*** | 0.01 | −0.06*** | 0.08*** | 0.00 | −0.06*** | −0.02* | 0.03*** | −0.01 | −0.01 | 0.07*** | 0.03*** | 0.02*** | −0.03*** | −0.04*** | −0.02** | −0.11*** | −0.13*** |
The table presents the correlation matrix. DEBT is the ratio between long- and short-term debt and the book value of assets; DEBTFIN is the ratio between financial long- and short-term debt and the book value of assets; DEBTMAT is the percentage of the firm's total debt that has a maturity of more than one year; DEBTMAT_FIN is the percentage of the firm's financial debt that has a maturity of more than one year; DEBTCOST is the interest expense for the year divided by the average interest-bearing debt; PROFIT is the ratio between earnings before interest and taxes plus depreciation expenses and provisions (non-cash deductions from earnings) divided by total assets; GROWTH is the growth rate of sales; TANG is the percentage of property, plant and equipment in total assets; SIZE is the natural logarithm of total sales; FIRM_QUALITY is the ratio of net income plus depreciation to net debt; VOL_EBIT is the absolute value of change in earnings before interest and taxes; PRIME is the average prime rate for the year; DEFAULT is the difference between the yield on 10-year corporate bonds and the yield on 10-year Spanish government bonds for the year; DNEG_EQUITY is a dummy value that takes the value of 1 if the firm's book value of common equity is negative and 0 otherwise; LIQUIDITY is the ratio between current assets and current liabilities; INT_COV is the ratio between earnings before interest and taxes and the interest expense; AGE is the number of years from the creation of the firm and each year; OWN_BANKS is the percentage of the firm's equity held by banks; OWN_BANK is the percentage of the firm's equity held by the largest shareholder bank; DBANKS_20 is a dummy variable that takes the value of 1 if the percentage of the firm's equity held by banks is higher than 20% and 0 otherwise; DBANKS_5 is a dummy variable that takes the value of 1 if the percentage of the firm's equity held by banks is higher than 5% and 0 otherwise; DBANK_MAIN is a dummy variable that takes the value of 1 if a bank is the largest shareholder in the firm and 0 otherwise; D_SL is a dummy variable that takes the value of 1 if the shareholder bank is also a lender of the firm and 0 otherwise. LARGE1 is the percentage of shares held by the largest shareholder in the firm.
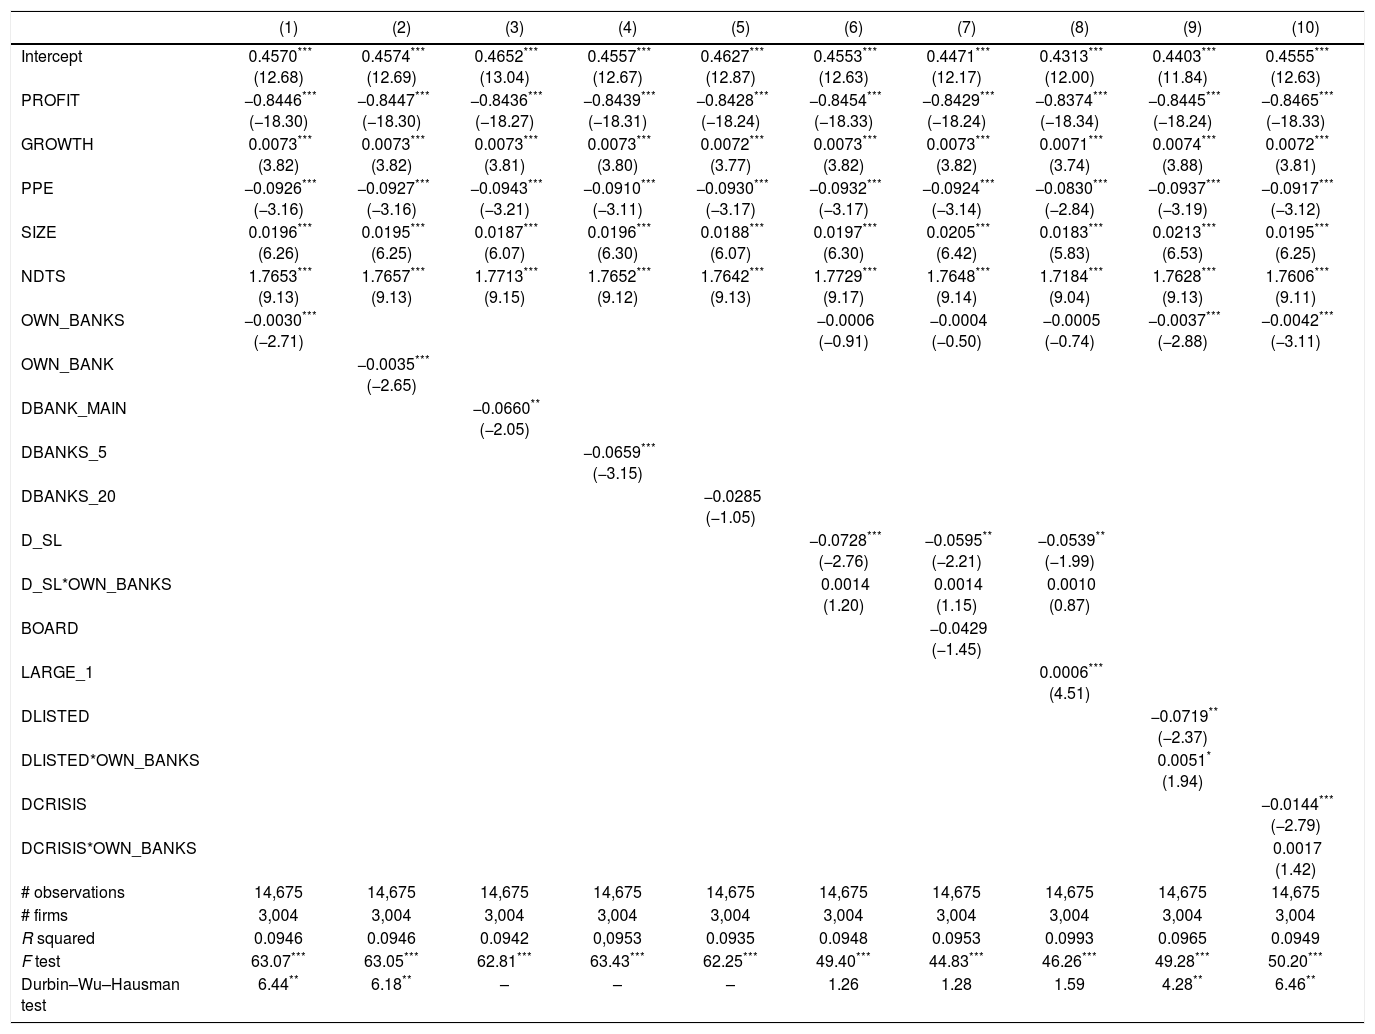
Table 3 shows the results when the dependent variable is the total-liabilities-to-assets ratio (DEBT). The results in columns (1) through (4) indicate a negative and significant relationship between the amount of debt and four of the five measures of bank ownership. Regardless of whether the OWN_BANKS, OWN_BANK, DBANK_MAIN or DBANKS_5 variables are used, the coefficient shows that bank ownership reduces the amount of debt. This result highlights that the existence of bank ownership does not increase the availability of credit. In fact, it suggests that the presence of banks as shareholders reduces firm leverage. The inclusion of the dummy variable D_SL, which takes the value of one if the shareholder bank is also a lender of the firm and zero otherwise, is carried out in columns (6) to (8). In these columns, this dummy variable is also interacted with OWN_BANKS. In this case, the variable of bank ownership measures the effect of bank ownership on the amount of debt for firms in which the bank is not a lender of the firm, while D_SL and its interaction with the measure of bank ownership respectively measure the effect on DEBT of a bank being a shareholder and lender of the firm and the differential effect of bank ownership on DEBT when the bank is a lender of the firm. The coefficient for the dummy variable D_SL is negative and significant, indicating that the negative effect of bank ownership on DEBT is due to the dual role of banks as both a shareholder and lender. In column (7) we control for the presence of any representative of the bank shareholder on the board of directors of the firm (BOARD). The coefficient of this variable is negative but is not statistical significant. The results for LARGE1 in column (8) show that ownership concentration is positive and significantly related to firm leverage. This result is consistent with large shareholders exerting managerial control.
Debt and bank ownership.
| (1) | (2) | (3) | (4) | (5) | (6) | (7) | (8) | (9) | (10) | |
|---|---|---|---|---|---|---|---|---|---|---|
| Intercept | 0.4570*** (12.68) | 0.4574*** (12.69) | 0.4652*** (13.04) | 0.4557*** (12.67) | 0.4627*** (12.87) | 0.4553*** (12.63) | 0.4471*** (12.17) | 0.4313*** (12.00) | 0.4403*** (11.84) | 0.4555*** (12.63) |
| PROFIT | −0.8446*** (−18.30) | −0.8447*** (−18.30) | −0.8436*** (−18.27) | −0.8439*** (−18.31) | −0.8428*** (−18.24) | −0.8454*** (−18.33) | −0.8429*** (−18.24) | −0.8374*** (−18.34) | −0.8445*** (−18.24) | −0.8465*** (−18.33) |
| GROWTH | 0.0073*** (3.82) | 0.0073*** (3.82) | 0.0073*** (3.81) | 0.0073*** (3.80) | 0.0072*** (3.77) | 0.0073*** (3.82) | 0.0073*** (3.82) | 0.0071*** (3.74) | 0.0074*** (3.88) | 0.0072*** (3.81) |
| PPE | −0.0926*** (−3.16) | −0.0927*** (−3.16) | −0.0943*** (−3.21) | −0.0910*** (−3.11) | −0.0930*** (−3.17) | −0.0932*** (−3.17) | −0.0924*** (−3.14) | −0.0830*** (−2.84) | −0.0937*** (−3.19) | −0.0917*** (−3.12) |
| SIZE | 0.0196*** (6.26) | 0.0195*** (6.25) | 0.0187*** (6.07) | 0.0196*** (6.30) | 0.0188*** (6.07) | 0.0197*** (6.30) | 0.0205*** (6.42) | 0.0183*** (5.83) | 0.0213*** (6.53) | 0.0195*** (6.25) |
| NDTS | 1.7653*** (9.13) | 1.7657*** (9.13) | 1.7713*** (9.15) | 1.7652*** (9.12) | 1.7642*** (9.13) | 1.7729*** (9.17) | 1.7648*** (9.14) | 1.7184*** (9.04) | 1.7628*** (9.13) | 1.7606*** (9.11) |
| OWN_BANKS | −0.0030*** (−2.71) | −0.0006 (−0.91) | −0.0004 (−0.50) | −0.0005 (−0.74) | −0.0037*** (−2.88) | −0.0042*** (−3.11) | ||||
| OWN_BANK | −0.0035*** (−2.65) | |||||||||
| DBANK_MAIN | −0.0660** (−2.05) | |||||||||
| DBANKS_5 | −0.0659*** (−3.15) | |||||||||
| DBANKS_20 | −0.0285 (−1.05) | |||||||||
| D_SL | −0.0728*** (−2.76) | −0.0595** (−2.21) | −0.0539** (−1.99) | |||||||
| D_SL*OWN_BANKS | 0.0014 (1.20) | 0.0014 (1.15) | 0.0010 (0.87) | |||||||
| BOARD | −0.0429 (−1.45) | |||||||||
| LARGE_1 | 0.0006*** (4.51) | |||||||||
| DLISTED | −0.0719** (−2.37) | |||||||||
| DLISTED*OWN_BANKS | 0.0051* (1.94) | |||||||||
| DCRISIS | −0.0144*** (−2.79) | |||||||||
| DCRISIS*OWN_BANKS | 0.0017 (1.42) | |||||||||
| # observations | 14,675 | 14,675 | 14,675 | 14,675 | 14,675 | 14,675 | 14,675 | 14,675 | 14,675 | 14,675 |
| # firms | 3,004 | 3,004 | 3,004 | 3,004 | 3,004 | 3,004 | 3,004 | 3,004 | 3,004 | 3,004 |
| R squared | 0.0946 | 0.0946 | 0.0942 | 0,0953 | 0.0935 | 0.0948 | 0.0953 | 0.0993 | 0.0965 | 0.0949 |
| F test | 63.07*** | 63.05*** | 62.81*** | 63.43*** | 62.25*** | 49.40*** | 44.83*** | 46.26*** | 49.28*** | 50.20*** |
| Durbin–Wu–Hausman test | 6.44** | 6.18** | – | – | – | 1.26 | 1.28 | 1.59 | 4.28** | 6.46** |
The dependent variable (DEBT) is the ratio between long- and short-term debt and the book value of assets; PROFIT is the ratio between earnings before interest and taxes plus depreciation expenses and provisions (non-cash deductions from earnings) divided by total assets; GROWTH is the growth rate of sales; PPE is the percentage of property, plant and equipment in total assets; SIZE is the natural logarithm of total assets; NDTS is the ratio of depreciation over total assets; OWN_BANKS is the percentage of the firm's equity held by banks; OWN_BANK is the percentage of the firm's equity held by the largest shareholder bank; DBANKS_20 is a dummy variable that takes the value of 1 if the percentage of the firm's equity held by banks is higher than 20% and 0 otherwise; DBANKS_5 is a dummy variable that takes the value of 1 if the percentage of the firm's equity held by banks is higher than 5% and 0 otherwise; DBANK_MAIN is a dummy variable that takes the value of 1 if a bank is the largest shareholder in the firm and 0 otherwise; D_SL is a dummy variable that takes the value of 1 if the shareholder bank is also a lender of the firm and 0 otherwise; BOARD is a dummy variable that takes the value of 1 if the shareholders bank has any representative serving on the board of directors and 0 otherwise; LARGE1 is the percentage of shares held by the largest shareholder in the firm; D_LISTED is a dummy variable that takes the value of 1 if the firm is listed on the Spanish Stock Market and 0 otherwise; DCRISIS is a dummy variable that takes the value of 1 for the years 2008, 2009, 2010, 2011 and 2012 and 0 otherwise. Industry and year dummy variables are included in the estimations, although the coefficients are not reported. All control variables are lagged by one year and winsorized at the 1st and 99th. T-statistics are in parentheses. ***, **, and * represent significance at the 1%, 5%, and 10% levels, respectively.
Estimations in columns (9) and (10) show the results when we consider the influence of whether the firms are listed or not and the period of the financial crisis. DLISTED is a dummy variable that takes the value of one if the firm is listed on the Spanish Stock Market and zero otherwise, while DCRISIS is a dummy variable that takes the value of one for the years from 2008 to 2012 and zero otherwise. These two variables were interacted with the variable of bank ownership. The negative coefficient for DLISTED reveals that listed firms have less debt than unlisted firms, (column (9)). There is also evidence indicating that the negative effect of bank ownership on firm leverage turns out to be positive in the case of listed firms. The results comparing the pre-crisis and crisis periods show that during the crisis firm leverage has been reduced and bank ownership has a negative effect on leverage. The insignificant coefficient of the interaction term suggest that the negative effect of bank ownership on DEBT does not differ between the pre crisis and the crisis period.
The impacts of the proxies of bank ownership and lending cannot be considered negligible. Using the coefficient in column (1) of Table 3, we observe that a one-standard deviation increase in the fitted value of OWN_BANKS would result in a decrease in the mean value of the dependent variable of −1.75 per cent. The role of banks as both lenders and shareholders is also economically important. According to the coefficients in column (6) of Table 3, being the bank a lender and a shareholder of the firm would lead to a variation in the mean value of the dependent variable of −7.28 per cent.
As for the control variables, the relationship between firm debt and profitability is negative for all estimations. This is the most frequently found result in the literature on leverage determinants and is consistent with the pecking order theory, given that higher profitability increases the possibility of retaining earnings and reduces, all else being equal, the need for debt. The coefficients for growth opportunities are also consistent with the pecking order theory, as greater growth opportunities, all else being equal, increase the need for debt. Size has a positive impact on firm debt, which is consistent with size being an inverse proxy for the likelihood of bankruptcy. This result is similar to results reported in Rajan and Zingales (1995), Fama and French (2002), Frank and Goyal (2003), Gaud et al. (2005) and Flannery and Rangan (2006). The negative coefficients of asset tangibility in all the estimations are not consistent with the greater value of these assets as collateral.8
Table 4 presents the results when the dependent variable is DEBTFIN, which is the ratio between the sum of financial long- and short-term debt and the book value of assets. The values of the Durbin–Wu–Hausman test do not reveal any endogeneity issues, therefore our set of variables of interest (i.e. OWN_BANKS and OWN_BANK) are based on the observed values of bank ownership. The coefficients of PROFIT have the same sign as in Table 3. The coefficients of GROWTH and SIZE are positive as in Table 3. Tangibility of assets has a positive influence on DEBTFIN in line with the greater value of tangible assets as collateral, reducing the costs of financial distress and conflicts between shareholders and debt holders. The coefficient for NDTS is negative as expected but not statistically significant.
Financial debt and bank ownership.
| (1) | (2) | (3) | (4) | (5) | (6) | (7) | (8) | (9) | (10) | |
|---|---|---|---|---|---|---|---|---|---|---|
| Intercept | 0.1823*** (5.29) | 0.1807*** (5.23) | 0.1802*** (5.22) | 0.1760*** (5.06) | 0.1808*** (5.24) | 0.1776*** (5.12) | 0.1702*** (4.80) | 0.1899*** (5.43) | 0.1743*** (4.88) | 0.1859*** (5.40) |
| PROFIT | −0.6653*** (−15.55) | −0.6655*** (−15.56) | −0.6660*** (−15.59) | −0.6681*** (−15.61) | −0.6656*** (−15.55) | −0.6672*** (−15.59) | −0.6643*** (−15.55) | −0.6731*** (−15.77) | −0.6653*** (−15.53) | −0.6616*** (−15.47) |
| GROWTH | 0.0148*** (6.52) | 0.0148*** (6.53) | 0.0149*** (6.57) | 0.0150*** (6.62) | 0.0149*** (6.54) | 0.0148*** (6.52) | 0.0149*** (6.54) | 0.0148*** (6.48) | 0.0149*** (6.58) | 0.0148*** (6.51) |
| PPE | 0.1233*** (4.75) | 0.1230*** (4.74) | 0.1234*** (4.75) | 0.1229*** (4.72) | 0.1231*** (4.74) | 0.1225*** (4.73) | 0.1234*** (4.76) | 0.1186*** (4.58) | 0.1230*** (4.74) | 0.1216*** (4.67) |
| SIZE | 0.0125*** (4.12) | 0.0127*** (4.16) | 0.0128*** (4.20) | 0.0133*** (4.30) | 0.0127*** (4.16) | 0.0131*** (4.24) | 0.0138*** (4.36) | 0.0140*** (4.54) | 0.0133*** (4.18) | 0.0126*** (4.15) |
| NDTS | −0.1528 (−0.87) | −0.1516 (−0.87) | −0.1530 (−0.88) | −0.1465 (−0.84) | −0.1517 (−0.87) | −0.1480 (−0.85) | −0.1552 (−0.89) | −0.1206 (−0.69) | −0.1541 (−0.88) | −0.1411 (−0.81) |
| OWN_BANKS | 0.0006 (1.32) | 0.0003 (0.50) | 0.0005 (0.79) | 0.0002 (0.35) | 0.0006 (1.14) | −0.0001 (−0.11) | ||||
| OWN_BANK | 0.0006 (1.12) | |||||||||
| DBANK_MAIN | 0.0349 (1.23) | |||||||||
| DBANKS_5 | −0.0100 (−0.58) | |||||||||
| DBANKS_20 | 0.0286 (1.37) | |||||||||
| D_SL | −0.0452* (−1.96) | −0.0357 (−1.46) | −0.0560** (−2.42) | |||||||
| D_SL*OWN_BANKS | 0.0017* (1.82) | 0.0017* (1.85) | 0.0019** (2.07) | |||||||
| BOARD | −0.0319 (−1.19) | |||||||||
| LARGE_1 | −0.0003*** (−2.90) | |||||||||
| DLISTED | −0.0325 (−1.29) | |||||||||
| DLISTED*OWN_BANKS | 0.0020 (1.26) | |||||||||
| DCRISIS | 0.0165*** (3.04) | |||||||||
| DCRISIS*OWN_BANKS | 0.0010* (1.83) | |||||||||
| # observations | 11,163 | 11,163 | 11,163 | 11,163 | 11,163 | 11,163 | 11,163 | 11,163 | 11,163 | 11,163 |
| # firms | 2,598 | 2,598 | 2,598 | 2,598 | 2,598 | 2,598 | 2,598 | 2,598 | 2,598 | 2,598 |
| R squared | 0.0830 | 0.0828 | 0.0829 | 0.0826 | 0.0828 | 0.0839 | 0.0843 | 0.0861 | 0.0835 | 0.0836 |
| F test | 50.09*** | 50.10*** | 50.15*** | 50.15*** | 50.38*** | 39.80*** | 36.09*** | 36.87*** | 39.43*** | 41.55*** |
| Durbin–Wu–Hausman test | 1.27 | 0.76 | – | – | – | 0.00 | 0.00 | 0.01 | 0.92 | 1.33 |
The dependent variable (DEBTFIN) is the ratio between financial long- and short-term debt and the book value of assets; PROFIT is the ratio between earnings before interest and taxes plus depreciation expenses and provisions (non-cash deductions from earnings) divided by total assets; GROWTH is the growth rate of sales; PPE is the percentage of property, plant and equipment in total assets; SIZE is the natural logarithm of total assets; NDTS is the ratio of depreciation over total assets; OWN_BANKS is the percentage of the firm's equity held by banks; OWN_BANK is the percentage of the firm's equity held by the largest shareholder bank; DBANKS_20 is a dummy variable that takes the value of 1 if the percentage of the firm's equity held by banks is higher than 20% and 0 otherwise; DBANKS_5 is a dummy variable that takes the value of 1 if the percentage of the firm's equity held by banks is higher than 5% and 0 otherwise; DBANK_MAIN is a dummy variable that takes the value of 1 if a bank is the largest shareholder in the firm and 0 otherwise; D_SL is a dummy variable that takes the value of 1 if the shareholder bank is also a lender of the firm and 0 otherwise; BOARD is a dummy variable that takes the value of 1 if the shareholders bank has any representative serving on the board of directors and 0 otherwise; LARGE1 is the percentage of shares held by the largest shareholder in the firm; D_LISTED is a dummy variable that takes the value of 1 if the firm is listed on the Spanish Stock Market and 0 otherwise; DCRISIS is a dummy variable that takes the value of 1 for the years 2008, 2009, 2010, 2011 and 2012 and 0 otherwise. Industry and year dummy variables are included in the estimations, although the coefficients are not reported. All control variables are lagged by one year and winsorized at the 1st and 99th. T-statistics are in parentheses. ***, **, and * represent significance at the 1%, 5%, and 10% levels, respectively.
The results reveal that there is not a significant relationship between bank ownership and leverage. The results in columns (6) to (8) reveal that D_SL has a significant effect on financial leverage, reducing financial debt. However, bank ownership has a positive and significant differential effect on financial debt when the bank is also the lender of the firm. Additionally, distinguishing between listed and unlisted firms does not provide significant results. Interestingly enough our results in column (10) indicate an increase of the weight of financial debt during the crisis period being this effect more intense the higher the banks stake held in the firm. This result suggests that during the crisis the financial institutions were doing an effort to support the financing of non-financial companies, being this effect stronger when they hold also equity of the firm.
Bank ownership and debt maturityTable 5 shows the results when the dependent variable is DEBTMAT. Following a similar approach to previous estimations, we have instrumented bank ownership variables when necessary as indicated by the Durbin–Wu–Hausman test. The results are in line with a positive influence of bank ownership on the maturity of debt, regardless of the proxy of bank ownership. Bank ownership has an economically important influence on debt maturity (DEBTMAT). A one-standard deviation increase in OWN_BANKS (column (1)) would increase the mean value of the dependent variable by 4.39 per cent.
Debt maturity and bank ownership.
| (1) | (2) | (3) | (4) | (5) | (6) | (7) | (8) | (9) | (10) | |
|---|---|---|---|---|---|---|---|---|---|---|
| Intercept | −0.1489*** (−4.25) | −0.1487*** (−4.24) | −0.1602*** (−4.58) | −0.1516*** (−4.32) | −0.1544*** (−4.40) | −0.1632*** (−4.69) | −0.1502*** (−4.26) | −0.1417*** (−4.02) | −0.1420*** (−3.98) | −0.1448*** (−4.11) |
| ASSET_MAT | 0.0028*** (9.73) | 0.0028*** (9.73) | 0.0028*** (9.82) | 0.0028*** (9.74) | 0.0028*** (9.74) | 0.0028*** (9.73) | 0.0027*** (9.63) | 0.0027*** (9.44) | 0.0028*** (9.72) | 0.0028*** (9.76) |
| GROWTH | 0.0106*** (4.80) | 0.0106*** (4.80) | 0.0105*** (4.77) | 0.0106*** (4.82) | 0.0106*** (4.83) | 0.0101*** (4.61) | 0.0100*** (4.56) | 0.0100*** (4.55) | 0.0105*** (4.75) | 0.0106*** (4.83) |
| SIZE | 0.0258*** (8.32) | 0.0258*** (8.31) | 0.0271*** (8.81) | 0.0261*** (8.41) | 0.0266*** (8.60) | 0.0265*** (8.60) | 0.0251*** (8.01) | 0.0279*** (9.08) | 0.0250*** (7.89) | 0.0258*** (8.33) |
| FIRM_QUALITY | −0.0304*** (−4.63) | −0.0304*** (−4.64) | −0.0305*** (−4.60) | −0.0302*** (−4.56) | −0.0302*** (−4.52) | −0.0306*** (−4.64) | −0.0303*** (−4.61) | −0.0296*** (−4.47) | −0.0309*** (−4.75) | −0.0301*** (−4.58) |
| VOL_EBIT | 0.0019*** (5.14) | 0.0019*** (5.14) | 0.0019*** (5.18) | 0.0019*** (5.18) | 0.0019*** (5.19) | 0.0019*** (5.10) | 0.0019*** (5.07) | 0.0020*** (5.36) | 0.0019*** (5.11) | 0.0019*** (5.14) |
| DEBT | 0.1153*** (6.73) | 0.1153*** (6.73) | 0.1147*** (6.70) | 0.1160*** (6.77) | 0.1141*** (6.65) | 0.1164*** (6.83) | 0.1176*** (6.92) | 0.1231*** (7.21) | 0.1163*** (6.80) | 0.1157*** (6.75) |
| OWN_BANKS | 0.0040*** (3.51) | 0.0351*** (3.57) | 0.0348*** (3.54) | 0.0362*** (3.67) | 0.0052*** (4.00) | 0.0042*** (3.02) | ||||
| OWN_BANK | 0.0050*** (3.62) | |||||||||
| DBANK_MAIN | 0.0758*** (2.68) | |||||||||
| DBANKS_5 | 0.0678*** (3.05) | |||||||||
| DBANKS_20 | 0.0518* (1.83) | |||||||||
| D_SL | −0.2396 (−1.02) | −0.3401 (−1.38) | −0.3295 (−1.35) | |||||||
| D_SL*OWN_BANKS | −0.0197 (−1.34) | −0.0159 (−1.05) | −0.0171 (−1.13) | |||||||
| BOARD | 0.0691** (2.45) | |||||||||
| LARGE_1 | −0.0006*** (−5.14) | |||||||||
| DLISTED | 0.0408* (1.65) | |||||||||
| DLISTED*OWN_BANKS | −0.0056** (−2.08) | |||||||||
| DCRISIS | 0.0218*** (3.89) | |||||||||
| DCRISIS*OWN_BANKS | −0.0003 (−0.22) | |||||||||
| # observations | 14,298 | 14,298 | 14,298 | 14,298 | 14,298 | 14,298 | 14,298 | 14,298 | 14,298 | 14,298 |
| # firms | 2,923 | 2,923 | 2,923 | 2,923 | 2,923 | 2,923 | 2,923 | 2,923 | 2,923 | 2,923 |
| R squared | 0.0876 | 0.0878 | 0.0864 | 0.0873 | 0.0858 | 0.0917 | 0.0932 | 0.0972 | 0.0888 | 0.0881 |
| F test | 69.05*** | 69.16*** | 68.07*** | 69.17*** | 67.94*** | 56.81*** | 52.02*** | 54.06*** | 55.80*** | 57.04*** |
| Durbin–Wu–Hausman test | 7.21*** | 8.28*** | – | – | – | 13.35*** | 13.44*** | 14.33*** | 6.32*** | 7.22*** |
The dependent variable (DEBTMAT) is the percentage of the firm's total debt that has a maturity of more than one year. ASSET_MAT is the ratio between property, plant and equipment and the annual depreciation; GROWTH is the growth rate of sales; SIZE is the natural logarithm of total assets; FIRM_QUALITY is the ratio of net income plus depreciation to net debt; VOL_EBIT is the absolute value of change in earnings before interest and taxes; DEBT is the ratio between long- and short-term debt and the book value of assets; OWN_BANKS is the percentage of the firm's equity held by banks; OWN_BANK is the percentage of the firm's equity held by the largest shareholder bank; DBANKS_20 is a dummy variable that takes the value of 1 if the percentage of the firm's equity held by banks is higher than 20% and 0 otherwise; DBANKS_5 is a dummy variable that takes the value of 1 if the percentage of the firm's equity held by banks is higher than 5% and 0 otherwise; DBANK_MAIN is a dummy variable that takes the value of 1 if a bank is the largest shareholder in the firm and 0 otherwise; D_SL is a dummy variable that takes the value of 1 if the shareholder bank is also a lender of the firm and 0 otherwise; BOARD is a dummy variable that takes the value of 1 if the shareholders bank has any representative serving on the board of directors and 0 otherwise; LARGE1 is the percentage of shares held by the largest shareholder in the firm; D_LISTED is a dummy variable that takes the value of 1 if the firm is listed on the Spanish Stock Market and 0 otherwise; DCRISIS is a dummy variable that takes the value of 1 for the years 2008, 2009, 2010, 2011 and 2012 and 0 otherwise. Industry and year dummy variables are included in the estimations, although the coefficients are not reported. All control variables are lagged by one year and winsorized at the 1st and 99th. T-statistics are in parentheses. ***, **, and * represent significance at the 1%, 5%, and 10% levels, respectively.
The regression model in column (6) shows that the dual role of banks as shareholders and lenders has no significant influence on debt maturity, while the relationship between this last variable and bank ownership continues to be positive. BOARD influences positively debt maturity, revealing that the presence of the bank in the firm's board of directors rises the percentage of long-term debt. The results in column (8) show that ownership concentration decreases debt maturity. Listed firms’ debt has longer maturity than unlisted firms’ debt (column (9)); moreover, the positive effect of bank ownership on debt maturity is lower for listed firms as the coefficient of DLISTED*OWN_BANKS is negative and significant. This result is consistent with a relatively less relevant character of bank direct ownership in reducing informational asymmetry in the case of listed companies.
As for the influence of the financial crisis on debt maturity, we observe that the maturity of debt has increased during the crisis and that this effect does not depend on bank ownership. Bank ownership has a positive influence on debt maturity both before and during the financial crisis.
The analysis of the results for the set of control variables shows that the relationship between assets and debt maturities is positive. This is consistent with the matching hypothesis, according to which firms match assets and liabilities to reduce risk. In line with Stohs and Mauer (1996), the positive and statistically significant coefficient for GROWTH is inconsistent with the agency cost hypothesis. The positive relationship may be a consequence of the liquidity risk argument, according to which firms with long-term investment opportunities prefer to hedge against liquidity risk by issuing long-term debt (Diamond, 1991; Guedes and Opler, 1996; Antoniou et al., 2006). The effect of firm size on debt maturity is positive, indicating that large firms have longer debt maturities. This relationship is consistent with the idea that firms with more severe agency problems – small firms – may use shorter-term debt to reduce underinvestment and risk-shifting problems. FIRM_QUALITY has a negative influence on debt maturity, revealing that high-quality firms tend to issue short-term debt as the incentives to lengthen the maturity of debt increases with the risk of not being able to refund debt. Leverage is positively related to debt maturity. This result is consistent with Diamond (1991), who argues that, as liquidity risk increases with leverage, highly leveraged firms can be expected to use more long-term debt. Moreover, this effect dominates the use of leverage and debt maturity as substitutes in mitigating under- and overinvestment problems. As regards the control variables, therefore, the results provide strong evidence in line with the matching and liquidity risk hypotheses.
Table 6 presents the results when the dependent variable is DEBTMAT_FIN. The results in columns (1) through (5) show an insignificant relationship between bank ownership and maturity of financial debt. However, although our estimations in columns (6) to (8) reveal that the dummy variable D_SL is not statistically significant, once the effect of the dual role of the banks as shareholders and creditors is controlled, the results in columns (6) to (8) show a positive effect of bank ownership on debt maturity. This result suggests that bank ownership contributes to alleviating the agency costs of debt. Debt maturity increases with ownership concentration (column (8)). This result is consistent with the short-term debt being no longer required when large shareholders exert managerial control. The public (listed) status of a firm has apparently no effect on the maturity of financial debt (column (9)). The results in column (10) highlight that the role played by banks has varied during the financial crisis with bank ownership experiencing a differential negative effect during the financial crisis with respect to the pre crisis period. Banks that hold ownership stakes reduce the firms’ debt maturity comparatively to their influence before the crisis. As for the control variables, we obtain evidence in line with both the matching and liquidity risk hypotheses as when the dependent variable was DEBTMAT.
Financial debt maturity and bank ownership.
| (1) | (2) | (3) | (4) | (5) | (6) | (7) | (8) | (9) | (10) | |
|---|---|---|---|---|---|---|---|---|---|---|
| Intercept | −0.0223 (−0.55) | −0.0224 (−0.56) | −0.0234 (−0.58) | −0.0137 (−0.34) | −0.0221 (−0.55) | −0.0269 (−0.66) | −0.0166 (−0.40) | −0.0380 (−0.92) | −0.0275 (−0.667) | −0.0221 (−0.55) |
| ASSET_MAT | 0.0017*** (5.55) | 0.0017*** (5.55) | 0.0017*** (5.55) | 0.0017*** (5.51) | 0.0017*** (5.56) | 0.0017*** (5.53) | 0.0016*** (5.46) | 0.0017*** (5.61) | 0.0017*** (5.56) | 0.0017*** (5.53) |
| GROWTH | 0.0052* (1.95) | 0.0052* (1.93) | 0.0053* (1.95) | 0.0051* (1.90) | 0.0052* (1.93) | 0.0049* (1.80) | 0.0047* (1.75) | 0.0049* (1.83) | 0.0053** (1.98) | 0.0052* (1.93) |
| SIZE | 0.0372*** (10.43) | 0.0372*** (10.48) | 0.0373*** (10.54) | 0.0362*** (10.01) | 0.0371*** (10.46) | 0.0370*** (10.33) | 0.0360*** (9.72) | 0.0362*** (10.12) | 0.0377*** (10.05) | 0.0373*** (10.47) |
| FIRM_QUALITY | 0.0539*** (3.60) | 0.0539*** (3.61) | 0.0537*** (3.59) | 0.0540*** (3.61) | 0.0537*** (3.59) | 0.0534*** (3.60) | 0.0534*** (3.60) | 0.0548*** (3.71) | 0.0542*** (3.62) | 0.0543*** (3.63) |
| VOL_EBIT | 0.0012*** (2.67) | 0.0012*** (2.66) | 0.0012*** (2.68) | 0.0012*** (2.64) | 0.0012*** (2.67) | 0.0012*** (2.60) | 0.0012*** (2.59) | 0.0011** (2.53) | 0.0012*** (2.69) | 0.0012*** (2.69) |
| DEBT | 0.2030*** (8.97) | 0.2029*** (8.97) | 0.2031*** (8.98) | 0.2034*** (8.97) | 0.2028*** (8.96) | 0.2033*** (8.98) | 0.2038*** (9.02) | 0.2054*** (9.10) | 0.2026*** (8.95) | 0.2028*** (8.97) |
| OWN_BANKS | 0.0003 (0.38) | 0.0319*** (3.12) | 0.0319*** (3.12) | 0.0314*** (3.05) | 0.0002 (0.24) | 0.0018 (2.38) | ||||
| OWN_BANK | 0.0005 (0.50) | |||||||||
| DBANK_MAIN | 0.0195 (0.52) | |||||||||
| DBANKS_5 | 0.0345 (1.62) | |||||||||
| DBANKS_20 | 0.0287 (0.91) | |||||||||
| D_SL | 0.4169 (0.57) | 0.3593 (0.50) | 0.4320 (0.60) | |||||||
| D_SL*OWN_BANKS | −0.0510 (−1.43) | −0.0491 (−1.40) | −0.0509 (−1.45) | |||||||
| BOARD | 0.0435 (1.51) | |||||||||
| LARGE_1 | 0.0003* (1.95) | |||||||||
| DLISTED | −0.0272 (−0.92) | |||||||||
| DLISTED*OWN_BANKS | 0.0023 (0.88) | |||||||||
| DCRISIS | 0.0215** (2.56) | |||||||||
| DCRISIS*OWN_BANKS | −0.0020** (−2.17) | |||||||||
| # observations | 11,014 | 11,014 | 11,014 | 11,014 | 11,014 | 11,014 | 11,014 | 11,014 | 11,014 | 11,014 |
| # firms | 2,551 | 2,551 | 2,551 | 2,551 | 2,551 | 2,551 | 2,551 | 2,551 | 2,551 | 2,551 |
| R squared | 0.0766 | 0.0767 | 0.0766 | 0.0771 | 0.0767 | 0.0794 | 0.0799 | 0.0803 | 0.0773 | 0.0774 |
| F test | 49.45*** | 49.41*** | 49.57*** | 49.21*** | 49.29*** | 41.16*** | 38.50*** | 38.00*** | 39.94*** | 40.16*** |
| Durbin–Wu–Hausman test | 1.44 | 1.42 | – | – | – | 7.77*** | 7.86*** | 7.48*** | 1.81 | 1.53 |
The dependent variable (DEBTMAT_FIN) is the percentage of the firm's financial debt that has a maturity of more than one year. ASSET_MAT is the ratio between property, plant and equipment and the annual depreciation; GROWTH is the growth rate of sales; SIZE is the natural logarithm of total assets; FIRM_QUALITY is the ratio of net income plus depreciation to net debt; VOL_EBIT is the absolute value of change in earnings before interest and taxes; DEBTFIN is the ratio between financial long- and short-term debt and the book value of assets; OWN_BANKS is the percentage of the firm's equity held by banks; OWN_BANK is the percentage of the firm's equity held by the largest shareholder bank; DBANKS_20 is a dummy variable that takes the value of 1 if the percentage of the firm's equity held by banks is higher than 20% and 0 otherwise; DBANKS_5 is a dummy variable that takes the value of 1 if the percentage of the firm's equity held by banks is higher than 5% and 0 otherwise; DBANK_MAIN is a dummy variable that takes the value of 1 if a bank is the largest shareholder in the firm and 0 otherwise; D_SL is a dummy variable that takes the value of 1 if the shareholder bank is also a lender of the firm and 0 otherwise; BOARD is a dummy variable that takes the value of 1 if the shareholders bank has any representative serving on the board of directors and 0 otherwise; LARGE1 is the percentage of shares held by the largest shareholder in the firm; D_LISTED is a dummy variable that takes the value of 1 if the firm is listed on the Spanish Stock Market and 0 otherwise; DCRISIS is a dummy variable that takes the value of 1 for the years 2008, 2009, 2010, 2011 and 2012 and 0 otherwise. Industry and year dummy variables are included in the estimations, although the coefficients are not reported. All control variables are lagged by one year and winsorized at the 1st and 99th. T-statistics are in parentheses. ***, **, and * represent significance at the 1%, 5%, and 10% levels, respectively.
The results of the influence of bank ownership on the cost of debt are shown in Table 7. We observe that bank ownership reduces the cost of debt regardless of the proxy used. This result is consistent with bank ownership reducing the agency costs of debt. The results in columns (6) to (8) reveal that when the bank is not only a shareholder but also a lender of the firm, it results in a decrease in the cost of debt and that this reduction takes place regardless of the bank's ownership stake. The cost of debt increases significantly with ownership concentration (column (8)). We do not find differences in the influence of bank ownership between listed and unlisted firms or before and during the financial crisis. The financial crisis has reduced debt cost for firms and the existence of bank ownership has reduced the cost of debt before and during the financial crisis. The reduction of the cost of debt during the crisis might be counter intuitive although it is attributable to a reduction in the basic interest rates in the Euro area designed to fight the contractive effects of the financial crisis.
Debt cost and bank ownership.
| (1) | (2) | (3) | (4) | (5) | (6) | (7) | (8) | (9) | (10) | |
|---|---|---|---|---|---|---|---|---|---|---|
| Intercept | −0.0891*** (−2.85) | −0.0890*** (−2.85) | −0.0851*** (−2.74) | −0.0885*** (−2.84) | −0.0882*** (−2.82) | −0.0897*** (−2.87) | −0.0914*** (−2.90) | −0.1023*** (−3.27) | −0.0934*** (−2.96) | −0.0917*** (−2.97) |
| PRIME | 3.2422*** (6.26) | 3.2418*** (6.26) | 3.2505*** (6.26) | 3.2434*** (6.26) | 3.2439*** (6.26) | 3.2460*** (6.26) | 3.2508*** (6.28) | 3.3191*** (6.42) | 3.2506*** (6.28) | 3.2479*** (6.29) |
| DEFAULT | −0.2858 (−0.73) | −0.2855 (−0.73) | −0.2977 (−0.76) | −0.2835 (−0.72) | −0.2850 (−0.73) | −0.2887 (−0.74) | −0.2887 (−0.74) | −0.3286 (−0.84) | −0.2876 (−0.73) | 0.1338 (0.33) |
| DEBTFIN | −0.1557*** (−15.43) | −0.1557*** (−15.43) | −0.1554*** (−15.41) | −0.1558*** (−15.41) | −0.1556*** (−15.42) | −0.1557*** (−15.43) | −0.1557*** (−15.42) | −0.1529*** (−15.36) | −0.1556*** (−15.44) | −0.1555*** (−15.41) |
| PROFIT | −0.0459*** (−2.64) | −0.0459*** (−2.64) | −0.0441** (−2.53) | −0.0456*** (−2.63) | −0.0451*** (−2.59) | −0.0459*** (−2.64) | −0.0454*** (−2.61) | −0.0423** (−2.47) | −0.0457*** (−2.63) | −0.0465*** (−2.67) |
| SIZE | 0.0074*** (4.36) | 0.0074*** (4.36) | 0.0069*** (4.18) | 0.0073*** (4.32) | 0.0073*** (4.28) | 0.0074*** (4.34) | 0.0075*** (4.30) | 0.0066*** (3.83) | 0.0077*** (4.40) | 0.0074*** (4.34) |
| PPE | −0.0091 (−0.95) | −0.0091 (−0.96) | −0.0093 (−0.98) | −0.0087 (−0.91) | −0.0086 (−0.90) | −0.0088 (−0.92) | −0.0088 (−0.92) | −0.0079 (−0.83) | −0.0096 (−1.02) | −0.0088 (−0.93) |
| DNEG_EQUITY | 0.0642*** (8.51) | 0.0642*** (8.51) | 0.0646*** (8.53) | 0.0642*** (8.52) | 0.0644*** (8.54) | 0.0641*** (8.51) | 0.0640*** (8.51) | 0.0613*** (8.17) | 0.0642*** (8.50) | 0.0641*** (8.50) |
| LIQUIDITY | 0.0012 (0.97) | 0.0012 (0.97) | 0.0012 (1.01) | 0.0012 (0.98) | 0.0012 (0.96) | 0.0012 (0.97) | 0.0012 (0.96) | 0.0012 (1.02) | 0.0012 (0.97) | 0.0012 (0.98) |
| INT_COV | −0.0000*** (−6.45) | −0.0000*** (−6.46) | −0.0000*** (−6.48) | −0.0000*** (−6.44) | −0.0000*** (−6.45) | −0.0000*** (−6.46) | −0.0000*** (−6.45) | −0.0000*** (−6.60) | −0.0000*** (−6.44) | −0.0000*** (−6.44) |
| GROWTH | 0.0018** (2.56) | 0.0018** (2.57) | 0.0017** (2.48) | 0.0018** (2.54) | 0.0018** (2.57) | 0.0018** (2.53) | 0.0018** (2.53) | 0.0019*** (2.74) | 0.0019*** (2.69) | 0.0018** (2.55) |
| AGE | −0.0002*** (−2.81) | −0.0002*** (−2.82) | −0.0002*** (−2.77) | −0.0002*** (−2.80) | −0.0002*** (−2.82) | −0.0002*** (−2.78) | −0.0002*** (−2.75) | −0.0002** (−2.48) | −0.0002** (−2.53) | −0.0002*** (−2.81) |
| OWN_BANKS | −0.0012*** (−4.85) | −0.0000 (−0.13) | 0.0000 (0.00) | 0.0000 (0.09) | −0.0011*** (−4.22) | −0.0015*** (−3.21) | ||||
| OWN_BANK | −0.0014*** (−4.86) | |||||||||
| DBANK_MAIN | −0.0107** (−2.05) | |||||||||
| DBANKS_5 | −0.0201*** (−4.24) | |||||||||
| DBANKS_20 | −0.0221*** (−3.78) | |||||||||
| D_SL | −0.0238*** (−4.12) | −0.0221*** (−3.70) | −0.0160*** (−2.68) | |||||||
| D_SL*OWN_BANKS | 0.0001 (0.22) | 0.0001 (0.28) | −0.0001 (−0.25) | |||||||
| BOARD | −0.0062 (−0.66) | |||||||||
| LARGE_1 | 0.0002*** (5.95) | |||||||||
| DLISTED | −0.0113 (−1.37) | |||||||||
| DLISTED*OWN_BANKS | 0.0004 (0.69) | |||||||||
| DCRISIS | −0.0062* (−1.75) | |||||||||
| DCRISIS*OWN_BANKS | 0.0005 (1.02) | |||||||||
| # observations | 10,217 | 10,217 | 10,217 | 10,217 | 10,217 | 10,217 | 10,217 | 10,217 | 10,217 | 10,217 |
| # firms | 2,425 | 2,425 | 2,425 | 2,425 | 2,425 | 2,425 | 2,425 | 2,425 | 2,425 | 2,425 |
| R squared | 0.1146 | 0.1146 | 0.1131 | 0.1144 | 0.1140 | 0.1146 | 0.1147 | 0.1205 | 0.1150 | 0.1148 |
| F test | 28.35*** | 28.37*** | 28.20*** | 28.38*** | 28.26*** | 24.63*** | 23.11*** | 23.45*** | 24.72*** | 25.46*** |
| Durbin–Wu–Hausman test | 15.32*** | 17.11*** | – | – | – | 0.26 | 0.26 | 0.44 | 12.06*** | 16.00*** |
The dependent variable (DEBTCOST) is the interest expense for the year divided by the average interest-bearing debt. PRIME is the average prime rate for the year; DEFAULT is the difference between the yield on 10-year corporate bonds and the yield on 10-year Spanish government bonds for the year; DEBTFIN is the ratio between financial long- and short-term debt and the book value of assets; PROFIT is the ratio between earnings before interest and taxes plus depreciation expenses and provisions (non-cash deductions from earnings) divided by total assets; SIZE is the natural logarithm of total sales; PPE is the percentage of property, plant and equipment in total assets; DNEG_EQUITY is a dummy value that takes the value of 1 if the firm's book value of common equity is negative and 0 otherwise; LIQUIDITY is the ratio between current assets and current liabilities; INT_COV is the ratio between earnings before interest and taxes and the interest expense; GROWTH is the growth rate of sales; AGE is the number of years from the creation of the firm and each year; OWN_BANKS is the percentage of the firm's equity held by banks; OWN_BANK is the percentage of the firm's equity held by the largest shareholder bank; DBANKS_20 is a dummy variable that takes the value of 1 if the percentage of the firm's equity held by banks is higher than 20% and 0 otherwise; DBANKS_5 is a dummy variable that takes the value of 1 if the percentage of the firm's equity held by banks is higher than 5% and 0 otherwise; DBANK_MAIN is a dummy variable that takes the value of 1 if a bank is the largest shareholder in the firm and 0 otherwise; D_SL is a dummy variable that takes the value of 1 if the shareholder bank is also a lender of the firm and 0 otherwise. BOARD is a dummy variable that takes the value of 1 if the shareholders bank has any representative serving on the board of directors and 0 otherwise; LARGE1 is the percentage of shares held by the largest shareholder in the firm; D_LISTED is a dummy variable that takes the value of 1 if the firm is listed on the Spanish Stock Market and 0 otherwise; DCRISIS is a dummy variable that takes the value of 1 for the years 2008, 2009, 2010, 2011 and 2012 and 0 otherwise. Industry and year dummy variables are included in the estimations, although the coefficients are not reported. All control variables are lagged by one year and winsorized at the 1st and 99th. T-statistics are in parentheses. ***, **, and * represent significance at the 1%, 5%, and 10% levels, respectively.
Bank ownership has an economically significant effect on debt cost. Using the coefficient in column (4) of Table 7, a firm with bank ownership above 5% experiences a reduction in the cost of debt of 2.01 per cent; i.e., 27.24 per cent of the mean value of the dependent variable. Similarly, the dual role of a bank as shareholder and lender reduces the cost of debt 2.38 per cent (column (6)).
As for the control variables, the variation in the cost of debt due to a change in the market rate (PRIME) is statistically significant. Increases in the default premium (DEFAULT) do not raise the firm's cost of debt. This result is due to the fact that PRIME reflects a default premium, as the correlation between these two variables shown in Table 2 is 0.53. When both variables are considered alternatively as determinants of debt cost, their coefficients are positive and statistically significant (results not shown). Debt cost decreases with firm profitability (PROFIT), revealing that more profitable companies pay less for their debt, as firms that generate more cash are in a better position to service their debts. The coefficient for interest coverage (INT_COV) is significant and negative, as expected. This means that firms with higher interest coverage face a lower cost of debt as they have a lower default risk. We also obtain a positive and significant coefficient for the DNEG_EQUITY variable. This dummy variable identifies firms for which the book value of common equity is negative, indicative of financial distress. The results show that these firms incur higher borrowing costs. The coefficient for size (SIZE) is positive, a result that is not in line with the expected inverse relationship between the cost of debt and firm size. However, we obtain the expected sign for the coefficient of the AGE variable. Growth has a positive effect on debt cost revealing that riskier firms pay higher cost of debt. We obtain a strong negative relationship between leverage and cost of debt, most likely revealing that the level of financial debt reflects the good reputation that companies have acquired in the debt markets.
In summary our results indicate that having banks as large shareholders of a firm has an overall positive effect in terms of the conditions of debt contracting. We observe that large bank shareholders are associated to longer terms of the debt and lower cost of the debt. These results are consistent with a supervisory role played by large bank shareholders. Being a large shareholder allows banks better access to the relevant information to assess the borrower's solvency. Bank shareholders reduce the information asymmetry between the borrower and the lender and also provides a signal of the quality of the lender to other prospective lenders.
Not only the shareholder status of the banks is relevant but also its simultaneous position as lender. Our results indicate that the dual role of banks as shareholders and lenders is negatively related to firm's leverage and debt cost. The latter result is consistent with a monitoring and signaling effect of bank shareholders. The negative relation with firms leverage would be at odds with these effects, however it could be explained by the aversion of shareholder lender banks to excessive risk taking when they provide both equity and debt financing.
The role played by banks in facilitating debt financing could result especially relevant when firms face a general contraction of the offer of funds as in the credit crunch episode starting in 2008. Bank ownership facilitates the access to financial debt during the financial crisis although the access to new debt comes at the cost of shorter maturities consistently with banks avoiding their risk exposure in times of especial market turbulences.
Although, bank ownership could have a more important effect on the conditions of debt for unlisted firms, as the information asymmetry problems are stronger for those firms, we do not observe a differential effect of bank ownership on financial leverage, maturity of financial leverage and debt cost for listed firms. These results suggest that the effect of bank ownership for listed firms is not different from the one for the total sample.
ConclusionsThis paper analyzes the influence of bank ownership and bank lending on corporate capital structure for a sample of listed and unlisted Spanish firms over the period 2005-2012. Spain provides a good example of what it has been commonly referred to as a “bank-based” corporate governance system, characterized by a high ownership concentration, bank monitoring, a very minor monitoring role played by the market for corporate control and with non-financial firms being highly dependent on bank financing. This setting makes banks very influential due to their dual position as major shareholders and lenders.
Our study contributes to the debate on the governance effects of large shareholders tackling the controversial topic of their monitoring role or conversely their interest conflicts with the small shareholders that leads to the existence of the type-II agency problem. This debate is still opened and so far there is not a consensus about the role played by large shareholders. Moreover, when the large shareholders considered are banks there are serious doubts about their beneficial role for small shareholders given the specific interests derived from their dual role as equity and debt holders. Debt financing is dominated by banks in Spain and having banks as major shareholders is frequent for Spanish companies. This situation makes it especially important to shed some light on the governance role played by banks in Spanish companies which is extensible to other continental European economies due to the similarities in the ownership structures across Europe.
Our analysis of the role of banks as shareholders highlight strong effects of bank ownership on debt maturity and the cost of debt. We obtain evidence that is in line with the idea that bank ownership reduces the agency costs of debt. In fact, debt maturity increases with bank ownership, whereas the cost of debt decreases with bank ownership. These results are consistent with the predominance of the monitoring effect over the expropriation effect. However, we do not find that bank ownership has a positive effect on the availability of debt. Moreover, bank ownership reduces the ratio of the debt-to-book value of assets and has no effect on financial debt.
The paper also provides evidence on the role of banks when they are both shareholders and lenders. The results are consistent with the benefits of the simultaneous ownership of equity and debt claims by banks, as the dual role of banks as shareholders and lenders lowers the cost of debt, although it also reduces the leverage of the firm.
Our results have practical implications for politicians and regulators. For instance in Germany where banks play a major role as shareholders in other companies, there has been a debate for years on need to limit their influence on industrial firms. In other economies like the US, commercial banks ownership of non-financial companies have been prohibited for years9 and only recently these limitations have been relaxed. Contrarily to these limitations the positive effects of bank ownership on the conditions of debt financing provides arguments in favor of the positive role played by commercial banks in the governance of the firms. This results are specially relevant in the case of continental Europe where the importance of banks as major shareholders and providers of debt financing is paramount. Moreover, in light of the results obtained the community of investors can see banks as active monitors that protect the interest of shareholders rather than extracting private benefits through their business relations with the companies in which they are invested.
This paper opens future lines of research. Banks are not only influential on the financing aspects of the company. Banks, as debt providers, are specially interested in the risk levels of their borrowers and therefore, they could exert pressure to reduce the economic risk of the companies to which they lend money. This could be specially critical in times of contraction of the offer of funds, such as the episodes of credit crunch during the global financial crisis. Therefore, an interesting topic for future research is the effect of bank ownership on the investment policies of companies under the restrictive conditions of the financial global crisis.
The table gives the definition of variables used in the paper.
| Name | Definition |
|---|---|
| Dependent variables | |
| DEBT | The ratio between long- and short-term debt and the book value of assets. |
| DEBTFIN | The ratio between financial long- and short-term debt and the book value of assets. |
| DEBTMAT | The percentage of the firm's total debt that has a maturity of more than one year. |
| DEBTMAT_FIN | The percentage of the firm's financial debt that has a maturity of more than one year. |
| DEBTCOST | The interest expense for the year divided by the average interest-bearing debt. |
| Ownership and lending variables | |
| OWN_BANKS | The percentage of firm's equity held by banks. |
| OWN_BANK | The percentage of firm's equity held by the largest shareholder bank. |
| DBANK_MAIN | A dummy variable that takes the value of 1 if a bank is the largest shareholder in the firm and 0 otherwise. |
| DBANKS_5 | A dummy variable that takes the value of 1 if the percentage of firm's equity held by banks is higher than 5% and 0 otherwise. |
| DBANKS_20 | A dummy variable that takes the value of 1 if the percentage of firm's equity held by banks is higher than 20% and 0 otherwise. |
| D_SL | A dummy variable that takes the value of 1 if the shareholder bank is also a lender of the firm and 0 otherwise. |
| BOARD | A dummy variable that takes the value of 1 if the shareholder bank has any representative serving on the board of directors and 0 otherwise. |
| LARGE1 | The percentage of shares held by the largest shareholder in the firm. |
| Control variables | |
| PROFIT | The ratio between earnings before interest and taxes plus depreciation expenses and provisions (non-cash deductions from earnings) divided by total assets. |
| GROWTH | The growth rate of sales. |
| PPE | The ratio of tangible assets (property, plant and equipment) to total assets. |
| SIZE | The natural logarithm of total sales. |
| NDTS | The ratio of depreciation to total assets. |
| ASSET_MAT | The ratio between property, plant and equipment and the annual depreciation |
| FIRM_QUALITY | The ratio of net income plus depreciation to net debt. |
| VOL_EBIT | The absolute value of change in earnings before interest and taxes. |
| PRIME | The annual average prime rate. |
| DEFAULT | The difference between the annual yield on 10-year corporate bonds and the annual yield on 10-year Spanish government bonds. |
| DNEG_EQUITY | A dummy value that takes the value of 1 if the firm's book value of common equity is negative and 0 otherwise. |
| LIQUIDITY | The ratio between current assets and current liabilities. |
| INT_COV | The ratio between earnings before interest and taxes and the interest expense. |
| AGE | The number of years from the creation of the firm and each year. |
Azofra-Palenzuela et al. (2008) report an extensive description of the role of banks in the Spanish financial system.
We thank participants at the ACEDE Conference in Jaén (2015) for helpful comments and suggestions. Financial support from the Spanish Ministry of Economy and Competitiveness via Projects ECO2012-31772 and ECO2015-66184-R is gratefully acknowledged.
Zoido (1998) has analyzed the influence of bank ownership on firm value, firm performance and debt cost for a sample of listed and unlisted firms for the period 1983-1995, concluding among other results that bank shareholders reduce the corporate cost of debt. The database used is the Central de Balances del Banco de España which contains mainly large unlisted firms.
This is the amount of long-term debt identified by standard accounting convention and traditionally used (Demirgüç-Kunt and Maksimovic, 1999; Antoniou et al., 2006; Fan et al., 2012). Other authors have used alternative definitions. Barclay and Smith (1995) define debt maturity as long-term if it is payable after three years. Stohs and Mauer (1996) use a weighted average of the maturity of liabilities. The papers using alternative measures have reported results that are not significantly different from those obtained when the standard definition is used. Our choice is also driven by data availability.
The SABI database not only provides financial and ownership structure information, but also shows which banks are providing financial services to the firm. SABI does not provide this data on a yearly basis. We have collected this data item for the final year of the sample (2012). Nevertheless, we are confident that bank – client relationships are stable, especially in the case when the bank is a relevant shareholder of the firm.
To control for potential endogeneity of bank ownership we also use bank ownership data at the beginning of our estimation period. This analysis reduces the concern that recent changes in firms’ capital structure might have an effect on bank ownership. The results obtained using the bank ownership data at the beginning of the period do not alter the conclusions of the paper.
If the estimation including the OWN_BANKS variable presents endogeneity problems the fitted value of this variable is calculated and the fitted values of DBANKS_5 and DBANKS_20 are generated. In no case the variable DBANK_MAIN is fitted.
Banks have reduced their equity stakes during the financial crisis period. González (2009) shows that the average percentage of bank ownership for Spanish listed firms in the period 1991-2003 is 10.62%.
This negative effect of PPE on the ratio between long- and short-term debt and the book value of assets seems to be due to the high correlation between PPE and NDTS. When NDTS is excluded from the estimations the coefficient of PPE is positive, although is not statistically significant at standard levels.
US banks can hold ownership stakes up to 5%, not directly, but through Bank Holding Companies and only for portfolio investment motives not for control reasons.