


The presence of mycotoxins or related fungi in animal feed is a major problem for animal and human health. Silage and concentrated feed samples were collected from 21 dairy farms in the Western part of Paraná state in Southern Brazil. Water activity and pH of all samples were measured, and each sample was analyzed to check for the presence of aflatoxigenic Aspergillus. Water activity was observed to be lower in the concentrated feed samples. The pH was lower in the silage samples, indicating fermentation processes. Two silage samples and four concentrated feed samples were contaminated with Aspergillus spp. Seven isolates of Aspergillus spp. were obtained and their potential to produce aflatoxins was evaluated. Four of the isolates, two from the silage samples and two from the concentrated feed samples, produced the aflatoxins B1, B2, G1, and G2 in culture media. These isolates were identified as Aspergillus parasiticus and Aspergillus nomius. The presence of aflatoxigenic isolates of Aspergillus spp. in silage and concentrated feed samples is a matter of concern, because of the risk of aflatoxin production and contamination of the animal feed.
Various species of the genus Aspergillus are commonly isolated from stored foods.1,2 Aflatoxins are mycotoxins produced by the species of the genus Aspergillus, subgenus Circumdati section Flavi (also referred to as the Aspergillus flavus group) mainly by the species Aspergillus flavus, Aspergillus parasiticus, and Aspergillus nomius.3–6 About 50% of the isolates of the species A. flavus predominantly produce aflatoxins B1 and B2. Nearly all the isolates of the species A. parasiticus produce aflatoxins B1, B2, G1, and G2.3,4 Aflatoxin M1, which is secreted in milk from the mammary glands of both humans and lactating animals, is a hydroxylated metabolite of aflatoxin B1.7 Approximately 0.5–6% of the ingested aflatoxin B1 is converted to aflatoxin M1 and is secreted in milk.7 According to the International Agency for Research on Cancer (IARC, 2009), aflatoxins are classified as group I or carcinogenic to humans, being aflatoxin B1 the most toxic.8 Aflatoxin M1 is as toxic as aflatoxin B1 but is ten times less carcinogenic. The susceptibility to aflatoxins depends on the species, age, dose, the extent of exposure, nutrition, gender, and concomitant exposure to other toxins. The liver is the primary target organ in mammals, and aflatoxins cause hepatocellular carcinoma.3,4
Milk has high nutritive value because it contains many macro- and micronutrients, which are important for the growth of children and maintenance of human health. Aflatoxin M1 is thermostable and resistant to pasteurization.7 Humans can be exposed to aflatoxin M1 through endogenous production or by intake of dairy products. Babies and young children, who might consume contaminated milk or be exposed by breastfeeding, are the most vulnerable.7
According to the United States Department of Agriculture, Brazil was the sixth largest milk producer in the world in 2018, only behind European Union, United States, India, China, and Russia, achieving the production of 23 billion liters.9 According to the Brazilian Institute of Geography and Statistics (2016), there has been an increase in the milk production by more than 50% during the past few years, as compared to the beginning of the 21st century.10 The highest increase has occurred in the Southern region, which is the major milk producing region in Brazil, contributing to 37% of the national production in 2016. In addition, this region shows a productivity of 2966L/cow/year, which is 70% higher than the Brazilian average of 1709L/cow/year.10
Milk productivity is related to the animal's productive potential and breed genetics.11 The productive potential is favored by environmental factors such as climatic conditions and adequate nutrition. To compensate for poor growth of pastures, several dairy farms use forages, concentrates, and preserved feeds (hay or silage). As the production is intensified, these supplements become the sole source of animal feed. This is where the aflatoxins become a matter of concern.12–14
Because of a strong correlation between the presence of mold and the occurrence of mycotoxin, it is important to search for the presence of fungi in animal feed.15–17 This information can indicate the Hazard Analysis Critical Control Point (HACCP) within the food production chain.18 The objective of this study was to analyze animal feed for the presence of aflatoxigenic Aspergillus in dairy farms located in the western region of the Paraná State in Southern Brazil.
Materials and methodsSample collectionTwenty-one randomly chosen dairy farms were visited during January of 2015. The dairy farms were located in the city of Marechal Cândido Rondon, in the Western region of the Paraná State in Southern Brazil. Before the sample collection, a questionnaire was answered by the farmers to identify what type of feed was provided for the animals, how they were fed, and how the feed was stored. The silages were well compacted and had the characteristic color and odor of optimum lactic acid fermentation. The outer layers of silage that were in contact with air (without the polystyrene cover) appeared dry, and some parts showed slight fungal contamination (spot). Each silage sample consisted of three sub-samples, categorized as Surface – composite sample obtained from the silo front; Depth – composite sample obtained from the silo interior at 25cm depth; and Spot – composite sample obtained near contaminated points, within a radius of up to 20cm, without collecting visibly degraded or contaminated material.19
The samples of the concentrated feed were also collected from most of the farms. Several storage forms of the concentrated feed were identified in the visited farms. For instance, bulk silos, feed bags purchased directly from agricultural holdings, and ingredients purchased in bulk and stored in reused bags or compartments within the farm itself. When the concentrated feed was stored as a silo, a sample was collected from the exit point of the silo. When the concentrated feed was kept in bags, sub-samples were collected from various points of the bag in case of a single bag being used, or from several bags if more than one bag were being used. From each farm, the concentrated feed sub-samples were individually homogenized and combined to make a sample.
Measurement of water activity and pH of silage and concentrated feed samplesThe measurement of water activity of the silage and concentrated feed samples was performed using a LabSwift water activity instrument (Novasina, Lachen, Switzerland). The sample preparation and operation of the apparatus were performed according to the instructions described in the operating manual. After homogenizing the sample, a portion was transferred to and packed in a test dish in triplicate.
The pH measurements of the silage and concentrated feed samples were performed by adding 9g of the each sample to 60mL of water in a 250-mL beaker. After mixing for 5min, the samples were left to rest for 30min and an aliquot from the supernatant was used to measure the pH using a pH meter calibrated with standard buffer solutions of pH 4.0 and 7.0.20
Isolation of the microorganismsTwenty grams of each silage or concentrated feed samples were added to 80mL of sterile 0.1% peptone water in 250mL Erlenmeyer flasks. This suspension was incubated at 25°C for 1h with agitation at 100rpm. Aliquots of 100μL of this suspension were spread on the surface of a Petri dish of diameter 10cm (in triplicate) containing A. flavus and parasiticus agar (AFPA) (20g/L yeast extract; 10g/L bacteriological peptone; 0.5g/L ferric ammonium citrate; and 15g/L agar).2 Rapidly growing molds such as Rhizopus and Mucor were inhibited by the addition of malachite green at a concentration of 2.5μg/mL to the medium, before autoclaving. To prevent bacterial growth, 641IU/mL of penicillin and 256.4μg/mL of streptomycin were aseptically supplemented to the medium, after autoclaving and cooling to 60°C. The culture was incubated at 25°C with a photoperiod of 12h for five days.
A. flavus and A. parasiticus and related species grow as orange colored reverse colonies in the AFPA, a characteristic which facilitates their isolation.2 A fragment of the orange colored reverse colony grown on the selective AFPA medium was transferred to a tube containing potato dextrose agar (PDA) slant (for 1L: 15g dextrose, 20g agar, filtrate of 200g peeled potato cooked in 400mL of distilled water) and cultured at 25°C for five days to promote spore formation. Then, a 1cm3 piece of the PDA culture was fragmented by agitation in 20mL of sterile water. An aliquot of 100μL of this suspension containing 4.8×10⁵ spores was spread on 2.5% agar–water medium in 10cm diameter Petri dishes. After growing the culture at 25°C for approximately 16 to 20h, a fragment of the hypha or a single germinating spore was transferred to fresh PDA slants.21 The isolates were maintained in PDA slants at 4°C, with passages done every six months.
Morphology and culture identification of the isolatesFor the taxonomic identification of the isolates, the following features were observed: macroscopic colony surface and reverse characteristics in PDA and Czapek Dox agar (30g/L sucrose, 2g/L NaNO3, 1g/L K2HPO4, 0.5g/L MgSO4·7H2O, 0.5g/L KCl, 0.01g/L FeSO4·7H2O, 15g/L agar, pH 7.3), and microscopic characteristics such as conidia, vesicle, conidiophore, and phialide. The observed characteristics were analyzed according to dichotomous identification keys described by Pitt and Hocking.2
DNA extractionTo obtain mycelia without spores for the DNA extraction, the following was performed. A fragment of approximately 1cm3 of a monosporic culture in a PDA slant was cut into smaller pieces and agitated in 5mL of sterile distilled water. Two milliliters of the obtained spore suspension (3.84×10⁷) were cultured in 125mL Erlenmeyer flasks containing 25mL of liquid AFP broth (without malachite green or antibiotics) or potato dextrose broth, for five and three days, respectively. The microorganisms were grown without agitation, at 25°C, with a photoperiod of 12hours. After collecting the mycelial mass by filtration in sterile gauze, the obtained material was macerated with liquid nitrogen in a porcelain recipient until transformation in a fine powder.
Approximately 300μL of this powder was transferred to a microtube and the DNA was extracted according to the method described by Koenig et al.22 with the modifications reported by Faria et al.23 The DNA was quantified using a spectrophotometer and the final concentration was adjusted to 100ng/μL.
Molecular identification of the isolatesA 5.8S-ITS rDNA amplicon of approximately 600bp was obtained from the genomic DNA of the isolates by using the primers ITS4 5′-CCTCCGCTTATTGATATGC and ITS5 5′-GAAGTAAAAGTCGTAACAAGG, previously described by White et al.24 The amplification reactions contained: 50mM KCl; 10mM Tris, pH 7.5; 1.5mM MgCl2; 1.5U of Platinum Taq DNA polymerase; 0.2mM of each dNTP; 25pmol of each primer; and 400ng of the DNA sample in a final volume of 25μL. The cycling conditions were 25 cycles of 1min and 30s at 94°C, 1min and 30s at 50°C, and 2min at 72°C, which were executed in a Techne TC-312 thermocycler (England). Samples were heated for 5min at 94°C, previous to the cycles, and were incubated for 10min at 72°C, after the cycles. The PCR products were kept frozen at −20°C until use. Negative controls (no DNA template) were used to test for the presence of DNA contamination. The amplification of a DNA fragment was confirmed by electrophoresing 10μL of the PCR reaction in a 1.5% agarose gel containing ethidium bromide (0.25μg/mL) and visualizing the gel under UV light. The obtained amplicons were purified either by the Illustra ExoProStar™ (GE Healthcare Life Sciences, USA) or by the Wizard® SV Gel and PCR Clean-Up System (Promega, USA) and sequenced at the Center for Human Genome Studies (CEGH) from the University of São Paulo (USP), São Paulo, Brazil. The primer used in sequencing was one of those used in the amplification. The sequencing was done in only one direction. After trimming the 5′ and 3′ extremities, the 5.8S-ITS rDNA obtained sequences were compared with sequences deposited in databanks (GenBank) by using MEGABLAST analysis.
Detection of aflatoxin biosynthesis pathway genesThe presence of the apa-2, omt-A, ver-1, and nor-1 genes, which play a role in the aflatoxins biosynthesis pathway, was evaluated by a multiplex PCR using the primers previously described by Shapira et al. (APA-450 5′-TATCTCCCCCCGGGCATCTCCCGG and APA-1482 5′-CCGTCAGACAGCCACTGGACACGG) and Geisen (omt1 5′-GTGGACGGACCTAGTCCGACATCAC and omt2 5′-GTCGGCGCCACGCACTGGGTTGGGG; ver1 5′-CCGCAGGCCGCGGAGAAAGTGGT and ver2 5′-GGGGATATACTCCCGCGACACAGCC; and nor1 5′-ACCGCTACGCCGGCACTCTCGGCAC and nor2 5′-GTTGGCCGCCAGCTTCGACACTCCG).25,26
The amplification reactions contained: 50mM KCl; 10mM Tris, pH 7.5; 1.5mM MgCl2; 2.0U of Platinum Taq DNA polymerase; 0.2mM of each dNTP; 25pmol of each one of the 8 primers; and 400ng of the DNA sample in a final volume of 25μL. The PCR reaction consisted of 30 cycles of 1min at 94°C, 2min at 65°C, and 2min at 72°C, also performed in the Techne TC-312 thermocycler (England). Previous to cycling, samples were heated for 5min at 94°C. After cycling, samples were incubated for 10min at 72°C and were kept frozen at −20°C until use. The negative control was a reaction without any DNA template while A. parasiticus UEM 443 was used as positive control. The DNA amplification was evaluated by loading 10μL of the PCR products in a 1.5% agarose gel containing ethidium bromide (0.25μg/mL). After the electrophoresis, the gel was visualized and photographed under UV light.
Analysis of aflatoxin production in specific culture mediumThe evaluation of aflatoxin production potential of the isolates was performed by analyzing the production of fluorescence under ultraviolet (UV) light by the culture in coconut milk agar (CMA). This medium was prepared with 200mL of coconut milk (SOCOCO S/A, Maceió, Alagoas, Brazil), 600mL of distilled water having pH 6.9, and 16g of agar.27 Three Petri dishes (diameter of 10cm with 20mL of CMA) were inoculated in the center by touching a sterile wood skewer stick covered with spores at the pointed end. The dishes were incubated at 28°C with a photoperiod of 12h for seven days, and fluorescence was observed in a UV transilluminator with emission at 312nm. The pure culture of A. parasiticus UEM 443, previously isolated from peanut, and Aspergillus tamarii UEM 15C were used as positive and negative control for aflatoxin production, respectively.
The analysis of ammonium hydroxide vapor was conducted on 7-day-old cultures in the CMA medium. The dishes were inverted and drops of 28–30% ammonium hydroxide were added to the inner side of the lid. The production of aflatoxins was visualized by the appearance of pink color around and in the reverse of the colonies.28
Thin layer chromatography (TLC) analysis for aflatoxin productionA fragment of a monosporic culture in a PDA slant, measuring approximately 1cm3, was cut into smaller pieces and was agitated in 10mL of sterile distilled water. Of the obtained suspension, a 100μL aliquot (containing 9.6×10⁵ spores) without the agar fragments was spread on Petri dishes containing malt glucose agar (MGA) [50g/L malt extract, 50g/L glucose, 20g/L agar] or CMA medium.23,29 The dishes were incubated at 28°C for seven days. Only one dish was cultured and analyzed for each isolate. With the use of a sterilized cork borer, eight disks of 0.5cm diameter were cut from each culture dish and were independently transferred to two microcentrifuge tubes (four disks each), where they were fragmented and 500μL of chloroform was added.29 This mixture was agitated at 100rpm for 60min at room temperature and the agar fragments containing the mycelia were discarded. The resulting extracts were combined and passed through a small column made with a 1.0mL pipette tip. This column-tip had glass wool at the bottom, filled with 1.5g of anhydrous sodium sulfate (Na2SO4), which was covered with small pieces of filter paper. The eluate was dried at room temperature and the obtained residue was re-suspended in 20μL of chloroform.
Additionally, 100μL aliquots from spore suspensions of each isolate (9.6×10⁵ of spores) were used to inoculate 25mL of Yeast Extract Sucrose (YES) medium (20g/L yeast extract and 200g/L sucrose) in 125mL flasks.30 The flasks were incubated at 28°C for 14 days. Only one flask was used for culture and analysis of each isolate. After this period, the content of each flask was filtered through plain filter paper. To the filtrate, 10mL of hexane was added and the mixture was agitated in a vortex mixer for 1min. The organic component was discarded and 10mL of chloroform was added to the aqueous component. This mixture was again agitated in the vortex for 3min and was left to rest until the layers separated. The organic layer of chloroform was collected and filtered by a filter paper coated with anhydrous sodium sulfate. The solvent was evaporated by incubation at 50°C overnight, and the obtained residue was re-suspended in 20μL of chloroform.
An aliquot of approximately 10μL of the extracts obtained from the MGA, CMA, and YES cultures was added to Thin-Layer Chromatography (TLC) plates (Silica gel, Sigma–Aldrich, Germany). The application dots were dried at room temperature and the chromatogram was developed in a solvent system of toluene–ethyl acetate–chloroform–formic acid (7:5:5:2). The reference isolate A. parasiticus UEM 443 was analyzed using the same procedure. The aflatoxin standards were obtained from Sigma-Aldrich (Germany). The aflatoxin B1 and B2 standards were dissolved in toluene at a concentration of 0.125μg/μL, and the aflatoxin G1 and G2 standards were dissolved in methanol: water (9:1, v/v) at the same concentration.
Statistical analysisThe means and standard deviations of the results were compared using Duncan's New Multiple Range Test (MRT) or t-test (α<0.05), using the SAS-M program.31
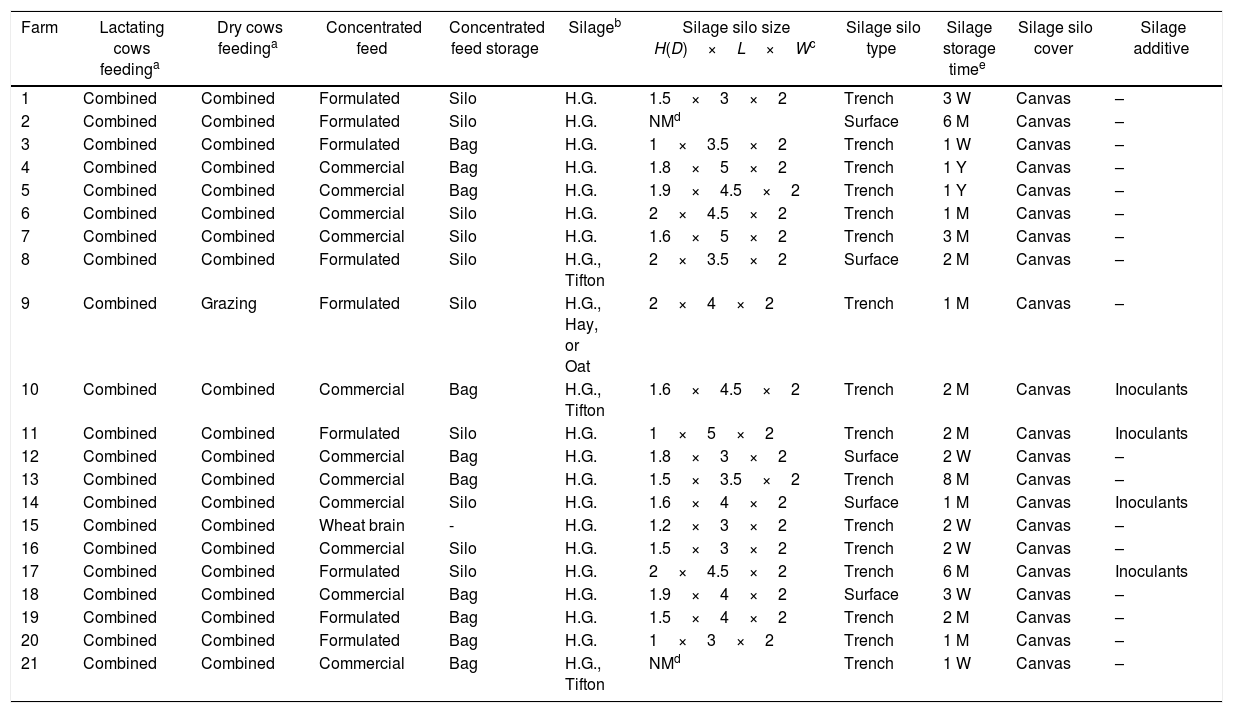
ResultsSample collectionThe results of the data about animal feeding and the animal feed samples collected at different dairy farms are shown in Table 1. It was observed that 95% of the lactating and dry animals were fed using a combined system of grazing and feeding on the trough during the milking process (Table 1). In the case of concentrated feed, it was found that 52% of the farms used a commercial mixture and 43% formulated it within the farm (soybean meal and corn, except at one farm where only wheat bran was used). In 47.6% of those farms, the concentrated feed was stored in bulk carriers, while the rest of the farms stored the feed in bags in the stable. In the case of silage, 81% of the farms used humid grain and 19% used humid grain plus dry Tifton, hay, or oats. This silage was kept in silos with an average size of 1.6×3.9×2m, with storage time of one week to one year. The silos were trench or surface style and were covered with canvas. Only at four farms, inoculants were added to the silage. Roughly 8–40kg (layers of 15–40cm) of this silage was used daily throughout the year. The farmers discarded rotten parts of the silage in 86% of the farms.
Animal feeding and animal feed samples collected at different dairy farms.
| Farm | Lactating cows feedinga | Dry cows feedinga | Concentrated feed | Concentrated feed storage | Silageb | Silage silo size H(D)×L×Wc | Silage silo type | Silage storage timee | Silage silo cover | Silage additive |
|---|---|---|---|---|---|---|---|---|---|---|
| 1 | Combined | Combined | Formulated | Silo | H.G. | 1.5×3×2 | Trench | 3 W | Canvas | – |
| 2 | Combined | Combined | Formulated | Silo | H.G. | NMd | Surface | 6 M | Canvas | – |
| 3 | Combined | Combined | Formulated | Bag | H.G. | 1×3.5×2 | Trench | 1 W | Canvas | – |
| 4 | Combined | Combined | Commercial | Bag | H.G. | 1.8×5×2 | Trench | 1 Y | Canvas | – |
| 5 | Combined | Combined | Commercial | Bag | H.G. | 1.9×4.5×2 | Trench | 1 Y | Canvas | – |
| 6 | Combined | Combined | Commercial | Silo | H.G. | 2×4.5×2 | Trench | 1 M | Canvas | – |
| 7 | Combined | Combined | Commercial | Silo | H.G. | 1.6×5×2 | Trench | 3 M | Canvas | – |
| 8 | Combined | Combined | Formulated | Silo | H.G., Tifton | 2×3.5×2 | Surface | 2 M | Canvas | – |
| 9 | Combined | Grazing | Formulated | Silo | H.G., Hay, or Oat | 2×4×2 | Trench | 1 M | Canvas | – |
| 10 | Combined | Combined | Commercial | Bag | H.G., Tifton | 1.6×4.5×2 | Trench | 2 M | Canvas | Inoculants |
| 11 | Combined | Combined | Formulated | Silo | H.G. | 1×5×2 | Trench | 2 M | Canvas | Inoculants |
| 12 | Combined | Combined | Commercial | Bag | H.G. | 1.8×3×2 | Surface | 2 W | Canvas | – |
| 13 | Combined | Combined | Commercial | Bag | H.G. | 1.5×3.5×2 | Trench | 8 M | Canvas | – |
| 14 | Combined | Combined | Commercial | Silo | H.G. | 1.6×4×2 | Surface | 1 M | Canvas | Inoculants |
| 15 | Combined | Combined | Wheat brain | - | H.G. | 1.2×3×2 | Trench | 2 W | Canvas | – |
| 16 | Combined | Combined | Commercial | Silo | H.G. | 1.5×3×2 | Trench | 2 W | Canvas | – |
| 17 | Combined | Combined | Formulated | Silo | H.G. | 2×4.5×2 | Trench | 6 M | Canvas | Inoculants |
| 18 | Combined | Combined | Commercial | Bag | H.G. | 1.9×4×2 | Surface | 3 W | Canvas | – |
| 19 | Combined | Combined | Formulated | Bag | H.G. | 1.5×4×2 | Trench | 2 M | Canvas | – |
| 20 | Combined | Combined | Formulated | Bag | H.G. | 1×3×2 | Trench | 1 M | Canvas | – |
| 21 | Combined | Combined | Commercial | Bag | H.G., Tifton | NMd | Trench | 1 W | Canvas | – |
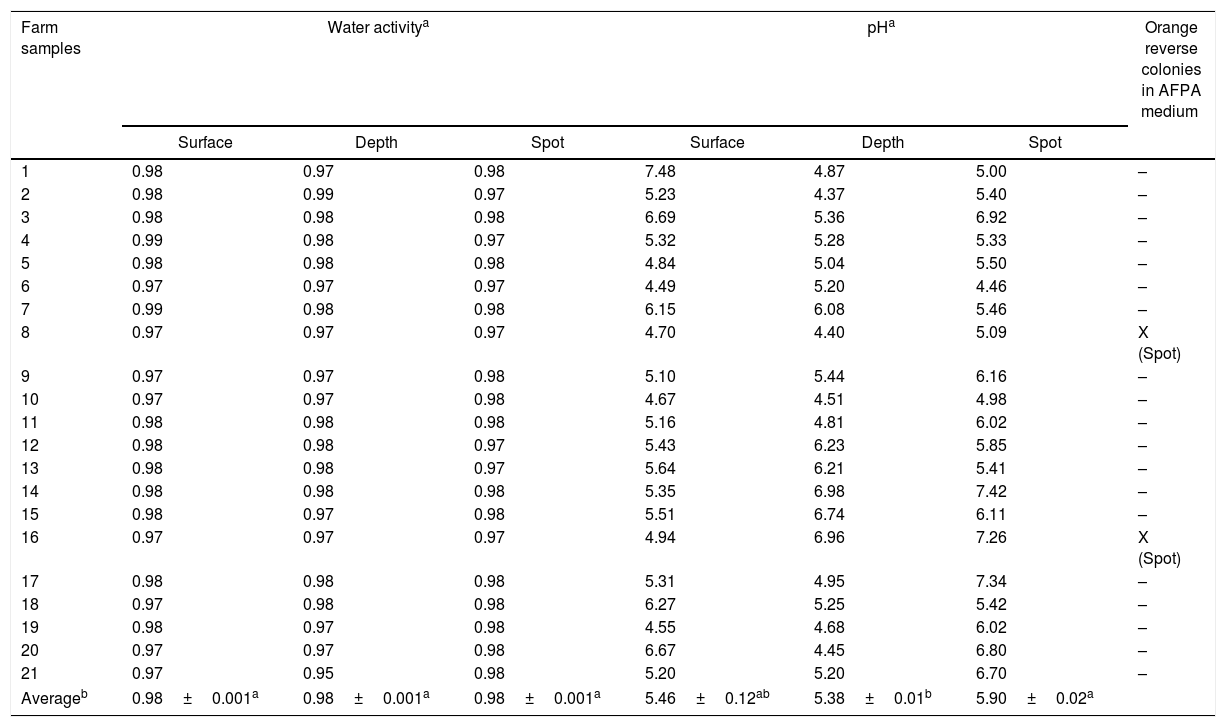
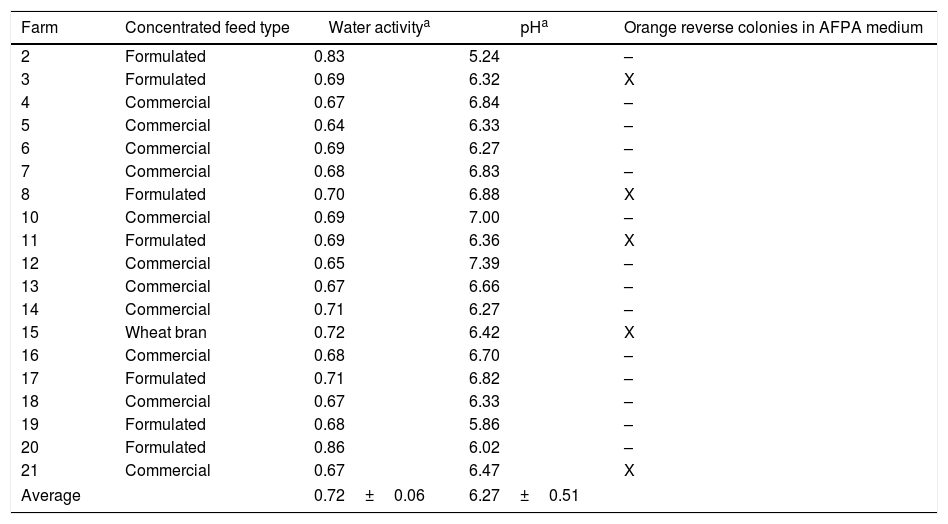
The water activity of the silage samples ranged between 0.95 and 0.98 (Table 2) while the values observed in concentrated feed samples ranged from 0.64 to 0.86 (Table 3). There was a significant difference in the pH values of the silage sub-samples (surface, depth, and spot) where the Depth samples were most acidic (Table 2).
The water activity, pH, and occurrence of orange reverse colonies in the silage samples.
| Farm samples | Water activitya | pHa | Orange reverse colonies in AFPA medium | ||||
|---|---|---|---|---|---|---|---|
| Surface | Depth | Spot | Surface | Depth | Spot | ||
| 1 | 0.98 | 0.97 | 0.98 | 7.48 | 4.87 | 5.00 | – |
| 2 | 0.98 | 0.99 | 0.97 | 5.23 | 4.37 | 5.40 | – |
| 3 | 0.98 | 0.98 | 0.98 | 6.69 | 5.36 | 6.92 | – |
| 4 | 0.99 | 0.98 | 0.97 | 5.32 | 5.28 | 5.33 | – |
| 5 | 0.98 | 0.98 | 0.98 | 4.84 | 5.04 | 5.50 | – |
| 6 | 0.97 | 0.97 | 0.97 | 4.49 | 5.20 | 4.46 | – |
| 7 | 0.99 | 0.98 | 0.98 | 6.15 | 6.08 | 5.46 | – |
| 8 | 0.97 | 0.97 | 0.97 | 4.70 | 4.40 | 5.09 | X (Spot) |
| 9 | 0.97 | 0.97 | 0.98 | 5.10 | 5.44 | 6.16 | – |
| 10 | 0.97 | 0.97 | 0.98 | 4.67 | 4.51 | 4.98 | – |
| 11 | 0.98 | 0.98 | 0.98 | 5.16 | 4.81 | 6.02 | – |
| 12 | 0.98 | 0.98 | 0.97 | 5.43 | 6.23 | 5.85 | – |
| 13 | 0.98 | 0.98 | 0.97 | 5.64 | 6.21 | 5.41 | – |
| 14 | 0.98 | 0.98 | 0.98 | 5.35 | 6.98 | 7.42 | – |
| 15 | 0.98 | 0.97 | 0.98 | 5.51 | 6.74 | 6.11 | – |
| 16 | 0.97 | 0.97 | 0.97 | 4.94 | 6.96 | 7.26 | X (Spot) |
| 17 | 0.98 | 0.98 | 0.98 | 5.31 | 4.95 | 7.34 | – |
| 18 | 0.97 | 0.98 | 0.98 | 6.27 | 5.25 | 5.42 | – |
| 19 | 0.98 | 0.97 | 0.98 | 4.55 | 4.68 | 6.02 | – |
| 20 | 0.97 | 0.97 | 0.98 | 6.67 | 4.45 | 6.80 | – |
| 21 | 0.97 | 0.95 | 0.98 | 5.20 | 5.20 | 6.70 | – |
| Averageb | 0.98±0.001a | 0.98±0.001a | 0.98±0.001a | 5.46±0.12ab | 5.38±0.01b | 5.90±0.02a | |
The water activity, pH, and occurrence of orange reverse colonies in the concentrated feed samples.
| Farm | Concentrated feed type | Water activitya | pHa | Orange reverse colonies in AFPA medium |
|---|---|---|---|---|
| 2 | Formulated | 0.83 | 5.24 | – |
| 3 | Formulated | 0.69 | 6.32 | X |
| 4 | Commercial | 0.67 | 6.84 | – |
| 5 | Commercial | 0.64 | 6.33 | – |
| 6 | Commercial | 0.69 | 6.27 | – |
| 7 | Commercial | 0.68 | 6.83 | – |
| 8 | Formulated | 0.70 | 6.88 | X |
| 10 | Commercial | 0.69 | 7.00 | – |
| 11 | Formulated | 0.69 | 6.36 | X |
| 12 | Commercial | 0.65 | 7.39 | – |
| 13 | Commercial | 0.67 | 6.66 | – |
| 14 | Commercial | 0.71 | 6.27 | – |
| 15 | Wheat bran | 0.72 | 6.42 | X |
| 16 | Commercial | 0.68 | 6.70 | – |
| 17 | Formulated | 0.71 | 6.82 | – |
| 18 | Commercial | 0.67 | 6.33 | – |
| 19 | Formulated | 0.68 | 5.86 | – |
| 20 | Formulated | 0.86 | 6.02 | – |
| 21 | Commercial | 0.67 | 6.47 | X |
| Average | 0.72±0.06 | 6.27±0.51 | ||
The pH of the Surface silage samples showed large variations (4.55–7.48) across different farms. The pH of the Spot silage samples ranged from 4.46 to 7.42, while the pH of the Depth silage samples ranged from 4.37 to 6.98. Orange reverse colonies in AFPA medium occurred only in two silage samples and in five concentrated feed samples (Tables 2 and 3). In those samples, there were only one or a couple of colonies that were all used to obtain the isolates. Because of that, they were not counted.
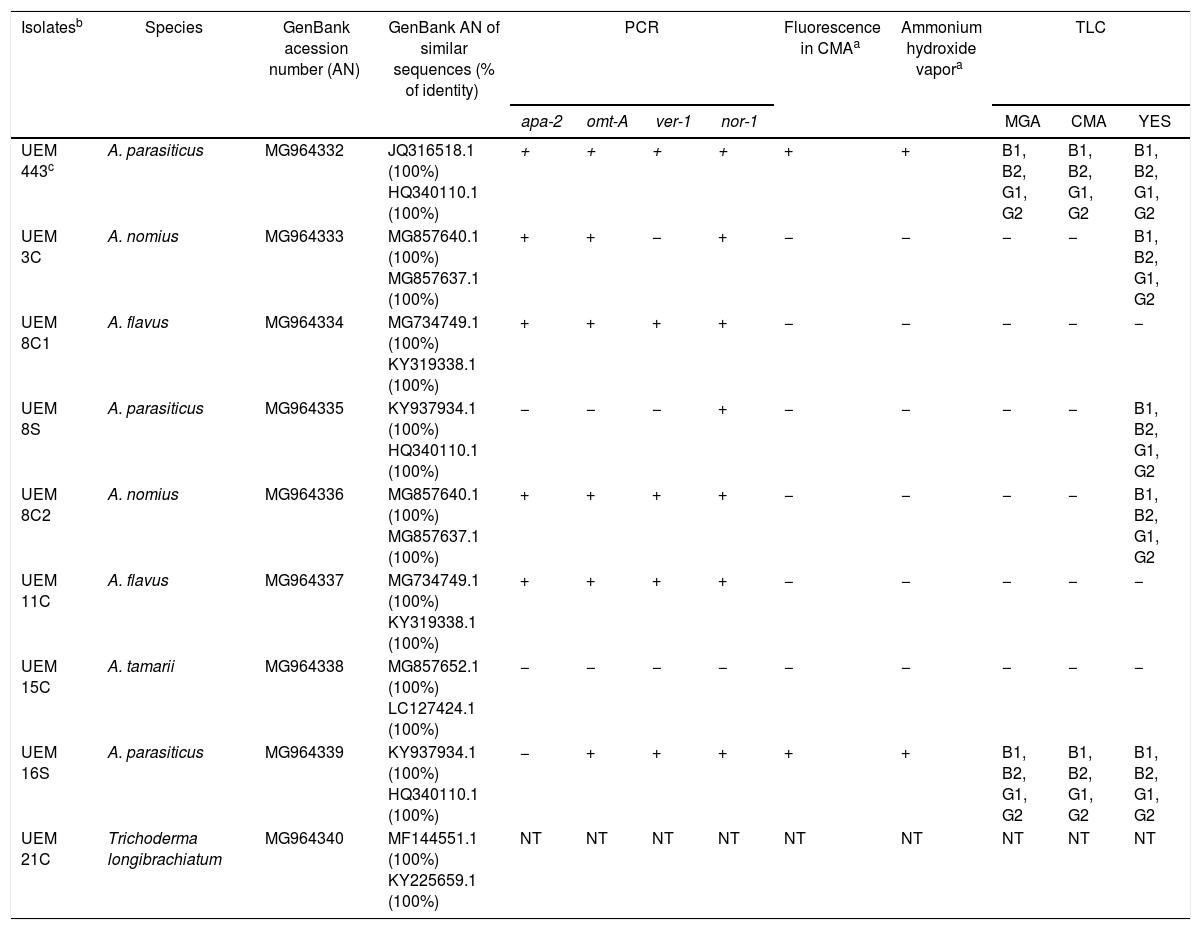
Eight monosporic fungi isolates were obtained and they are listed in Table 4. The features of the isolates such as colony color on PDA; formation and size of conidia; and characteristics of the vesicle, conidiophore, and phialide enabled us to classify seven of them in the genus Aspergillus and one of them in the genus Trichoderma.2
Identification and aflatoxin production analysis of the isolates.
| Isolatesb | Species | GenBank acession number (AN) | GenBank AN of similar sequences (% of identity) | PCR | Fluorescence in CMAa | Ammonium hydroxide vapora | TLC | |||||
|---|---|---|---|---|---|---|---|---|---|---|---|---|
| apa-2 | omt-A | ver-1 | nor-1 | MGA | CMA | YES | ||||||
| UEM 443c | A. parasiticus | MG964332 | JQ316518.1 (100%) HQ340110.1 (100%) | + | + | + | + | + | + | B1, B2, G1, G2 | B1, B2, G1, G2 | B1, B2, G1, G2 |
| UEM 3C | A. nomius | MG964333 | MG857640.1 (100%) MG857637.1 (100%) | + | + | − | + | − | − | − | − | B1, B2, G1, G2 |
| UEM 8C1 | A. flavus | MG964334 | MG734749.1 (100%) KY319338.1 (100%) | + | + | + | + | − | − | − | − | − |
| UEM 8S | A. parasiticus | MG964335 | KY937934.1 (100%) HQ340110.1 (100%) | − | − | − | + | − | − | − | − | B1, B2, G1, G2 |
| UEM 8C2 | A. nomius | MG964336 | MG857640.1 (100%) MG857637.1 (100%) | + | + | + | + | − | − | − | − | B1, B2, G1, G2 |
| UEM 11C | A. flavus | MG964337 | MG734749.1 (100%) KY319338.1 (100%) | + | + | + | + | − | − | − | − | − |
| UEM 15C | A. tamarii | MG964338 | MG857652.1 (100%) LC127424.1 (100%) | − | − | − | − | − | − | − | − | − |
| UEM 16S | A. parasiticus | MG964339 | KY937934.1 (100%) HQ340110.1 (100%) | − | + | + | + | + | + | B1, B2, G1, G2 | B1, B2, G1, G2 | B1, B2, G1, G2 |
| UEM 21C | Trichoderma longibrachiatum | MG964340 | MF144551.1 (100%) KY225659.1 (100%) | NT | NT | NT | NT | NT | NT | NT | NT | NT |
The molecular identification, which was carried out by sequencing the amplified 5.8S-ITS rDNA gene fragment and comparing with sequences deposited in GenBank, identified the isolates as shown in Table 4. The 5.8S-ITS rDNA sequences of the A. flavus and A. nomius isolates could not separate them. However, their aflatoxins production profile helped in their identification. The obtained sequences were deposited in GenBank and their accession numbers are listed in Table 4.
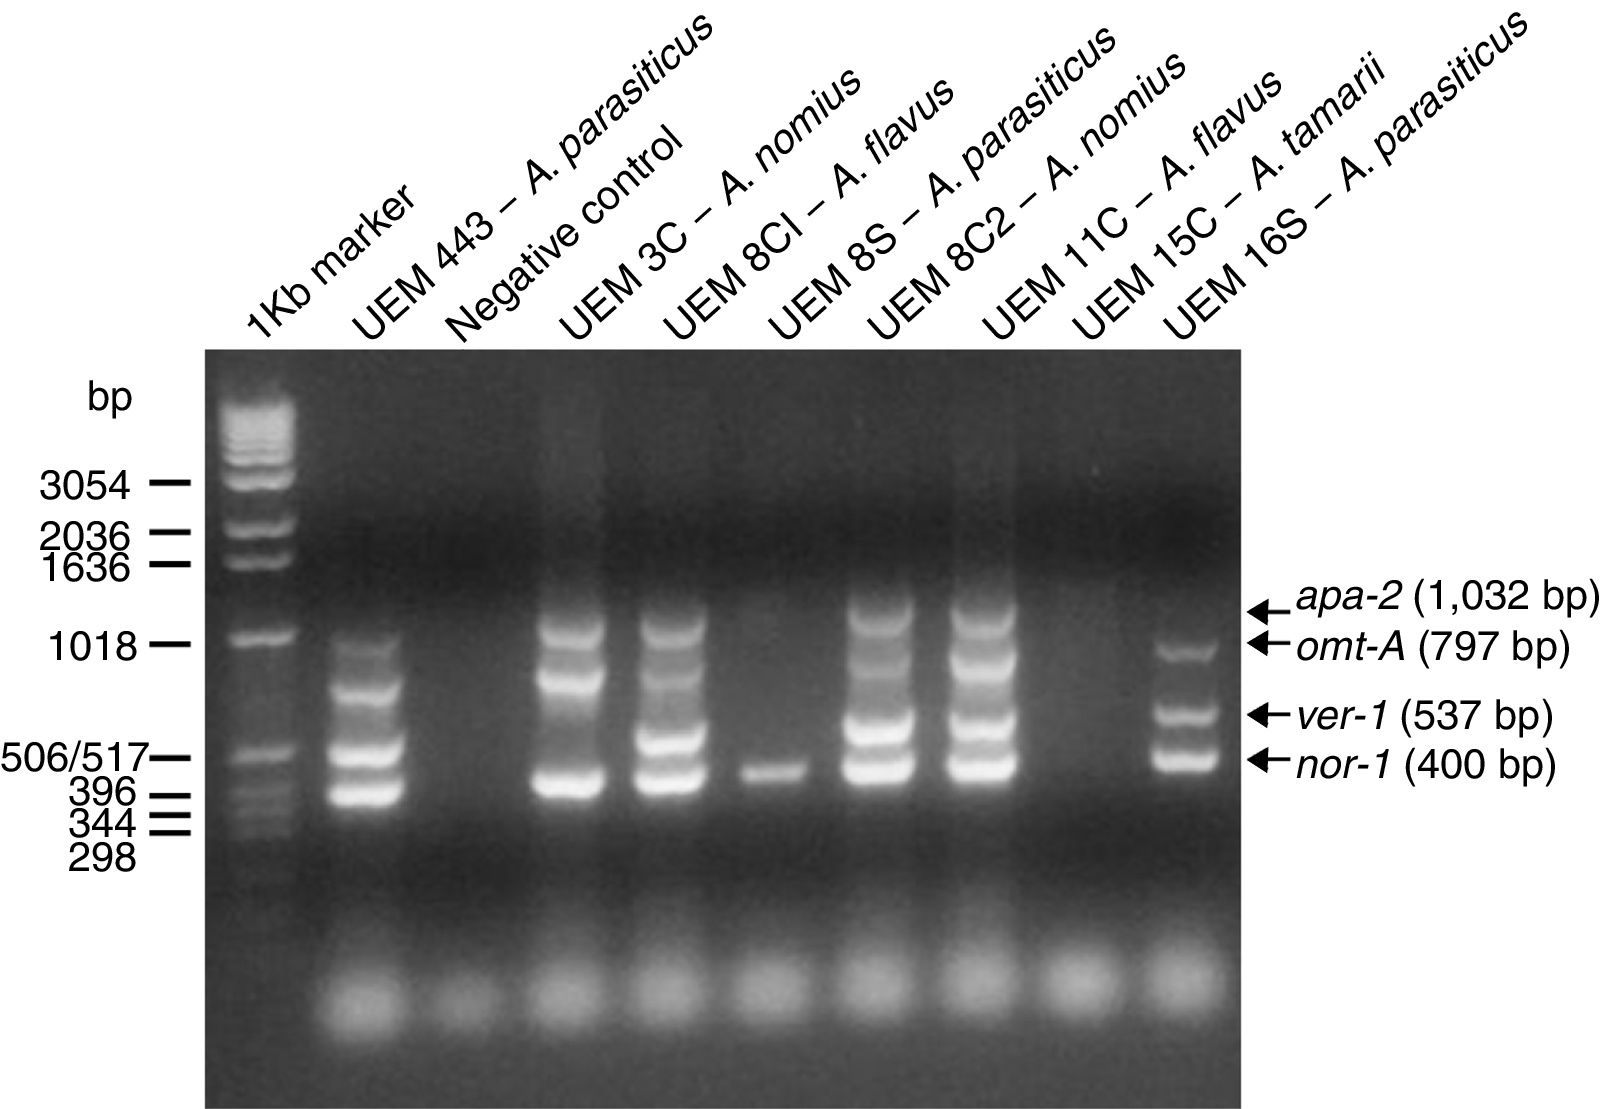
Detection of aflatoxin biosynthesis pathway genesThe multiplex PCR reactions results are shown in Fig. 1 and Table 4. The only gene that had a fragment amplified from all isolates’ genomic DNA was the nor-1 gene. The primers directed to the apa-2 and ver-1 genes have produced most of the negative reactions.
Aflatoxin production analysis stained with ethidium bromide. 1KB marker (Thermo Fisher Scientific, USA) is the molecular marker.")
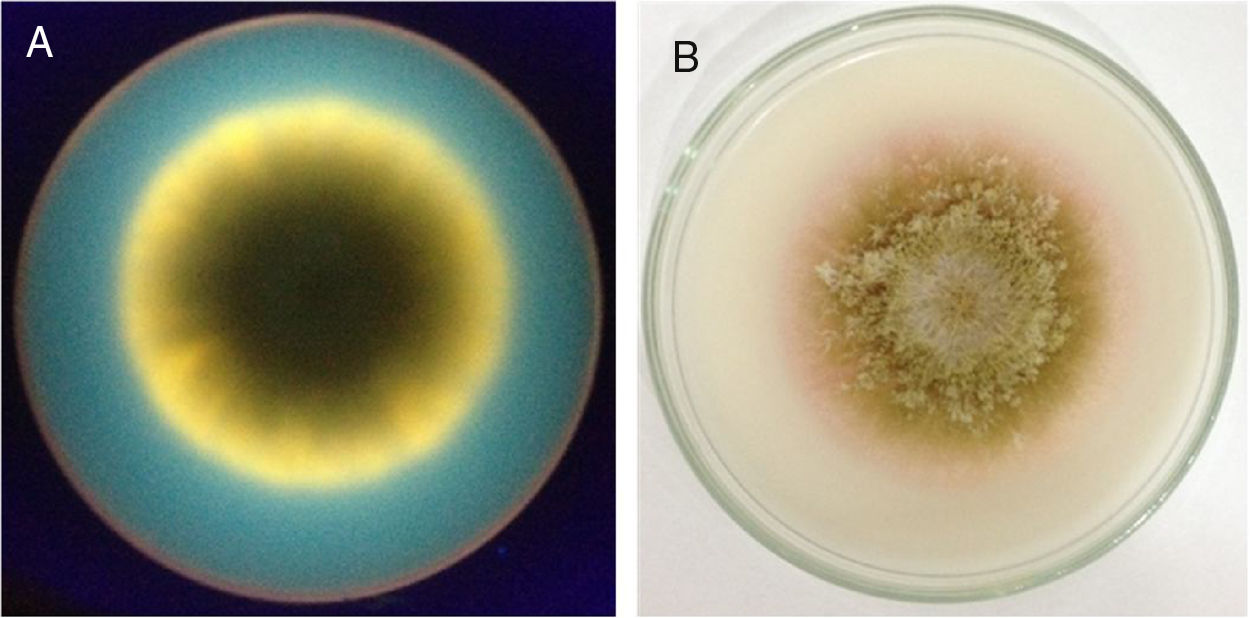
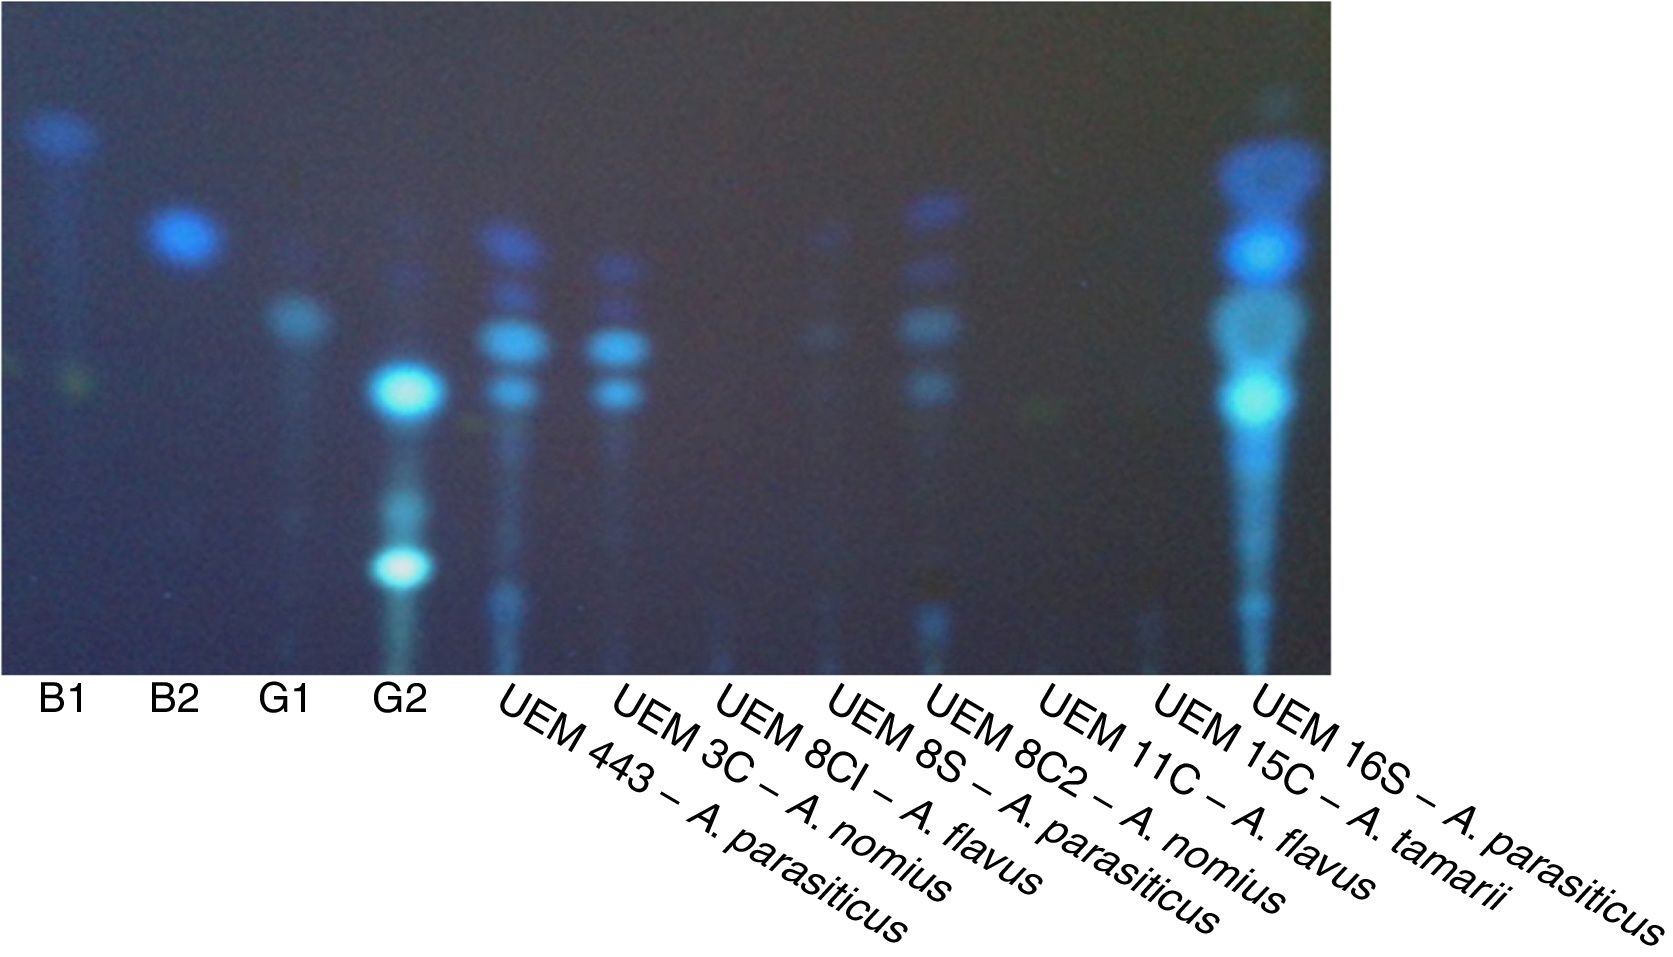
The results of the evaluation of aflatoxin production in specific culture medium and by TLC are listed in Table 4. A representative result of the fluorescence in CMA and color change of colonies by ammonium hydroxide vapor is shown in Fig. 2. A representative TLC chromatogram of the YES medium extracts is presented in Fig. 3.
 The back of a dish containing CMA medium with a colony of A. parasiticus UEM 16S photographed under UV light (312nm) in a transilluminator. (B) The front of a dish containing CMA medium with a colony of A. parasiticus 16S exposed to ammonium hydroxide vapor.")
Fluorescence in CMA and color change induced by ammonium hydroxide vapor. (A) The back of a dish containing CMA medium with a colony of A. parasiticus UEM 16S photographed under UV light (312nm) in a transilluminator. (B) The front of a dish containing CMA medium with a colony of A. parasiticus 16S exposed to ammonium hydroxide vapor.
 in a transilluminator. B1, B2, G1, and G2 are the standards (1.5μg) of aflatoxins (Sigma–Aldrich, Germany). The extract of A. parasiticus (UEM 443) reference isolate was also analyzed.")
A TLC plate with the extracts of the isolates grown in YES medium. The plate was photographed under UV light (312nm) in a transilluminator. B1, B2, G1, and G2 are the standards (1.5μg) of aflatoxins (Sigma–Aldrich, Germany). The extract of A. parasiticus (UEM 443) reference isolate was also analyzed.
There were no significant differences (α<0.05) in the water activities between the silage sub-samples: Surface, Depth, and Spot (Table 2). In addition, there was insignificant variation in water activities between the silage samples of different dairy farms. del Palacio et al. reported lower values for water activity in wheat silage (around 0.70).32 This could be attributed either to the different silage substrates or the methodology, wherein they evaluated the water activity by calculating the loss of mass after drying.32
According to the literature, the minimum level of water activity for the growth of A. parasiticus species and the production of aflatoxins is 0.83 (17%).4,33 The water activity results of the tested silage samples indicate that they could support A. parasiticus growth and aflatoxin production. In fact, the only two strains of A. parasiticus obtained in this work were isolated from silage samples. A. flavus causes maximum growth and aflatoxin production at higher values of water activity, ranging from 0.9 up to 0.99.4,33–35 The strains of A. flavus and A. nomius (an aflatoxigenic species phenotypically similar to A. flavus) obtained in this work were isolated from concentrated feed samples.36 Although the low water activity of concentrated feed samples should not support aflatoxin production by the aflatoxigenic Aspergillus species, the presence of Aspergillus indicates that they could grow and produce aflatoxin if the samples moisture increased.
Silage samples were more acidic than concentrated feed samples. A higher number of Silage Depth samples had pH values lower than 5.0, indicating the occurrence of fermentation processes, which are characteristic of well-preserved silage. Alonso et al. also reported more acidic pH in the central samples of maize silage.37 The optimum initial pH levels for aflatoxin production by A. parasiticus ranged from 5.0 to 7.0, with lower pH levels yielding more B1 toxin.34 The average pH of the obtained samples indicates that this fungus could grow in the samples and produce aflatoxins, provided that sufficient moisture is present.
After searching sequence databanks for DNA homologous to the obtained 5.8S-ITS rDNA sequences, a range of identity of 100% was determined (Table 4). Two monosporic isolates of aflatoxigenic A. parasiticus (UEM 8S and UEM 16S) were obtained from two silage Spot sub-samples (Table 2). Fungal development is not common in well-made and stored silages due to the biochemical processes that occur in the silo. However, fungi develop in conditions such as poor storage, which favors their growth. One condition which traditionally leads to the “spots” caused by the growth of fungi is the inadequate sealing of a silo or the presence of holes in the covering canvas. Two monosporic isolates of aflatoxigenic A. nomius (UEM 3C and UEM 8C2) and two monosporic isolates of non-aflatoxigenic A. flavus (UEM 8C1 and UEM 11C) were also obtained from three concentrated animal feed samples (Table 3). The higher incidence of aflatoxigenic Aspergillus in the concentrated feed samples compared with the silage samples may reflect the difference in the substrate material used in their preparation. In addition, the concentrated feed could also be contaminated during its preparation or due to inadequate storage facilities at the farms.
Fungal toxins generally are multi-ring structures and hence require a sequence of structural genes for their biological synthesis. Therefore, there is no specific PCR to detect aflatoxigenic Aspergillus species.38 Multiplex and single PCR systems have been used for detection of aflatoxigenic Aspergillus isolates, performed both as conventional and real-time PCR.17,23,25,26,29,39 The multiplex PCR system used in this work was already used to discriminate among aflatoxigenic and non-aflatoxigenic Aspergillus isolates.29,39 This reaction used the pair of primers APA-450 and APA-1482 designed by Shapira et al., which amplifies a DNA fragment of 1032bp of the A. parasiticus apa-2 gene, which codes for a transcription factor containing a zinc cluster DNA binding motif that activates aflatoxin B1 and B2 biosynthesis by controlling the expression of the nor-1 and ver-1 genes.25 Three other pairs of primers described by Geisen were also used: omt1 and omt2, which amplify a DNA fragment of 797bp from the A. parasiticus omt-A gene, that codes for the enzyme sterigmatocystin O-methyltransferase; ver1 and ver2, which amplify a DNA fragment of 537bp from the A. parasiticus ver-1 gene, which codes for the enzyme versicolorin A dehydrogenase; and nor1 and nor2, that amplify a DNA fragment of 400bp of the A. parasiticus nor-1 gene, which codes for the enzyme norsolorinic acid reductase.26
It has been proposed that the lack of amplification of DNA fragments of one of the tested genes may signify that the isolate has lost or mutated this gene. Three of the obtained isolates (A. flavus UEM 8C1, A. nomius 8C2, and A. flavus 11C) and the positive control (A. parasiticus UEM 443) had DNA fragments amplified from all four tested genes, indicating that they were potentially aflatoxigenic. Other three isolates had at least one DNA fragment amplified (A. nomius UEM 3C, A. parasiticus UEM 8S, and A. parasiticus UEM 16S), indicating that they could be aflatoxigenic. The isolate UEM 15C had no DNA fragment amplified from its genomic DNA with the used primers, what is in agreement with its molecular identification as A. tamarii, a species also belonging to the subgenus Circumdati section Flavi, but considered as a non-aflatoxigenic species.36
When the Aspergillus isolates were tested for the production of aflatoxins by evaluating the presence of fluorescence in CMA and development of pink color by ammonium hydroxide vapor, only the isolates A. parasiticus UEM 443 (control) and UEM 16S were observed to produce aflatoxins (Table 4, Fig. 2). TLC analysis of the extracts obtained after culturing these isolates in MGA, CMA, and YES indicated that they could produce all four aflatoxins (Table 4, Fig. 3). However, the other isolates either did not produce aflatoxins or only have produced in the YES medium. There are several factors that affect aflatoxins production such as temperature, pH, moisture, medium composition, time of culture, radiation and inoculum size.34 It is possible that the YES medium provided the best conditions for aflatoxins production by the isolates under the employed conditions of temperature, photoperiod, and time of culture. In agreement with the literature, the isolates of A. parasiticus UEM 8S and UEM 16S, and of A. nomius UEM 3C and UEM 8C2, produced all four aflatoxins in YES medium (Table 4, Fig. 3).4,36 The non-production of any aflatoxin by the isolates of A. flavus UEM 8C1 and UEM 11C also agrees with the literature, because it is known that 50% of the isolates of A. flavus are non-producers.3,4
Among the aflatoxin producer isolates found in this work, only the isolate A. parasiticus UEM 8S had solely one DNA fragment amplified in the PCR reaction. The other producer isolates had at least three if not all four tested genes amplified. The results suggest that the non-amplified genes may be mutated, disallowing PCR amplification with the used primers, but still coding functional proteins, considering that these isolates were able to produce the aflatoxins. These differences may reflect genetic variations among the isolates of A. parasiticus and A. nomius and indicate that the used pairs of primers do not have enough resolution to separate aflatoxigenic from non-aflatoxigenic strains. The fact that aflatoxin negative A. flavus strains presented amplification of all tested genes is intriguing, but this pattern was already reported in the literature.23,26
The presence of aflatoxigenic Aspergillus in animal feed has already been reported from other parts of Brazil and the world.32,40–43 The presence of aflatoxigenic A. parasiticus in silage and of aflatoxinogenic A. nomius in concentrated feed revealed by the present study represents a potential health risk to the animals and humans, because of the risk of secretion of M1 aflatoxins in milk by the bioconversion that occurs in the rumen. In addition, in 14.3% of the farms, the spotted silage was not discarded. Nevertheless, it is important to point out that the presence of aflatoxigenic A. parasiticus and A. nomius in animal feed, even under optimum conditions of development, does not imply actual proliferation and the presence of aflatoxins.
ConclusionIn this study, samples of silage and concentrated feed were collected from 21 dairy farms in Southern Brazil and analyzed for moisture, pH, and the presence of aflatoxigenic Aspergillus. The presence of aflatoxigenic A. parasiticus in two silage samples and of aflatoxigenic A. nomius in two concentrated feed samples is a potential cause of concern for animal and human health.
Conflicts of interestThe authors declare no conflicts of interest.
The authors are thankful to CAPES (Coordenação de Aperfeiçoamento de Pessoal de Nível Superior) of the Education Ministry and CNPq (Conselho Nacional de Desenvolvimento Científico e Tecnológico) of the Science and Technology Ministry of Brazil for the scholarship given to A.C.F. Variane, F.C. dos Santos, and F.F. de Castro. We also thank Araucária Foundation, the Paraná State Science, Technology and Superior Studies Secretariat for funding this work (Grant N° 12247/2013).