


Physico-chemical properties, structural characterization, and dissolution behaviors of four phosphate glasses modified by incorporating zinc, boron, and copper, acting as eco-friendly fertilizers with controlled release of macro and micronutrients for wheat plants, were investigated. The elaborated glasses were characterized by differential thermal analysis, density measurements, X-ray diffraction, FTIR spectroscopy, and Raman spectroscopy. The dissolution behaviors were investigated using weight and pH measurements. The ionic concentration of leachate solutions was determined using ICP-OES. Results proved that the glass's chemical composition and lattice structure play the mean role in controlling the release of nutrients from the glass. The seemingly different properties between the elaborated glasses depend on the strength's bonds of glass lattice-formers and modifiers as well as their ionic field strength of the incorporated elements. An agronomic valorization was carried out to evaluate the efficiency of these agriglasses on wheat crops. It revealed a positive impact on wheat growth, yield, photosynthetic parameters, and grain mineral content with improvement values ranging from 4 to 89% compared to conventional fertilizers. These results pave the way to applying these fertilizers in large-scale experimentation to confirm their potentiality in crop production and as eco-friendly fertilizers.
Se investigaron las propiedades fisicoquímicas, la caracterización estructural y el comportamiento de disolución de cuatro vidrios de fosfato modificados mediante la incorporación de zinc, boro y cobre, que actúan como fertilizantes ecológicos con liberación controlada de macro y micronutrientes para las plantas de trigo. Los vidrios elaborados se caracterizaron mediante análisis térmico diferencial, mediciones de densidad, difracción de rayos X, espectroscopia FTIR y espectroscopia Raman. Los comportamientos de disolución se investigaron mediante mediciones de peso y pH. La concentración iónica de las soluciones de lixiviado se determinó mediante ICP-OES. Los resultados demostraron que la composición química del vidrio y la estructura de la red juegan un papel importante en el control de la liberación de nutrientes del vidrio. Las propiedades aparentemente diferentes entre los vidrios elaborados dependen de la fuerza de los enlaces formadores de redes de vidrio y de los modificadores, así como de la fuerza del campo iónico de los elementos incorporados. Se llevó a cabo una valorización agronómica para evaluar la eficacia de estos fertilizantes en el cultivo de trigo. Reveló un impacto positivo el crecimiento del trigo, el rendimiento, los parámetros fotosintéticos y el contenido mineral del grano, con valores de mejora que van del 4 al 89% en comparación con los fertilizantes convencionales. Estos resultados allanan el camino para aplicar estos fertilizantes en la experimentación a gran escala para confirmar su potencialidad en la producción de cultivos y como fertilizantes ecológicos.
Although the United Nations forecasts estimate that the population living on the planet is expected to increase by 2 billion by 2050, from 7.8 to 9.7 billion [1], the arable land per person is declining dramatically; the area of arable land available will have decreased by 25% in 2050 compared to 1960 according to research carried out by the National Institute for Agronomic Research [2]. This inequality requires an increase in agricultural productivity through the use of fertilizers to meet the nutritional needs of a growing population [3]. In this sense, intensive agriculture uses fertilizers and pesticides to ensure the need for nutrients and control plant diseases, and improve yields. The unbalanced use of fertilizers results in a decrease in nutrient utilization efficiency and can have a negative impact on natural ecosystems [4–6]. Generally, an “ideal” fertilizer must release nutrients only based on the plant's demand, depending on its phenological stage. It must maintain the availability of these elements throughout the growing season and beyond. Controlled-release fertilizers, especially vitreous fertilizers, are promising “green technologies” to support global food security and limit the environmental risks related to the misuse of conventional fertilizers. Faced with the population explosion and the reduction in the area of agricultural land, the use of this category of fertilizer is starting to have attention [7]. Vitreous fertilizers ensure nutrient mobilization according to plants’ specific needs during their development cycle, which promotes their optimal growth [8].
Phosphate glass is very appealing for controlled release systems due to its low chemical durability, which can be engineered to have a wide solubility range, from a few hours to several years, by adjusting its composition, which leads to structural changes [9,10]. Phosphate glasses’ chemical durability also relies on the field strength, charge, and size of the modifier cation incorporated within the glass matrix [11].
Otherwise, wheat is an essential crop with many purposes due to its widespread use as human and animal feed [12,13]. In this context and in order to sustain food security, improving wheat production is currently regarded as a significant challenge around the world [14,15]. Wheat productivity in Morocco and other North African countries is hampered by a variety of abiotic and biotic stresses, including high temperatures, drought, soil poverty in organic and mineral matter, leaf rust, and altered soil physical characteristics, particularly the decline of cropland resources, which is already severely restricting crop yields in these countries [16–18]. Morocco's wheat production is estimated to be 2,561,898tons in 2020, with an arable area of 2,845,290hectares. Morocco imported 5,848,817tons of wheat in the same year to meet its needs, making it the world's 10th largest grain importer, up 48.2% from 2019 [19].
Several studies have been reported on the use of phosphate glass as a controlled fertilizer. These studies usually lack extensive information on degradation behavior. They are usually restricted to a single glass system, relatively high melting temperatures, low microelement uptake, and fairly a modest agronomic study limited to a simple description of the growth parameters. According to wheat nutrient requirements, four phosphate glass formulations (AGF0–AGF1–AGF2–AGF3) were developed in this study: AGF0 contains just primary and secondary nutrients (P2O5-K2O-CaO-MgO), AGF1 and AGF2 contain zinc and boron, respectively, while AGF3 has copper. The influence of these elements on physicochemical qualities (density and molar volume), glass structure, thermal properties, and dissolving behavior were investigated in order to determine their potential for use as controlled-release fertilizers. Agronomic valorization was also carried out in the greenhouse to evaluate the agronomic potential of the selected agriglass fertilizers on wheat growth, yield, photosynthesis, grain mineral content, and soil physicochemical parameters.
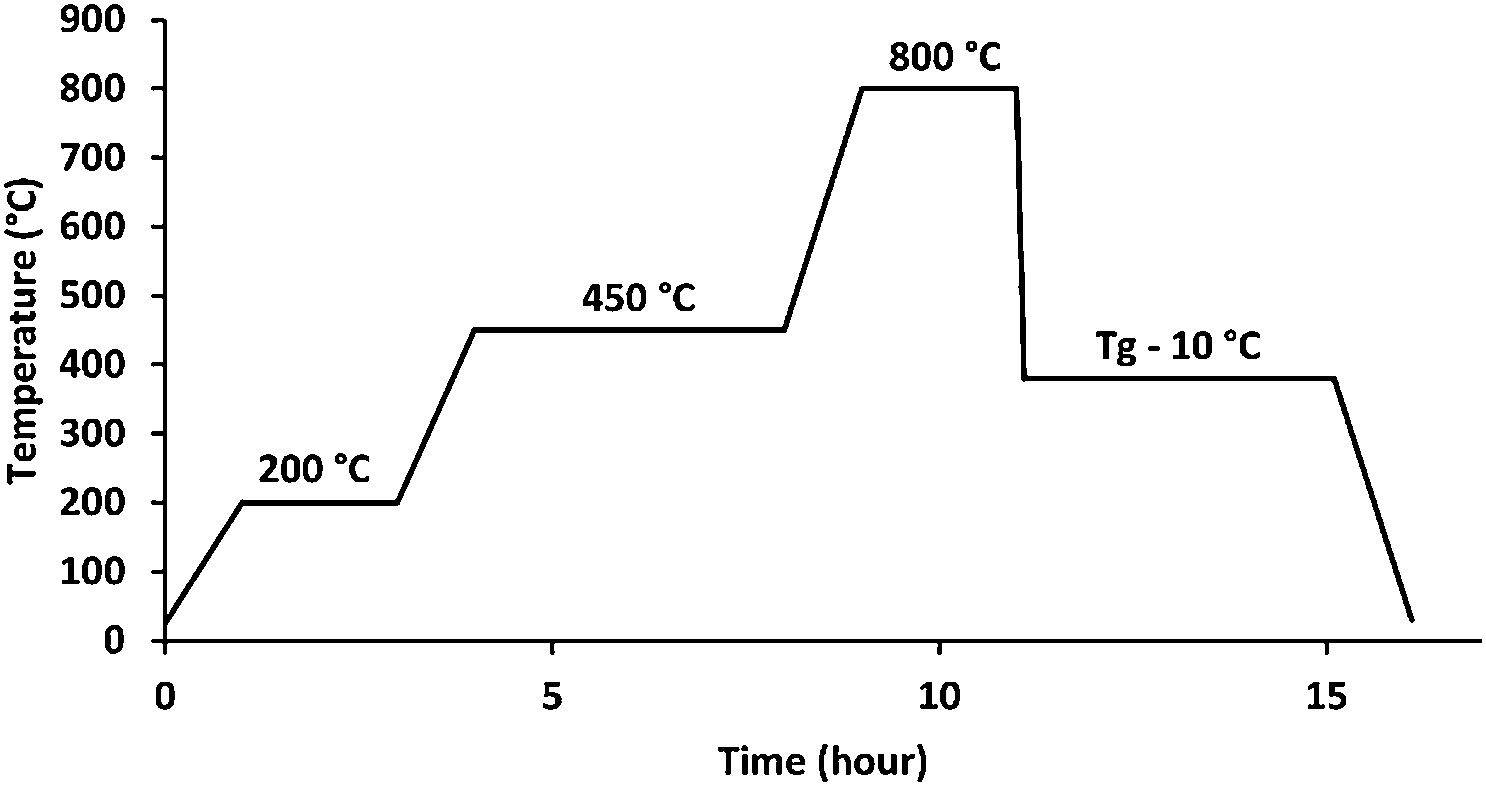
Materials and methodsGlass synthesisThe melt quenching process was used to make the glass samples, which included as starting materials CaCO3, K2CO3, NH4H2PO4, MgO, ZnO, H3BO3, and CuO. The batch components were precisely weighed, finely ground, and fully mixed in an agate mortar before being deposited in an alumina crucible. To avoid NH4H2PO4 foam and to remove CO2, NH3, and H2O from the decomposition of the starting components, the batches were cooked for 2h at 200°C and 4h at 450°C. Fig. 1 shows these steps in addition to the melting step, which lasted 2h at 800°C [20].

The melted liquids were taken out of the furnace and poured onto a carbon mold to cool in the air. All of the samples were annealed for 4h at 10°C below their transition temperature before being progressively cooled to room temperature. The final glass compositions were determined using inductively coupled optical emission spectroscopy (ICP-OES Ultima Expert, Horiba Inc., Ontario, Canada).
To validate the glasses’ amorphous nature, an X-ray diffraction examination was performed (with a PANAanalytical XPERT diffractometer operating at 40kV/200mA, the angular range 10°–70°(2) was scanned with a step size of 0.07°(2) and a counting time of 5s/step).
Thermal analysisThe thermal properties of glass samples were determined using a thermal analyzer (STA PT 1600, Linseis, Germany). Temperatures of the glass transition (Tg), the onset of crystallization (Tc,on), and the melting (Tm) were determined in an alumina crucible by heating samples at a rate of 10°Cmin−1 from ambient temperature to 800°C. Glass stability against crystallization is indicated by a value, KH, according to Hruby [21]. KH=(Tc,on−Tg)/(Tliq−Tc,on) is the formulae for this parameter. Glasses with higher KH values, according to Hruby, have better stability against crystallization on heating and, presumably, better vitrifiability on cooling.
Density measurementsAt room temperature, the density of the glass was evaluated using the Archimedes technique with diethyl-ortho-phthalate as the buoyant liquid. The density of the glass was determined using the conventional buoyancy test technique (ASTM C693). The mass of the glass sample was evaluated both in air and after immersion in diethyl-ortho-phthalate. The density was determined using the following equation [22]:
with: ρglass=glass density; Wglass=weight of glass measured in air; Wortho=weight of diethyl-ortho-phthalate only; Wortho+glass=weight of glass immersed in diethyl-ortho-phthalate; ρortho: diethyl-ortho-phthalate density=1.11422g/cm3.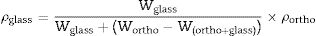
The measurements were performed three times to get an average density value.
The molar volume (VM) was obtained using the equation from the density data and molecular glass weight of the batch composition: VM=ρglass/Mglass with Mglass as the glass's molar mass [23].
Characterization of glass structureThe structure of the glass was analyzed using Fourier transform infrared spectroscopy and Raman spectroscopy. FTIR spectra in the 400–4000cm−1 region were acquired using the KBr method on a Bruker VERTEX 70 spectrometer with a resolution of 4cm−1 and 32 scans per determination. Glass fine powder samples were mixed in a ratio of (0.01/0.99g) with KBr.
The Raman spectrum was obtained by examining glass powder with the Confotec MR520 Raman Confocal Microscope. An Ar ion laser's 514nm line was employed as the excitation source. The spectra were collected in the 400–4000cm−1 range using a 10-objective and a 1-s exposure time in the micro-Raman compartment.
Glass dissolutionThe glasses were ground in a ball mill (Pulverisette 6, Fritsch, France) and then sieved through two sieves with varied mesh sizes of 1 and 2mm. To evaluate their chemical stability, 1g of glass powder was added to a flask holding 20mL of distilled water. The initial pH value of the solution is 6.5. Ten samples of each composition were made and placed in a thermostatic bath set to 25°C to measure the rate of release for a period ranging from 1 to 35 days.
The solution was filtered and the pH was determined using an Adwa AD8000 digital pH meter. After drying the residual glass at 90°C for 10h, it was weighed using an analytical balance with a sensitivity of 0.1mg (Shimadzu AW220). The following formulae was used to get the percentage of weight reduction [24]:
where Wi and Wt represent the initial and final weights of the sample.
The ionic concentration of leachate solutions was determined using inductively coupled optical emission spectroscopy.
Evaluation of the glass fertilizers agronomic potentialPlant material and experimental designTo assess the effect of the prepared glass fertilizers (GF) on wheat performances, a pot experiment was performed in the greenhouse with a 25.5°C temperature average, 68.5% relative humidity average, a day/night cycle of 16/8h, and 410m−2s−1 photon flux density average. The experiment lasted from 18 January 2021 to 8 May 2021. The agronomic valorization was performed for the AGF1, AGF2, and AGF3 formula, whereas the AGF0 formulae was already performed in a previous study [24]. The experiment was carried out using two doses of the obtained glass fertilizers (AGF D1=0.3 and AGF D2=1g/plant) and a recommended dose of conventional chemical fertilizer (NPK) (140kgNha−1 as ammonium nitrate+80kgP2O5ha−1 as superphosphate+50kgK2Oha−1 as potassium sulfate) [25].
The substrate used in this experiment was a field soil sampled from the district of Saada (10km Southwest of Marrakesh, Morocco). The soil physicochemical parameters are as follow: sand, 51%; loam, 30%; clay, 19%; pH, 7.92; electrical conductivity (EC), 1.72mScm−1; total organic carbon, 0.80%; organic matter, 1.3% and available phosphorus, 31mgkg−1.
Wheat (Triticum durum L. cv. Carioca) seeds were sterilized for 10min by immersion in a 10% sodium hypochlorite solution and then rinsed five times with sterile distilled water. Seeds germination was carried out in plastic dishes containing a sterile filter paper disk with incubation for seven days at 28°C in the dark. One week after germination (day 0 of sowing), seedlings were transplanted into 2L plastic pots (1 seedling and 1.9kg of soil/pot) with the application of the different treatments.
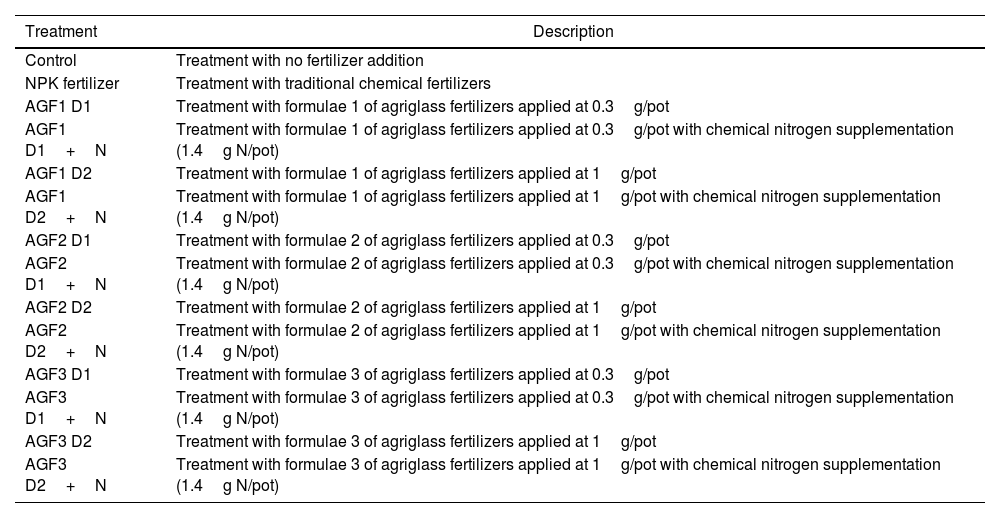
In this experiment, 14 treatments were applied as described in Table 1. The chemical nitrogen supplementations were performed by adding ammonium nitrate. Ten replicates for each treatment were randomly disposed for a total of 140 pots. Pots irrigation was performed twice a week with the same amount of distilled water to maintain a field capacity of about 75%.
The applied treatments and their description.
| Treatment | Description |
|---|---|
| Control | Treatment with no fertilizer addition |
| NPK fertilizer | Treatment with traditional chemical fertilizers |
| AGF1 D1 | Treatment with formulae 1 of agriglass fertilizers applied at 0.3g/pot |
| AGF1 D1+N | Treatment with formulae 1 of agriglass fertilizers applied at 0.3g/pot with chemical nitrogen supplementation (1.4g N/pot) |
| AGF1 D2 | Treatment with formulae 1 of agriglass fertilizers applied at 1g/pot |
| AGF1 D2+N | Treatment with formulae 1 of agriglass fertilizers applied at 1g/pot with chemical nitrogen supplementation (1.4g N/pot) |
| AGF2 D1 | Treatment with formulae 2 of agriglass fertilizers applied at 0.3g/pot |
| AGF2 D1+N | Treatment with formulae 2 of agriglass fertilizers applied at 0.3g/pot with chemical nitrogen supplementation (1.4g N/pot) |
| AGF2 D2 | Treatment with formulae 2 of agriglass fertilizers applied at 1g/pot |
| AGF2 D2+N | Treatment with formulae 2 of agriglass fertilizers applied at 1g/pot with chemical nitrogen supplementation (1.4g N/pot) |
| AGF3 D1 | Treatment with formulae 3 of agriglass fertilizers applied at 0.3g/pot |
| AGF3 D1+N | Treatment with formulae 3 of agriglass fertilizers applied at 0.3g/pot with chemical nitrogen supplementation (1.4g N/pot) |
| AGF3 D2 | Treatment with formulae 3 of agriglass fertilizers applied at 1g/pot |
| AGF3 D2+N | Treatment with formulae 3 of agriglass fertilizers applied at 1g/pot with chemical nitrogen supplementation (1.4g N/pot) |
After four months from germination (110 days after sowing), plants were harvested, and growth and yield traits were measured, including plant height, root length, leaf area, number of leaves, ears, shoot and root dry weight, weight and number of grains, and the weight of 1000 grain. Dry weight measurements were recorded after the plant samples were kept at 105°C for 24h.
Stomatal conductance and photosynthetic efficiencyFully expanded leaves from the same rank were used for stomatal conductance and photosynthetic efficiency measurements, where five plants were used for each treatment.
The stomatal conductance measurements (gs) were recorded on a sunny day before harvest (108 days after sowing) using a porometer system (Leaf Porometer LP1989, Decagon Device, Inc., Washington, DC, USA).
Photosynthetic efficiency values were obtained using a portable fluorometer (Optisciences OSI 30p). Leaves were kept in the dark for 30min using leaf clips, and then the measurements were recorded. Photosynthetic efficiency was evaluated as Fv/Fm ratio where Fv=Fm−F0 and Fm and F0 are maximum and initial fluorescence, respectively [26].
Soil analyses and wheat grain mineral contentSoil samples were collected, for each treatment, before and after the experiment. The determination of soil texture was carried out following the Robinson protocol [27]. Samples pH and EC were determined using a 1:5 (w:v) aqueous solution. Soil and wheat grain mineral content was measured according to Segarra [28]. Dried material (50mg) was digested in 1mL of HNO3, 0.6mL of H2O2, and 1mL of deionized water for 48h at 90°C. Then, the mixture was diluted using deionized water (10mL final volume). N, P, K, Mg, Ca, Fe, Mn, Zn, B, and Cu concentrations were measured using inductively coupled plasma-atomic emission spectroscopy (ICP-OES).
Statistical analysisData were presented as mean values based on three to five replicates ±standard error (SE). Statistical analysis was performed using SPSS software (IBM Corp. Released 2013. IBM SPSS Statistics for Windows, Version 22.0. Armonk, NY, USA: IBM Corp.) package for Windows. One-way analysis of variance (ANOVA) as performed for all data and the differences among means were assessed using Student–Newman–Keuls (SNK) test calculated at p<0.05.
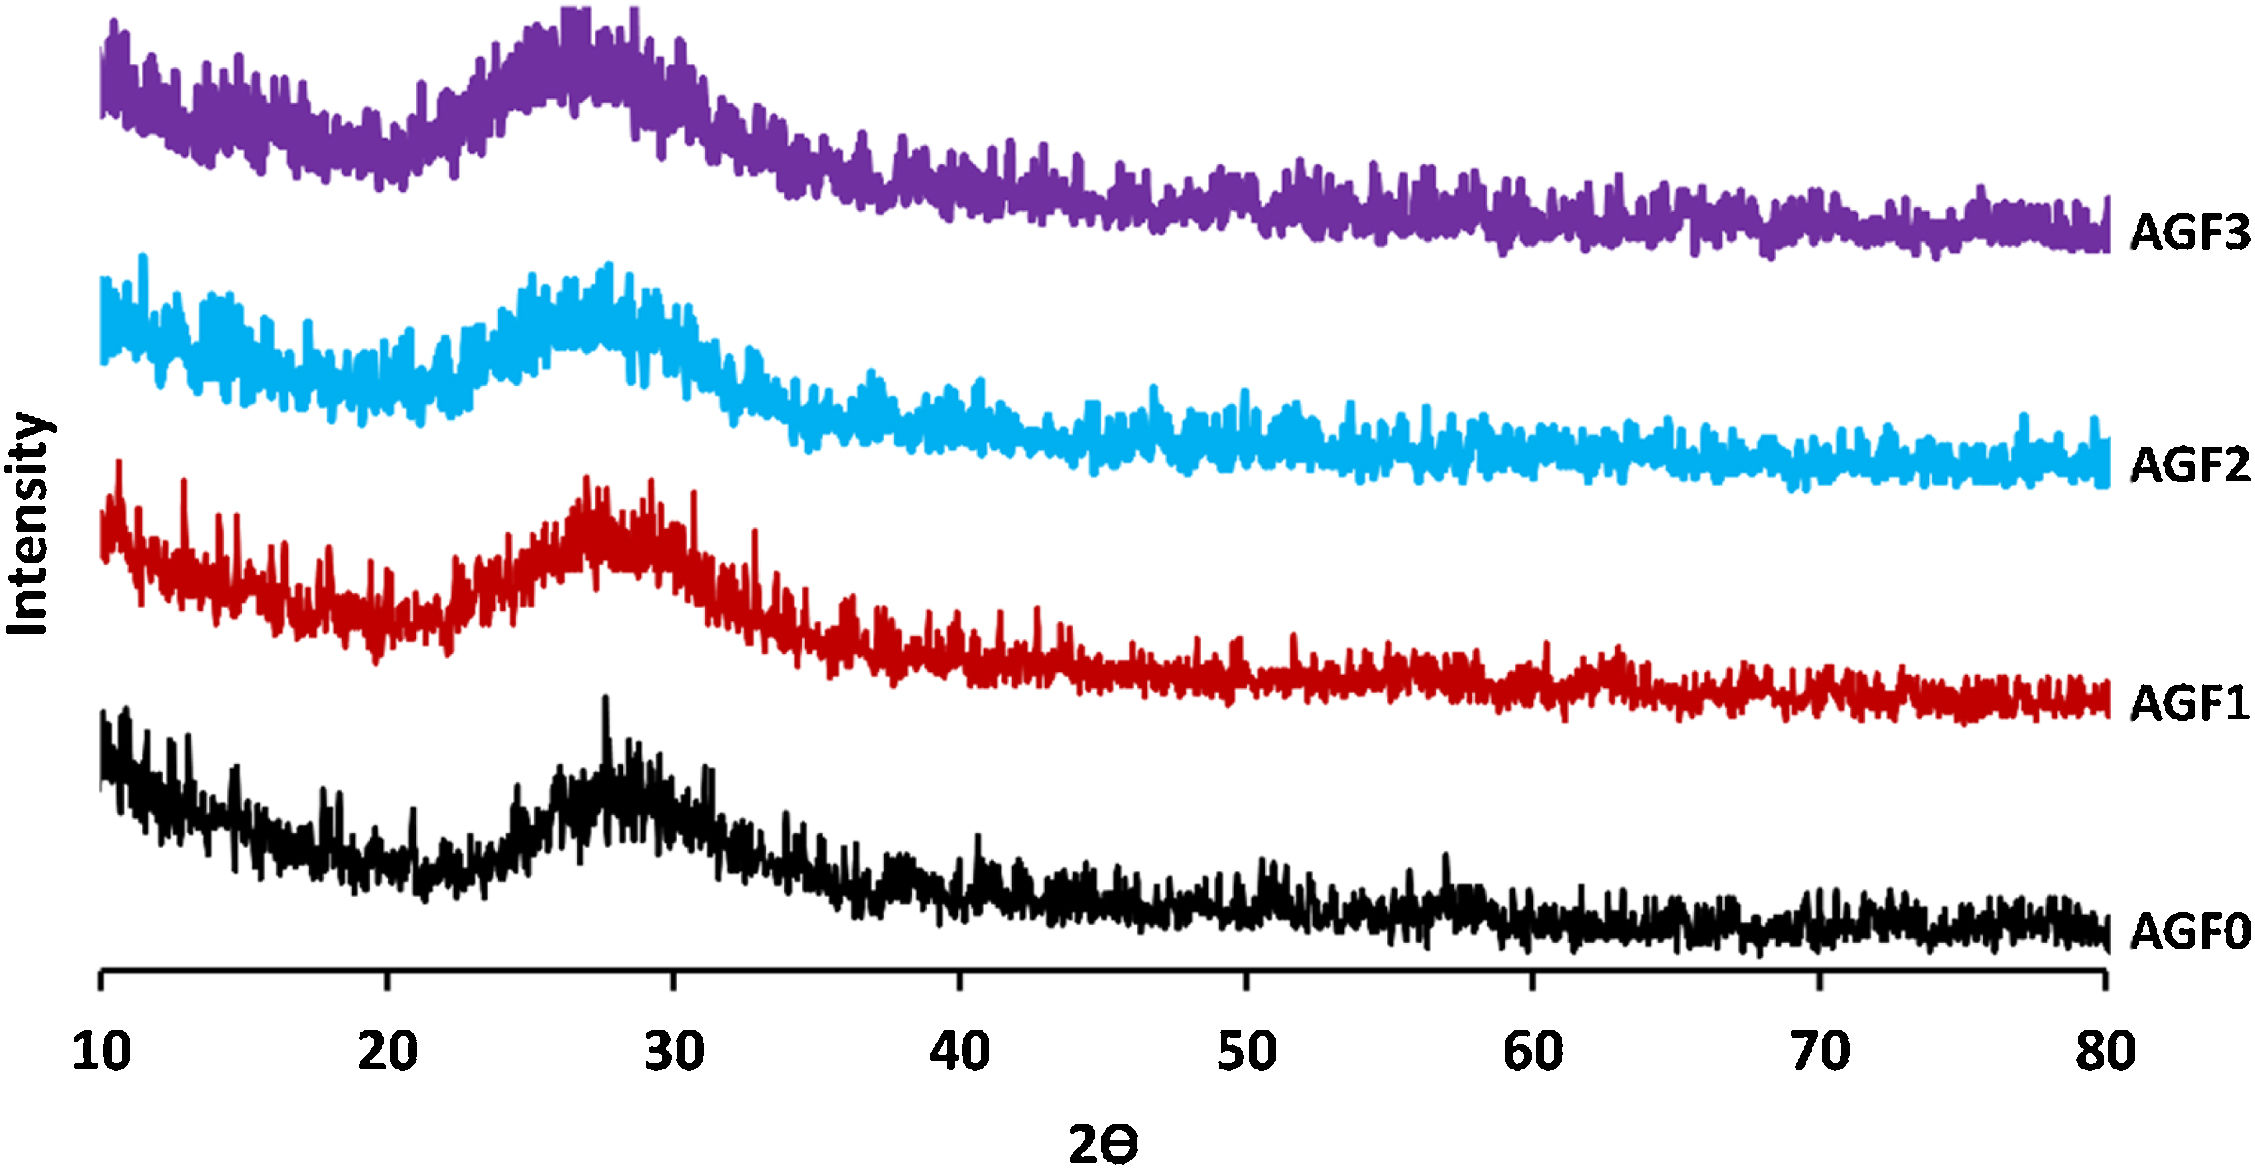
Results and discussionGlass formationThe XRD patterns of all samples support their amorphous nature, as shown in Fig. 2, there is no sharp peak in the diffraction patterns [29]. The entire surface of the glasses was stable and homogeneous.

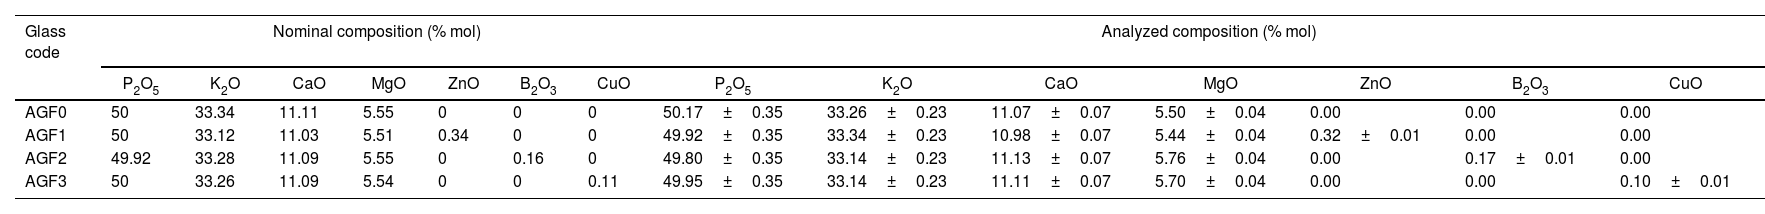
Few bubbles were observed, and all the obtained glasses were transparent. AGF0, AGF1, and AGF2 were colorless, while AGF3 was blue. The blue color of AGF3 phosphate glass suggested the presence of Cu2+ ions [30]. The analyzed compositions of the studied glasses (Table 2). For all glasses, there were some modest discrepancies between nominal and measured compositions, which can be attributable to measurement errors and volatilization during the heating treatment.
Nominal and analyzed compositions of the studied glasses.
| Glass code | Nominal composition (% mol) | Analyzed composition (% mol) | ||||||||||||
|---|---|---|---|---|---|---|---|---|---|---|---|---|---|---|
| P2O5 | K2O | CaO | MgO | ZnO | B2O3 | CuO | P2O5 | K2O | CaO | MgO | ZnO | B2O3 | CuO | |
| AGF0 | 50 | 33.34 | 11.11 | 5.55 | 0 | 0 | 0 | 50.17±0.35 | 33.26±0.23 | 11.07±0.07 | 5.50±0.04 | 0.00 | 0.00 | 0.00 |
| AGF1 | 50 | 33.12 | 11.03 | 5.51 | 0.34 | 0 | 0 | 49.92±0.35 | 33.34±0.23 | 10.98±0.07 | 5.44±0.04 | 0.32±0.01 | 0.00 | 0.00 |
| AGF2 | 49.92 | 33.28 | 11.09 | 5.55 | 0 | 0.16 | 0 | 49.80±0.35 | 33.14±0.23 | 11.13±0.07 | 5.76±0.04 | 0.00 | 0.17±0.01 | 0.00 |
| AGF3 | 50 | 33.26 | 11.09 | 5.54 | 0 | 0 | 0.11 | 49.95±0.35 | 33.14±0.23 | 11.11±0.07 | 5.70±0.04 | 0.00 | 0.00 | 0.10±0.01 |
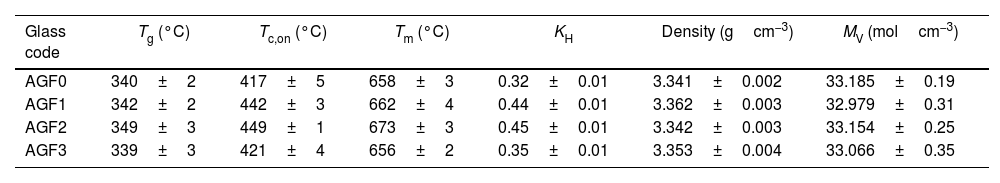
Table 3 lists the temperatures for the glass transition (Tg), onset crystallization (Tc,on), and melting (Tm) acquired from DTA curves for the prepared glasses. The thermal properties of glass AGF3 are similar to those of glass AGF0, indicating that the amount of CuO included in the glass matrix had no effect. Because of the ionic field strength of zinc and boron (IFS=z/r2, where z is the valence cation and r is the ionic radius), glass AGF2 has greater values of Tg, Tc,on, and Tm than glass AGF1, being IFS equal to 0.59 for Zn and 1.34 for B, according to Dietzel [31]. The increase in the thermal properties, especially Tg values, which is determined by the amount and strength of cross-links between the cation and oxygen atoms, as well as the density of covalent cross-linking, is critical for understanding the physical characteristics of glasses. This augmentation in Tg indicates that the structure is becoming stronger and the lattice is becoming more stable [32]. Furthermore, it has been found that ZnO-based glasses have a low glass transition temperature among the large class of phosphate glasses [33]. With this in mind, it was projected that adding ZnO to the glass formulation would have no significant effect on the glass's thermal properties.
Glass transition (Tg) crystallization (Tc,on) melting (Tm) temperatures, KH, density, and molar volume (VM) of prepared glasses.
| Glass code | Tg (°C) | Tc,on (°C) | Tm (°C) | KH | Density (gcm−3) | MV (molcm−3) |
|---|---|---|---|---|---|---|
| AGF0 | 340±2 | 417±5 | 658±3 | 0.32±0.01 | 3.341±0.002 | 33.185±0.19 |
| AGF1 | 342±2 | 442±3 | 662±4 | 0.44±0.01 | 3.362±0.003 | 32.979±0.31 |
| AGF2 | 349±3 | 449±1 | 673±3 | 0.45±0.01 | 3.342±0.003 | 33.154±0.25 |
| AGF3 | 339±3 | 421±4 | 656±2 | 0.35±0.01 | 3.353±0.004 | 33.066±0.35 |
As demonstrated in Table 2, adding microelements to the phosphate glass matrix raised KH from 0.319 for AGF0 to 0.445, 0.447, and 0.35 for AGF1, AGF2, and AGF3 glasses, respectively. Because the presence of these oxides enhances the lattice by establishing cross-links between phosphate chains, the thermal stability of the examined glasses is higher than that of the microelements-free glass sample [32].
Glass density and molar volumeThe measured densities and computed molar volumes of the examined glasses are summarized in Table 3. Glass density changes could indicate the vitreous lattice's structural compactness; it is sensitive to spatial arrangement and atom nature [34,35]. However, because most of the microelements introduced are glass modifiers (except for B2O3), and are mostly concentrated in the holes in the glass lattice, these modifications were modest and unlikely to be significant in this study. Molar volume, which measures the volume filled by a single mole of glass, is more sensitive to changes in the glass structure than density. It normalizes the atomic masses of glass constituents [23]. By integrating microelements, the molar volume decreases, indicating that the glass structure becomes more compact [32]. Furthermore, the decrease in VM followed by an increase in Tg most likely represents an overall increase in glassy matrix cross-linking [36]. The regular decrease in the molar volume for the manufactured glasses is strongly related to the kind of bending in the glass structure, because P–O–X (X=Zn, B, or Cu) bridges are more ionic than P–O–P bridges, implying the vitreous lattice's compactness. However, because boron has a greater IFS than zinc, it was expected that the MV of AGF2 glass would be lower than AGF1 glass. Nonetheless, since B2O3 is a lattice forming, the molar volume numbers may not always accurately represent the true compactness inside the glass structure [37].
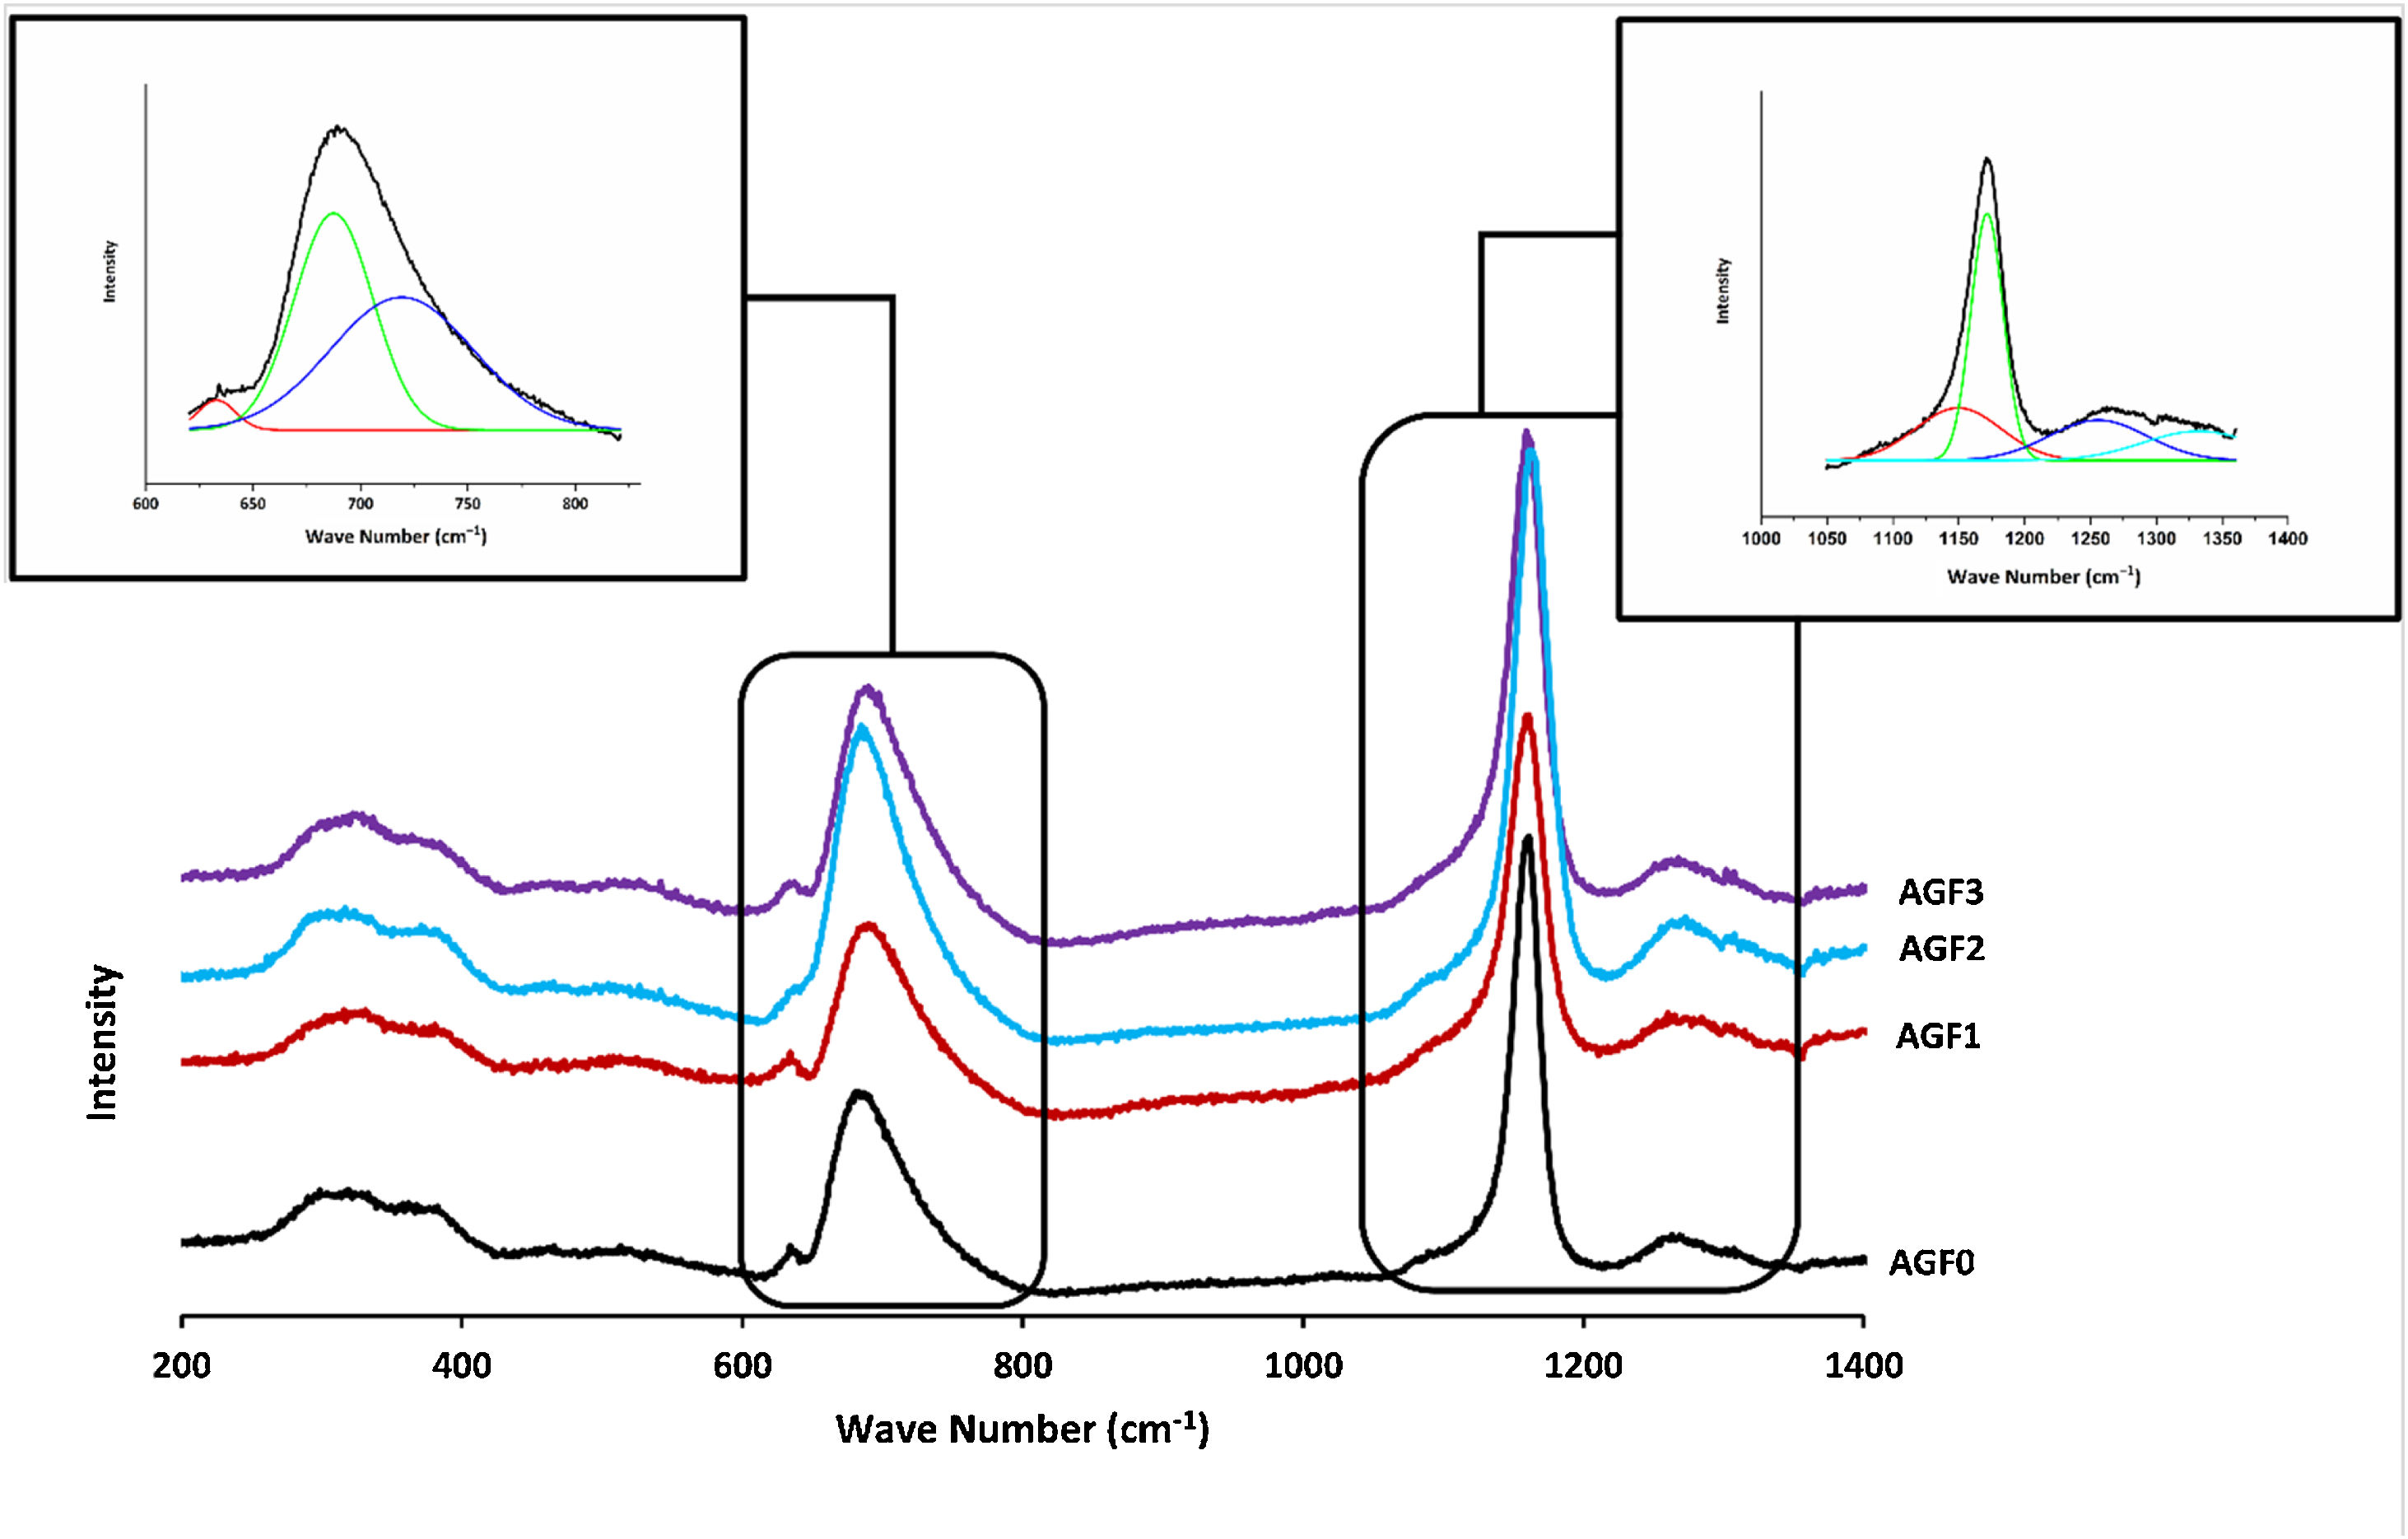
Glass structureFig. 3 shows the Raman spectra of the four phosphate glasses in the frequency range of 200 to 1400cm−1. The phosphate lattice is made up of phosphate tetrahedral units, which are characterized by the number of bridging oxygen atoms per tetrahedron using the Qn terminology, where n indicates the number of bridging oxygen atoms per tetrahedron (n=0, 1, 2, 3) [38].

All Raman spectra showed strong features around 1160 and 690cm−1, which can be deconvoluted using Gaussian lines to recover additional component bands, as illustrated in Fig. 3. Around 1270, 1090, 700, and 320–400cm−1, other weaker features can be seen. The band at roughly 1320cm−1 is assigned to the symmetric stretching of the (PO) bond in Q3 groups [39,40]. The asymmetric stretching of (O–P–O) in the Q2 groups, Vas(PO2−), occurs around 1270cm−1[41].
The symmetric stretching vibration of (O–P–O) in the Q2 groups, Vs(PO2−), is responsible for the most intense peak at approximately 1160cm−1[41]. The symmetric stretching vibration of terminal (PO32−) units in the Q1 groups is attributable to a shoulder that appeared at 1160cm−1 and was displayed by deconvolution [42]. The symmetric stretching vibration of (P–O–P) in the Q1 groups, νs(P–O–P), is related to another shoulder by nearly 730cm−1, as determined by deconvolution [43]. The peak at 690cm−1 is caused by the symmetric stretching vibration of Q2 groups (P–O–P), while the weak feature at 640cm−1 is caused by symmetric stretching vibrations in Q° orthophosphate units (νs (P–O), Q°) [44]. The antisymmetric P–O bond in (P2O7) groups (Q1) could be represented by a weak feature of about 525cm−1[22,45]. The bending vibrations of PO2− and PO32− are involved in the wide peaks between 320 and 400cm−1[40].
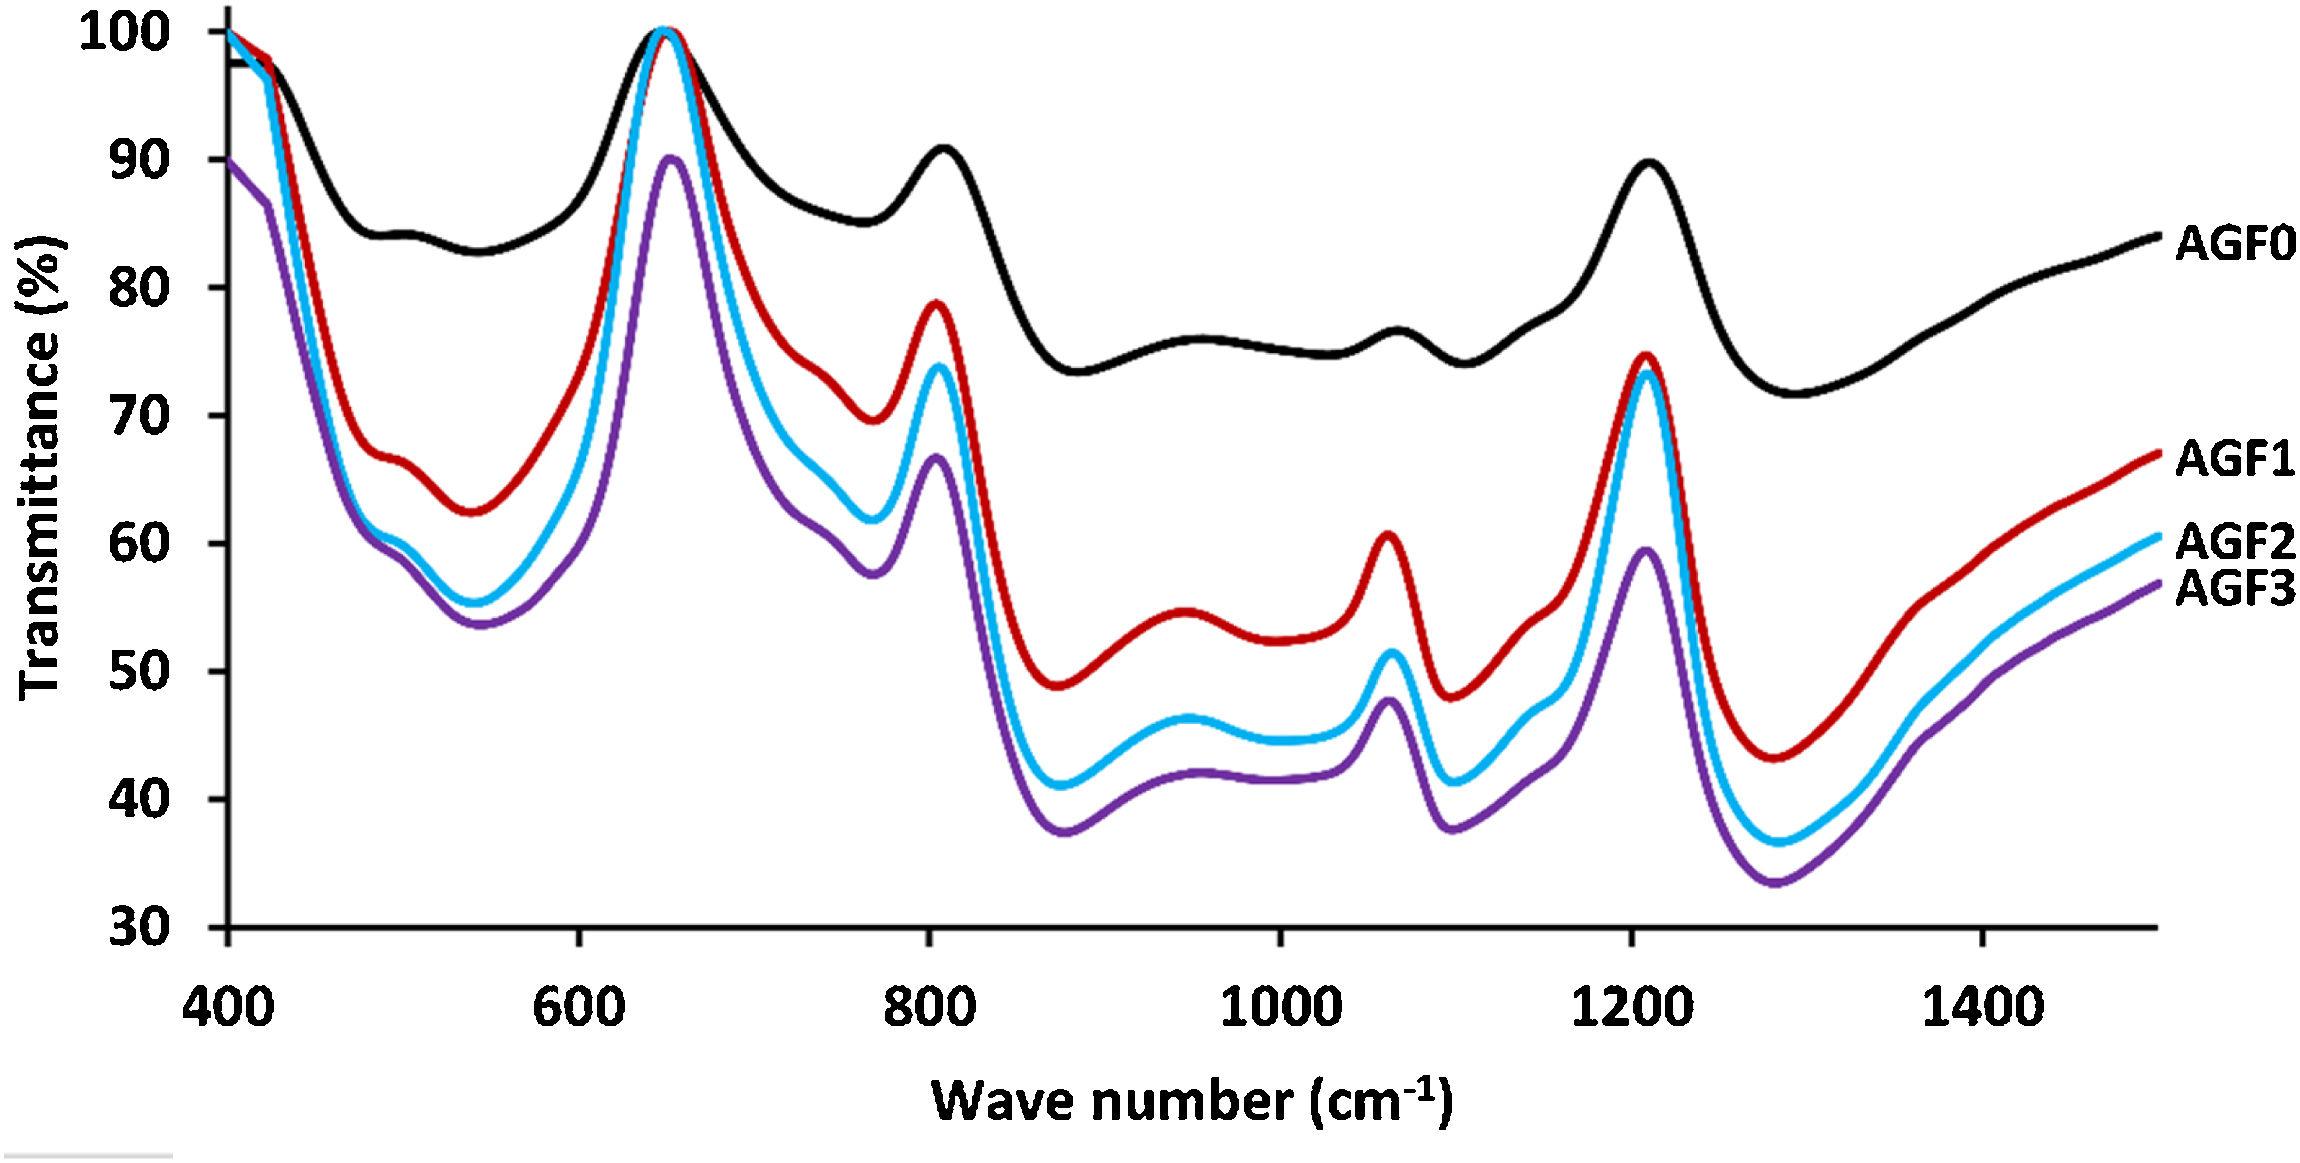
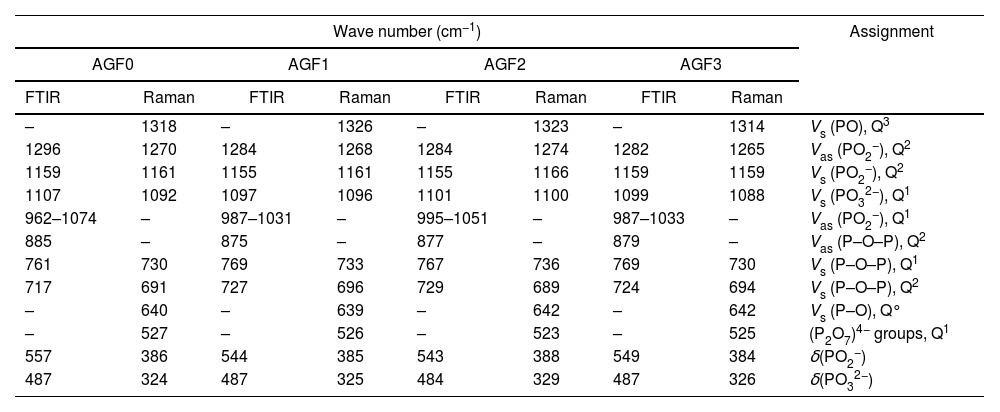
The FTIR spectra for glassware samples between 400 and 1400cm−1 are shown in Fig. 4. The FTIR spectra of the four formulations showed no significant differences, indicating that the produced glasses have identical chemical functional groups and chemical bonding. The two non-bridging oxygen atoms connected to a phosphorus atom in the phosphate tetrahedron Q2 are responsible for the band at around 1280cm−1 (PO2−). The symmetric stretch of (O–P–O) in Q2 groups is characterized by the vibrations of the bands detected at 1160cm−1. The stretching vibrations νs PO32− in the phosphate tetrahedron Q1 are assigned to the FTIR band around 1090–1100cm−1, whereas the stretching vibrations as O–P–O in the phosphate tetrahedron Q1 are assigned to the band around 960–1050cm−1. Asymmetric and symmetric stretching of the bridging oxygen atoms bound to a phosphorus atom in a Q2 phosphate tetrahedron are responsible for the two absorption peaks at 880 and 720cm−1, respectively. The band about 770cm−1, on the other hand, is related to the P–O–P stretching vibrations in various PO4 tetrahedra (Q1 species). The bending vibration of O–P–O and PO32− bonds is related to bands that emerge between 550 and 490cm−1[22,33,46]. Table 4 summarizes the frequency ranges and assignments of the Raman and infrared bands of the examined glasses.

FTIR spectra of AGF0, AGF1, AGF2, and AGF3 glasses. Raman and FTIR spectra suggest that the structure of the phosphate lattice approaches metaphosphates, and the lattice is based mainly on Q2 units. However, the spectra also show the existence of Q1 units, which generally result in shorter phosphate chains.
Frequency ranges (cm−1) and assignments of the Raman and infrared bands of the studied glasses.
| Wave number (cm−1) | Assignment | |||||||
|---|---|---|---|---|---|---|---|---|
| AGF0 | AGF1 | AGF2 | AGF3 | |||||
| FTIR | Raman | FTIR | Raman | FTIR | Raman | FTIR | Raman | |
| – | 1318 | – | 1326 | – | 1323 | – | 1314 | Vs (PO), Q3 |
| 1296 | 1270 | 1284 | 1268 | 1284 | 1274 | 1282 | 1265 | Vas (PO2−), Q2 |
| 1159 | 1161 | 1155 | 1161 | 1155 | 1166 | 1159 | 1159 | Vs (PO2−), Q2 |
| 1107 | 1092 | 1097 | 1096 | 1101 | 1100 | 1099 | 1088 | Vs (PO32−), Q1 |
| 962–1074 | – | 987–1031 | – | 995–1051 | – | 987–1033 | – | Vas (PO2−), Q1 |
| 885 | – | 875 | – | 877 | – | 879 | – | Vas (P–O–P), Q2 |
| 761 | 730 | 769 | 733 | 767 | 736 | 769 | 730 | Vs (P–O–P), Q1 |
| 717 | 691 | 727 | 696 | 729 | 689 | 724 | 694 | Vs (P–O–P), Q2 |
| – | 640 | – | 639 | – | 642 | – | 642 | Vs (P–O), Q° |
| – | 527 | – | 526 | – | 523 | – | 525 | (P2O7)4− groups, Q1 |
| 557 | 386 | 544 | 385 | 543 | 388 | 549 | 384 | δ(PO2−) |
| 487 | 324 | 487 | 325 | 484 | 329 | 487 | 326 | δ(PO32−) |
Abbreviations: δ, bending; V: stretching; s: symmetric; as: asymmetric.
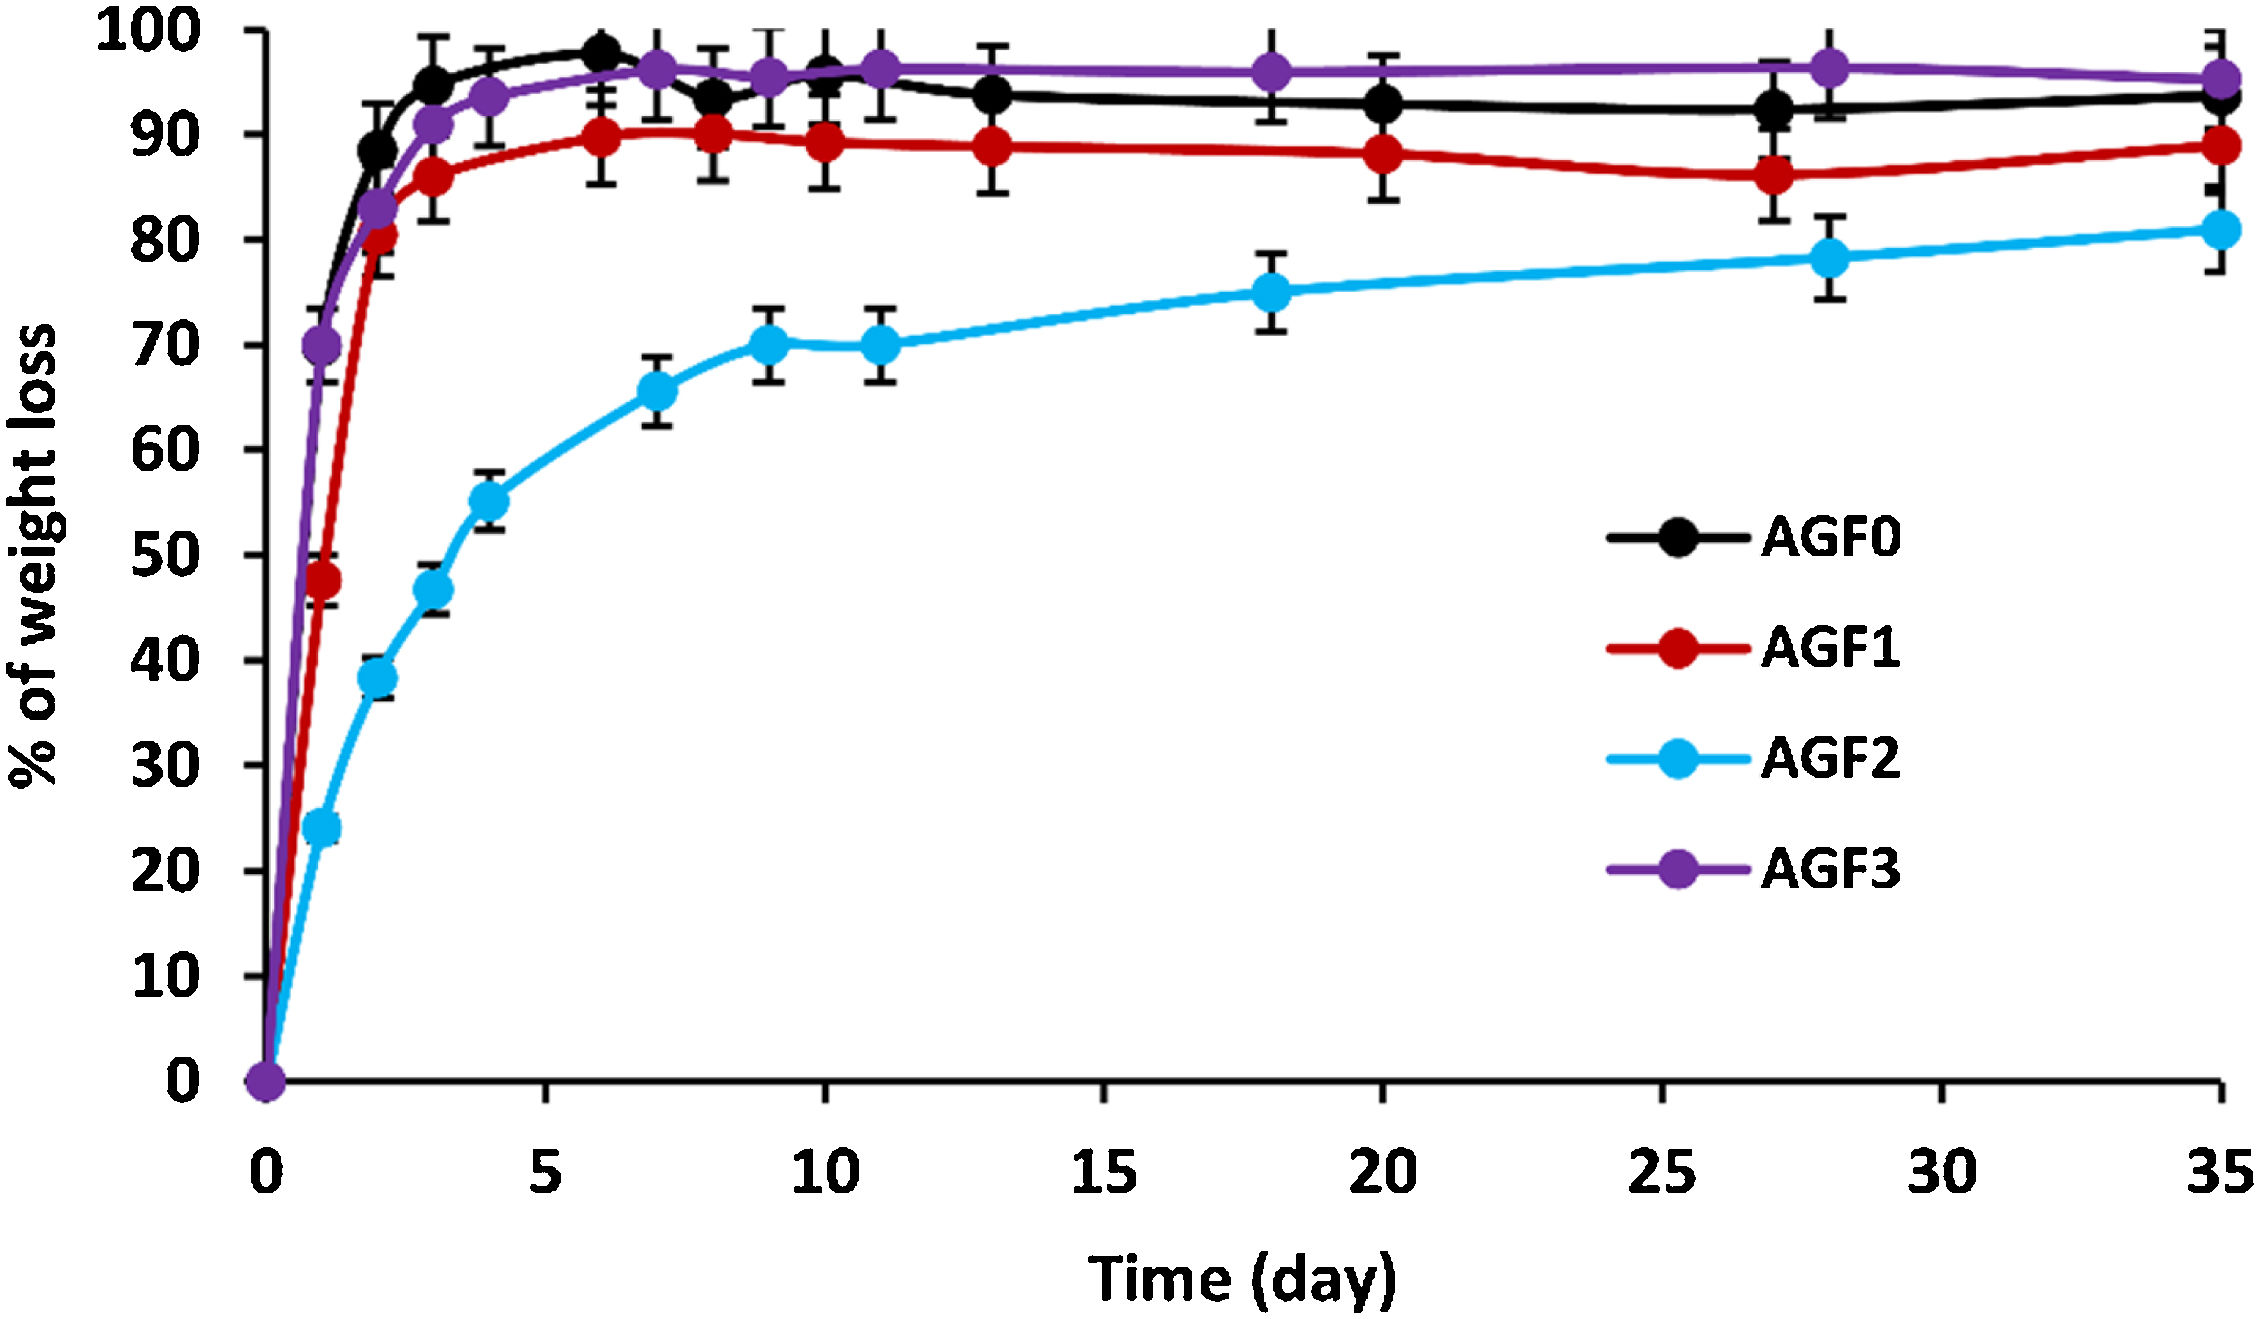
As the degradation time in distilled water extended, the glasses showed an increasing dissolution rate (measured by percent of weight loss), as shown in Fig. 5. Chemical bonds are formed between glass formers and glass modifiers during the vitrification process. Consequently, those modifiers cannot be released if the glass remains undissolved.

Glass dissolution is a complicated process that is influenced by its intrinsic qualities as well as the leaching conditions [47]. Interdiffusion, ion exchange, reaction-diffusion, and hydrolysis occur when the glass comes into contact with water. Three dissolution rate regimes are involved in these processes: (i) Initial diffusion, which reflects the interaction of glass lattice-modifier cations and protons in the solution. Water species penetrate the glass at the start of dissolution, and protons in the solution undergo diffusional ion exchange with mobile alkali modifier ions; (ii) Hydrolysis process, which involves the hydrolysis of P–O–M bonds (M=P, Mg, Ca, B, Zn, Cu, etc.) that constitute the glass’ net structure [48]. Hydrolysis alters the phosphate lattice by breaking bridging bonds formed in the interphase as a result of the release of mobile elements; (iii) rate drop and residual rate is a transition between the initial and residual dissolution rates due to the solution's progressive saturation. This saturation causes the rate of glass dissolution to gradually decrease until it achieves a relatively constant amount (residual dissolution rate); the chemical affinity for dissolution decreases [47,48] – i.e., thermodynamic equilibrium is approached.
Table 5 shows the initial dissolving rates V0, which are computed from the slope of the linear approximation V0=am/dt of the dissolution curves. The chemical resistance of glass is mostly determined by its composition. The highest dissolving rates were found in formula AGF0 and AGF3, whereas the lowest dissolution rate was found in formulae AGF2, which included boron oxide, followed by AGF1. With an initial dissolution rate of V0=0.7g/day, the first diffusion and hydrolysis process for AGF0 and AGF3 lasted only two days. In less than five days, almost the whole glass lattice was dissolved in water. By integrating zinc and boron into the glass matrix, the degradation rate of AGF1 and AGF2 was reduced. These glasses have initial dissolving rates of 0.47 and 0.24g/day, respectively. The first diffusion and hydrolysis process took three to six days to complete.
ZnO is an intermediate oxide. Depending on its content in the phosphate lattice, it can behave as a former or modifier lattice. ZnO oxide acts as a glass former when it occupies tetrahedral sites by generating ZnO4 structural units. However, when a small amount of Zn is present (which is the case in our study), it fills the coordinated octahedral positions, and ZnO oxide functions as a glass modifier [49]. The formation of the P–O–Zn ionic bond, which induces an increase in the compactness and rigidity of the glass lattice, is expected to improve the chemical stability of the structure as well as the thermal properties of phosphate glasses when ZnO is added to the glass lattice [50]. However, this increase was not too remarkable given that the added amount of ZnO (according to the needs of the wheat) was low. Therefore the number of P–O–Zn bonds formed led to a slight increase in the chemical durability of our phosphate glasses.
A decrease of almost 30% in the weight loss and initial dissolution rate was observed in the dissolution behavior of the glass containing B2O3 glasses over 35 days as compared to the glasses with no microelements. The creation of P–O–B bonds, which related well to an increase in transition temperature, caused a decrease in the percentage of weight loss and dissolution rate with the addition of B2O3. The chemical bond strength of the diatomic molecule B–O (808kJ/mol) is higher than that of the diatomic molecule P–O (599.1kJ/mol), implying an energetic preference for stronger bonding forces inside the glass structure via the production of P–O–B bonds [51]. Shah et al. [52] noticed that the dissolution rate slowed as the B2O3 level increased while examining the dissolution of phosphate glasses in the Na2O–BaO–B2O3–P2O5 quaternary system.
Previous studies indicated an increase in the chemical stability of phosphate glasses by incorporating copper oxide, which was corroborated by an increase in density and glass transition temperature [53]. However, in this study, and since copper is one of the microelements which are consumed in minimal quantities by the plant (with molybdenum and silica), it is incorporated, within the vitreous lattice, in a negligible amount compared to the other elements (calcium, magnesium), which limited its effect and made it unobservable whether on thermal properties, on density and molar volume, or the chemical stability.
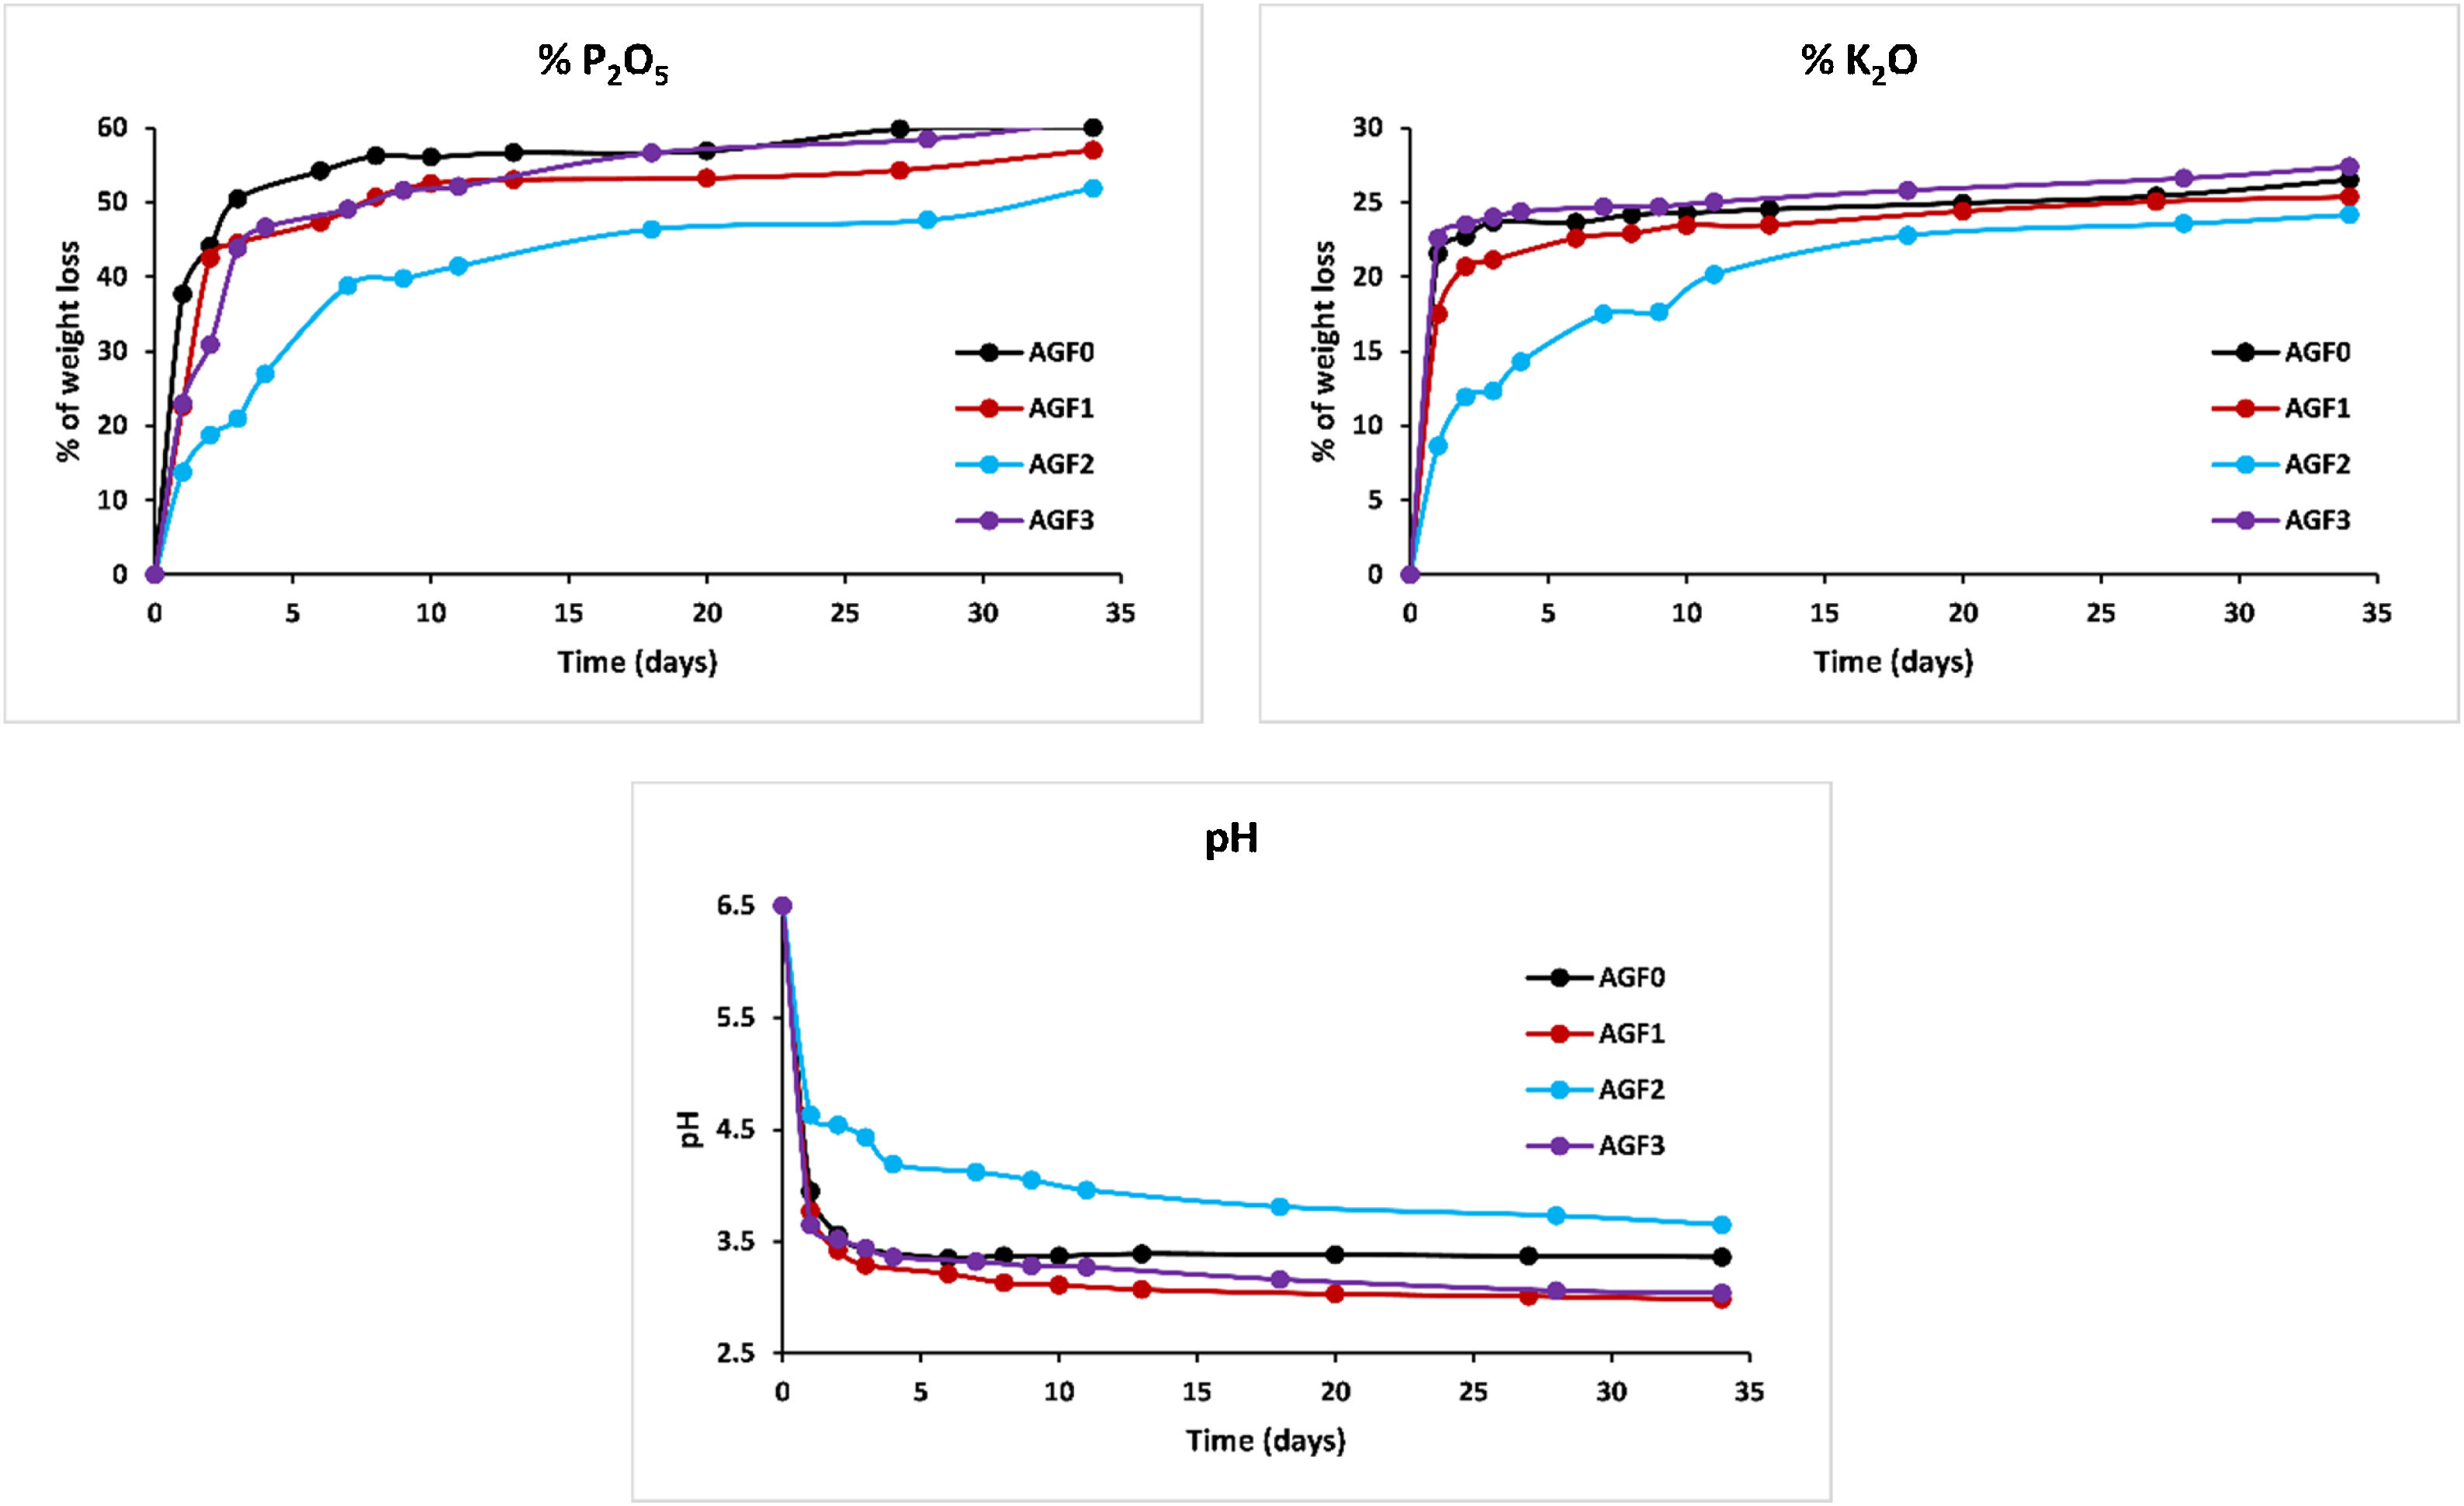
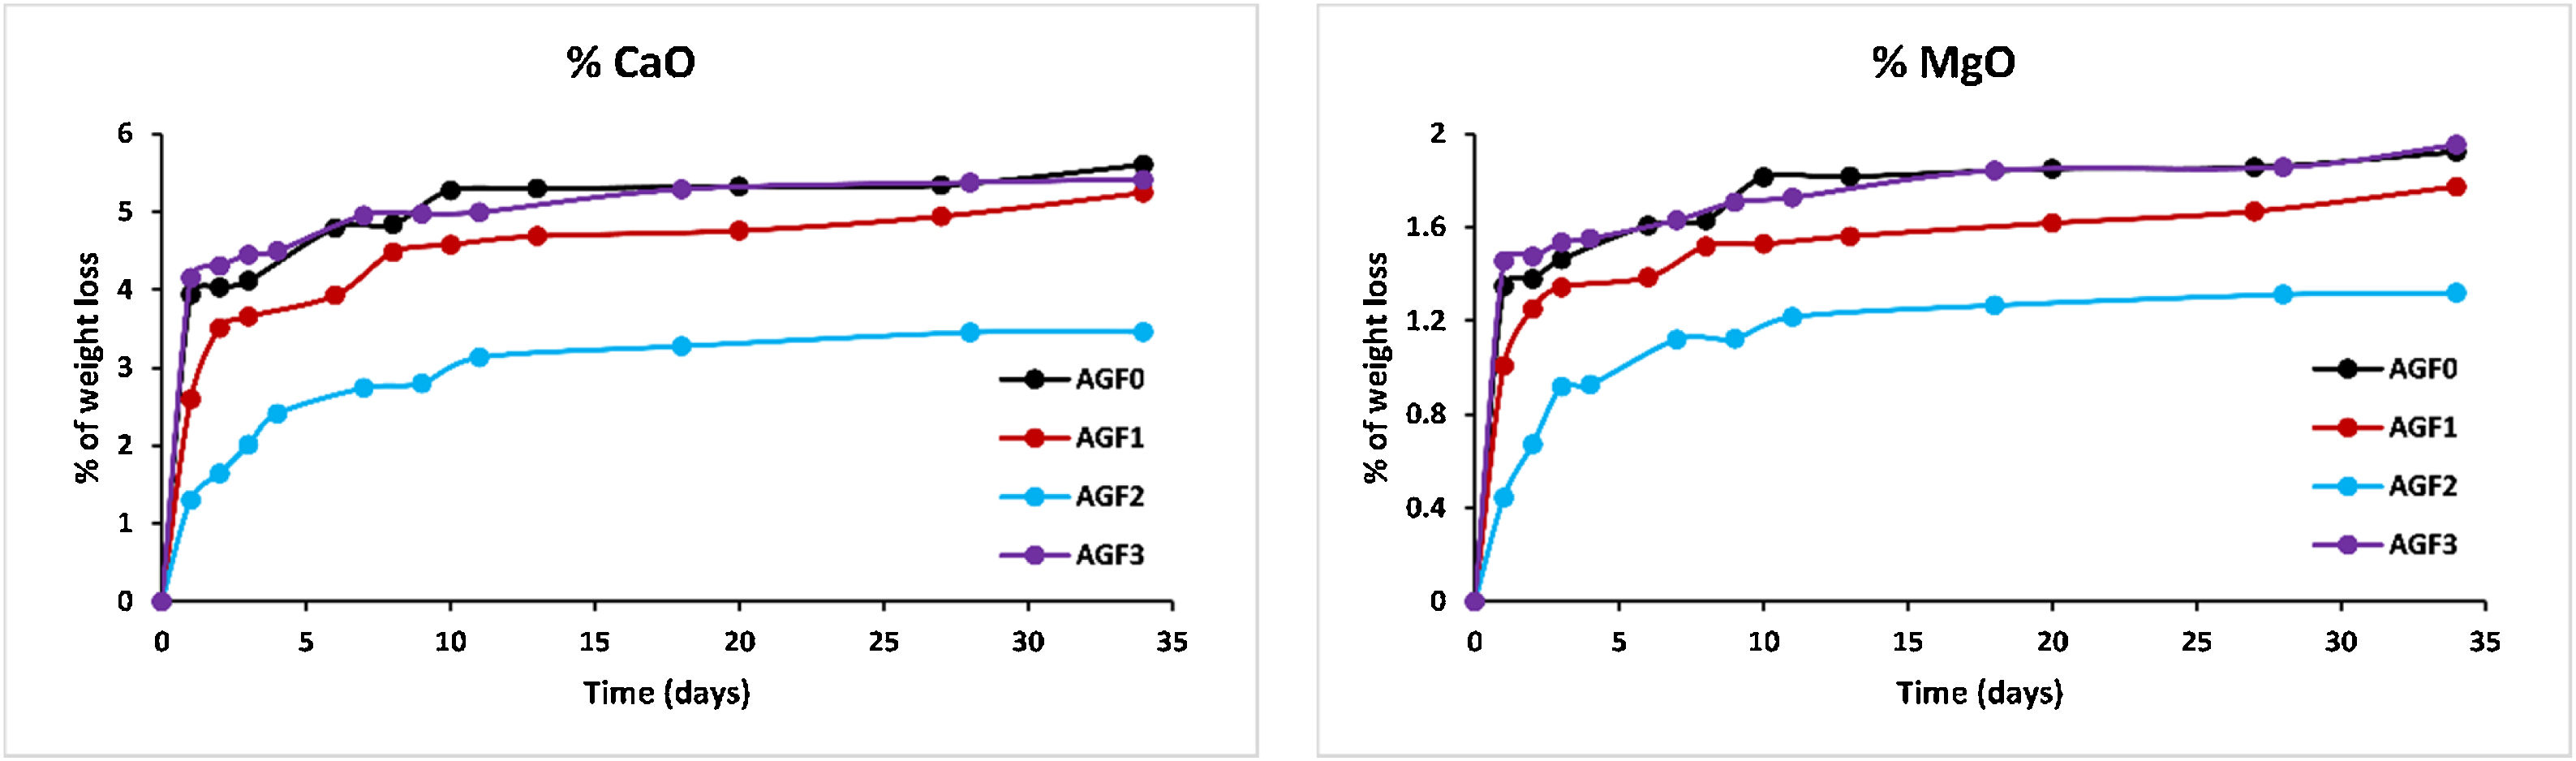
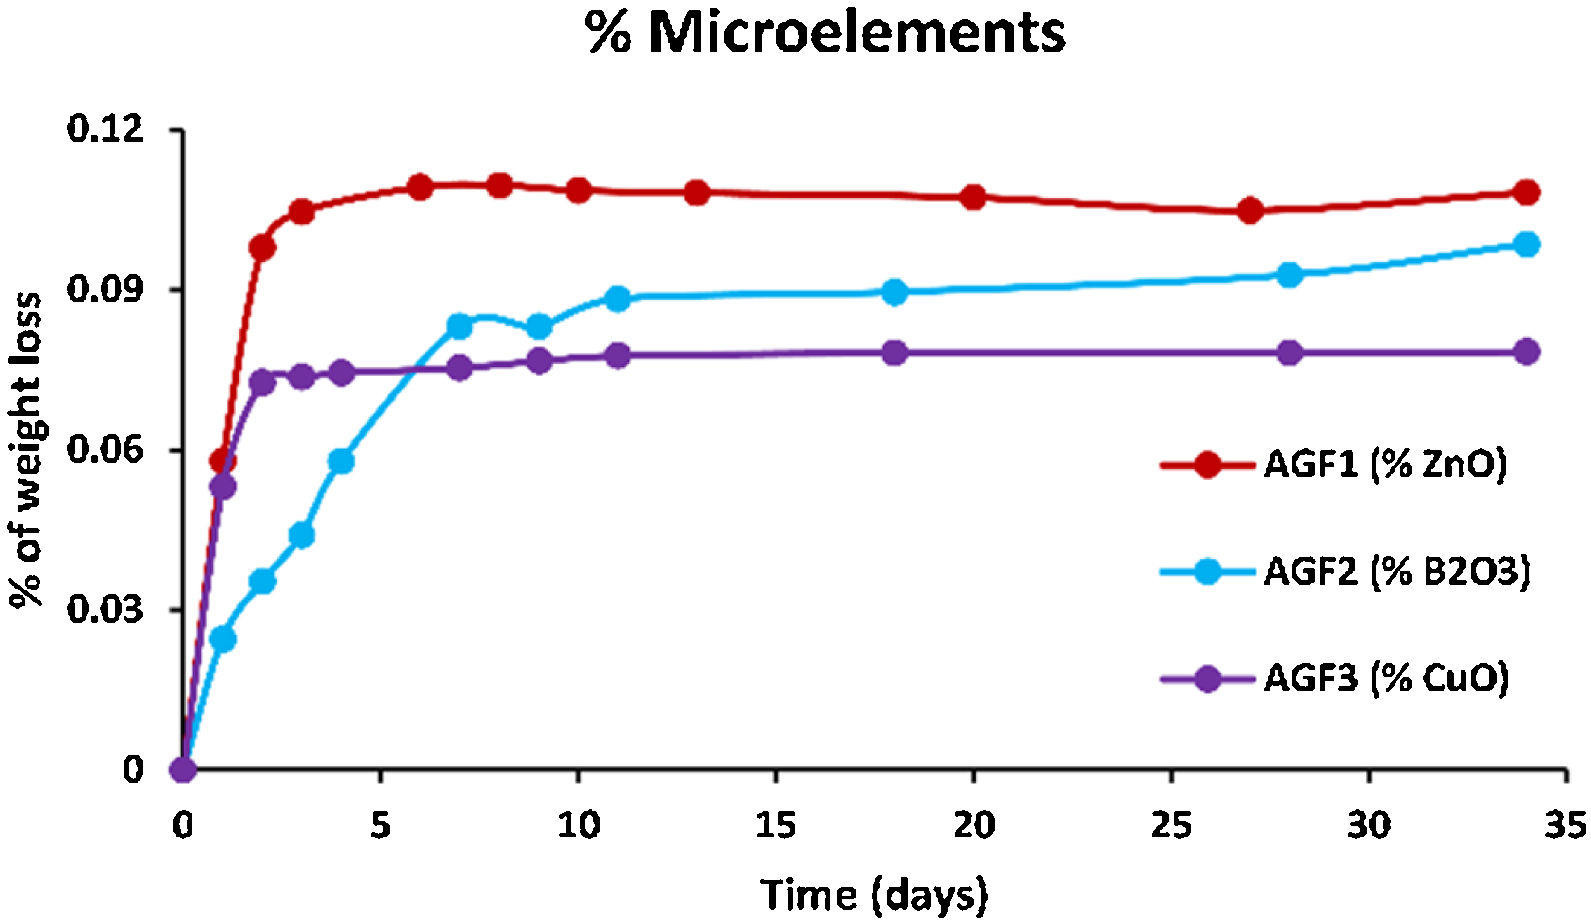
Figs. 6–8 show the amounts of cations released from the studied glasses in the form of oxides, normalized to the starting glass weight, as measured by the ICP-OES method, as well as the pH readings. The percentage of released ions increased over time. For AGF0 and AGF3, concentrations of constituent cations in distilled water increased dramatically during the first two days of immersion (although the determination of copper in the dissolving solution was difficult since it was incorporated in small amounts). While for glasses AGF1 and AGF2, the effect of the addition of microelements, which results in a slower release of ions in water, has been noted. For all the studied glasses, the presence of entire cations in the leachate solution, with a ratio equivalent to the glass composition, suggests that no selective leaching occurred, and the glasses dissolved congruently instead [54]. Congruent dissolution can reflect that the dissolution mechanism is based on a release of the entire metaphosphates chain in solution; this chain contains all the incorporated elements linked in covalent bonds to oxygens. After immersing the glasses in distilled water, the pH of the leachate solutions dropped. The pH of all glasses decreased linearly with immersion time from 6.5 to reach the acidic region, then remained nearly constant for the duration of immersion. Previous research has found that the pH of the leachate solution varies depending on the phosphate content of the immersed glass, with more phosphorus concentration in the solution resulting in lower pH values [48].
 analyzed in the leachate solutions (elements in the form of oxides) normalized to the initial glass weight and pH measurements versus time for AGF0, AGF1, AGF2, and AGF3.")
 analyzed in the leachate solutions (elements in the form of oxides) normalized to the initial glass weight versus time for AGF0, AGF1, AGF2, and AGF3.")
 analyzed in the leachate solutions (elements in the form of oxides) normalized to the initial glass weight versus time for AGF1, AGF2, and AGF3.")
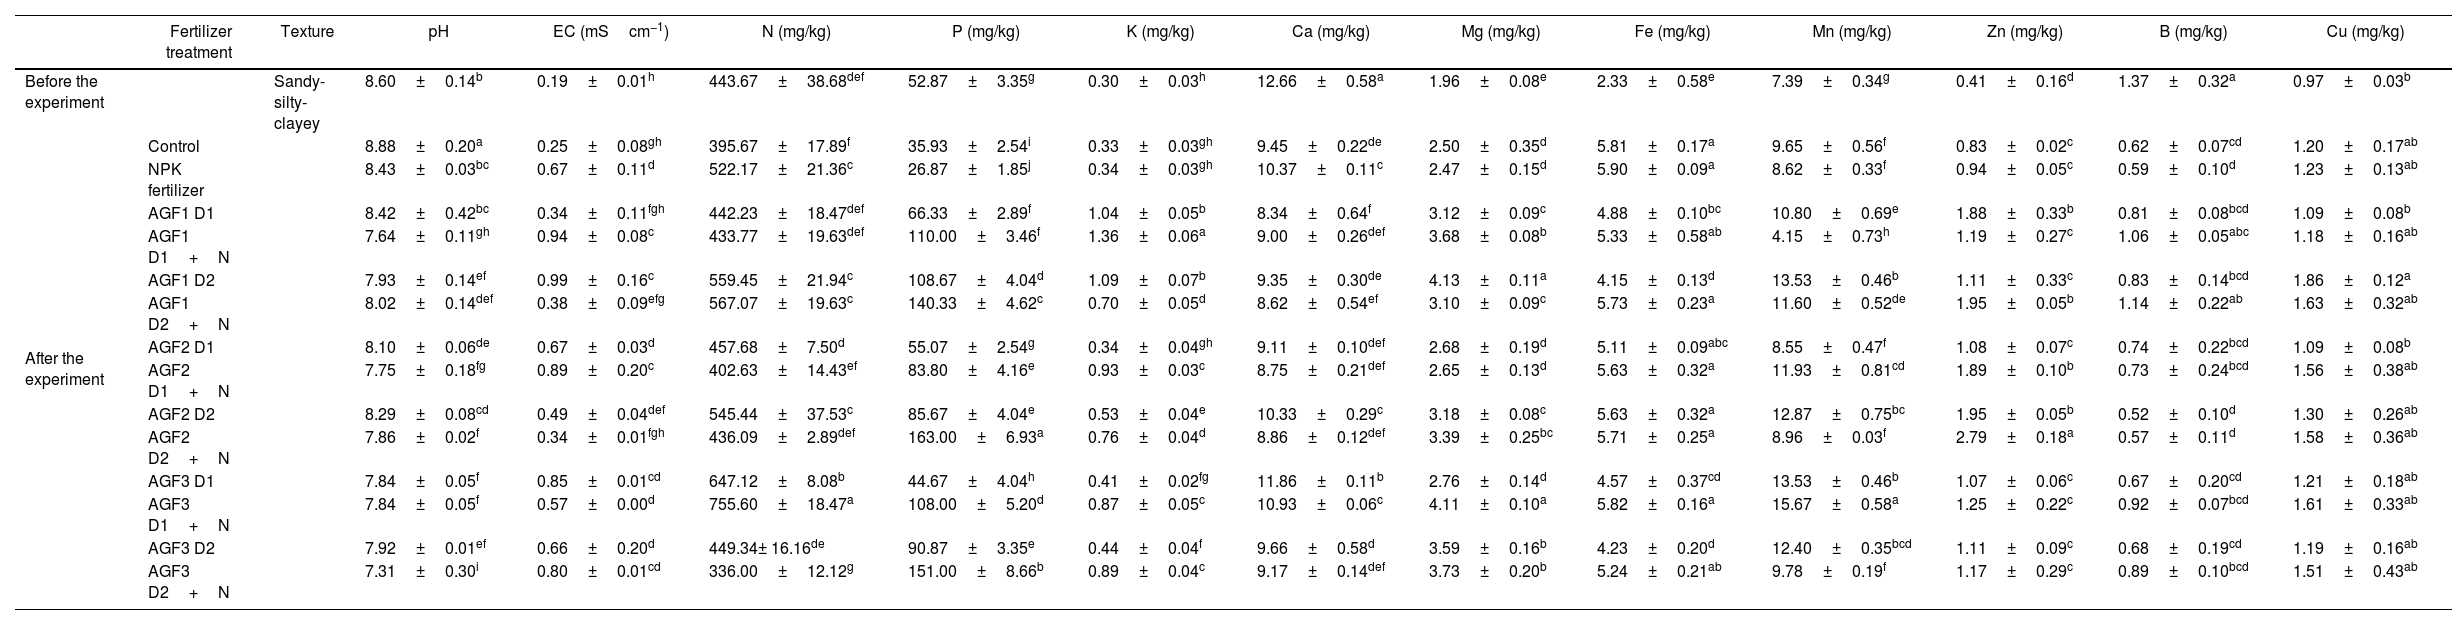
The NPK and glass fertilizers application showed a significant decrease in soil pH compared to the control, while electrical conductivity recorded a considerable increase (Table 6). Soils supplemented with glass fertilizers also showed a significant decline in pH value compared to conventional fertilizers, where AGR3 D2 recorded the greatest decrease (13%). This result corroborates our findings related to the dissolution of the glass fertilizers in the water, inducing a significant decrease in pH values. A previous study [55] indicated that soil supplementation with glass and conventional fertilizers induced a small lowering in soil pH. In this investigation, even if the different fertilizers significantly decreased soil pH, their values remain slightly alkaline, which indicates no evident effect of the applied fertilizers on this parameter. Moreover, soil electrical conductivity showed significant variations after the application of the glass fertilizers compared to the NPK treatment since AGF2 D2 recorded the maximum decrease (49%) while AGF3 D1+N recorded the greatest enhancement (28%).
Soil physicochemical characteristics before and after the cultivation of wheat treated with agriglass and chemical fertilizers.
| Fertilizer treatment | Texture | pH | EC (mScm−1) | N (mg/kg) | P (mg/kg) | K (mg/kg) | Ca (mg/kg) | Mg (mg/kg) | Fe (mg/kg) | Mn (mg/kg) | Zn (mg/kg) | B (mg/kg) | Cu (mg/kg) | |
|---|---|---|---|---|---|---|---|---|---|---|---|---|---|---|
| Before the experiment | Sandy-silty-clayey | 8.60±0.14b | 0.19±0.01h | 443.67±38.68def | 52.87±3.35g | 0.30±0.03h | 12.66±0.58a | 1.96±0.08e | 2.33±0.58e | 7.39±0.34g | 0.41±0.16d | 1.37±0.32a | 0.97±0.03b | |
| After the experiment | Control | 8.88±0.20a | 0.25±0.08gh | 395.67±17.89f | 35.93±2.54i | 0.33±0.03gh | 9.45±0.22de | 2.50±0.35d | 5.81±0.17a | 9.65±0.56f | 0.83±0.02c | 0.62±0.07cd | 1.20±0.17ab | |
| NPK fertilizer | 8.43±0.03bc | 0.67±0.11d | 522.17±21.36c | 26.87±1.85j | 0.34±0.03gh | 10.37±0.11c | 2.47±0.15d | 5.90±0.09a | 8.62±0.33f | 0.94±0.05c | 0.59±0.10d | 1.23±0.13ab | ||
| AGF1 D1 | 8.42±0.42bc | 0.34±0.11fgh | 442.23±18.47def | 66.33±2.89f | 1.04±0.05b | 8.34±0.64f | 3.12±0.09c | 4.88±0.10bc | 10.80±0.69e | 1.88±0.33b | 0.81±0.08bcd | 1.09±0.08b | ||
| AGF1 D1+N | 7.64±0.11gh | 0.94±0.08c | 433.77±19.63def | 110.00±3.46f | 1.36±0.06a | 9.00±0.26def | 3.68±0.08b | 5.33±0.58ab | 4.15±0.73h | 1.19±0.27c | 1.06±0.05abc | 1.18±0.16ab | ||
| AGF1 D2 | 7.93±0.14ef | 0.99±0.16c | 559.45±21.94c | 108.67±4.04d | 1.09±0.07b | 9.35±0.30de | 4.13±0.11a | 4.15±0.13d | 13.53±0.46b | 1.11±0.33c | 0.83±0.14bcd | 1.86±0.12a | ||
| AGF1 D2+N | 8.02±0.14def | 0.38±0.09efg | 567.07±19.63c | 140.33±4.62c | 0.70±0.05d | 8.62±0.54ef | 3.10±0.09c | 5.73±0.23a | 11.60±0.52de | 1.95±0.05b | 1.14±0.22ab | 1.63±0.32ab | ||
| AGF2 D1 | 8.10±0.06de | 0.67±0.03d | 457.68±7.50d | 55.07±2.54g | 0.34±0.04gh | 9.11±0.10def | 2.68±0.19d | 5.11±0.09abc | 8.55±0.47f | 1.08±0.07c | 0.74±0.22bcd | 1.09±0.08b | ||
| AGF2 D1+N | 7.75±0.18fg | 0.89±0.20c | 402.63±14.43ef | 83.80±4.16e | 0.93±0.03c | 8.75±0.21def | 2.65±0.13d | 5.63±0.32a | 11.93±0.81cd | 1.89±0.10b | 0.73±0.24bcd | 1.56±0.38ab | ||
| AGF2 D2 | 8.29±0.08cd | 0.49±0.04def | 545.44±37.53c | 85.67±4.04e | 0.53±0.04e | 10.33±0.29c | 3.18±0.08c | 5.63±0.32a | 12.87±0.75bc | 1.95±0.05b | 0.52±0.10d | 1.30±0.26ab | ||
| AGF2 D2+N | 7.86±0.02f | 0.34±0.01fgh | 436.09±2.89def | 163.00±6.93a | 0.76±0.04d | 8.86±0.12def | 3.39±0.25bc | 5.71±0.25a | 8.96±0.03f | 2.79±0.18a | 0.57±0.11d | 1.58±0.36ab | ||
| AGF3 D1 | 7.84±0.05f | 0.85±0.01cd | 647.12±8.08b | 44.67±4.04h | 0.41±0.02fg | 11.86±0.11b | 2.76±0.14d | 4.57±0.37cd | 13.53±0.46b | 1.07±0.06c | 0.67±0.20cd | 1.21±0.18ab | ||
| AGF3 D1+N | 7.84±0.05f | 0.57±0.00d | 755.60±18.47a | 108.00±5.20d | 0.87±0.05c | 10.93±0.06c | 4.11±0.10a | 5.82±0.16a | 15.67±0.58a | 1.25±0.22c | 0.92±0.07bcd | 1.61±0.33ab | ||
| AGF3 D2 | 7.92±0.01ef | 0.66±0.20d | 449.34± 16.16de | 90.87±3.35e | 0.44±0.04f | 9.66±0.58d | 3.59±0.16b | 4.23±0.20d | 12.40±0.35bcd | 1.11±0.09c | 0.68±0.19cd | 1.19±0.16ab | ||
| AGF3 D2+N | 7.31±0.30i | 0.80±0.01cd | 336.00±12.12g | 151.00±8.66b | 0.89±0.04c | 9.17±0.14def | 3.73±0.20b | 5.24±0.21ab | 9.78±0.19f | 1.17±0.29c | 0.89±0.10bcd | 1.51±0.43ab |
Considering soil mineral content, no significant difference was recorded between soil mineral status before the experiment and harvest for the control (Table 6). The application of different fertilizers mainly induced an increment in soil mineral content compared to the control except for Ca and Fe concentration, where a decreasing trend was recorded. When compared to NPK fertilizer, AGF1 mainly improved P, K, B, and Cu content (296%, 208%, 64%, and 25%, respectively), AGF3 mainly improved N, Mg, Ca, and Mn content (5%, 43%, 14%, and 49%, respectively), while AGF2 mainly improved Zn content (105%). A recent study reported the application of glass fertilizers induced a declining trend in macroelements edaphic concentrations while an increasing trend was observed for microelements content [55]. In this study, the increase in soil mineral concentrations observed after the application of the glass fertilizers may be attributed to the composition of these fertilizers rich in essential mineral nutrients, especially P, K, Mg, Ca, Zn, B, and Cu and their controlled release in the soil which makes them available for the plant and limits their leaching. The same result was reported by Labbilta [24,56] reporting that the agriglass fertilizers applied to tomato and wheat improved soil mineral content compared to NPK and the control treatments.
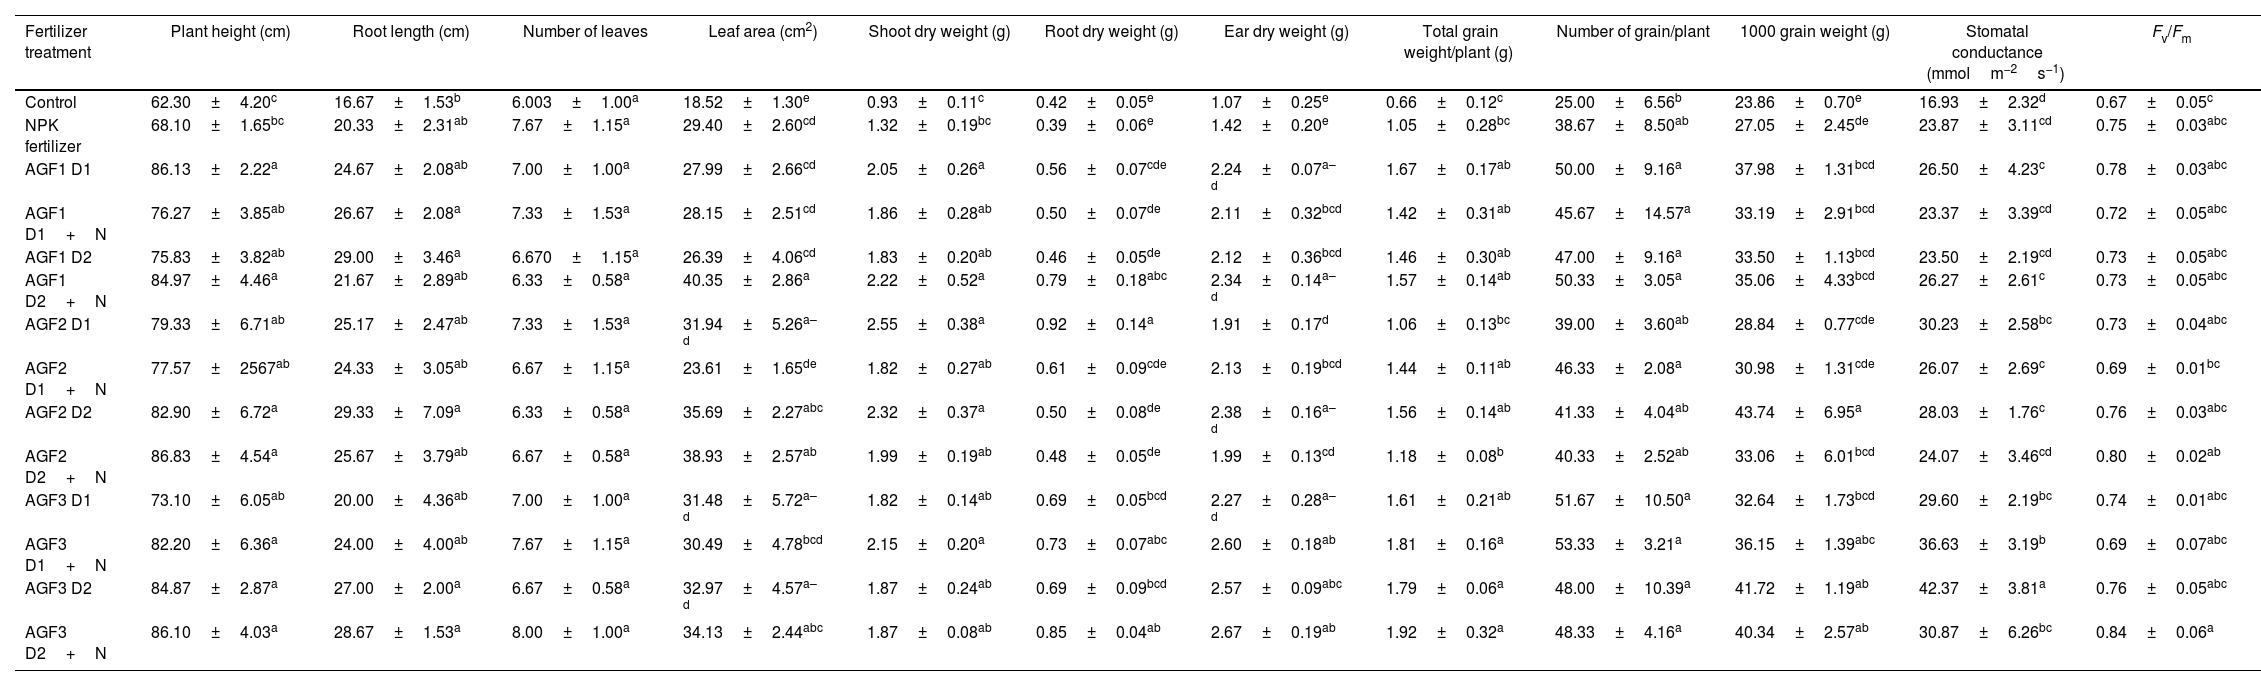
Growth and yield parametersThe application of AGF3 treatments mainly improved shoot height, leaf area, root, ear, and grain total dry weights, the number of grains per plant, and 1000 grain weight, while AGF2 formulations mainly enhanced root elongation and shoot dry weight in comparison to the control and NPK treatments (Table 7). The same result was recently reported by Labbilta et al. [24] showing the boosting effect of the application of three phosphate glass fertilizers formula (P2O5+K2O+CaO+MgO+Fe2O3, P2O5+K2O+CaO+MgO+MnO and P2O5+K2O+CaO+MgO+Fe2O3+MnO+ZnO+B2O3+CuO+MoO3) on wheat growth performance and yield under greenhouse conditions with an increase of up to 88% compared to the control and NPK treated plants. The same authors [56] indicated the same positive impact of these fertilizers on tomato under field conditions. Furthermore, previous studies reported an improvement in tomato yield after the application of glass fertilizers under field conditions compared to conventional fertilizers [55,57]. In the same vein, Ouis et al. [11] and Abou-Baker et al. [58] reported the same beneficial effect of SiO2, P2O5, and K2O-based glass fertilizers on maize ears, straw, and grains weights and yield.
Effects of the agriglass fertilizers on the growth, yield, and photosynthetic parameters of wheat after 4 months of cultivation.
| Fertilizer treatment | Plant height (cm) | Root length (cm) | Number of leaves | Leaf area (cm2) | Shoot dry weight (g) | Root dry weight (g) | Ear dry weight (g) | Total grain weight/plant (g) | Number of grain/plant | 1000 grain weight (g) | Stomatal conductance (mmolm−2s−1) | Fv/Fm |
|---|---|---|---|---|---|---|---|---|---|---|---|---|
| Control | 62.30±4.20c | 16.67±1.53b | 6.003±1.00a | 18.52±1.30e | 0.93±0.11c | 0.42±0.05e | 1.07±0.25e | 0.66±0.12c | 25.00±6.56b | 23.86±0.70e | 16.93±2.32d | 0.67±0.05c |
| NPK fertilizer | 68.10±1.65bc | 20.33±2.31ab | 7.67±1.15a | 29.40±2.60cd | 1.32±0.19bc | 0.39±0.06e | 1.42±0.20e | 1.05±0.28bc | 38.67±8.50ab | 27.05±2.45de | 23.87±3.11cd | 0.75±0.03abc |
| AGF1 D1 | 86.13±2.22a | 24.67±2.08ab | 7.00±1.00a | 27.99±2.66cd | 2.05±0.26a | 0.56±0.07cde | 2.24±0.07a–d | 1.67±0.17ab | 50.00±9.16a | 37.98±1.31bcd | 26.50±4.23c | 0.78±0.03abc |
| AGF1 D1+N | 76.27±3.85ab | 26.67±2.08a | 7.33±1.53a | 28.15±2.51cd | 1.86±0.28ab | 0.50±0.07de | 2.11±0.32bcd | 1.42±0.31ab | 45.67±14.57a | 33.19±2.91bcd | 23.37±3.39cd | 0.72±0.05abc |
| AGF1 D2 | 75.83±3.82ab | 29.00±3.46a | 6.670±1.15a | 26.39±4.06cd | 1.83±0.20ab | 0.46±0.05de | 2.12±0.36bcd | 1.46±0.30ab | 47.00±9.16a | 33.50±1.13bcd | 23.50±2.19cd | 0.73±0.05abc |
| AGF1 D2+N | 84.97±4.46a | 21.67±2.89ab | 6.33±0.58a | 40.35±2.86a | 2.22±0.52a | 0.79±0.18abc | 2.34±0.14a–d | 1.57±0.14ab | 50.33±3.05a | 35.06±4.33bcd | 26.27±2.61c | 0.73±0.05abc |
| AGF2 D1 | 79.33±6.71ab | 25.17±2.47ab | 7.33±1.53a | 31.94±5.26a–d | 2.55±0.38a | 0.92±0.14a | 1.91±0.17d | 1.06±0.13bc | 39.00±3.60ab | 28.84±0.77cde | 30.23±2.58bc | 0.73±0.04abc |
| AGF2 D1+N | 77.57±2567ab | 24.33±3.05ab | 6.67±1.15a | 23.61±1.65de | 1.82±0.27ab | 0.61±0.09cde | 2.13±0.19bcd | 1.44±0.11ab | 46.33±2.08a | 30.98±1.31cde | 26.07±2.69c | 0.69±0.01bc |
| AGF2 D2 | 82.90±6.72a | 29.33±7.09a | 6.33±0.58a | 35.69±2.27abc | 2.32±0.37a | 0.50±0.08de | 2.38±0.16a–d | 1.56±0.14ab | 41.33±4.04ab | 43.74±6.95a | 28.03±1.76c | 0.76±0.03abc |
| AGF2 D2+N | 86.83±4.54a | 25.67±3.79ab | 6.67±0.58a | 38.93±2.57ab | 1.99±0.19ab | 0.48±0.05de | 1.99±0.13cd | 1.18±0.08b | 40.33±2.52ab | 33.06±6.01bcd | 24.07±3.46cd | 0.80±0.02ab |
| AGF3 D1 | 73.10±6.05ab | 20.00±4.36ab | 7.00±1.00a | 31.48±5.72a–d | 1.82±0.14ab | 0.69±0.05bcd | 2.27±0.28a–d | 1.61±0.21ab | 51.67±10.50a | 32.64±1.73bcd | 29.60±2.19bc | 0.74±0.01abc |
| AGF3 D1+N | 82.20±6.36a | 24.00±4.00ab | 7.67±1.15a | 30.49±4.78bcd | 2.15±0.20a | 0.73±0.07abc | 2.60±0.18ab | 1.81±0.16a | 53.33±3.21a | 36.15±1.39abc | 36.63±3.19b | 0.69±0.07abc |
| AGF3 D2 | 84.87±2.87a | 27.00±2.00a | 6.67±0.58a | 32.97±4.57a–d | 1.87±0.24ab | 0.69±0.09bcd | 2.57±0.09abc | 1.79±0.06a | 48.00±10.39a | 41.72±1.19ab | 42.37±3.81a | 0.76±0.05abc |
| AGF3 D2+N | 86.10±4.03a | 28.67±1.53a | 8.00±1.00a | 34.13±2.44abc | 1.87±0.08ab | 0.85±0.04ab | 2.67±0.19ab | 1.92±0.32a | 48.33±4.16a | 40.34±2.57ab | 30.87±6.26bc | 0.84±0.06a |
The positive impact of the elaborated glass fertilizers on wheat growth performance and yield could be attributed to their richness in essential mineral elements [58,59]. Ait-El-Mokhtar et al. [60] reported the greatest values of wheat growth and yield traits in the field after the application of three phosphate glass fertilizers supplemented with chemical nitrogen. In this study, no obvious significant effect was recorded on wheat growth, yield, and physiological performances after the application of chemical nitrogen which could be attributed to the fact that this element was leached with the irrigation in contrast to the other elements that are present in the glass fertilizer. This result is confirmed by the modest values of soil nitrogen recorded after N supplementation which are mainly close to the value obtained before the experiment except for AGF1 D2+N and AGF3 D1+N treatments.
When considering the growth-promoting effect of the applied glass fertilizers in comparison to NPK fertilizers, it appears that AGF3 recorded the greatest effect on wheat growth fitness and yield, followed by AGF2 and AGF1. The high boosting effect of AGF3 may be explained by the dissolution rate of this glass in comparison the other two formula of glass fertilizers since it recorded the greatest dissolution values for P2O5, K2O, CaO, and MgO, which provide a sufficient amount of macroelement to the plant. These phosphate glass fertilizers supply a significant amount of phosphorus, potassium, calcium, and magnesium to plants. Increased shoot and root biomass accumulation, as well as fruit and seed formation, were associated with improved nutrient uptake [61,62].
Photosynthetic parametersThe application of NPK fertilizer enhanced stomatal conductance (gs) by 41% and photosystem II efficiency (Fv/Fm) by 12% in comparison to the control. In addition, the glass fertilizers treated plants showed an increase of gs by 21% (8% for AGF1, 16% for AGF2, and 39% for AGF3) compared to the NPK treatment (Table 7), while Fv/Fm showed fluctuations between the different AGF and recorded the greatest increment (7%) with the application of AGF3 D1+N in comparison to NPK fertilizer. Labbilta et al. [24,56] reported the same positive effect of the application of glass fertilizers on these photosynthetic parameters on wheat and tomato under greenhouse and field conditions, respectively.
The promotion of gs and Fv/Fm in the glass fertilizers treated plants could be linked in the first place to the pivotal role mineral nutrients released by these amendments such as K, Mg, Cu, Fe, and Mn known to be a part of the photosynthetic apparatus and functioning. Labbilta et al. [56] reported the improvement of these elements’ concentration in soil supplemented with phosphate glass fertilizers which may contribute to the stimulation of photosynthesis activity after their absorption. A previous study [63] indicated an increased nutrient status in grapevine treated with the glass fertilizers, especially potassium and magnesium uptake, which may boost photosynthetic activity and metabolism pathways, including stomatal opening, chlorophyll biosynthesis, and multiple key enzymes involved in carbon dioxide assimilation as well as the regulation of abscisic acid production [64]. On the other hand, AGF3 induced the maximum increase of these parameters (78% (AGF3 D2) for gs and 7% (AGF3 D1+N) for Fv/Fm) in comparison to the NPK treatment. The distinguished effect of this formulae could be attributed to the speed of nutrient release (including K, Mg, Cu), which was more important for AGF3 compared to AGF2 and AGF1.
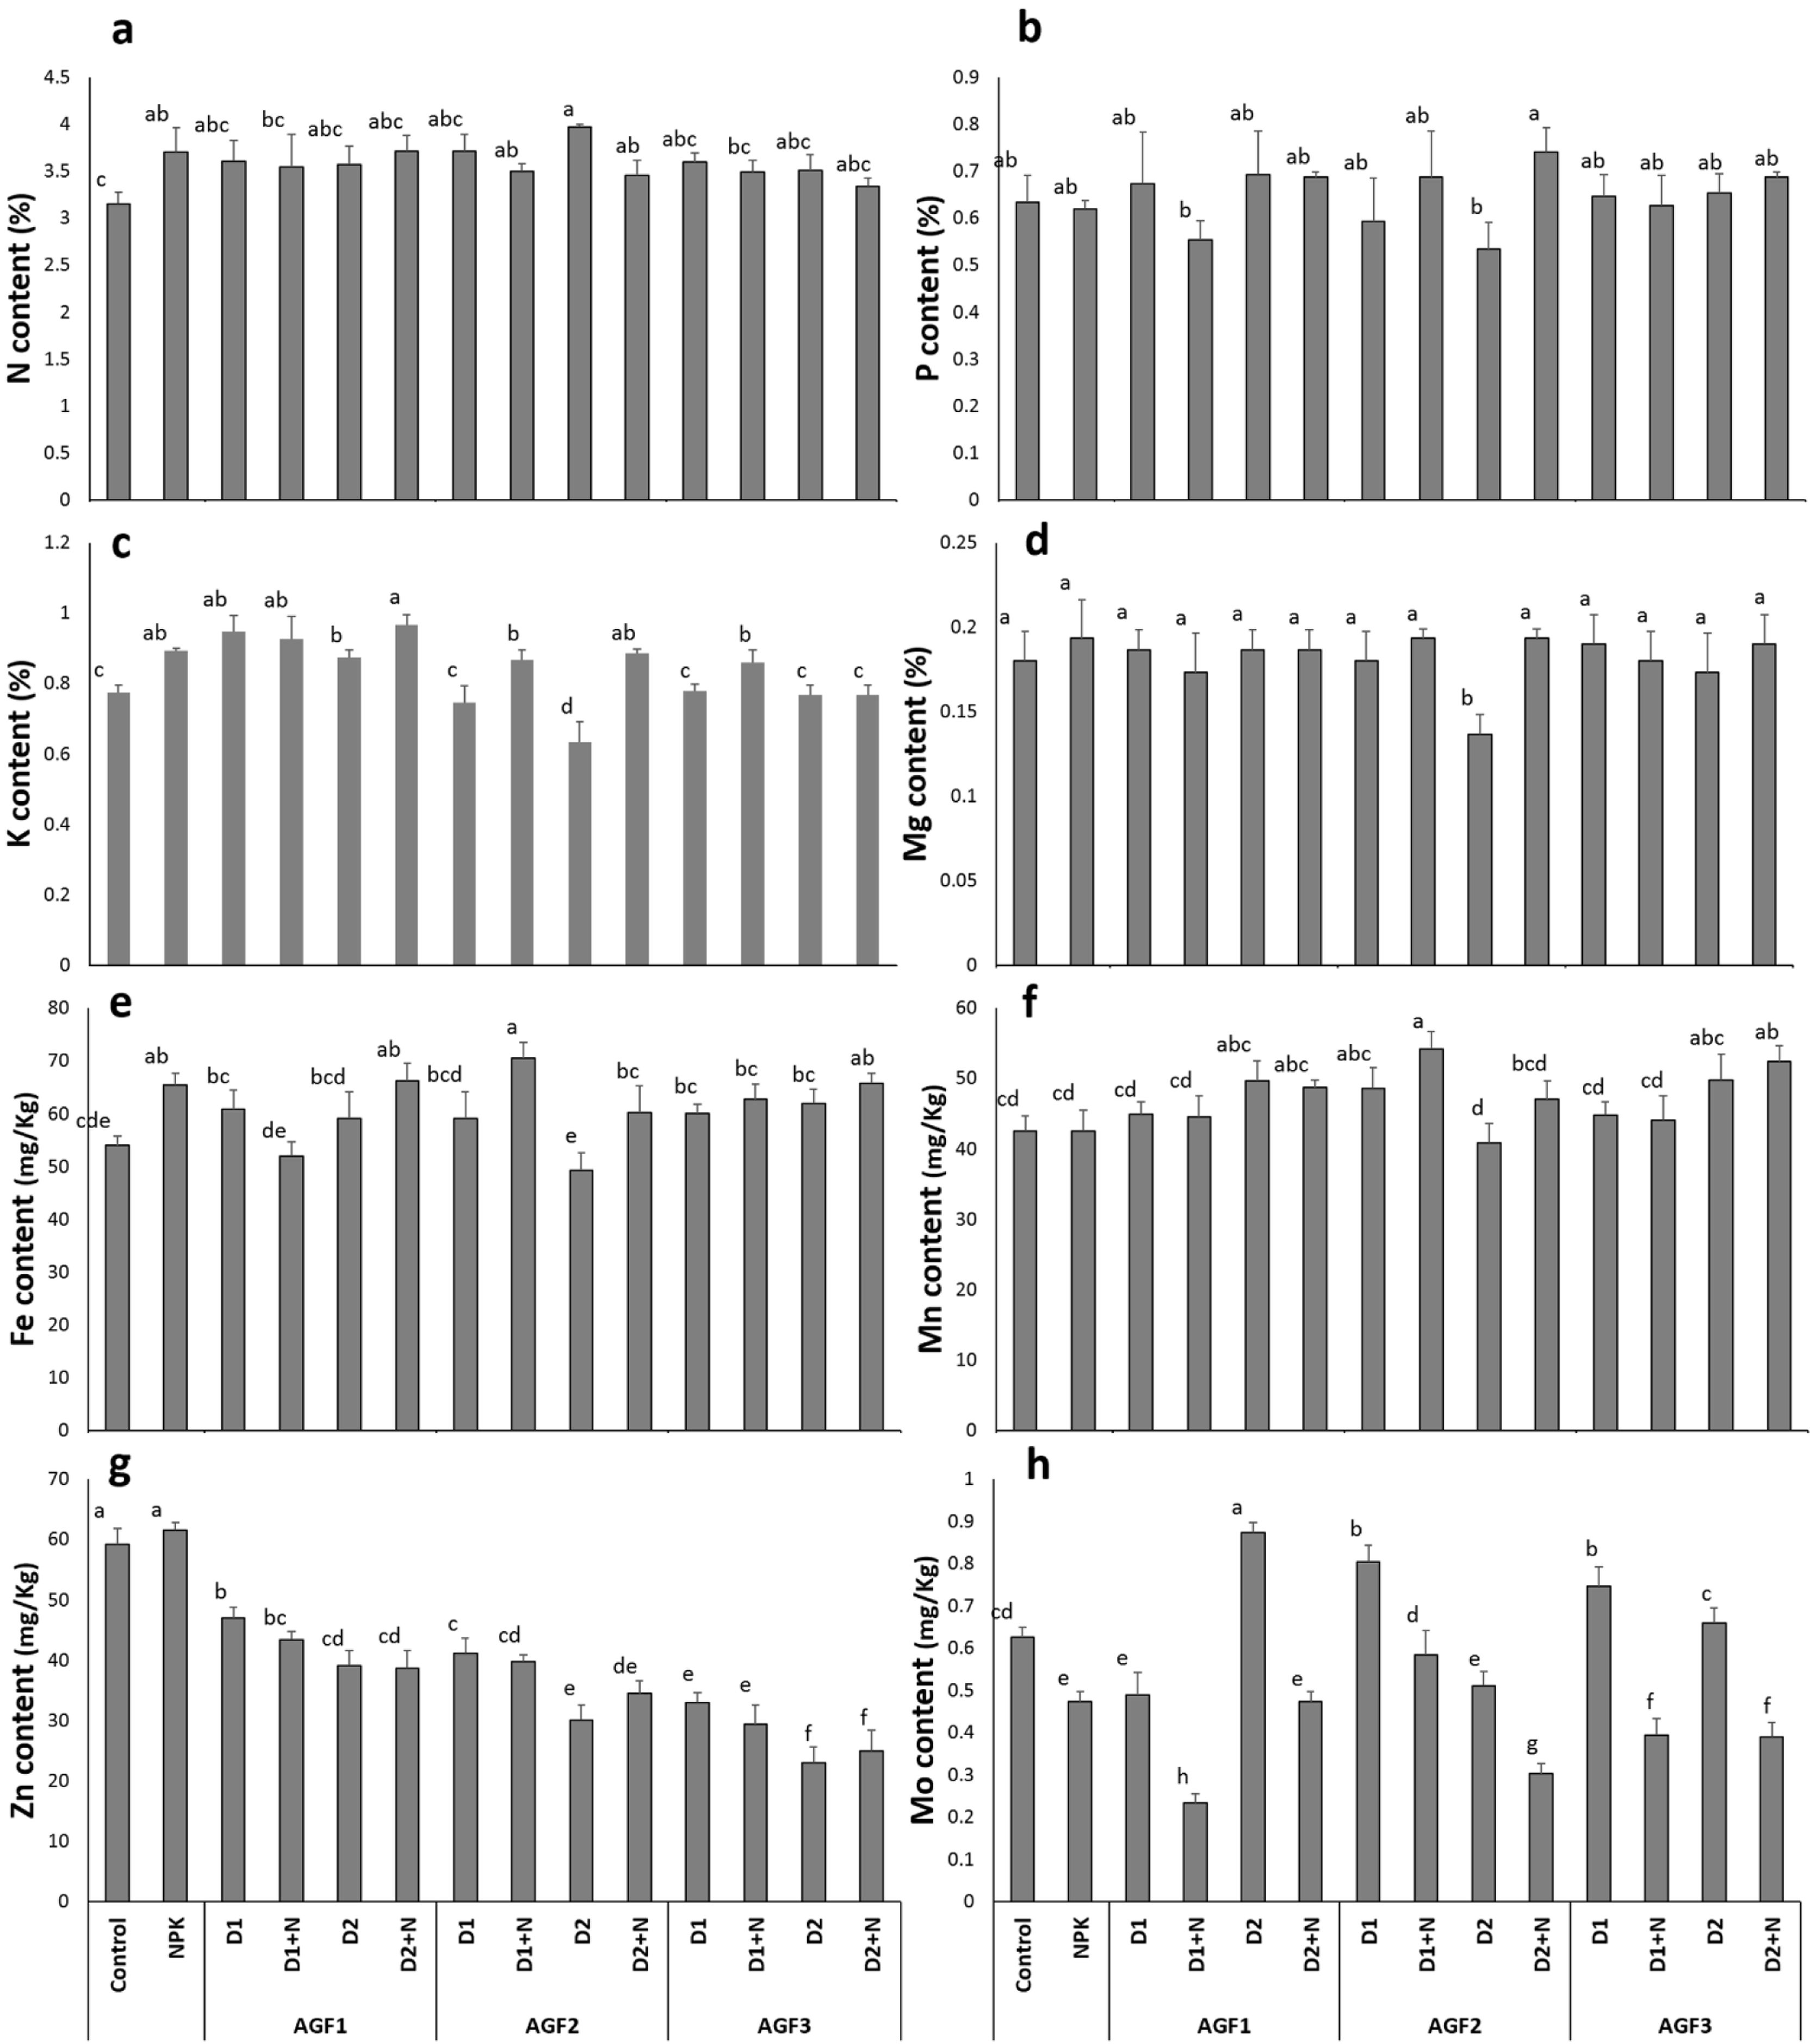
Grain mineral contentResults in Fig. 9 indicate that the application of NPK treatment showed a significant improvement in N, K, and Fe grain mineral concentration (18%, 16%, and 21%, respectively) in comparison to the control. Moreover, the NPK amendment caused a 24% decline in Mo concentration while no significant differences were noticed in P and Mg, Mn, and Zn content in comparison to the untreated wheat. The glass fertilizers application recorded almost the same effect of NPK treatment on these parameters except for Zn concentration, where a decreasing trend was noticed compared to the NPK and control and Mo content which showed improved values when the glass fertilizers were applied without N supplementation. The greatest increase (84%) in wheat grain mineral content was recorded for Mo concentration after the application of AGF1 D2 treatment in comparison to the NPK treatment. Our results are in line with the findings of previous studies [56,63] reporting the improvement of grain or fruit mineral content compared to the control. Indeed, Labbilta et al. [56] noticed that tomato fruit showed an improved mineral content with the application of agriglass fertilizers under field conditions. The positive effect of the phosphate glass fertilizers on wheat grain mineral content could be explained by the improved availability of these elements in the rhizospheric soil, which fit the plants’ needs in a timing fashion.
 nitrogen, (b) phosphorus, (c) potassium, (d) magnesium, (e) iron, (f) manganese, (g) zinc, and (h) molybdenum) of wheat plants treated with glass and chemical fertilizers. Bars with different letters are significantly different according to the SNK test, after performing one-way ANOVA (P<0.05).")
Fruit mineral content ((a) nitrogen, (b) phosphorus, (c) potassium, (d) magnesium, (e) iron, (f) manganese, (g) zinc, and (h) molybdenum) of wheat plants treated with glass and chemical fertilizers. Bars with different letters are significantly different according to the SNK test, after performing one-way ANOVA (P<0.05).
The physicochemical properties, structure, and dissolution behaviors of four phosphate glasses were examined in this study in relation to wheat nutrient requirements. The studied glasses were proven to be amorphous, and Raman and FTIR spectra revealed that the phosphate lattice's structure approaches that of metaphosphates, with the lattice-based primarily on Q2 units. With the addition of various components such as B2O3 and ZnO, the glass transition temperature (Tg), onset crystallization temperature (Tc,on), melting temperature (Tm), and glass stability increased, while the molar volume (VM) and glass dissolution decreased. These behaviors are thought to be caused by phosphate chain cross-linking and the replacement of the weakly hydrated P–O–P bond with a more chemically resistant X–O–P bond (X=Zn, B). In contrast, incorporating a small amount of copper oxide had no significant effect on the glass's physicochemical properties.
Moreover, all glasses dissolved congruently, and no selective ion leaching was observed. The agronomic valorization of the obtained glass fertilizers revealed a positive impact on wheat growth fitness, yield, photosynthetic parameters, and grain mineral content compared to conventional fertilizers and to the control. These results pave the way to applying these fertilizers in large-scale experimentation to confirm their potentiality in crop production and as an eco-friendly fertilizer.
FundingThis work was supported by the OCP Fondation (grant number: VAL-MES-01/2017).
Conflicts of interestThe authors declare no conflict of interest.
The authors would like to acknowledge the support through the R&D Initiative – Appel à projets autour des phosphates APPHOS – sponsored by OCP (OCP Foundation, R&D OCP, Mohammed VI Polytechnic University, National Center of Scientific and Technical Research CNRST, Ministry of Higher Education, Scientific Research and Professional Training of Morocco MESRSFC) under the project entitled *Elaboration et caractérisation de nouveaux engrais vitrifiés à base des phosphates*, project ID *VAL-MES-01/2017*.
We thank our sponsors who provided insight, expertise, and follow-up that greatly assisted this research.

