


A representative set of glass from mostly Indo-Pacific type beads and other materials including a carnelian bead from two Swahili sites of the Ibo Island at Northern Mozambique has been archaeometrically characterized to get insights into its likely provenance within the framework of the Indian Ocean trade networks. Selected samples were examined and analyzed by using binocular magnifying glass, field emission scanning electron microscopy with energy dispersive X-ray microanalysis, visible spectrophotometry and X-ray diffraction. Up to four different types of glasses were identified according to its chemical composition: mineral-soda alumina glass from Western India, vegetal-soda alumina glass from Central Asia, a conventional soda-lime silicate glass coming probably from Europe and a lead silicate glass of the PbO-SiO2 binary system most likely from Venice. Red and yellow colours were obtained through colloidal chromophores: cuprite micro-crystals for red brick and lead stannate and/or lead antimoniate micro-crystals for yellow, while deep blue, greenish blue and yellowish colours were obtained through ionic chromophores. Either the carnelian bead or the different types of glass are imported materials resulting from Swahili trade networks of the Indian Ocean, since no evidence of glass production or recycling has been found in archaeological fieldwork.
Se ha caracterizado arqueométricamente un conjunto representativo de vidrio procedente mayoritariamente de cuentas de tipo Indo-Pacífico y otros materiales, incluida una cuenta de cornalina, de dos yacimientos Swahili de la isla de Ibo en el norte de Mozambique, para obtener información sobre su posible procedencia en el marco de las redes comerciales del Océano Índico. Las muestras seleccionadas se examinaron y analizaron mediante lupa binocular, microscopia electrónica de barrido de emisión de campo con microanálisis de energía de dispersión de rayos X, espectrofotometría visible y difracción de rayos X. Según su composición química se identificaron hasta cuatro tipos diferentes de vidrio: vidrio de soda mineral con elevado contenido de alúmina de la India occidental, vidrio de soda vegetal con elevado contenido de alúmina de Asia Central, un vidrio de silicato sódico cálcico convencional procedente posiblemente de Europa y un vidrio de silicato de plomo del sistema binario PbO-SiO2 muy probablemente de Venecia. Los colores rojo y amarillo se obtuvieron mediante cromóforos coloidales: microcristales de cuprita para el rojo ladrillo y microcristales de estannato y/o antimoniato de plomo para el amarillo, mientras que los colores azul oscuro, azul verdoso y amarillento se obtuvieron mediante cromóforos iónicos. Tanto la cuenta de cornalina como los diferentes tipos de vidrio son materiales importados producto de las redes comerciales Swahili del Océano Índico, ya que no se ha hallado evidencia de producción o reciclaje de vidrio en los trabajos arqueológicos.
Around CE 1000 the inhabitants of the Eastern African shore became involved in Indian Ocean trade networks. Port cities built in stone coral-reef emerged and Islam gradually became the dominant religious belief among the local population, the Waswahili, who developed their own cultural features and a trade language, the Kiswahili, still spoken in many areas of eastern and southern Africa [1,2]. Urban centres were just one of the actors. Many small and humble coastal villages were also involved as middlemen between the inner Continent and Asian traders.
One of these minor actors was the Quirimbas archipelago, located in Northern Mozambique and consisting of around 50 inshore coral platform islands, not all of them inhabited. Contrary to neighbour territories of Tanzania and Kenia, where archaeological research on the coastal cities began early in the 20th century, little is known on the role of Northern coast of Mozambique into the Swahili trade other than references in texts [3]. This is partly due to the long distance to the capital city, former Lourenço Marques during the Portuguese rule and presently Maputo, to the lack of good overland transport and, specially, to the protracted conflict in Northern Mozambique, the main theatre of the civil war, which lasted from independence of the Portuguese in the 1970s up to 1992.
The Quirimbas archipelago was conquered in late 16th century AD by the Portuguese, who wanted to take control of the gold trade between the Zambezi area and the Kilwa Sultanate [4], but according to a Portuguese writer the attack was requested by envoys of Zanzibar and Pemba to punish the Quirimbas Islands, which were their subjects but had rebelled and were now supporting Mombasa [5].
The Eduardo Mondale University of Maputo has launched since the late 1970s a programme of research in the area, both on the Quirimbas archipelago and on some sites of the opposite Continental shore, which has produced information on the Swahili settlement of these areas even though it was based mainly on field surveys and small test pits [6–8]. With the aim of contributing to the knowledge of the role played by Northern Mozambique in the Indian Ocean trade, a research programme was developed by a Spanish archaeological team in cooperation with the Eduardo Mondlane University, which produced systematically excavated and well dated contexts from 2015 to 2017. Unfortunately, since 2018 the unrest caused by the Islamic guerrilla Al Sabbah has exponentially increased in the area, which has prevented from progressing in this investigation [9,10].
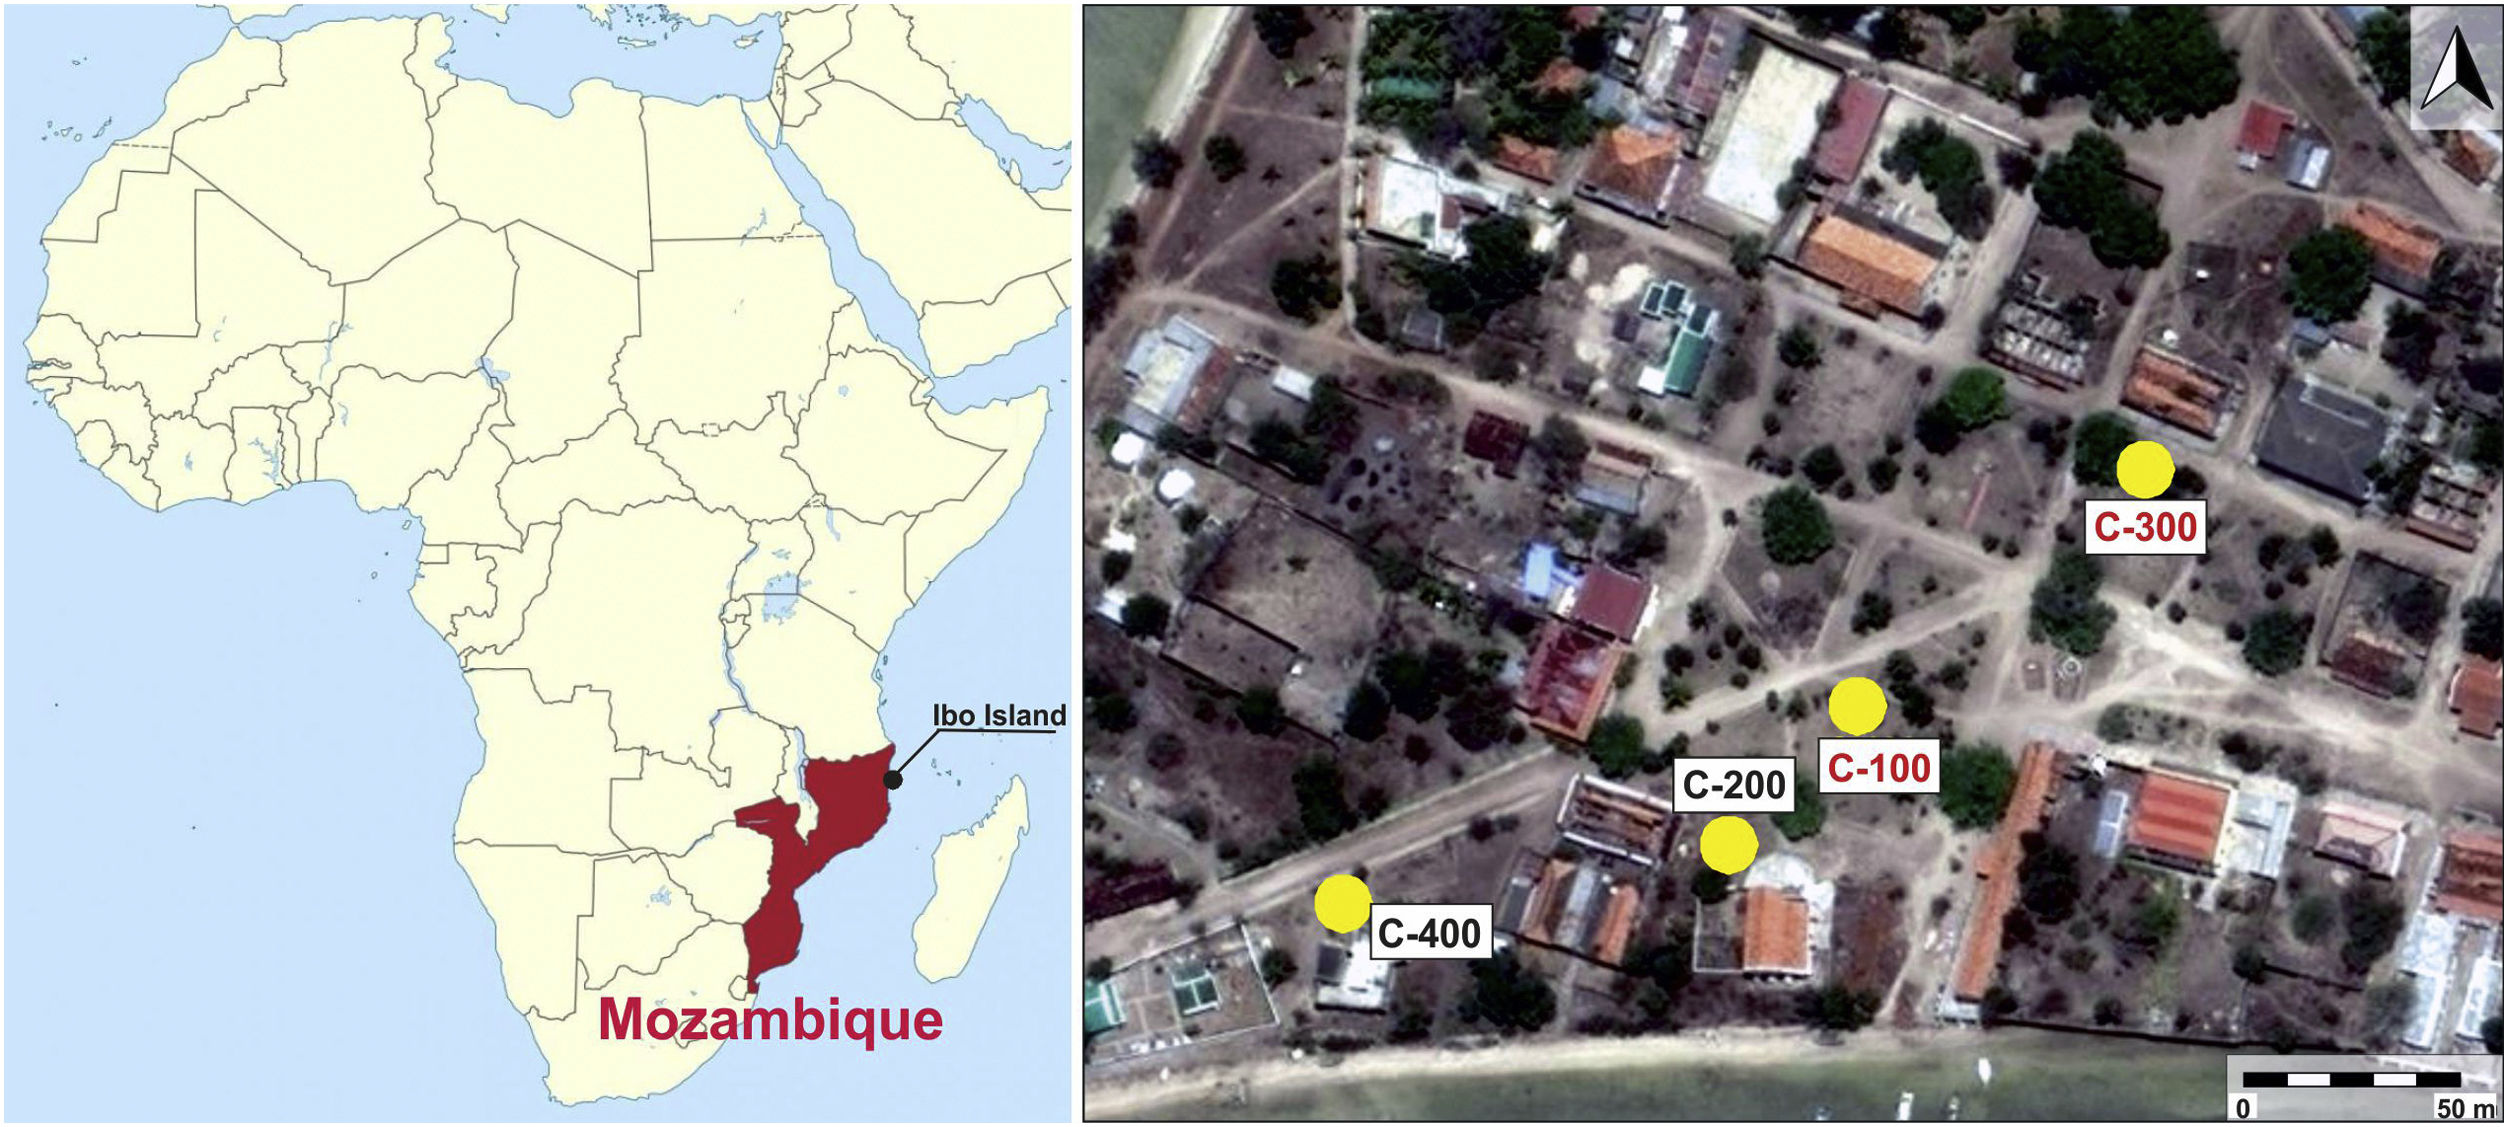
After field surveys in most accessible islands of Quirimbas archipelago, archaeological fieldwork was focused on the Portuguese town of Ibo in Ibo Island [11]. An almost undisturbed Swahili living floor was first investigated in an open area excavation, the so-called site C-400, which is dated to the 11th and 12th centuries AD. The floor was partially sealed and preserved by a slid off dune, what means that the Swahili village was close to the shore. The building of a Portuguese stronghold in 19th century AD altered and destroyed most of this Swahili site [10]. Among other findings, an important set of mainly glass and shell beads was found in the C-400 site. While shell beads were locally made, all the glass beads and glass fragments were imported, appearing up to three different types of glass whose archaeometric study suggested that they came from the western coast of India, from somewhere in Central Asia and also from Europe. Due to chronology and the sandy nature of the site, European glass samples must have percolated down from the upper levels. [12]. In addition to site C-400, up to three test pits were excavated from 150m away and near to the main harbour area (Fig. 1). The site C-200 did not produce any finding, it was archaeologically sterile, whereas sites C-100 and C-300, despite they did not provide dwelling structures, offered a stratigraphy with two very different phases defined by two local ceramic traditions: Sancul and Lumbo, even though establishing its chronology was not an easy task as one cannot talk about an accurate stratigraphy.
 and the different excavation sites on the Portuguese town of Ibo. C-100 and C-300 sites are written in red.")
Site C-100 produced an upper phase dated between the 14th/15th and 18th/19th centuries AD by the finding of local hand-made impressed ware and red burnished dishes of Sancul type, together with imports of Chinese porcelain and Portuguese earthenware and British glazed wares from the 17th to 19th centuries AD. This upper phase comprises the stratigraphic units (SU) 101, 102-1, 102-2, 103-1, 103-2 and 104-1, respectively. In the SU 103-2, a shard of wheel-made glazed imported ware which is out of tune with this context was also found here. It is a Champlevé type made in Southern Iran between the 11th and 13th centuries AD. Given that its ID number is duplicated by a human mistake, it could be actually from the SU 104 since here there was another imported shard from Southern Iran of similar chronology. In the SU 104-1, there were neither European nor Chinese porcelain imports and the local ware was impressed or incise decorated, typical of the Lumbo horizon. The lower phase levels provided local handmade pottery of Lumbo type, together with fragments of a bead polisher, wheel-made glazed ware imported, and an important set of mainly glass and shell beads. Two Accelerator Mass Spectrometry (AMS) samples on bone: one from AD 995 to 1149 and another one from AD 1190 to 1265, along with the imports, suggest a chronology for this lower phase of around the early 11th to 13th centuries AD. This lower phase comprises the SUs 104-2, 104-3, 105 and 106, respectively. From the SU 104-3 comes an imported Monochrome Yellow Sgrafiatto shard from Southern Iran dated from mid-11th to 13th centuries AD that could provide a post quem data for the overlapped SU 104-1 [13].
Site C-300 offered an upper phase with pottery of Sancul type with red slip and sometimes fine lattice decoration. This latter is well-known in Tanzanian sites of Songo Mnara and Kilwa dated from the 15th to 17th centuries AD [14], but also in Mozambique Island and other Mozambican sites [15]. Some Chinese porcelain imports from the 16th to 18th centuries AD were also found, which together with a fragment of earthenware of the Blue transfer type very common in Europe in the 18th and 19th centuries AD, date the upper phase levels from the 15th to 19th centuries AD. This upper phase comprises the SUs 301, 302-1 and 302-2, respectively. The lower phase levels were characterized by the appearance of fragments of incised, finger and dot, and roulette impressions or cane-decorated impressed ware of Lumbo tradition, not difference from those of the lower phase of the C-100 site. Along with this pottery and fragments of bead polishers made with clay similar to those recovered in Tumbe (Pemba island, Tanzania) in contexts dated to mid-8th and 10th centuries AD [16], an outstanding set of mainly glass and shell beads was also here found. In addition to glass and shell beads, two other beads made of respectively gold and carnealian were as well unearthed in the same context, which was dated by AMS to late 10th to mid-12th centuries AD. This lower phase comprises the SUs 302-3, 302-4, 303-1 and 304, respectively. A chronological hint for the SU 302-4 comes from an imported shard, either of a Late Polychrome Sgrafiatto or, less probably, of the Green on White Splashed Sgrafiatto types, both of them made in Southern Iran between mid-11th and 13th centuries AD [13]. According to the archaeometric data recently published [17], gold of the bead probably came from ores of the Zimbabwean plateau, whereas carnelian origin remains unknown despite they are not uncommon in Swahili contexts where they were supposedly used as money [18].
In this context the main goal of this work is the study and archaeometric characterization of glass beads and other glass fragments, as well as a carnelian bead found in C-100 and C-300 sites located in the Swahili settlement on the Ibo Island (Northern Mozambique). Given that these two sites are located in the vicinity of the C-400 site, they both have a close chronology to this one, and glass beads and other glass materials found at the C-400 site have been previously studied [12], this contribution also aims to compare archaeometric results from C-100 and C-300 sites with those previously obtained in materials from the C-400 site, to determine similarities or differences all within the general framework of the Indian Ocean trade.
ExperimentalSamples selectedA total of 343 beads, plus a yellowish flat glass fragment, were found at the C-100 site: 77.0% of the beads were made of glass, 22.7% of shell and 0.3%, represented by a single bead, were made of fishbone. A total of 282 beads, plus a colourless hollow glass fragment, were found at the C-300 site: 77.3% of the beads were made of glass, 22.0% of shell and 0.7%, represented by two beads: one of carnelian and the other of gold [17]. The percentages of the different bead types are very similar on both sites. Comparatively, a greater number of glass beads appeared at C-100 and C-300 sites. However, at these two sites the shell beads are less represented than at the C-400 site (60.0% of glass beads and 38.7% of shell beads) [12].
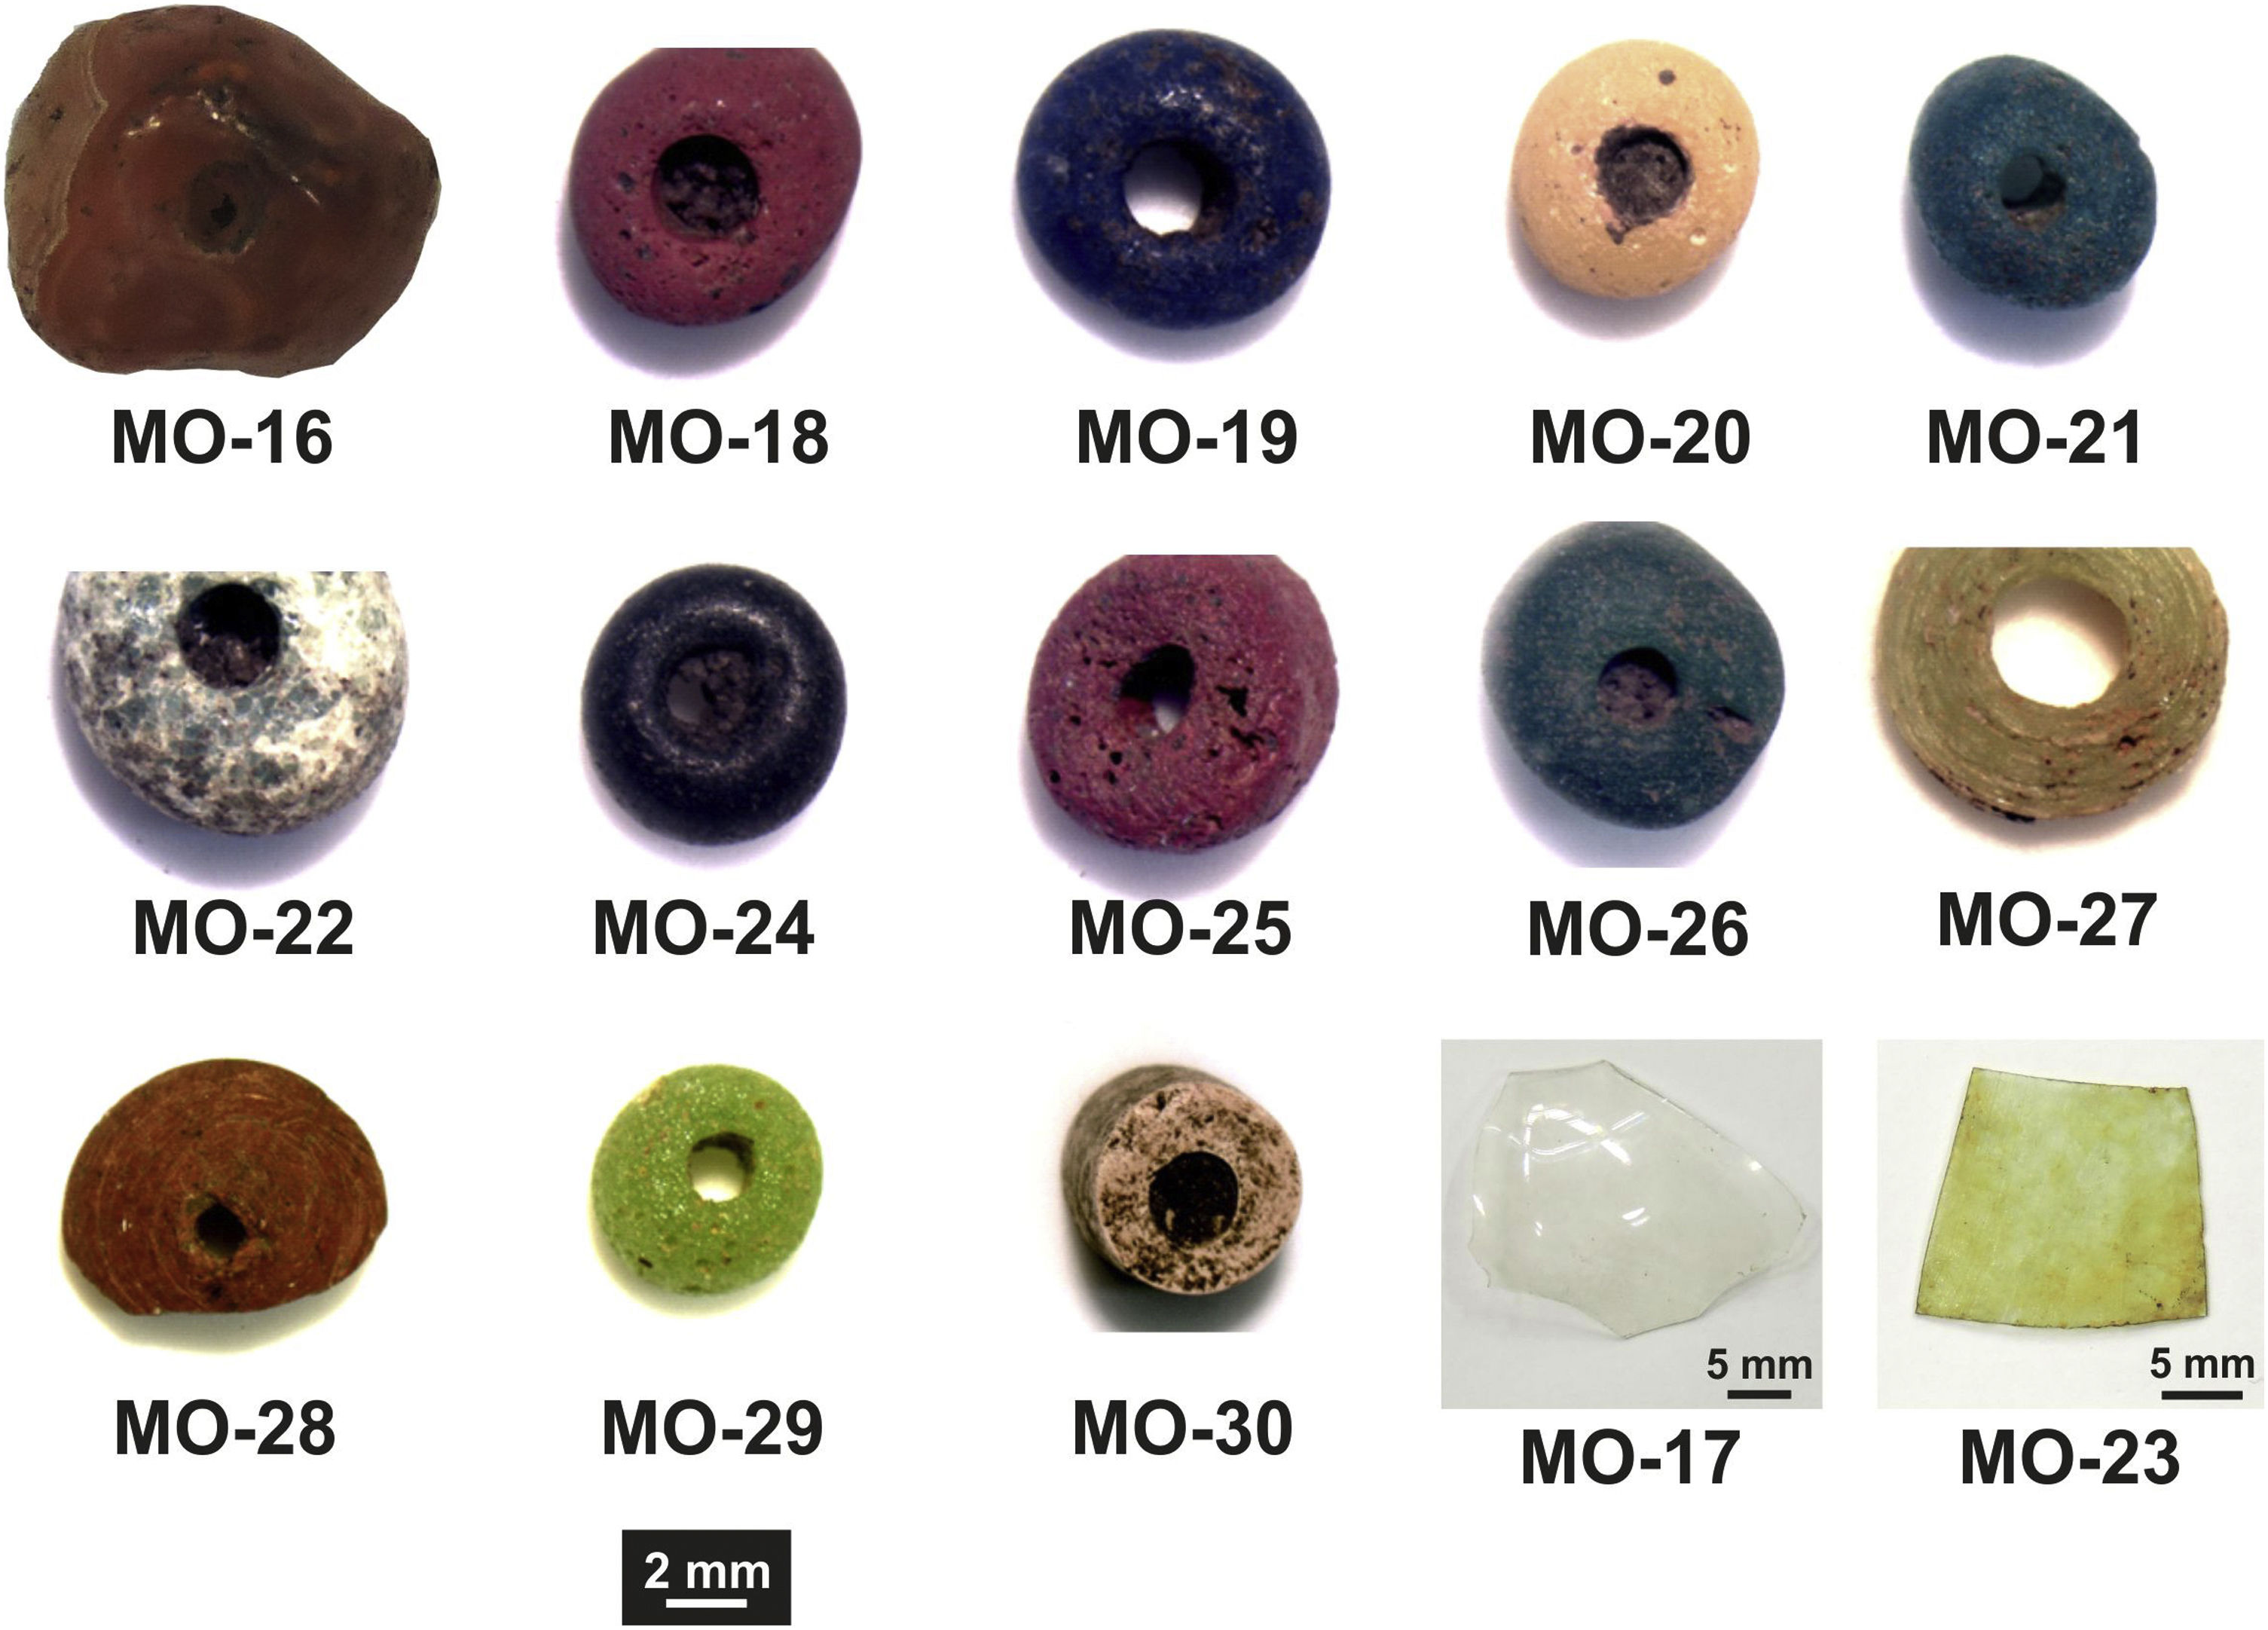
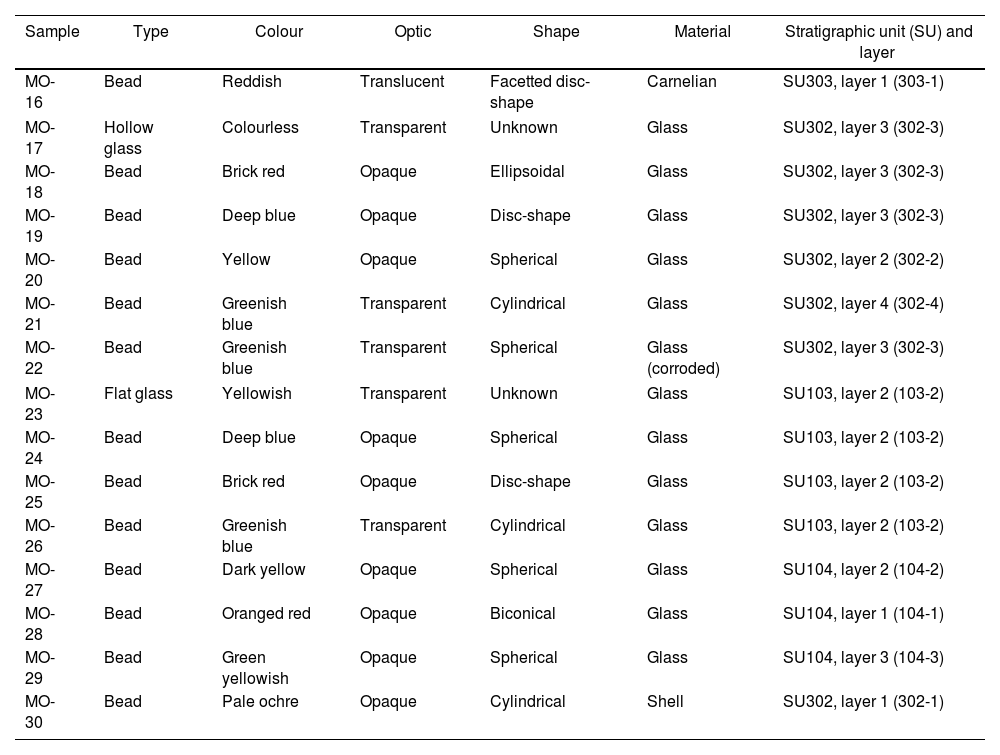
Archaeometric characterization was undertaken on a representative set of 15 samples: 7 from site C-100 and 8 from site C-300. The selection covered the carnelian bead and all the colours presented by the glass beads. Most of the beads are opaque, although some of them are translucent. Very few are transparent. Two glass fragments were also selected: a flat glass and a hollow glass, as well as a shell bead to check if these beads were made with the same material as that characterized in the beads from the C-400 site. Descriptive characteristics of selected samples are given in Table 1 and Fig. 2 shows their images. Nomenclature of the samples continues the numbering of the previous study carried out at the C-400 site.
Descriptive characteristics of selected samples for this study.
| Sample | Type | Colour | Optic | Shape | Material | Stratigraphic unit (SU) and layer |
|---|---|---|---|---|---|---|
| MO-16 | Bead | Reddish | Translucent | Facetted disc-shape | Carnelian | SU303, layer 1 (303-1) |
| MO-17 | Hollow glass | Colourless | Transparent | Unknown | Glass | SU302, layer 3 (302-3) |
| MO-18 | Bead | Brick red | Opaque | Ellipsoidal | Glass | SU302, layer 3 (302-3) |
| MO-19 | Bead | Deep blue | Opaque | Disc-shape | Glass | SU302, layer 3 (302-3) |
| MO-20 | Bead | Yellow | Opaque | Spherical | Glass | SU302, layer 2 (302-2) |
| MO-21 | Bead | Greenish blue | Transparent | Cylindrical | Glass | SU302, layer 4 (302-4) |
| MO-22 | Bead | Greenish blue | Transparent | Spherical | Glass (corroded) | SU302, layer 3 (302-3) |
| MO-23 | Flat glass | Yellowish | Transparent | Unknown | Glass | SU103, layer 2 (103-2) |
| MO-24 | Bead | Deep blue | Opaque | Spherical | Glass | SU103, layer 2 (103-2) |
| MO-25 | Bead | Brick red | Opaque | Disc-shape | Glass | SU103, layer 2 (103-2) |
| MO-26 | Bead | Greenish blue | Transparent | Cylindrical | Glass | SU103, layer 2 (103-2) |
| MO-27 | Bead | Dark yellow | Opaque | Spherical | Glass | SU104, layer 2 (104-2) |
| MO-28 | Bead | Oranged red | Opaque | Biconical | Glass | SU104, layer 1 (104-1) |
| MO-29 | Bead | Green yellowish | Opaque | Spherical | Glass | SU104, layer 3 (104-3) |
| MO-30 | Bead | Pale ochre | Opaque | Cylindrical | Shell | SU302, layer 1 (302-1) |

Samples were observed and analyzed using the following characterization techniques: optical microscopy (OM) using a binocular magnifying glass, field emission scanning electron microscopy (FESEM) with energy dispersive X-ray (EDS) microanalysis, visible spectrophotometry and X-ray diffraction (XRD).
Binocular magnifying glass observations were accomplished with Motic SMZ 168 binocular equipment, fitted with a Moticam 2500 digital camera. Examination of samples by FESEM was undertaken on cross-sections, inlaying the samples into cold-setting epoxy resin that was later mirror polished using an aqueous suspension of cerium oxide. Samples were coated with a thin film of graphite as a conductive medium with a JEOL JEE4b vaporizer. The equipment used was a Hitachi S-4800 cold cathode field emission SEM, working with acceleration voltages of 15kV. Micrographs were obtained using secondary electron (SE) and backscattered electron (BSE) modes. EDS microanalyses were carried out with a 20mm2 Oxford X-Max system with a resolution of 125eV (Mn Kα) coupled to the SEM. Chemical composition of glass samples was estimated from the average of three measurements made in the cross-sections on areas of clean glass body to avoid external layers of corrosion or alteration. The EDS system used is routinely calibrated using pure metals and synthetic standards. Nevertheless, quality of data has been furthermore verified with two certified glass reference materials from The Society of Glass Technology (Sheffield, UK): Standard Glass No. 7 (Soda-lime silicate glass) and Standard Glass No. 10 (Amber soda-lime silicate glass). The error or coefficient of variation for major oxides ranges around 0.20% for SiO2, 0.79–0.95% for Na2O, and 1.63–2.08% for CaO; while for minor oxides ranges 6.09–10.69% for MgO, 9.91–11.78% for K2O, 6.50–11.55% for Al2O3 and over 11.50% for Fe2O3. Other oxides such as PbO or MnO show coefficients of variation lower than 1.00% for PbO and around 8.00% for MnO. The error for Cl− is about 5.50%.
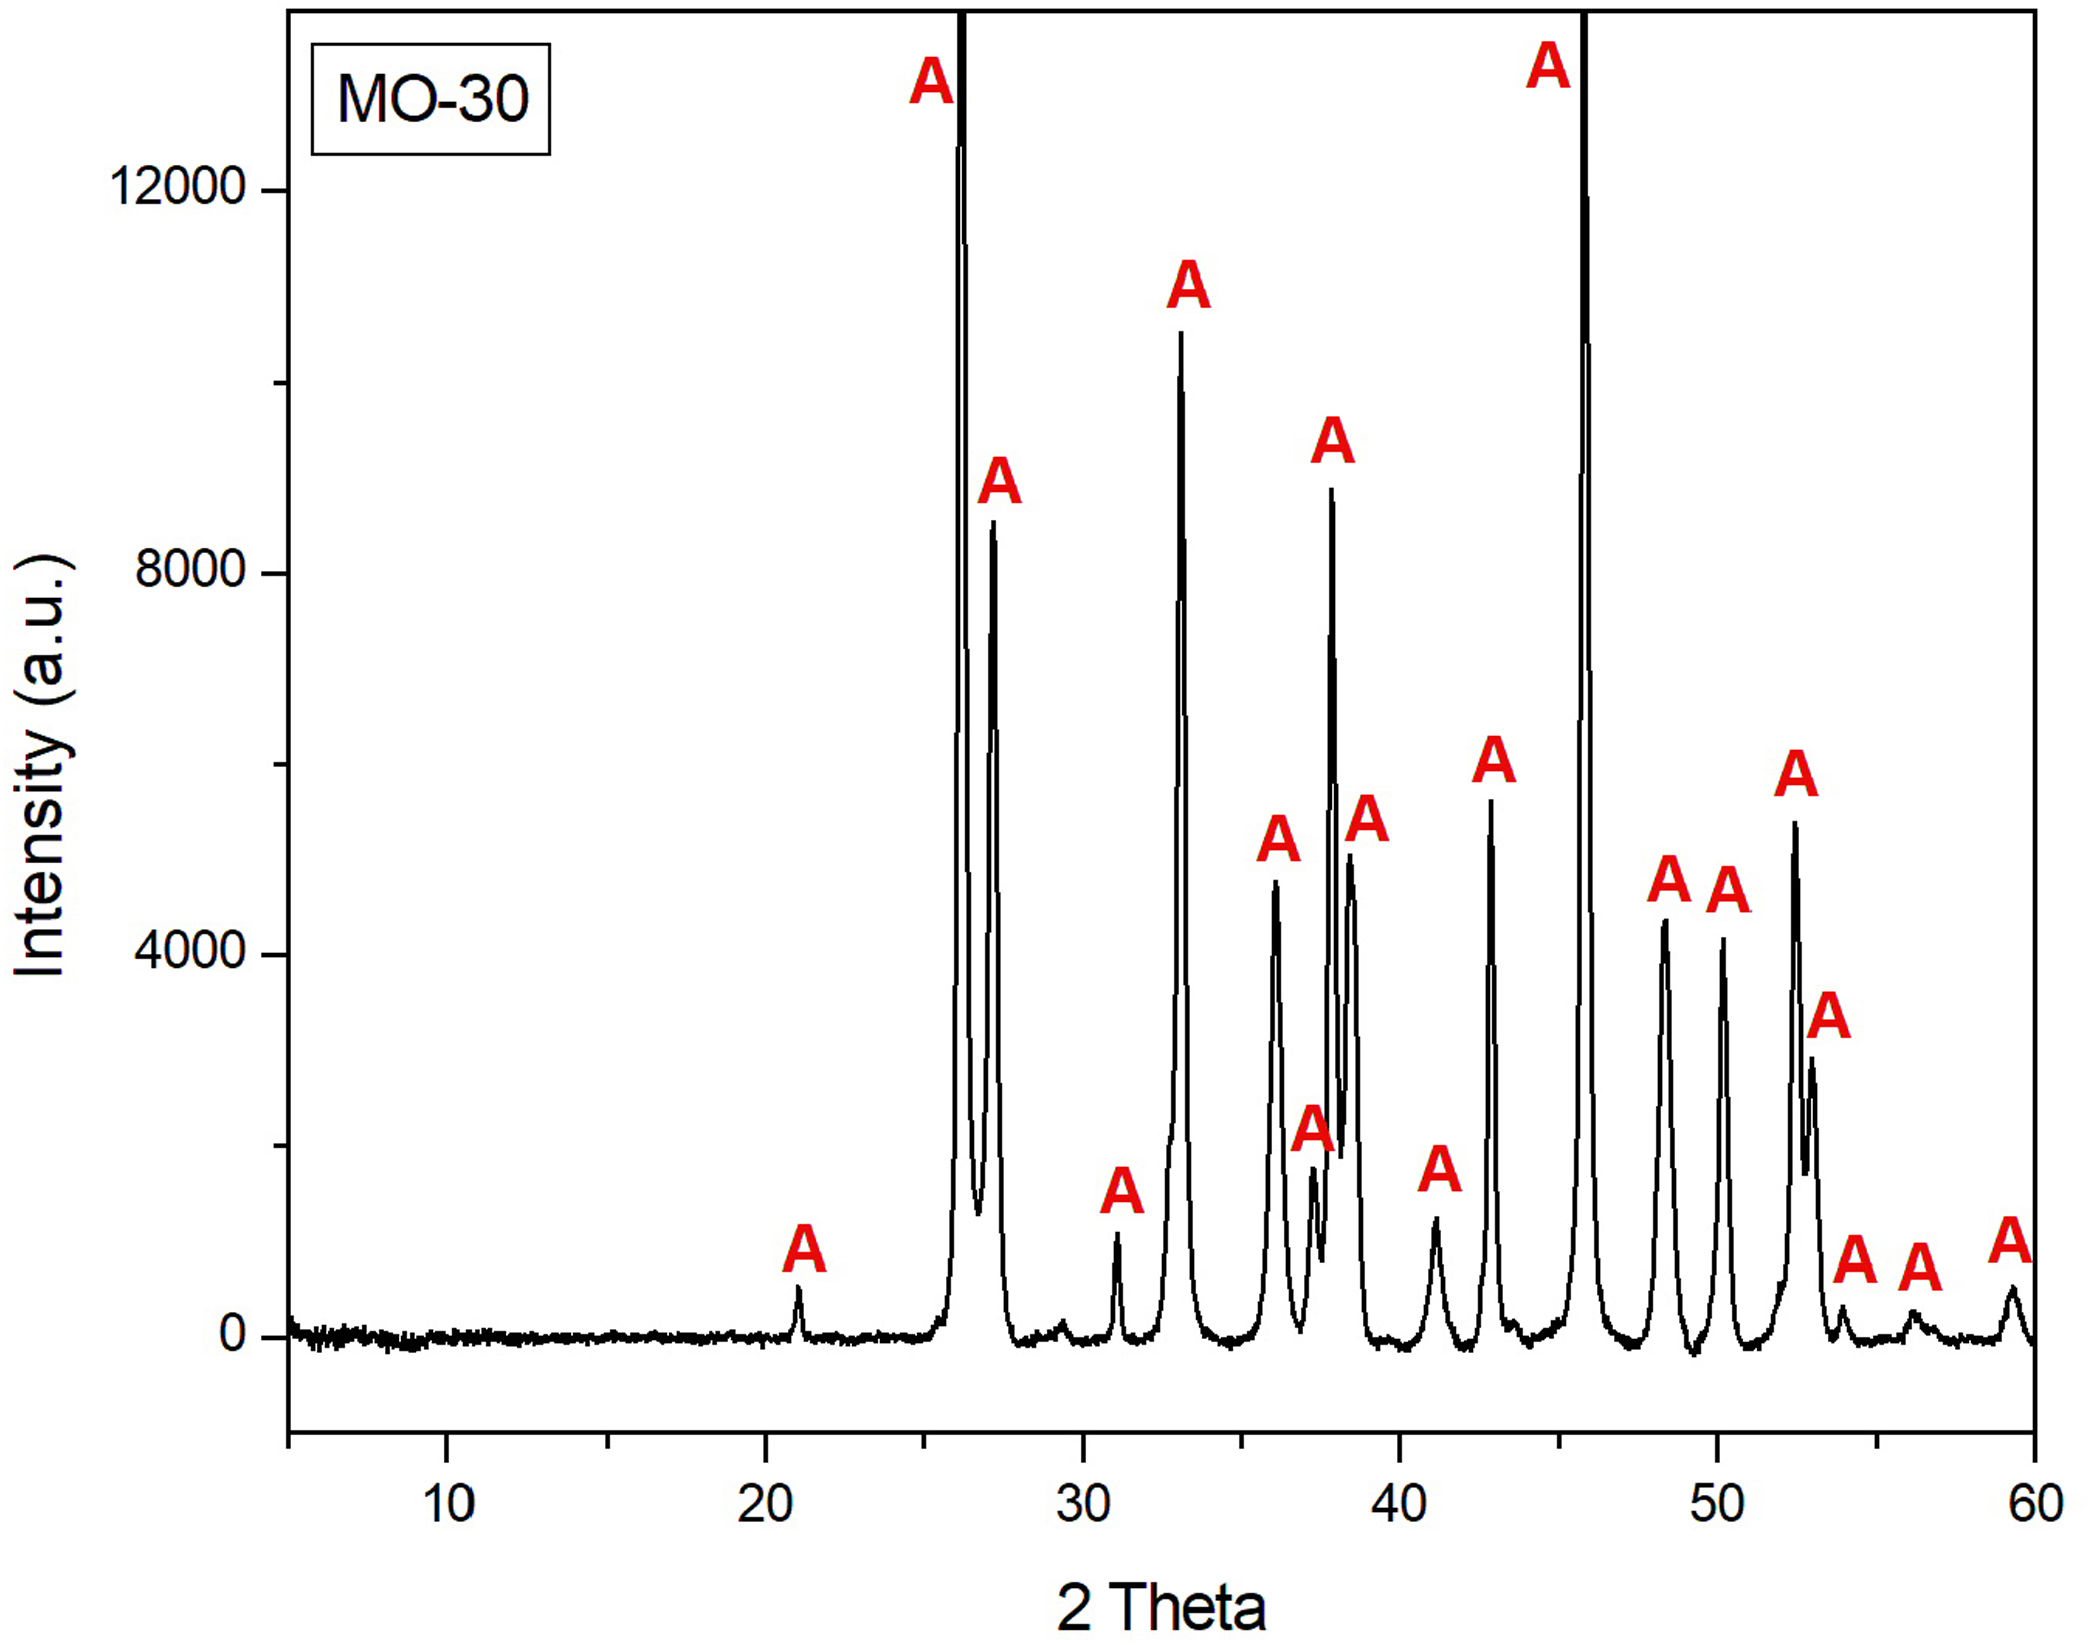
Chemical species or chromophores responsible for glass colouring were determined by means of visible spectrophotometry with Ocean Optics model HR 4000 CG equipment. Spectra were acquired by reflection and recorded in the 200–1000nm wavelength range. XRD analysis was only accomplished on the shell bead (sample MO-30) through a PANalytical X’Pert MPD diffractometer, using the Kα radiation of copper (1.54056Å) and working conditions of 45kV and 40mA. Diffractogram was recorded between 2θ=5–60°, with angle step of 0.03° and time per step of 2s. XRD was carried out on a powdered sample ground with mortar and pestle of agate.
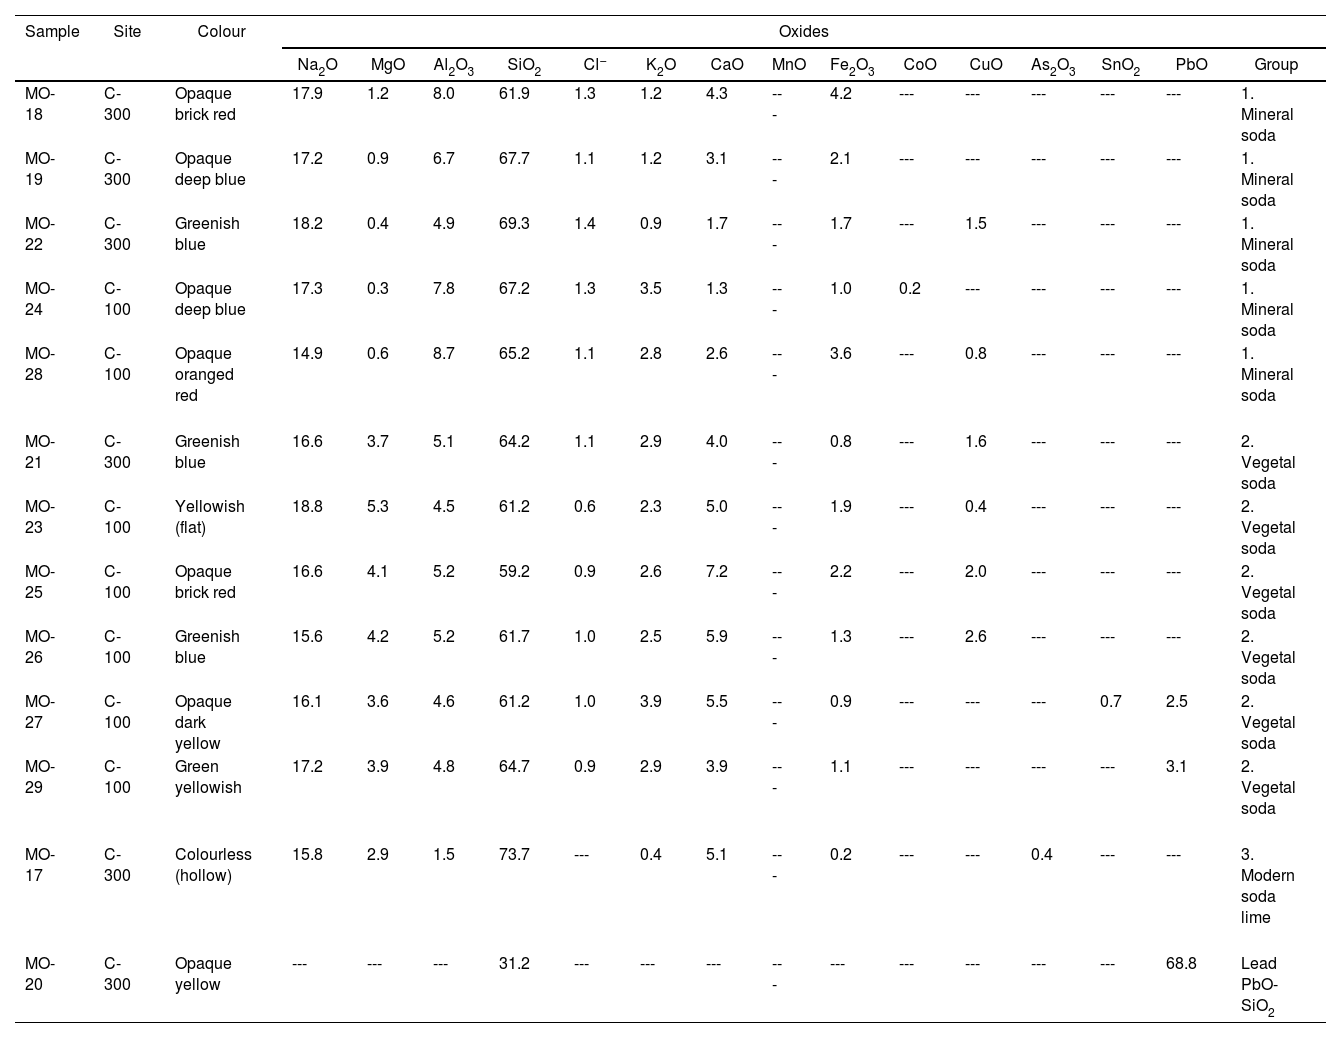
Results and discussionChemical composition of glass beads and glass fragmentsTable 2 shows the results of the chemical composition corresponding to the 13 glass samples analyzed: 11 beads and 2 fragments of flat and hollow glass. Of the 13 samples, 12 were made with soda-lime silicate glass from the Na2O-CaO-SiO2 system, while sample MO-20 was made with lead silicate glass from the PbO-SiO2 binary system.
EDS results of chemical composition (wt.%).
| Sample | Site | Colour | Oxides | ||||||||||||||
|---|---|---|---|---|---|---|---|---|---|---|---|---|---|---|---|---|---|
| Na2O | MgO | Al2O3 | SiO2 | Cl− | K2O | CaO | MnO | Fe2O3 | CoO | CuO | As2O3 | SnO2 | PbO | Group | |||
| MO-18 | C-300 | Opaque brick red | 17.9 | 1.2 | 8.0 | 61.9 | 1.3 | 1.2 | 4.3 | --- | 4.2 | --- | --- | --- | --- | --- | 1. Mineral soda |
| MO-19 | C-300 | Opaque deep blue | 17.2 | 0.9 | 6.7 | 67.7 | 1.1 | 1.2 | 3.1 | --- | 2.1 | --- | --- | --- | --- | --- | 1. Mineral soda |
| MO-22 | C-300 | Greenish blue | 18.2 | 0.4 | 4.9 | 69.3 | 1.4 | 0.9 | 1.7 | --- | 1.7 | --- | 1.5 | --- | --- | --- | 1. Mineral soda |
| MO-24 | C-100 | Opaque deep blue | 17.3 | 0.3 | 7.8 | 67.2 | 1.3 | 3.5 | 1.3 | --- | 1.0 | 0.2 | --- | --- | --- | --- | 1. Mineral soda |
| MO-28 | C-100 | Opaque oranged red | 14.9 | 0.6 | 8.7 | 65.2 | 1.1 | 2.8 | 2.6 | --- | 3.6 | --- | 0.8 | --- | --- | --- | 1. Mineral soda |
| MO-21 | C-300 | Greenish blue | 16.6 | 3.7 | 5.1 | 64.2 | 1.1 | 2.9 | 4.0 | --- | 0.8 | --- | 1.6 | --- | --- | --- | 2. Vegetal soda |
| MO-23 | C-100 | Yellowish (flat) | 18.8 | 5.3 | 4.5 | 61.2 | 0.6 | 2.3 | 5.0 | --- | 1.9 | --- | 0.4 | --- | --- | --- | 2. Vegetal soda |
| MO-25 | C-100 | Opaque brick red | 16.6 | 4.1 | 5.2 | 59.2 | 0.9 | 2.6 | 7.2 | --- | 2.2 | --- | 2.0 | --- | --- | --- | 2. Vegetal soda |
| MO-26 | C-100 | Greenish blue | 15.6 | 4.2 | 5.2 | 61.7 | 1.0 | 2.5 | 5.9 | --- | 1.3 | --- | 2.6 | --- | --- | --- | 2. Vegetal soda |
| MO-27 | C-100 | Opaque dark yellow | 16.1 | 3.6 | 4.6 | 61.2 | 1.0 | 3.9 | 5.5 | --- | 0.9 | --- | --- | --- | 0.7 | 2.5 | 2. Vegetal soda |
| MO-29 | C-100 | Green yellowish | 17.2 | 3.9 | 4.8 | 64.7 | 0.9 | 2.9 | 3.9 | --- | 1.1 | --- | --- | --- | --- | 3.1 | 2. Vegetal soda |
| MO-17 | C-300 | Colourless (hollow) | 15.8 | 2.9 | 1.5 | 73.7 | --- | 0.4 | 5.1 | --- | 0.2 | --- | --- | 0.4 | --- | --- | 3. Modern soda lime |
| MO-20 | C-300 | Opaque yellow | --- | --- | --- | 31.2 | --- | --- | --- | --- | --- | --- | --- | --- | --- | 68.8 | Lead PbO-SiO2 |
(---) not detected.
The 12 soda-lime silicate glass samples can be divided into three groups:
- -
Group 1 (Table 2). It is composed of 5 samples (all of them beads): MO-18, MO-19 and MO-22 from the C-300 site; and MO-24 and MO-28 from the C-100 site. These beads come respectively from the SUs 302-3 (MO-18 to MO-22), in the lower phase of the C-300 site, as well as from the SUs 103-2 (MO-24) and 104-1 (MO-28), both in the upper phase of the C-100 site (Table 1).
The Na2O content is between 14.9 and 18.2wt.%, that of CaO between 1.3 and 3.1wt.% and that of SiO2 between 61.9 and 69.3wt.%. This group is characterized by a relatively low percentage of MgO (0.3–1.2wt.%) and quite high of alumina (4.9–8.7wt.%), with percentages of Cl− higher than 1.0wt.% (1.1–1.4). These characteristics suggest that they are glasses with a high content of alumina and a sodium source of mineral origin known in the literature as m-Na-Al. This type of glass is different from natron-based glass, whose sodium source is also of mineral origin, from which it differs by having alumina contents higher than 4.0wt.% and K2O higher than 1.0–1.5wt.% [19].
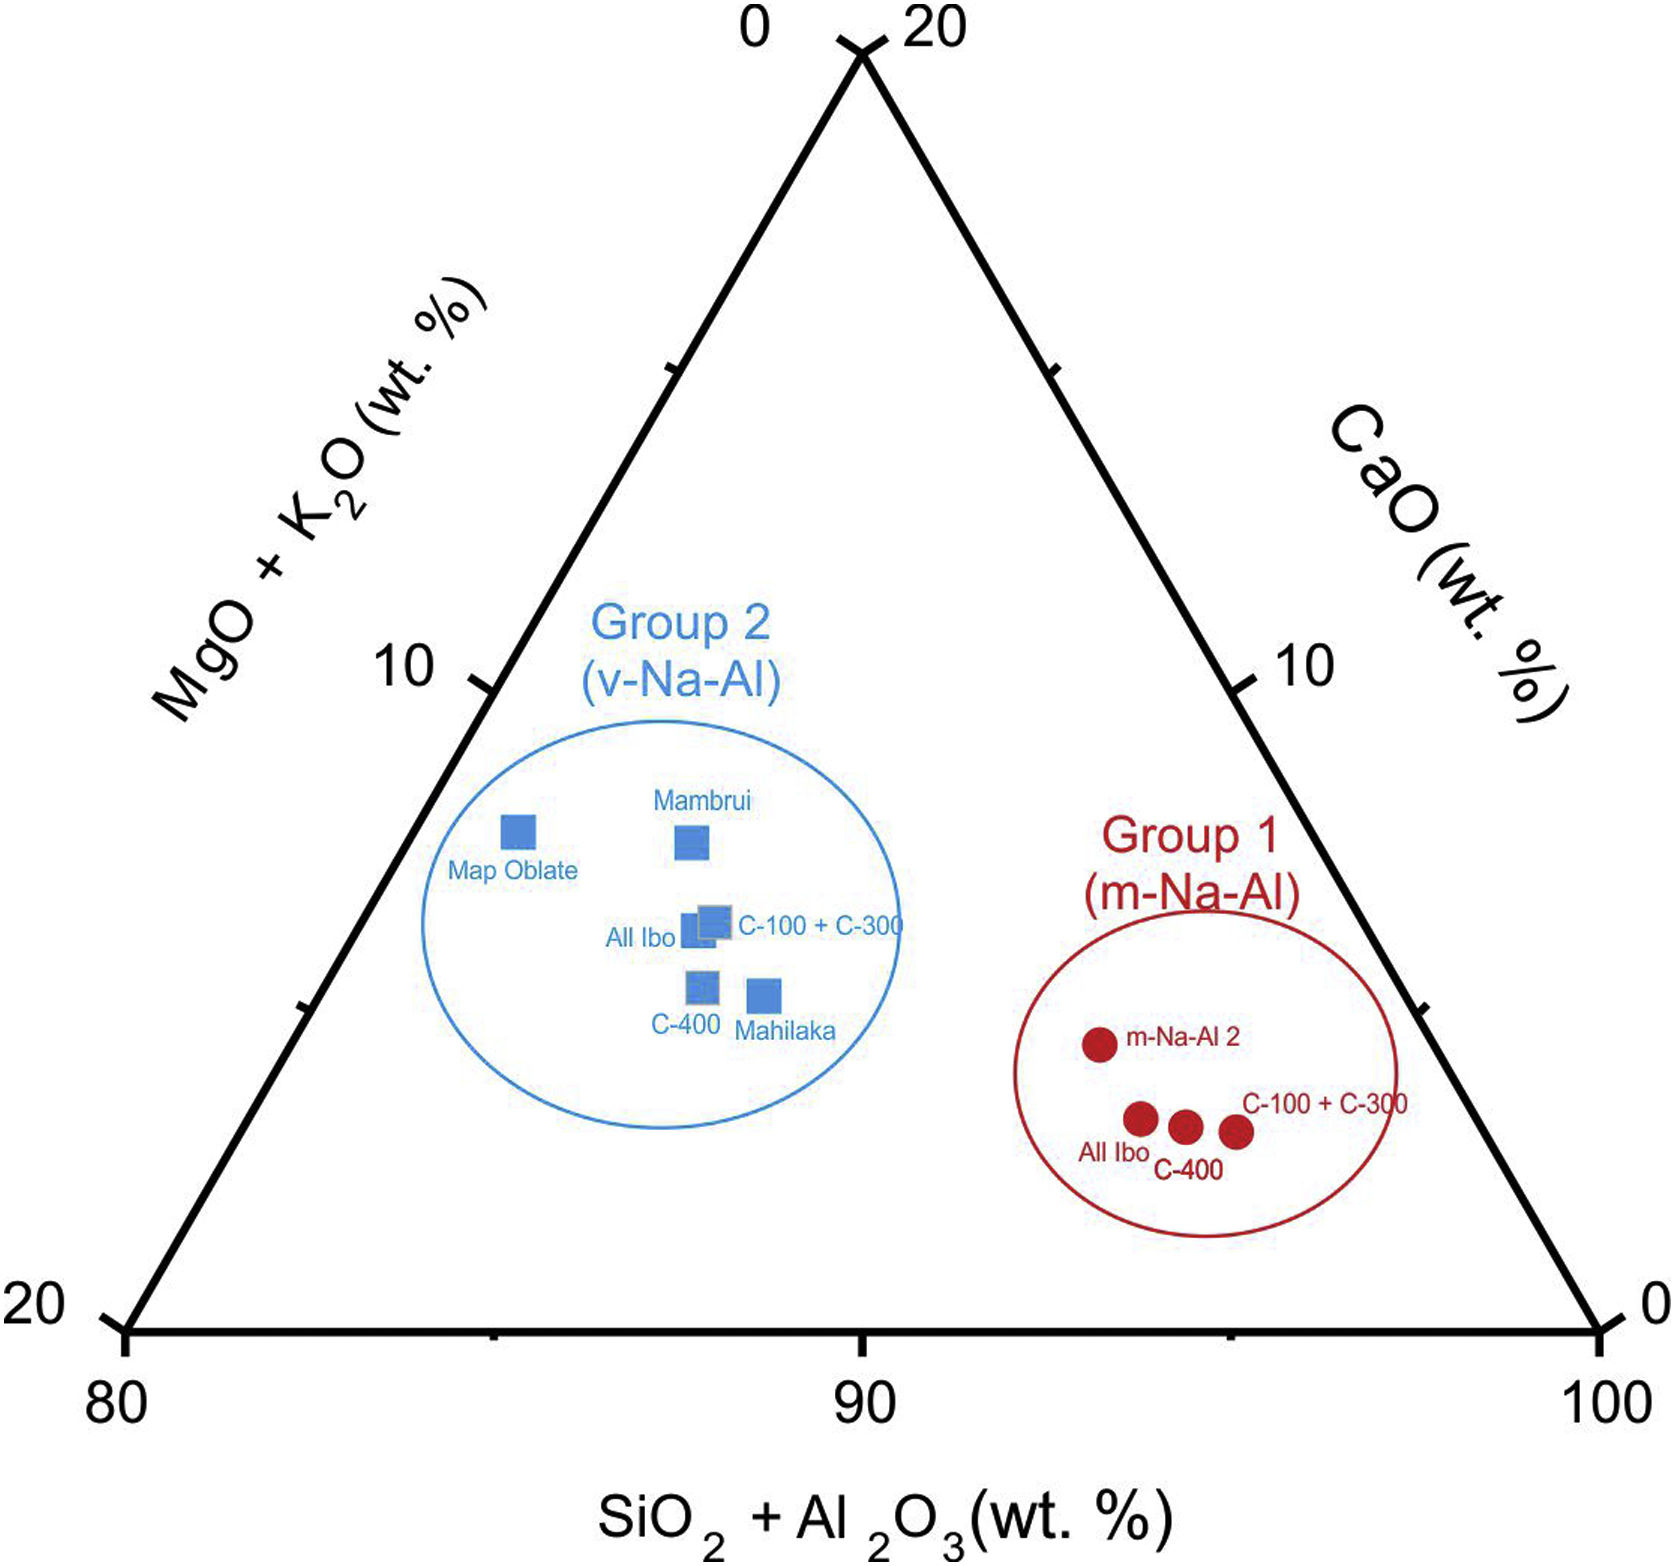
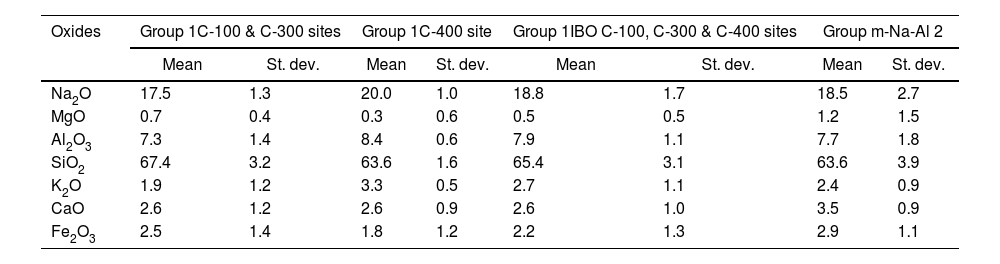
This glass group was also determined at the C-400 site [12] and has been found abundantly in eastern and southern African sites from the 8th century AD onwards [20] and, to a lesser extent, in south and southeast Asia deposits, indicating that these glasses should have been possibly elaborated to trade with the African coast. As discussed elsewhere [12], there are also glasses of this group in Chibuene, the only systematically studied Swahili site in central Mozambique, even though only related to the Khami Indo-Pacific series dated in the mid-15th century AD [21], as well as in Mayotte Island located in the Comoros archipelago and quite near the Quirimbas area, dated to the 12th and 13th centuries AD [22]; and in the Vohemar necropolis in Northern Madagascar dated from the 13th to 18th centuries AD [23]. Until very recently, five distinct groups of m-Na-Al glasses had been identified, of which only three were produced before the 9th century AD. Of these five groups, only the m-Na-Al 2 group has been identified in sites dated between the 9th and 19th centuries AD from the west coast of India and the east coast of Africa. Although there is no evidence of the possible workshops that produced these beads, their origin is established on the west coast of India along the state of Maharashtra. Beads of present Group 1 can be related from the point of view of its composition with the m-Na-Al 2 group as can be seen in Table 3 and Fig. 3, in which chemical composition has been reduced to be compared with data published.
| Oxides | Group 1C-100 & C-300 sites | Group 1C-400 site | Group 1IBO C-100, C-300 & C-400 sites | Group m-Na-Al 2 | ||||
|---|---|---|---|---|---|---|---|---|
| Mean | St. dev. | Mean | St. dev. | Mean | St. dev. | Mean | St. dev. | |
| Na2O | 17.5 | 1.3 | 20.0 | 1.0 | 18.8 | 1.7 | 18.5 | 2.7 |
| MgO | 0.7 | 0.4 | 0.3 | 0.6 | 0.5 | 0.5 | 1.2 | 1.5 |
| Al2O3 | 7.3 | 1.4 | 8.4 | 0.6 | 7.9 | 1.1 | 7.7 | 1.8 |
| SiO2 | 67.4 | 3.2 | 63.6 | 1.6 | 65.4 | 3.1 | 63.6 | 3.9 |
| K2O | 1.9 | 1.2 | 3.3 | 0.5 | 2.7 | 1.1 | 2.4 | 0.9 |
| CaO | 2.6 | 1.2 | 2.6 | 0.9 | 2.6 | 1.0 | 3.5 | 0.9 |
| Fe2O3 | 2.5 | 1.4 | 1.8 | 1.2 | 2.2 | 1.3 | 2.9 | 1.1 |
(St. dev.) Standard deviation.

Ternary composition diagram for glasses of Groups 1 and 2 based on data from Tables 3 and 4.
A new m-Na-Al 6 group also from the west coast of India has been recently identified to divide glasses of the ancient m-Na-Al 2 group circulating between the 9th and 13th centuries AD. Mean concentrations of MgO and CaO for Ibo glasses are very close to concentrations published for the m-Na-Al 6 group (MgO=0.5 for Group 1 vs 0.8wt.% for group m-Na-Al 6; CaO=2.6 for Group 1 vs 2.5wt.% for group m-Na-Al 6) [24]. Therefore, Group 1 glasses from C-100 and C-300 sites could be quite likely from the west coast of India.
- -
Group 2 (Table 2). It is composed of 6 samples (5 beads and a flat glass): MO-21 from the C-300 site, and MO-23, MO-25, MO-26, MO-27 and MO-29 from the C-100 site. These beads come respectively from the SUs 103-2 (MO-23, 25 and 26), in the upper phase of the C-100 site, as well as from the SUs 104-2 (MO-27) and 104-3 (MO-29), in the lower phase of the C-100 site. The MO-21 sample comes from the SU 302-4, in the lower phase of the C-300 site (Table 1).
The Na2O content is between 15.6 and 17.2wt.%, CaO between 3.9 and 7.2wt.% and SiO2 between 59.2 and 64.7wt.%. This group is characterized by a relatively high percentage of MgO (3.6–5.3wt.%) and lower percentages of alumina (4.5–5.2wt.%) and Cl− (0.6–1.1wt.%) compared to Group 1. These characteristics suggest that they are glasses with a relatively high content of alumina but with a sodium source of vegetable origin, probably coming from ashes of halophytic plants known in the literature as v-Na-Al. In these glasses the alumina concentration is always higher than 4.0wt.%, while both MgO and K2O concentrations are always higher than 1.5wt.%.
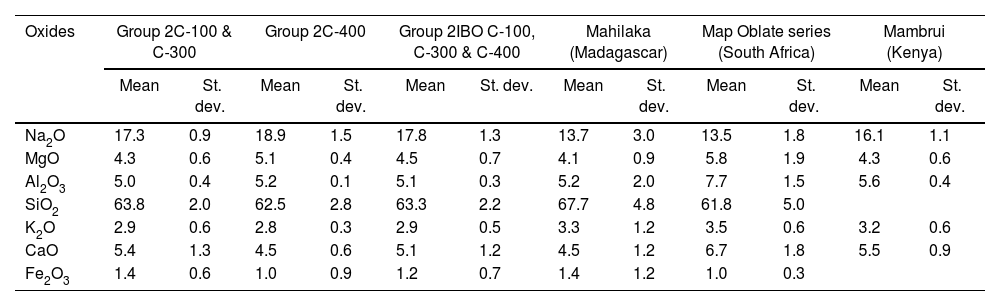
This glass group was likewise determined at the C-400 site [12] and has been profusely found in eastern and southern Africa between the 13th and 17th centuries AD, as well as in central and southern Asia between the 9th and 14th centuries AD [25]. So far, four different types of v-Na-Al glasses have been identified, although only Type A and Type B were used to make beads. Group 2 of glasses most likely belong to Type A with which they bear a high compositional similarity, especially with those identified in Mahilaka [26] and Mambrui as illustrated in Table 4 and Fig. 3. Glasses from Mambrui, however, are a little more modern since they are from the 15th to 16th centuries AD [25]. Although there is also no evidence of the possible workshops that made them, the origin of Type A v-Na-Al glasses is established somewhere in Central Asia and could have reached the eastern coast of Africa via India.
- -
Group 3 (Table 2). It consists of a single colourless hollow glass fragment (sample MO-17 from the SU 302-3 and the C-300 site) (Table 1). As mentioned above, this level is mainly represented by roulette or finger and dot impressed ware of Lumbo tradition.
| Oxides | Group 2C-100 & C-300 | Group 2C-400 | Group 2IBO C-100, C-300 & C-400 | Mahilaka (Madagascar) | Map Oblate series (South Africa) | Mambrui (Kenya) | ||||||
|---|---|---|---|---|---|---|---|---|---|---|---|---|
| Mean | St. dev. | Mean | St. dev. | Mean | St. dev. | Mean | St. dev. | Mean | St. dev. | Mean | St. dev. | |
| Na2O | 17.3 | 0.9 | 18.9 | 1.5 | 17.8 | 1.3 | 13.7 | 3.0 | 13.5 | 1.8 | 16.1 | 1.1 |
| MgO | 4.3 | 0.6 | 5.1 | 0.4 | 4.5 | 0.7 | 4.1 | 0.9 | 5.8 | 1.9 | 4.3 | 0.6 |
| Al2O3 | 5.0 | 0.4 | 5.2 | 0.1 | 5.1 | 0.3 | 5.2 | 2.0 | 7.7 | 1.5 | 5.6 | 0.4 |
| SiO2 | 63.8 | 2.0 | 62.5 | 2.8 | 63.3 | 2.2 | 67.7 | 4.8 | 61.8 | 5.0 | ||
| K2O | 2.9 | 0.6 | 2.8 | 0.3 | 2.9 | 0.5 | 3.3 | 1.2 | 3.5 | 0.6 | 3.2 | 0.6 |
| CaO | 5.4 | 1.3 | 4.5 | 0.6 | 5.1 | 1.2 | 4.5 | 1.2 | 6.7 | 1.8 | 5.5 | 0.9 |
| Fe2O3 | 1.4 | 0.6 | 1.0 | 0.9 | 1.2 | 0.7 | 1.4 | 1.2 | 1.0 | 0.3 | ||
(St. dev.) Standard deviation.
The concentration of SiO2 (73.7wt.%) is the highest, while the contents of alumina (1.5wt.%), K2O (0.4wt.%) and Fe2O3 (0.2wt.%) are the lowest of all the samples analyzed. This composition is very similar to that of a conventional soda-lime silicate glass made with a synthetic sodium source. Therefore it is probably a European production. The low content of alumina together with a small arsenic oxide concentration (0.4wt.%) also suggests that it could be a European production from the end of the 19th century or the beginning of the 20th century, since the use of arsenic as a refining agent is a technical improvement that was only introduced in modern glass production. Very similar compositions to that of sample MO-17 have been identified in glass beads found in southern Africa of late 19th and early 20th centuries [27]. The presence of a modern glass in a Lumbo context of the 11–13th century AD could mean that it might have percolated down from upper layers. A conventional soda-lime silicate flat glass fragment of European origin was also identified at the C-400 site and was also present in ancient levels due to percolation [12].
Sample MO-20 (Table 2) comes from the SU 302-2 and the C-300 site (Table 1). Local ware with fine incise decoration as well as Chinaware dated from the 17th to 18th centuries AD and European earthenware from the 18th and 19th centuries AD were also found in this layer [9].
This bead was elaborated from a lead silicate glass of the PbO-SiO2 binary system [28] as the contents of SiO2 (31.2wt.%) and PbO (68.8wt.%) indicate, which were the only two oxides detected in its composition. This type of glass was not identified at the C-400 site, it only appears at the C-300 site. Although yellow glass beads have been found in numerous sites in eastern and southern Africa, including the C-400 site [12,19,20], all of them belong either to m-Na-Al or v-Na-Al types of soda-lime silicate glasses, but none of them to the PbO-SiO2 binary system. They have only been found in regions of central Africa, such as the site of Garumele in Niger [29], in which the averages of SiO2 (35.8wt.%) and PbO (64.2wt.%) are very close and practically in the same order of magnitude as the contents of these two oxides in sample MO-20. These glasses are dated between the late 15th and 20th centuries AD and come in all probability from Venice [30]. Sample MO-20 is therefore a glass bead of possible European origin.
Characterization of chromophores of glass beads and glass fragmentsEither the three groups of soda-lime silicate glasses or the lead silicate glass show a great variety of chromophores, both ionic and colloidal.
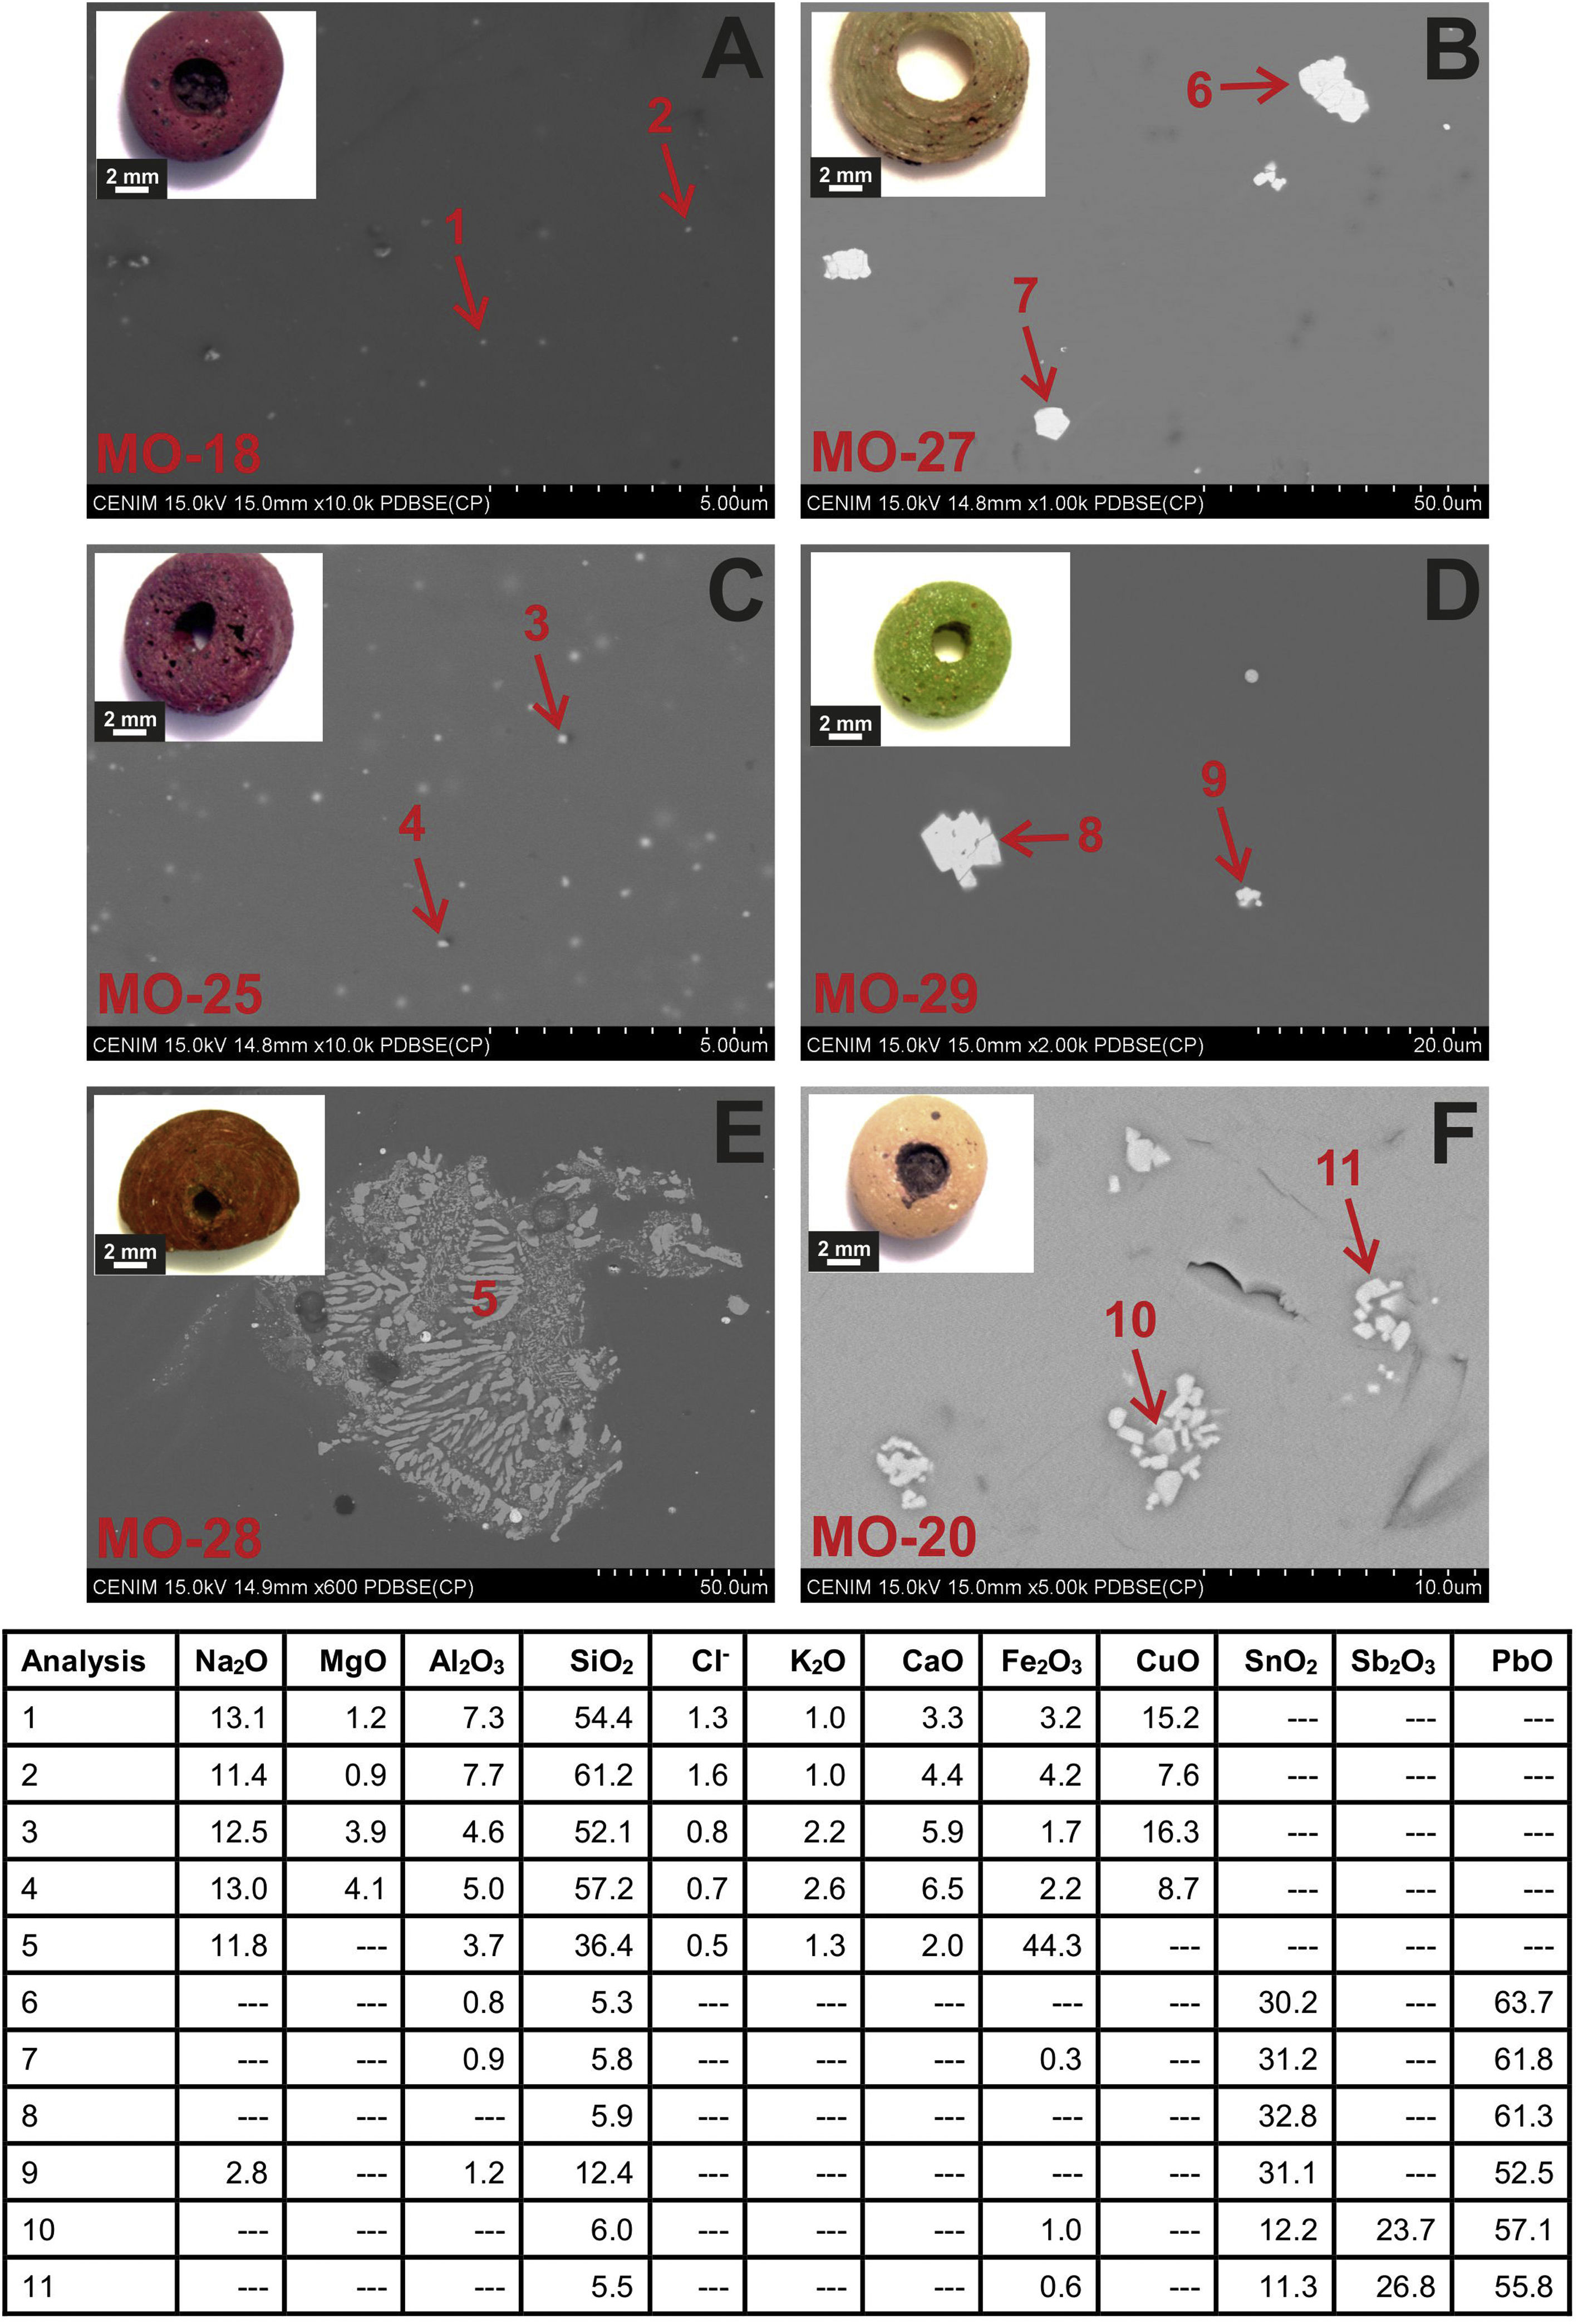
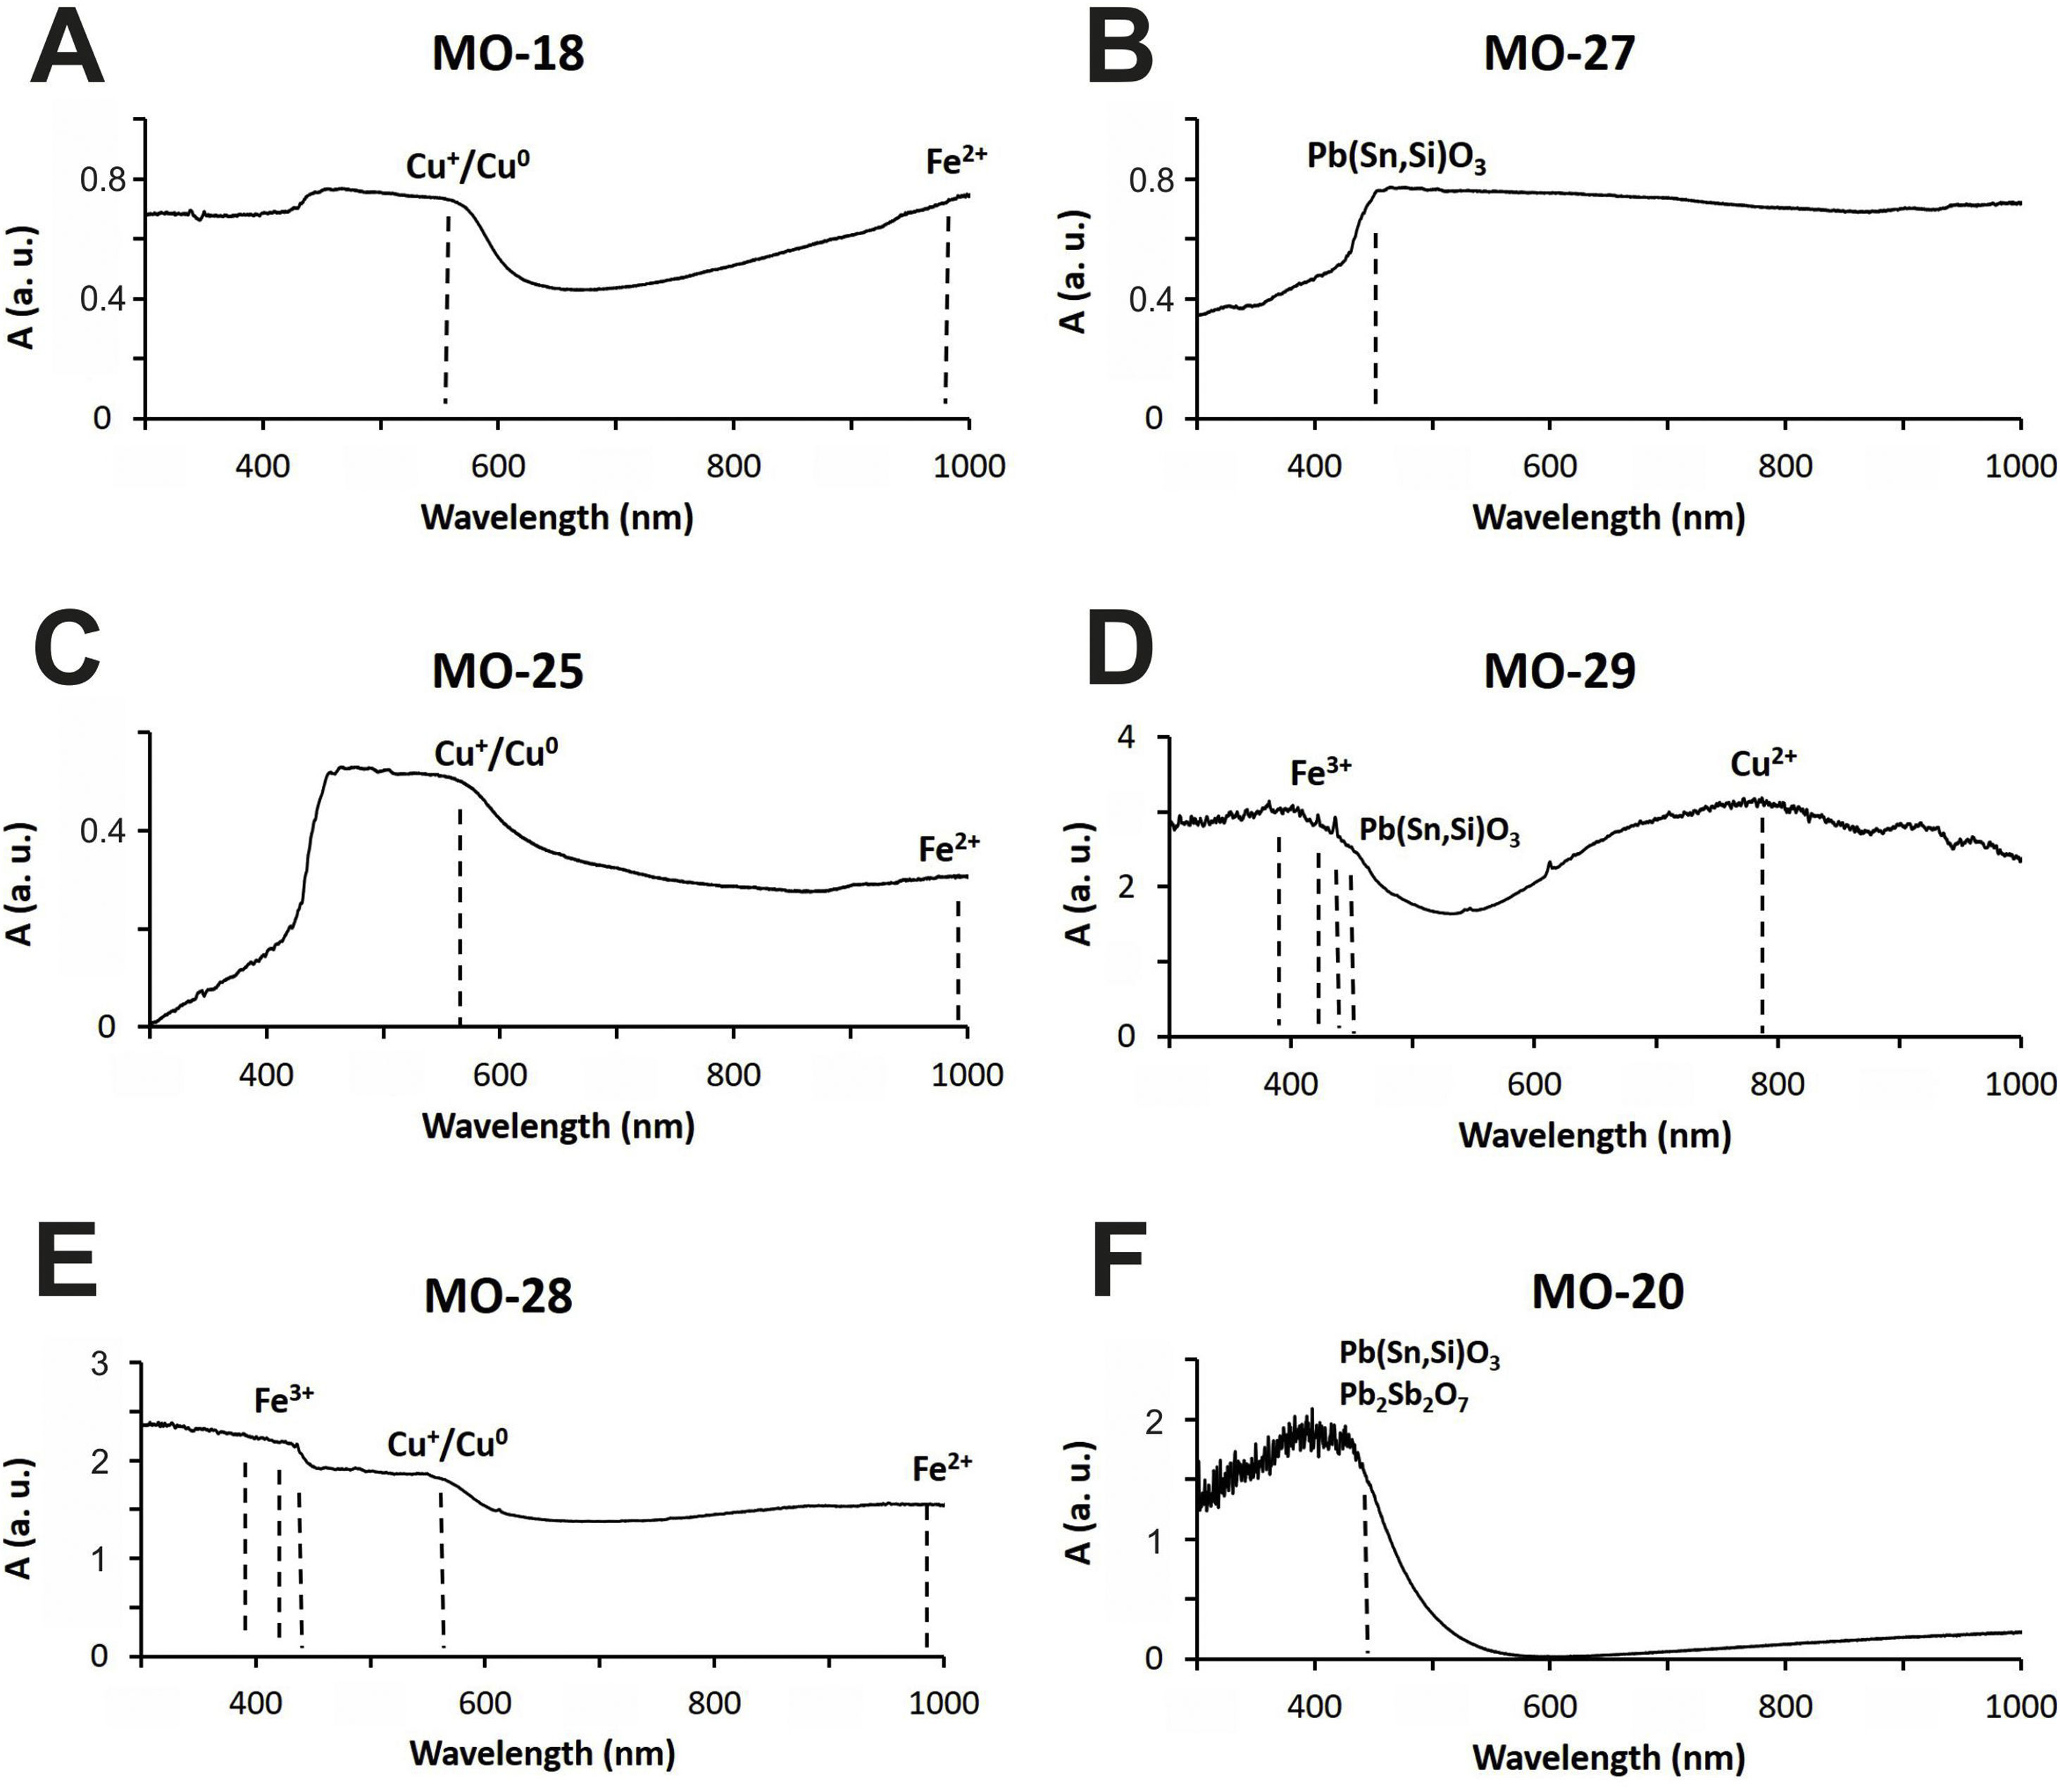
Colloidal chromophores have been used to obtain the red and yellow colours. The brick red colour of samples MO-18 (Group 1) and MO-25 (Group 2) is due to the presence of Cu+/Cu0 microcrystals in the glass body. CuO was not detected by EDS in the glass body of sample MO-18, while a content of 2.0wt. % was detected in sample MO-25 (Table 2). The microcrystals were observed at magnifications ×10,000 and are smaller than 0.5μm in size (Fig. 4A and C, clear points marked with red arrows). CuO was detected in different proportions (7.6–16.3wt.%) (Fig. 4A and C, analyses 1–4), which suggests that they could be in all probability metallic copper microcrystals or cuprous oxide (Cu2O). They are responsible for the red colour and opacity of glass. Based on the size of microcrystals, these glasses can be assigned to the so-called copper hematinone glasses, which differ from those better known as copper aventurine ones due to the smaller size of their crystals [28]. They were also determined at the C-400 site [12]. Samples MO-18 and MO-25 present an absorption band at around 550nm that can be assigned to Cu+/Cu0 microcrystals (Fig. 5A and C). They also present the beginning of an absorption band from 800nm, more pronounced in sample MO-18, which can be attributed to Fe2+-ions. The presence of these ions, which impart a blue colouration, results in a duller red colour. Fe2O3 was detected in both samples (Table 2).
, OM images, and EDS microanalyses of samples studied. (A, E) Group 1 samples. (B–D) Group 2 samples. (F) PbO-SiO2 sample (wt.%, --- not detected).")
 Red chromophores. (B, D, F) Yellow chromophores. (a.u.) means arbitrary units.")
Despite a small concentration of CuO (0.8wt.%) was detected by EDS, no metallic copper microcrystals were identified in red colour sample MO-28. In contrast, some crystals with a dendritic microstructure inside, larger than 50μm in size and chemical composition with high concentration of iron (44.3wt.%) and silicon (36.4wt.%) oxides were identified (Fig. 4E, analysis 5), which can be attributed to dendrites of wustite on a fayalite matrix, since metallic iron is used as a reducing agent [31]. The appearance of these phases suggests that copper could have been added from slags produced by copper metallurgy [32]. Such slags were not identified in red glasses from the C-400 site [12]. The reflection spectrum of the MO-28 sample presented three poorly resolved bands (Fig. 5E). The most important one centred around 550nm which corresponds to Cu+/Cu0 microcrystals, a second one at around 380, 420 and 440nm attributed to Fe3+-ions, and a third one from 800 up to 1100nm that can be attributed to Fe2+-ions. Therefore, red colour of this glass is mainly due to the presence of Cu+/Cu0. However, the presence of Fe3+-ions (yellow colouration) and Fe2+-ions (blue colouration) results in a more reddish hue than that of MO-18 and MO-25 samples (Fig. 4A, C and E).
The yellow colour of samples MO-27 and MO-29 (both to Group 2) is due to the presence of lead stannate microcrystals in the glass body. In the EDS microanalyses carried out in different areas of the glass body, PbO (2.5wt.%) and SnO2 (0.7wt.%) were detected in sample MO-27, while only PbO (3.1wt.%) appeared in sample MO-29 (Table 2). The microcrystals were observed at magnifications between ×1000 and ×2000 and their size varies between 7 and 14μm in sample MO-27 and between 2.5 and 7.5μm in sample MO-29 (Fig. 4B and D). High concentrations of PbO (52.5–63.7wt.%) and SnO2 (30.2–32.8wt.%) were detected (Fig. 4B and D, analysis 6–9) in these microcrystals, which confirms that they are indeed lead stannate microcrystals that are responsible for the yellow colour and opacity of these glasses. A notable concentration of SiO2 was also detected (5.3–12.4wt.%), which indicates that a type II lead stannate Pb(Sn,Si)O3 was used since type I does not contain silicon: Pb2SnO4. These lead stannate-coloured yellow glasses were also found at the C-400 site [12].
Sample MO-27 presents an absorption band around 450nm that can be assigned to lead stannate microcrystals [33], which impart the yellow colour to the glass (Fig. 5B). On the contrary, sample MO-29, with a yellowish green colour, presents a reflection spectrum with a displacement of the absorption edge up to approximately 450nm as a consequence of both PbO (3.1wt.%) and lead stannate microcrystals in the glass (Fig. 5D). Although copper must be below detection limits since it was not detected by EDS, a broad band appears centred around 780nm and must be attributed to Cu2+-ions. Due to the presence of a notable PbO content this band appears slightly shifted towards a shorter wavelength than expected for Cu2+-ions (800nm). In this way, the blue colour imparted by the Cu2+-ions is shifted towards green by the presence of PbO. Therefore, the yellowish-green colour of bead MO-29 is a result of the yellow imparted by lead stannate and the green imparted by Cu2+-ions in the presence of lead oxide.
The yellow colour of sample MO-20 made with a lead silicate glass has been obtained through a combination of lead stannate and lead antimoniate microcrystals, although in EDS microanalyses undertaken on the glass body only high concentrations of PbO (68.8wt.%) were detected (Table 2). The microcrystals were observed at magnification ×5000 forming aggregates between 2 and 5μm in size (Fig. 4F). PbO (55.8–57.1wt.%), Sb2O3 (23.7–26.8wt.%) and SnO2 (11.3–12.2wt.%) were indistinctly detected within the microcrystalline aggregates. Sb2O3 was always in a higher proportion than SnO2 (Fig. 4F, analysis 10–11). These data confirm that a lead stannate and lead antimoniate combination was used to obtain the yellow colour and opacification of this glass. They furthermore redound in the possible Venetian origin of this bead since there are lead silicate yellow Venetian glasses of the 17–19th centuries AD in which this same proportion with a higher content of Sb2O3 versus SnO2 is detected [30]. This type of glass and microcrystals were not determined at the C-400 site. The reflection spectrum of this sample showed a displacement of the absorption edge up to approximately 440nm as a consequence of the high concentration of PbO (68.8wt.%) (Table 2), as well as the presence of lead stannate and lead antimonate microcrystals (Fig. 5F).
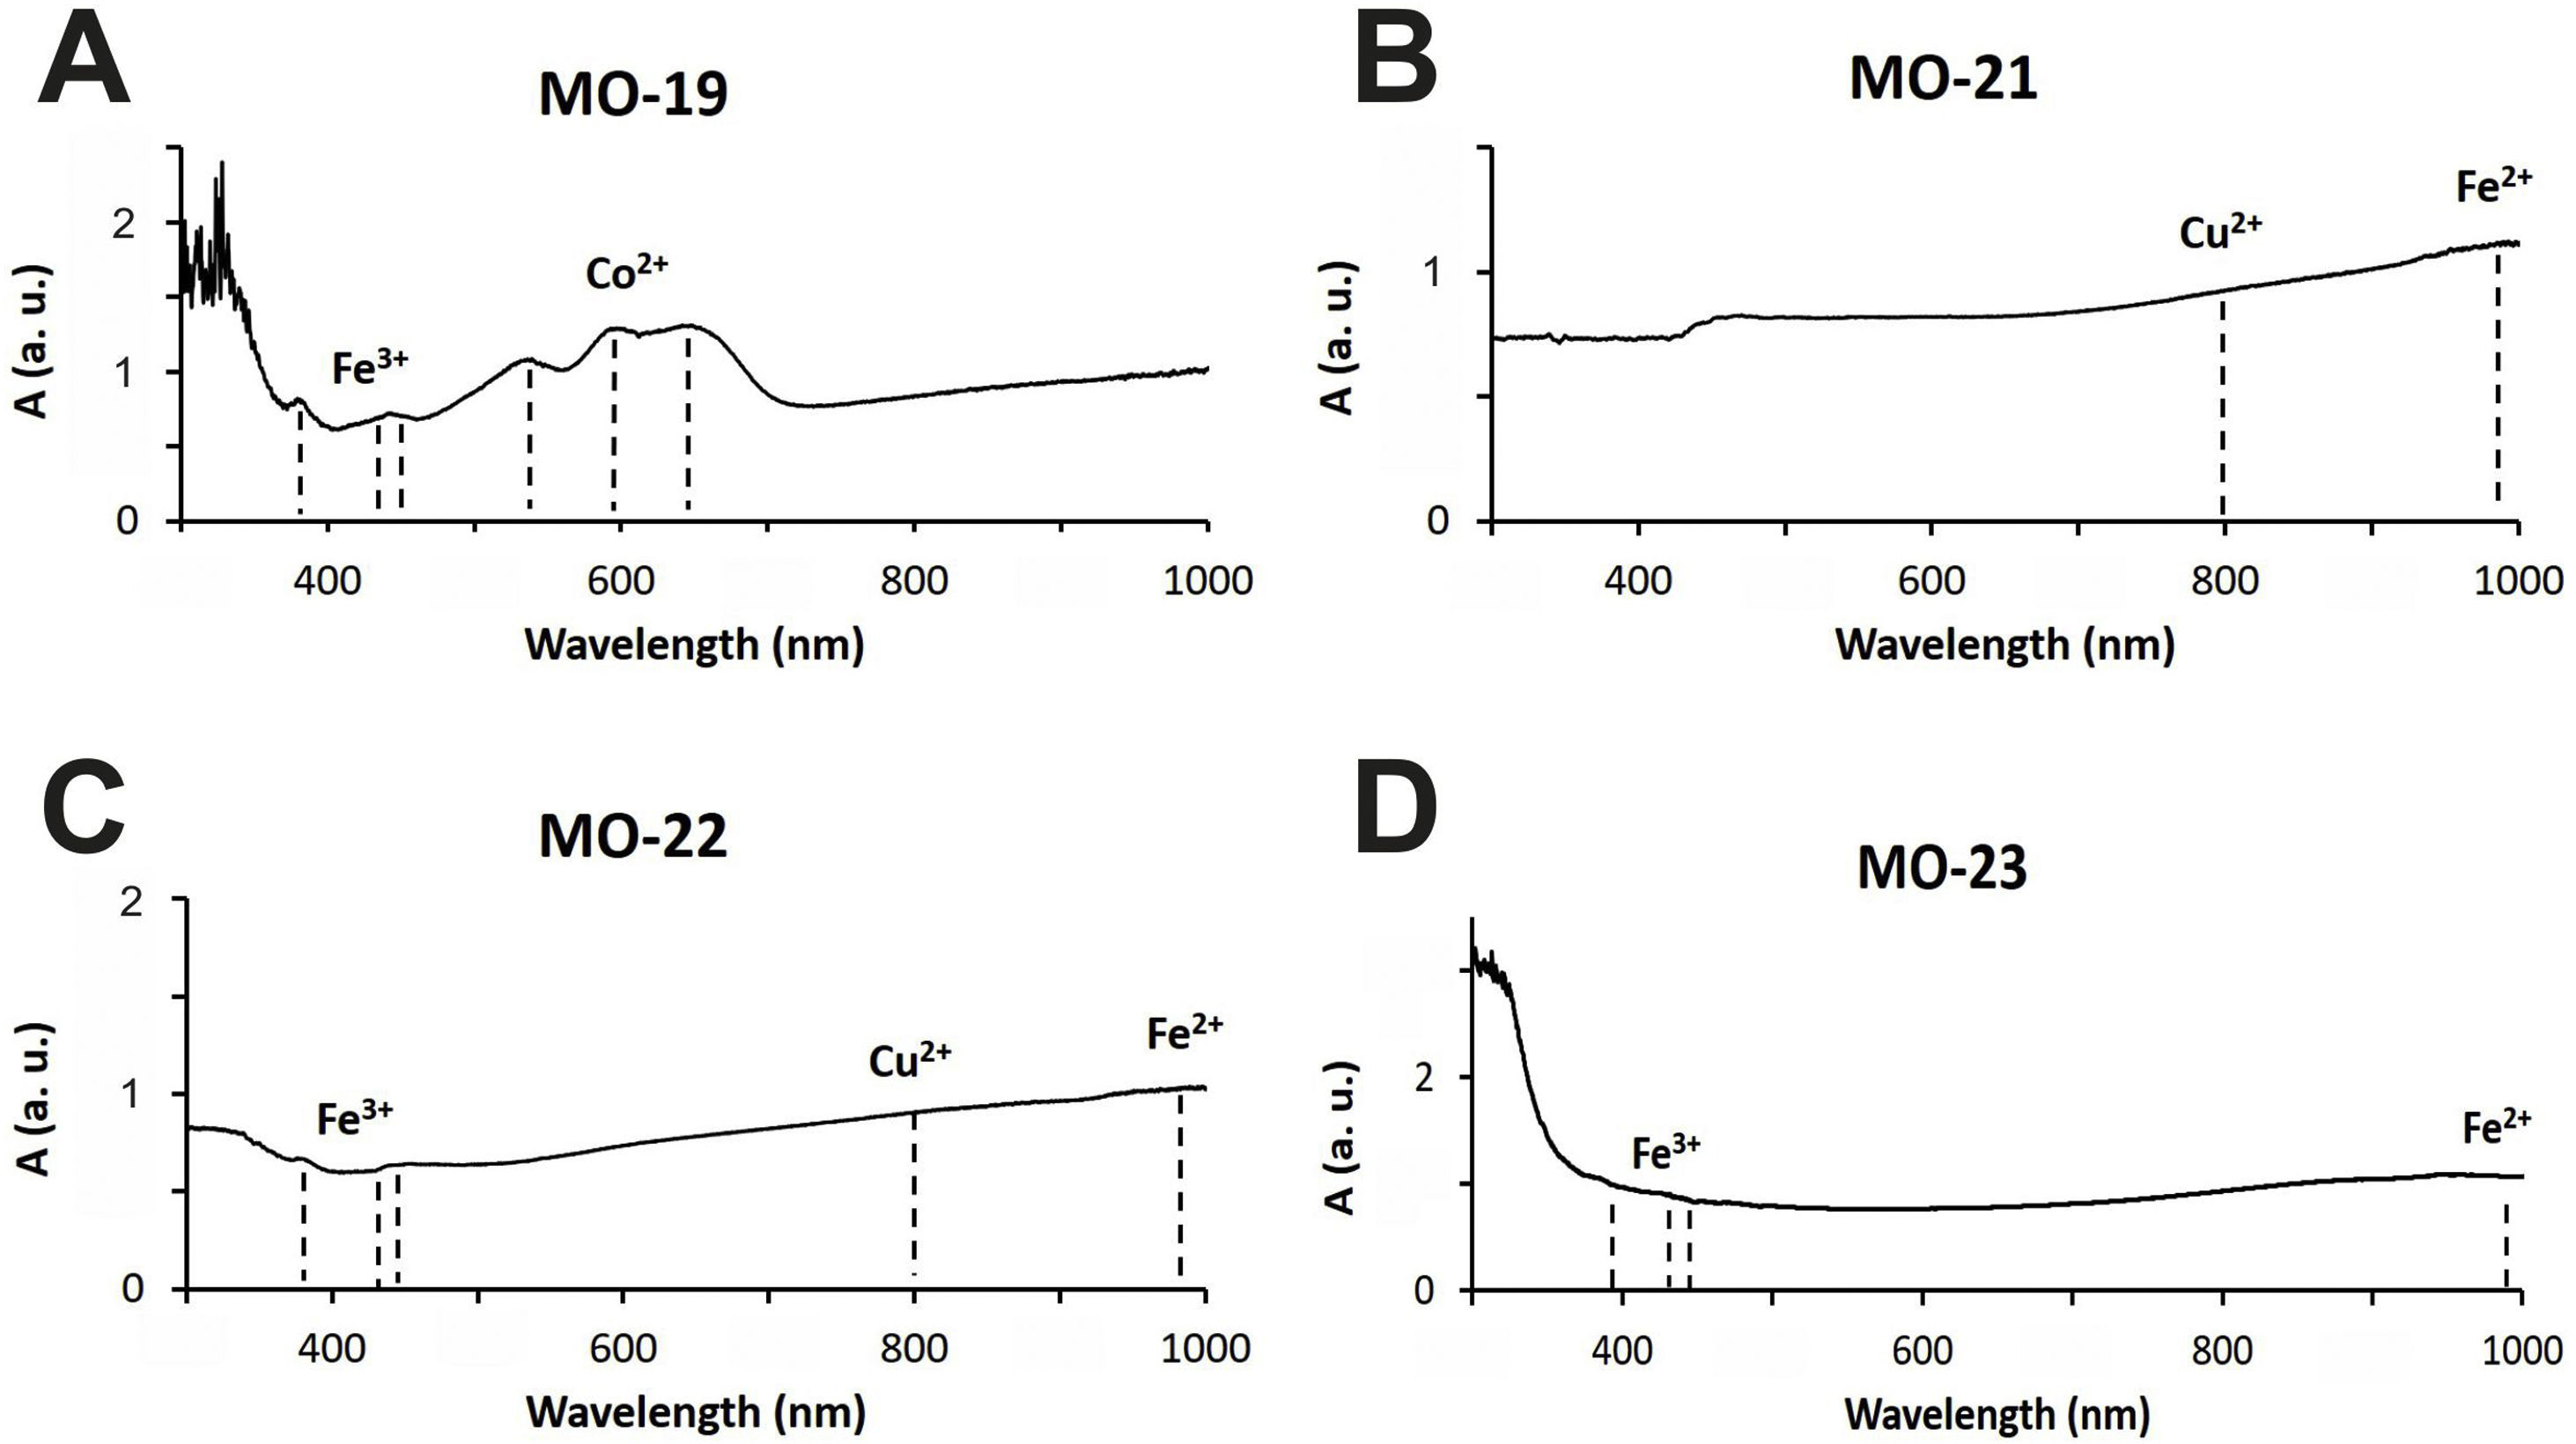
The rest of colours have been obtained using ionic chromophores. The dark blue colour of samples MO-19 and MO-24 (Group 1) is due to the presence of Co2+-ions, with a characteristic triplet of reflection bands at 530, 590 and 650nm, respectively, which mask the presence of Fe3+-ions that impart yellow colour and show a triplet at 380, 420 and 440nm, respectively (Fig. 6A). Although only a small concentration of CoO was detected by EDS (0.2wt.%) in sample MO-24, it must be taken into account that Co2+-ions are able of imparting an intense blue colour to glasses even at concentrations lower than 0.005wt.% [28].
 means arbitrary units.")
The blue-green colour of samples MO-21 and MO-26 (Group 2) is due to the presence of Cu2+-ions, with a reflection band around 800nm, and Fe2+ions, with a band that starts at around 800nm, reaches up to 1100nm and partly masks the Cu2+-ion's band (Fig. 6B). Chromatic sum of turquoise blue colour imparted by Cu2+-ions, the blue colour imparted by Fe2+-ions, and the presence of Fe3+-ions, which impart a yellow colouration, results in the blue-green colour of these two samples. CuO and Fe2O3 were detected by EDS in both cases (Tab. 2). The greenish-blue colour of sample MO-22, although partly masked by the external alteration layers, is also due to the same chromatic sum of Cu2+, Fe2+ and Fe3+-ions (Fig. 6C). Finally, the slightly yellowish colour of sample MO-23 (Fig. 6D) is due to the presence of Fe2+/Fe3+-ions and their redox equilibrium in which Fe3+-ions seem to predominate. As a result the glass has a slightly yellowish hue.
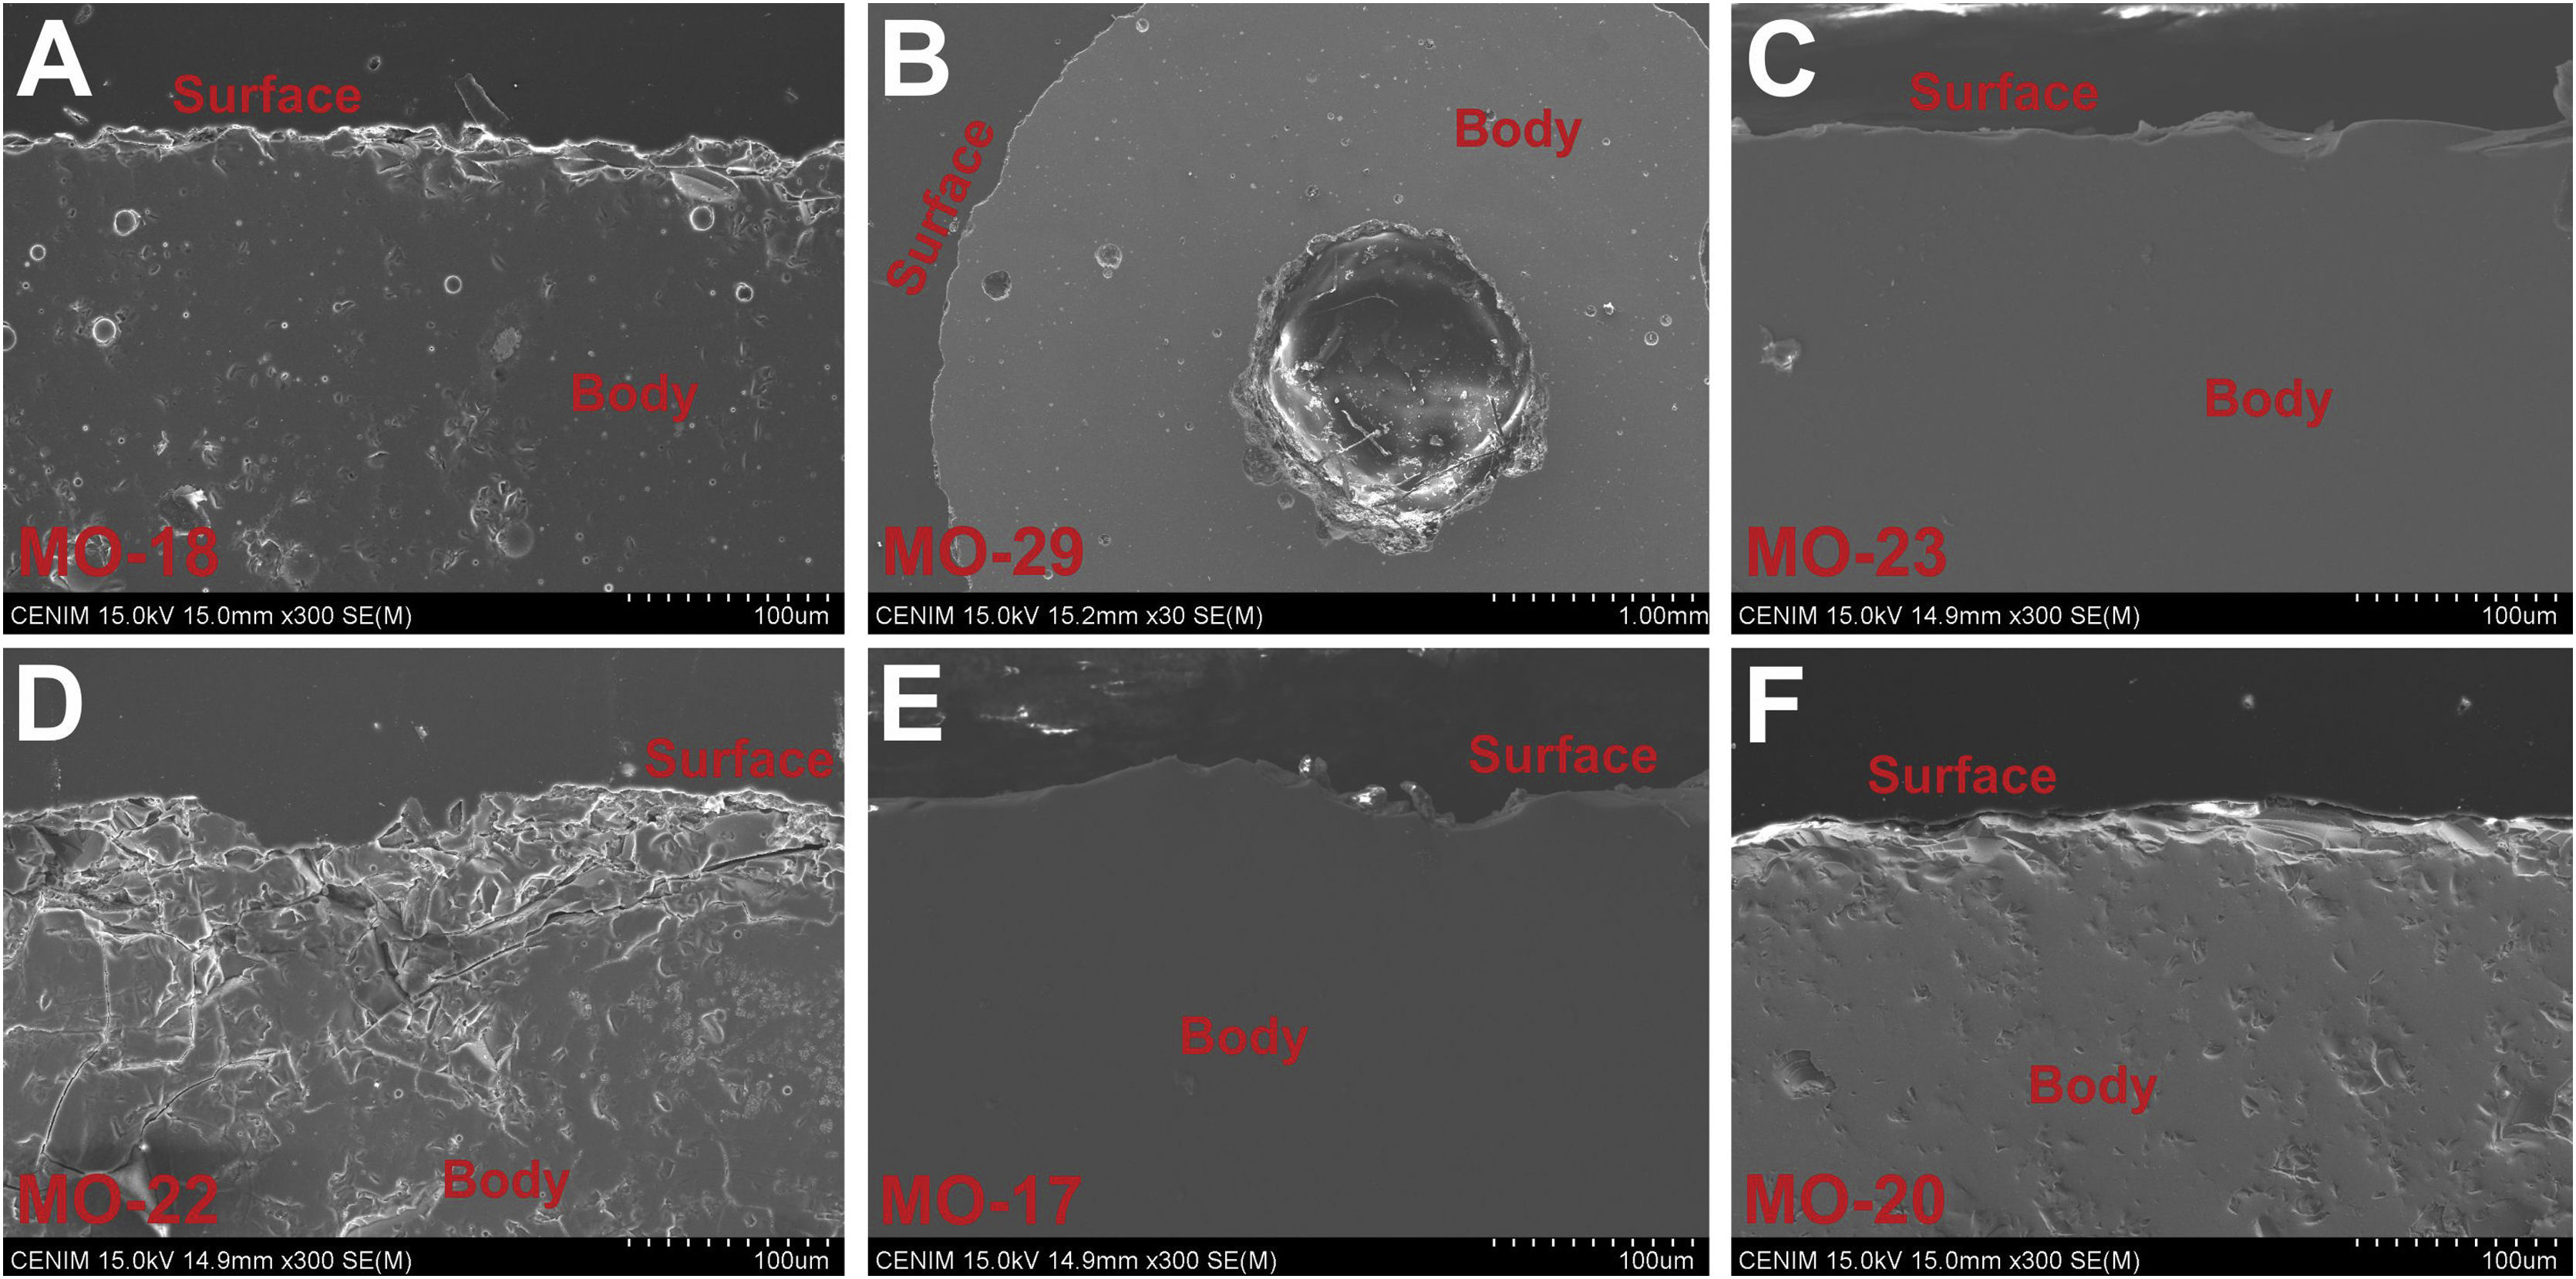
State of conservation of glassesMost of the glass samples show a good state of conservation due to the high chemical durability of soda-lime silicate glasses with a relatively high content of alumina. Some beads showed a more altered surface by processes of mechanical origin (Fig. 7A), especially in the central hole (Fig. 7B), whereas in others the surface barely showed evidence of alterations (Fig. 7C, E and F).
 showing state of conservation of the samples studied.")
Of the 343 beads found at the C-100 site, only 10 (2.9%) presented superficial alterations, while of the 282 from the C-300 site only in 14 beads (5.0%) these alterations were observed. The EDS microanalysis of one altered bead from the C-300 site showed a glass with a high degree of surface dealkalinization, as indicated by the low percentages of Na2O (1.4wt.%) and the relative enrichment of SiO2 (81.5wt.%), Al2O3 (6.6wt.%) and Fe2O3 (2.7wt.%) in comparison with the glass body (Fig. 7D).
The significant increase of SiO2 also indicates the formation of a silica gel layer on the glass surface. This intense dealkalinization is due to interaction of glass with soil moisture during burial, which is a very common attack on archaeological glasses [34].
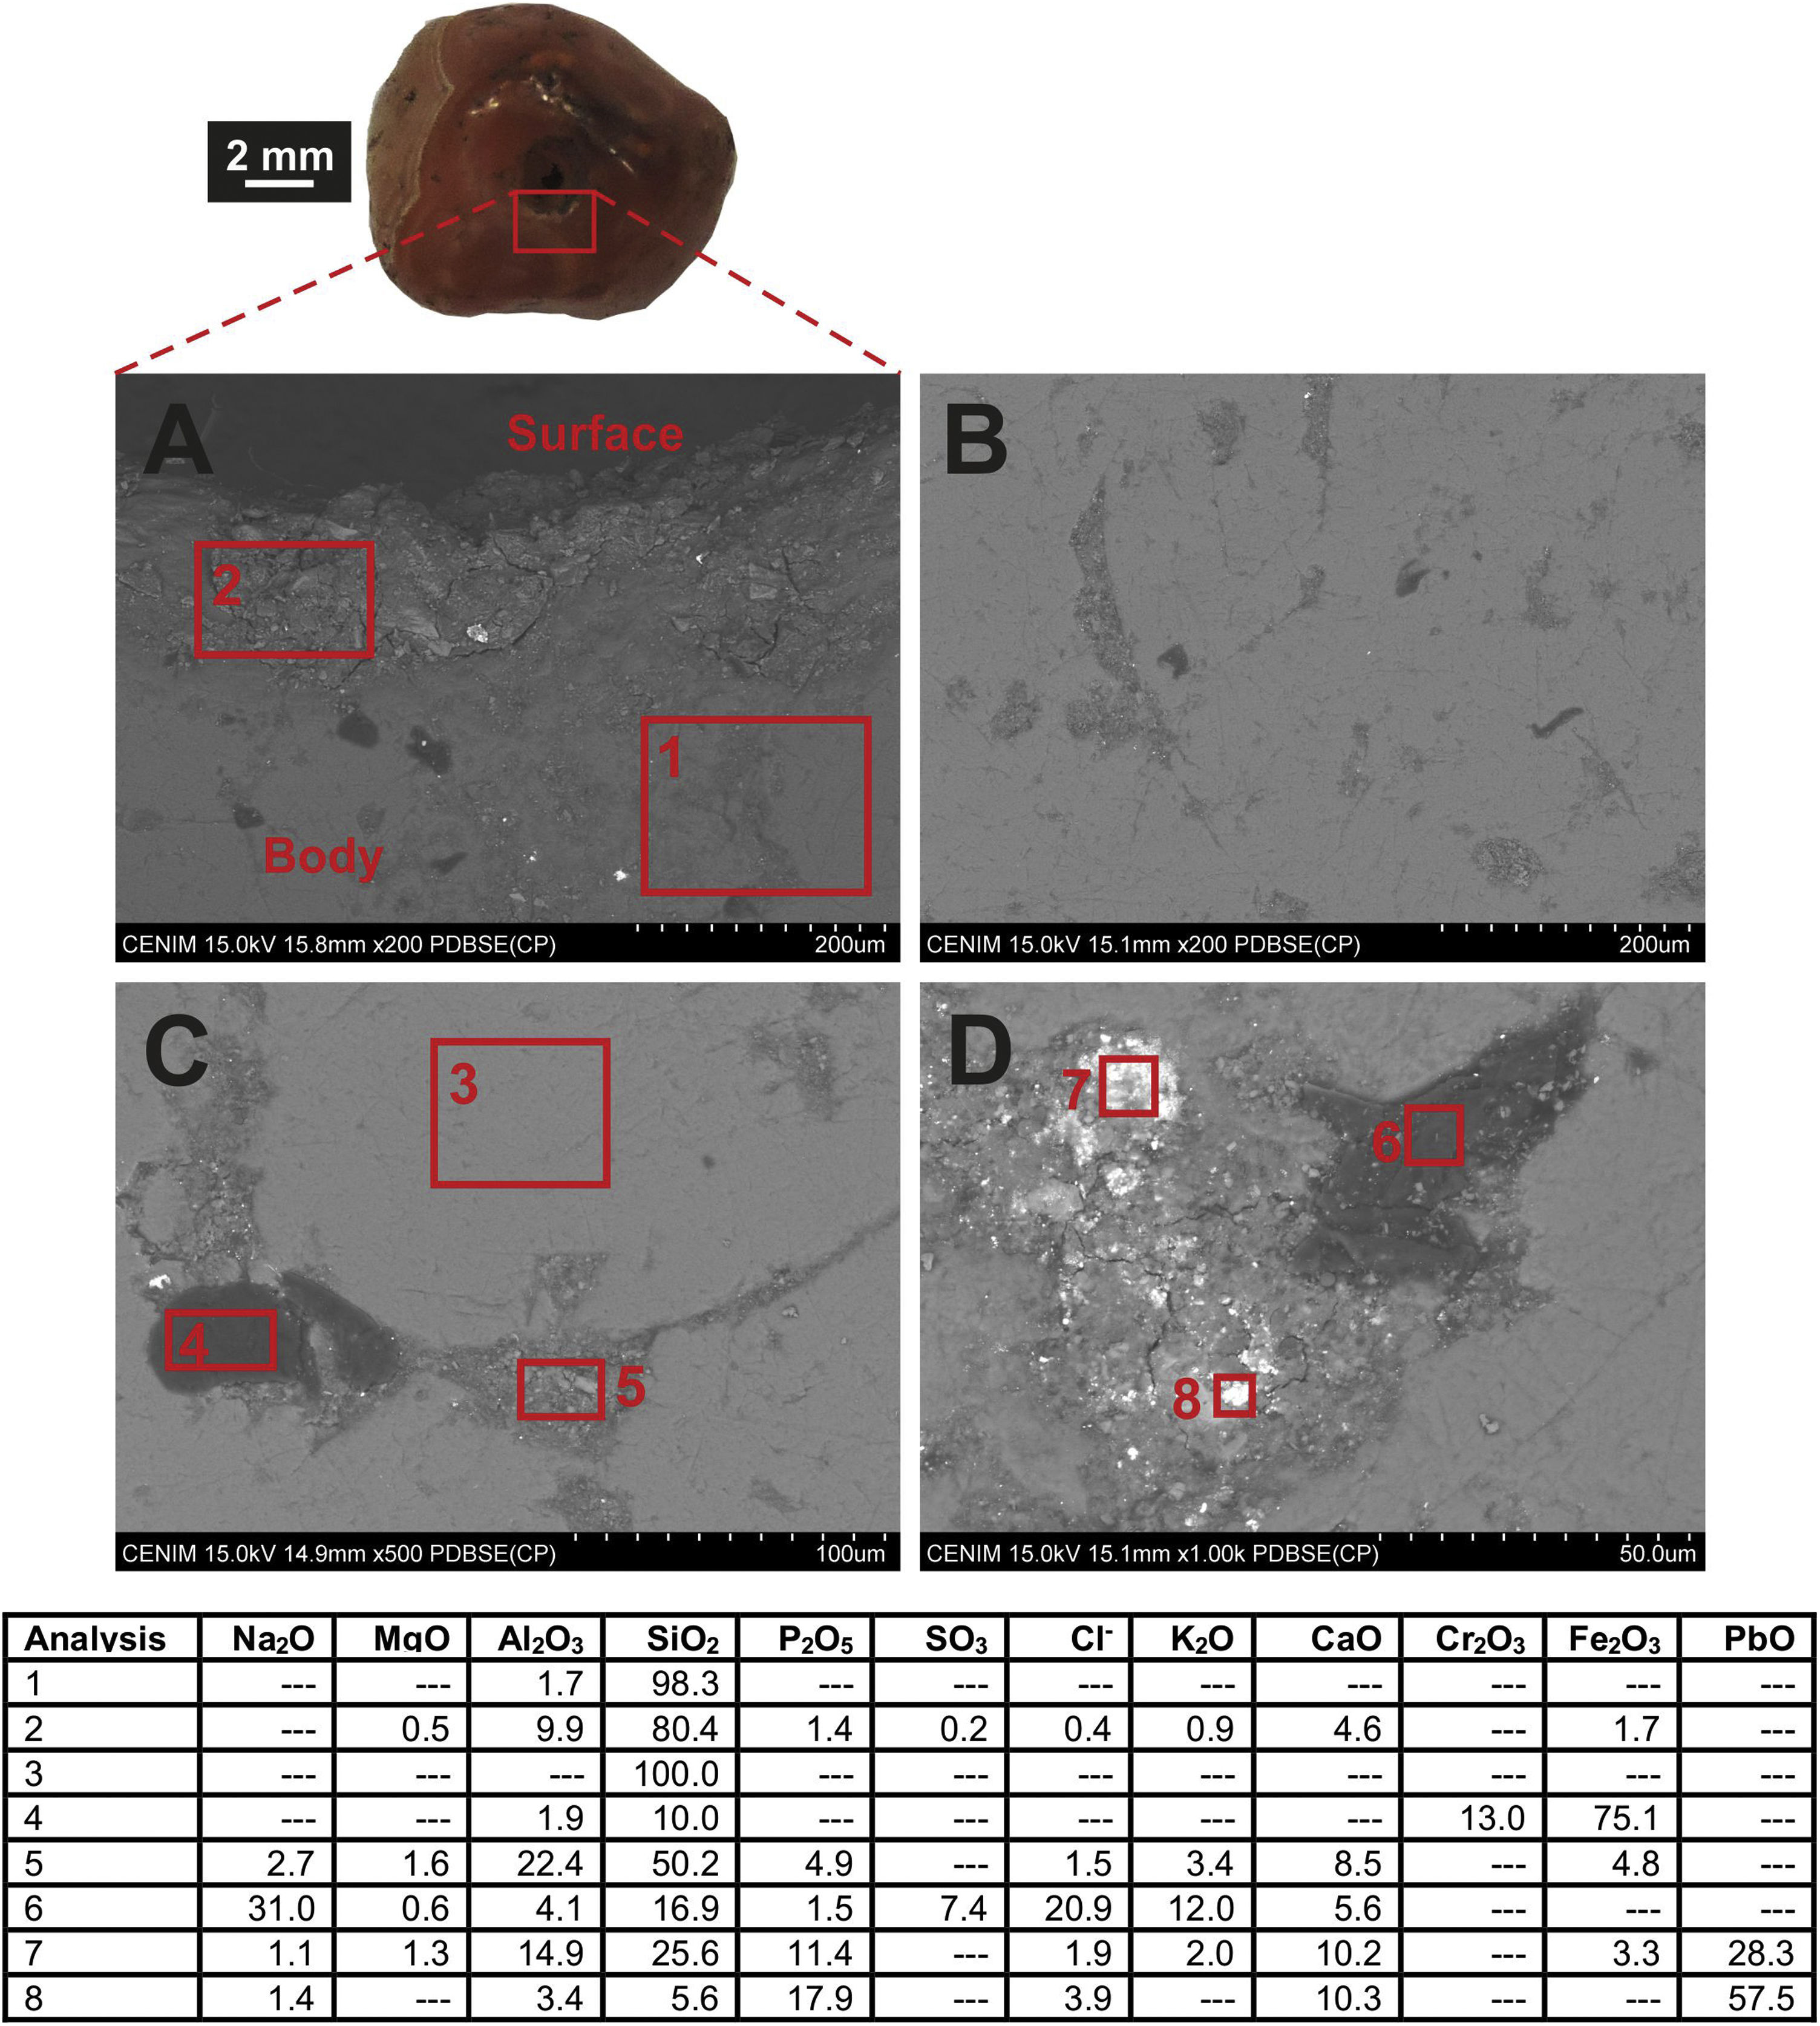
Chemical composition of the carnelian beadFESEM observation of the carnelian bead (sample MO-16) showed a heterogeneous material without evidences of alteration (Fig. 8A). EDS microanalysis from an area of the body (Fig. 8A, analysis 1) determined a high percentage of SiO2 (98.3wt.%) and only 1.7wt.% of Al2O3, while in an area close to the central hole (Fig. 8A, analysis 2) SiO2 content decreases up to 80.4wt.%, Al2O3 concentration increases (9.9wt.%) and other oxides such as MgO, P2O5, CaO, or Fe2O3 were also detected, indicating that some deposits were accumulated on the surface from the sediment in which the bead remained buried. On the contrary, in a more internal area of the body, SiO2 content is 100wt.% (Fig. 8C, analysis 3), which confirms it is indeed a carnealian bead, no a bead made of glass. The mineral carnelian is a microcrystalline variety of silicon oxide, usually moganite, which is commonly coloured by iron oxide impurities.
, OM image, and EDS microanalyses from the carnelian bead (MO-16 sample) (wt. %, --- not detected).")
The carnelian bead body presents bands and elongated areas with different microstructure than that observed in SiO2-rich areas (Fig. 8B). Dark and lighter microcrystalline areas were observed in these bands. In the dark areas a high content of Fe2O3 (75.1wt.%) and Cr2O3 (13.0wt.%) was determined (Fig. 7C, analysis 4), while in the light areas the relative content of Fe2O3 was lower (4.8wt.%), chromium oxide was not detected and also, apart from SiO2, other oxides were identified such as Al2O3, CaO, P2O5, and Na2O among others (Fig. 8C, analysis 5). Mixed microcrystalline areas with dark and lighter zones were also observed in these bands (Fig. 8D). The dark zones presented a rich composition in Na2O (31.0wt.%), Cl− (20.9wt.%) and SO3 (7.4wt.%) (Fig. 7D, analysis 6), while in the lighter zones high concentrations of PbO (up to 57.5wt.%), as well as Al2O3 (14.9wt.%), P2O5 (17.9wt.%), CaO (10.3wt.%) and also Fe2O3 (3.3wt.%) were detected. The bead therefore showed a series of elongated bands in which different impurities were detected, mainly lead, chromium and iron oxides, the latter in all probability responsible for its reddish colour.
Similar carnelian beads have been documented in Swahili trade centres such as Kilwa and Songo Mnara, in this latter as part of a coins hoard [35]. Several works have indicated that this type of beads could have been imported from India and suggest that their origin could be the area of Cambay and Rajpipla, in the current state of Gujarat, whose carnelian outcrops have been exploited from 2500 BC by the Indus Valley civilizations [1].
However, any archaeometric studies have been barely undertaken on these materials or in other materials found in East African sites and West African regions, with which the results obtained in the Ibo bead can be compared. There is only one work carried out on a small number of beads (seven) from the 9th to 12th centuries AD found in West African sites such as Igbo-Ukwu (Nigeria) and Gao Ancien (Mali), apart from six others of more recent chronology (18–19th centuries AD), along with other 13 modern samples of carnelian outcrops from different locations in Gujarat. The study concludes that it is not possible to establish a clear differentiation between West African and Gujarat samples and also that there are possibly beads of Libyan-Nigerian origin [36]. Although it is not possible to make direct comparisons since different analytical techniques have been used, lead and iron are two of the elements that contribute the most to the grouping of samples. Therefore, a possible Indian origin of the Ibo bead here studied could be tentatively suggested given the high content of PbO detected in some of its bands. An interesting fact that could support this provenance, although of a later date, is that reported by an English soldier in 1832 who points out that beads produced from the Rajpipla mines were mainly exported to the East African coast and the islands of Mozambique and Zanzibar [37]. A large number of carnelian beads were also found in the necropolis of Vohemar in Northern Madagascar [23].
Crystalline phases by XRD of the shell beadDiffractogram of sample MO-30 (Fig. 9) indicated that aragonite (CaCO3) is the only crystalline phase identified, which corroborates that shell beads of C-100 and C-300 sites were also made with shells of marine gastropod mollusks abundantly recovered during their archaeological excavation, as demonstrated in the comparative analysis carried out with beads and shells of the Lambis lambis species from the C-400 site [12]. These shell beads were therefore locally produced from these mollusks and were distributed among the inland Swahili communities of the African continent as currency [18].
Conclusions
The archeometric characterization of glass beads and other glass fragments, as well as a carnelian bead from C-100 and C-300 sites of a Swahili settlement of the Ibo Island at Northern Mozambique, has provided data of extraordinary interest on their technology and provenance, and also to determine similarities and differences with materials from the C-400 site of this same settlement at Ibo within the general framework of the Indian Ocean trade networks.
Except shell beads locally produced and used as currency, either the glass beads and fragments or also the carnelian bead are all of them imported materials resulting from the Indian Ocean trade. They were neither produced nor manufactured in Ibo since no evidence of glass production or recycling has been found. A provenance from the west coast of India can be tentatively established for the carnelian bead, while glasses show distinct and wide origins.
Of the 13 glass samples analyzed: 11 beads and 2 glass fragments, 12 were made with soda-lime silicate glass (Na2O-CaO-SiO2), while the remaining one was made with lead silicate glass (PbO-SiO2). The soda-lime silicate glasses can be divided into three groups: 1) glasses with high content of alumina and a source of sodium of mineral origin (m-Na-Al) (five samples); 2) glasses with high content of alumina, lower than in the previous group, and a source of sodium of vegetable origin (v-Na-Al) (six samples); and 3) conventional glass with a synthetic sodium source (one sample). Groups 1, 2, and 3 were also identified at the site C-400, while lead silicate glasses were not. Both Groups 1 and 2 showed a great variety of either colloidal (red and yellow) or ionic (deep blue, greenish blue and yellowish) chromophores. The lead silicate glass yellow colour was obtained through a combination of lead stannate and lead antimoniate microcrystals.
Based on their chemical composition and data from the literature, Group 1 of glasses was produced on the west coast of India and traded through the Indian Ocean towards the east coast of Africa between the 9th and 19th centuries AD, while Group 2 was produced in Central Asia and reached the east coast of Africa via India between approximately the 13th and 17th centuries AD. Group 3 is close to a conventional soda-lime silicate glass and is possibly a European production from the 19th or 20th centuries AD. The lead silicate glass can be associated to a European glass from Venetian origin. This glass type has only been documented up to now in some areas of Central Africa. It therefore opens the way to other possible trade routes present on the Ibo Island apart from those from the Indian Ocean.
Group 3 is just composed of one European modern glass sample that comes from SU302-layer 3. Except for this glass fragment, all the findings are innerly coherent with a Lumbo Horizon, so it cannot be discarded that it could have leaked from upper levels. On the contrary, the Venetian glass match with the other findings of SU 302-layer 2 and with a chronology of 17–19th centuries AD.
Respecting to Groups 1 and 2 beads, they appear as much in lower SUs of Lumbo Horizon as in the upper ones, belonging to Sancul Horizon. Although there should be cautious due to the small size of the sampling, it seems that, contrary to other areas of Eastern and Southern Africa [38], there are not significant shifts in glass beads trading before and after the European arrival to Ibo.
Conflict of interestThe authors declare that they have no conflict of interest.
The authors acknowledge funding support from the following sources: the Spanish Ministry of Economy, Industry and Competitiveness through the National Program for Fostering Excellence in Scientific and Technical Research (HAR2013-48495-C2-2-P), the International Archaeological Excavations scheme from the Spanish Cultural Heritage Institute (IPCE), the Palarq Foundation, the Program TOP Heritage: Technologies in Heritage Sciences from the Regional Government of Madrid (S2018/NMT-4372), and the Spanish Ministry for Science and Innovation through the Challenges of Society program (PID2019-104220RB-I00/MCIN/AEI/10.13039/501100011033). Professional support from the CSIC Interdisciplinary Thematic Platform: Open Heritage, Research and Society (PTI-PAIS) is also acknowledged.

