


The aim of the clinical laboratory is to provide useful information for screening, diagnosis and monitoring of disease. The laboratory should ensure the quality of extra-analytical and analytical process, based on set criteria. To do this, it develops and implements a system of internal quality control, designed to detect errors, and compare its data with other laboratories, through external quality control. In this way it has a tool to detect the fulfillment of the objectives set, and in case of errors, allowing corrective actions to be made, and ensure the reliability of the results.
ObjectiveThis article sets out to describe the design and implementation of an internal quality control protocol, as well as its periodical assessment intervals (6 months) to determine compliance with pre-determined specifications (Stockholm Consensus1).
Materials and methodsA total of 40 biochemical and 15 immunochemical methods were evaluated using three different control materials. Next, a standard operation procedure was planned to develop a system of internal quality control that included calculating the error of the analytical process, setting quality specifications, and verifying compliance.
ResultsThe quality control data were then statistically depicted as means, standard deviations, and coefficients of variation, as well as systematic, random, and total errors. The quality specifications were then fixed and the operational rules to apply in the analytical process were calculated. Finally, our data were compared with those of other laboratories through an external quality assurance program.
DiscussionThe development of an analytical quality control system is a highly structured process. This should be designed to detect errors that compromise the stability of the analytical process. The laboratory should review its quality indicators, systematic, random and total error at regular intervals, in order to ensure that they are meeting pre-determined specifications, and if not, apply the appropriate corrective actions.
El objetivo del laboratorio clínico es proporcionar información útil para el cribado, diagnóstico y seguimiento de las enfermedades. Este debe garantizar la calidad del proceso analítico y extraanalítico, en base a unos requisitos establecidos. Para ello, se desarrolla y aplica un sistema de control de calidad interno, encaminado a detectar errores, y se intercomparan estos datos con otros laboratorios, a través de un control de calidad externo. Así, disponemos de una herramienta para detectar el cumplimiento de los objetivos establecidos, permitiéndonos implantar acciones correctivas, y asegurar la fiabilidad de los resultados, en caso de detectar errores.
Objetivo: En este trabajo se describe el diseño e implantación de un protocolo de control de calidad interno. Además, su evaluación a periodos de tiempo regulares (6 meses), para determinar el cumplimiento de las especificaciones predeterminadas (Consenso de Estocolmo1).
Materiales y métodosSe valoraron 40 magnitudes de bioquímica y 15 de inmunoquímica, utilizando 3 materiales de control diferentes. A continuación, se planificó un procedimiento operativo para desarrollar un sistema de control de calidad interno, calculando los errores del proceso analítico, así como fijando especificaciones de calidad, y verificando su cumplimiento.
ResultadosSe caracterizaron estadísticamente los datos calculando media, desviación estándar y coeficiente de variación; así como errores sistemático, aleatorio y total. Posteriormente, se fijaron las especificaciones de calidad y se calcularon las reglas operativas a aplicar en el proceso analítico. Finalmente, se compararon nuestros datos con los de otros laboratorios a través de un sistema de calidad externo.
DiscusiónEl desarrollo de un sistema de calidad analítico es un proceso altamente estructurado. Este debe diseñarse para detectar errores que comprometan la estabilidad del proceso analítico. A intervalos de tiempo regulares, el laboratorio debe revisar sus indicadores de calidad, error sistemático, aleatorio y total, con el objeto de saber si se están cumpliendo las especificaciones predeterminadas. En caso negativo, aplicar las acciones correctivas adecuadas.
The objective of the clinical laboratory is to provide useful information for screening, diagnosis and monitoring diseases. For this reason, the laboratory performs determinations in patient's samples by measurement procedures that ensure to get credible and reliable information for clinical use. Within the analytical process, the laboratory must ensure its quality, not only verifying that pre-established requirements are met, but also confirming that the benefits obtained meet the expectations of both the requesting physicians and patients seen. Internal quality control is the initial stages of any system of quality management that is implanted in the clinical laboratory, and based on this analytical phase interleave control materials of their composition, qualitative or quantitative known, between patient samples. If these results are within pre-established limits, the laboratory considered that the analytical process works properly and accepts the run, being able to generate the analytical report.
Currently recommended quality control plan individually for each constituent as tolerable error limits and the analytical performance of methods are different, in order to achieve maximum analytical quality. Proper selection allows clinicians meet the quality requirements at the lowest cost, since the unnecessary rejection of analytical series is avoided and the number of controls is reduced.2
The steps in designing a protocol for analytical quality control are:
- (1)
Definition of the aim pursued (for example, satisfy medical needs for diagnosis, monitoring, treatment of the patient; meet legal requirements; achieve delivery defined by the manufacturer, etc).
- (2)
Definition of quality specifications selecting those appropriate indicators (imprecision, systematic error, total error) as well as the limits of acceptability thereof. Based on the 5 criteria proposed in the Stockholm Consensus1 (imprecision and systematic error in specific clinical situations, biological variation, opinions of clinicians, expert recommendations, and state of the art), or reduced to 3 criteria proposed in the review carried out in the Milan Consensus3 (expert opinion biological variability, and state of the art)
- (3)
Implement a strategy that is consistent with the defined goal (operating rules of quality control) whose purpose will warn us at what time the analytical process does not meet the specifications defined for what the laboratory should periodically check through analysis compliance results. This will allow us to detect errors that can analyze and establish corrective measures to avoid the negative repercussion in issuing results and ensuring the reliability thereof.4 This implies prior knowledge of the imprecision and accuracy of each biological scale, allowing us to specifications established design rules appropriate control to detect the maximum number of errors (“Power”), and reject the minimum number of analytical series (“Specificity”). The objectives are to obtain the minimum probability of false rejection (Pfr) and simultaneously obtain maximum likelihood detection error (Pde). As well as set the number of controls used in each test run. It is recommended that the procedure has a Pde >0.90 and Pfr <0.05 (optimal <0.01). The control is used as more samples together with a patient's sample. It should have several features5:
- 1
Control materials commutability, analytical behavior should be similar to patient samples.
- 2
Different levels of concentration or activity to verify the correct functioning of the measurement procedure along its range of linearity, possibly two levels of control, one of them with a level of concentration within the range will be selected clinical and nearby the clinical decision limits.
- 3
Stability of the constituents concentration in a long time.
- 4
What are homogeneous and the variability between flasks is much lower than procedure measurement.
- 5
Choose materials that require little manipulation, lyophilized or liquid. Control liquid materials have the advantage over the lyophilized not to reconstitute avoiding a potential source of error reconstitution.
- 1
The study was conducted over a period of three months (October to December 2013) using the Assayed Control Multiqual material (BioRad® Laboratories, Hercules, California, USA), Immunoassay Plus (BioRad® Laboratories, Hercules, California, USA) and Quantitative Urine (BioRad® Laboratories, Hercules, California, USA). The data obtained were analyzed with the quality assurance software Unity (Bio-Rad® Laboratories, Hercules, California, USA). The magnitudes studied were determined using COBAS 8000 c701 (biochemistry) and e601 (immunochemistry) (Roche® Diagnostics, Switzerland) equipments, under standardized conditions. A total of 28 magnitudes of biochemistry in serum, 12 in urine, and 15 immunochemistry in serum were assessed. Initially, we calculated the Total measurement error (ET) using the expression: Total measurement error (ET)=Random measurement error (EA)+Systematic measurement error (ES). Next, an operating procedure for planning internal control for each of the quality variables studied was set down in accordance with the following scheme:
- (1)
Select the control material
- (2)
Evaluate the characteristics of a measurement procedure in a stability situation
- (3)
Calculate the systematic, random and total error
- (4)
Define quality specifications
- (5)
Calculation of sigma value
- (6)
Election of operational control rules
- (7)
Verification of specifications compliance
Select control material: The material controls selected were, two levels of concentration or activity that meet the characteristics and criteria fixed.
Evaluate the characteristics of a measurement procedure in a stability situation: Once selected control materials, these were analyzed for 20 days in a situation of method stability. If observed a result that deviates from the values set, was applied a criterion of acceptance or rejection. The values given by the manufacturer were used only as a reference. 20 values obtained with the mean, standard deviation and coefficient variation were calculated.
Calculate the systematic, random and total error: Data from control materials were used for the calculation of different types of errors using the following equations:
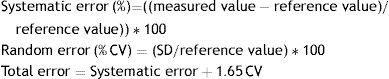
We used as a benchmark the average obtained by a laboratories homogeneous group (number always higher than 30 participating laboratories, with a larger 1000 number dates, for each magnitude), with our same measurement procedure and consolidated over time, through the comparison program Unity (BioRad® Laboratories, Hercules, California, USA). The data management system was performed by Unity Real Time TM (BioRad® Laboratories, Hercules, California, USA). SD was standard deviation and CV was coefficient variation.
Define quality specifications: Quality specifications for each of the variables studied, based on the criteria for internationally accepted consensus conference in Stockholm1 were selected: recommendations from experts or scientific societies, biological variation (best, minimal or desirable) or based on the Spanish Consensus Document on minimum analytical quality specifications based on the programs results of external quality assurance, established as “state of the art”.6–10 These 3 criteria were chosen mainly from the 5 proposed in the Stockholm Consensus.1 Once we had calculated our total error compared to the total allowable error that we have defined in the Quality Specifications.
Calculation of sigma value: For the calculation of the sigma value of an analytical process we use the equation:
where TEd is the total error defined, SE systematic error and CV is random error.
Determining yields were regarded as excellent (sigma >6), acceptable (sigma 3–6) and unacceptable (sigma <3), depending on the chosen quality specification. The sigma value was also used to select the ideal operating rules Westgard.11,12
Election of operational control rules: It was important to check that the analytical process was stable. Based on the values of total, random and systematic error, and sigma obtained and relying on operational Charts OPS’ charts and Unity Software (BioRad Laboratories, Hercules, California, USA), the operating rule was selected. If sigma >6 can use any simple rule (we use 1: 3.5S), 5–6 sigma=N=2 or 3 simple rule 1: 3s, 4–5 sigma=N=2 or 3 simple rule 1: 2, 5s, sigma N=4–6=3–4 multirule 1: 3s/2 2s/R: 4s, sigma <3 most rigorous quality control. Measuring procedures sigma level <3 should be replaced by others with better accuracy.
Verification of specifications compliance: Having set quality specifications and implemented in routine laboratory work, we were made periodic detection of analytical problems. We used the graphs generated with Unity Software (BioRad® Laboratories, Hercules, California, USA), and external controls of the Clinical Chemistry and Molecular Pathology Spanish Society (SEQC) quality control program, comparing ourselves with our pair group in both cases.
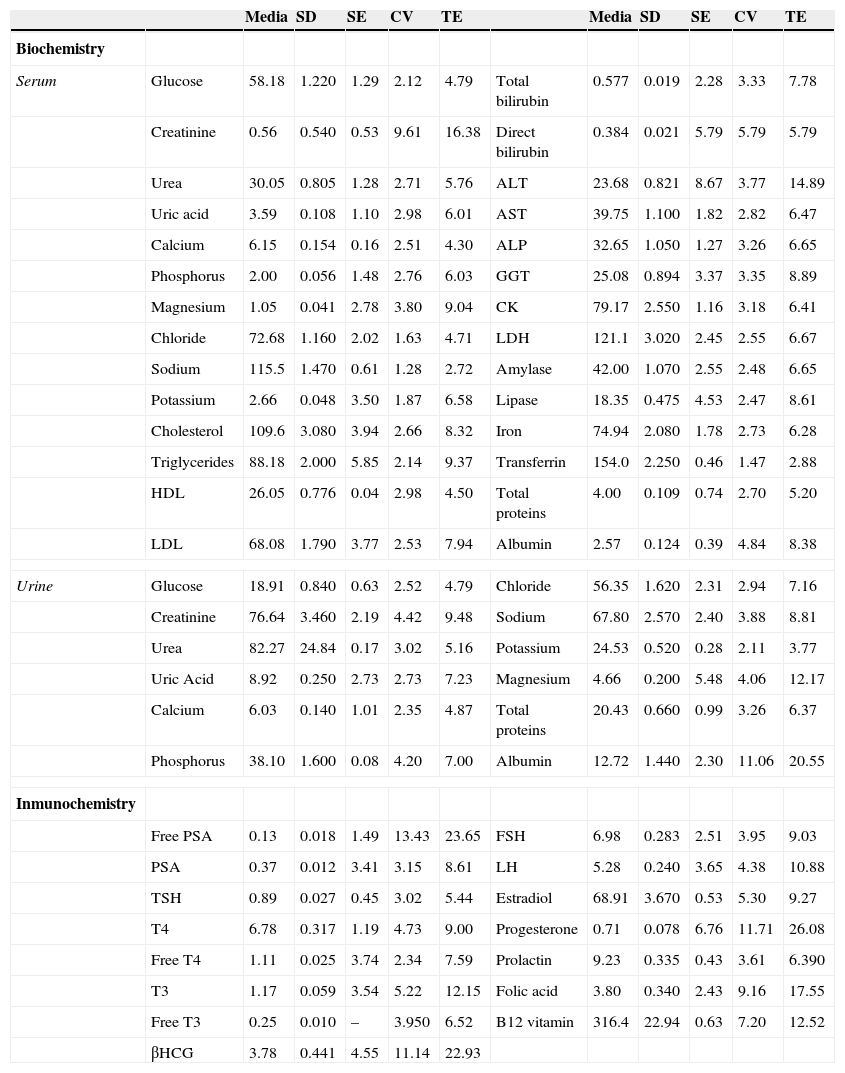
ResultsStatistical characterization data set obtained by calculating the mean, standard deviation, and coefficient variation was performed. The calculated statistical data were used to determine the total, random, and systematic error in our laboratory. To determine the value of the random and systematic error, we need to have a reference value of each measured quantity and control level, taking the average for that obtained by a homogeneous laboratories group, with our own measuring method and consolidated in time, through the comparison software Unity (Table 1).
Values of statistical parameters, and total and systematic errors.
| Media | SD | SE | CV | TE | Media | SD | SE | CV | TE | |||
|---|---|---|---|---|---|---|---|---|---|---|---|---|
| Biochemistry | ||||||||||||
| Serum | Glucose | 58.18 | 1.220 | 1.29 | 2.12 | 4.79 | Total bilirubin | 0.577 | 0.019 | 2.28 | 3.33 | 7.78 |
| Creatinine | 0.56 | 0.540 | 0.53 | 9.61 | 16.38 | Direct bilirubin | 0.384 | 0.021 | 5.79 | 5.79 | 5.79 | |
| Urea | 30.05 | 0.805 | 1.28 | 2.71 | 5.76 | ALT | 23.68 | 0.821 | 8.67 | 3.77 | 14.89 | |
| Uric acid | 3.59 | 0.108 | 1.10 | 2.98 | 6.01 | AST | 39.75 | 1.100 | 1.82 | 2.82 | 6.47 | |
| Calcium | 6.15 | 0.154 | 0.16 | 2.51 | 4.30 | ALP | 32.65 | 1.050 | 1.27 | 3.26 | 6.65 | |
| Phosphorus | 2.00 | 0.056 | 1.48 | 2.76 | 6.03 | GGT | 25.08 | 0.894 | 3.37 | 3.35 | 8.89 | |
| Magnesium | 1.05 | 0.041 | 2.78 | 3.80 | 9.04 | CK | 79.17 | 2.550 | 1.16 | 3.18 | 6.41 | |
| Chloride | 72.68 | 1.160 | 2.02 | 1.63 | 4.71 | LDH | 121.1 | 3.020 | 2.45 | 2.55 | 6.67 | |
| Sodium | 115.5 | 1.470 | 0.61 | 1.28 | 2.72 | Amylase | 42.00 | 1.070 | 2.55 | 2.48 | 6.65 | |
| Potassium | 2.66 | 0.048 | 3.50 | 1.87 | 6.58 | Lipase | 18.35 | 0.475 | 4.53 | 2.47 | 8.61 | |
| Cholesterol | 109.6 | 3.080 | 3.94 | 2.66 | 8.32 | Iron | 74.94 | 2.080 | 1.78 | 2.73 | 6.28 | |
| Triglycerides | 88.18 | 2.000 | 5.85 | 2.14 | 9.37 | Transferrin | 154.0 | 2.250 | 0.46 | 1.47 | 2.88 | |
| HDL | 26.05 | 0.776 | 0.04 | 2.98 | 4.50 | Total proteins | 4.00 | 0.109 | 0.74 | 2.70 | 5.20 | |
| LDL | 68.08 | 1.790 | 3.77 | 2.53 | 7.94 | Albumin | 2.57 | 0.124 | 0.39 | 4.84 | 8.38 | |
| Urine | Glucose | 18.91 | 0.840 | 0.63 | 2.52 | 4.79 | Chloride | 56.35 | 1.620 | 2.31 | 2.94 | 7.16 |
| Creatinine | 76.64 | 3.460 | 2.19 | 4.42 | 9.48 | Sodium | 67.80 | 2.570 | 2.40 | 3.88 | 8.81 | |
| Urea | 82.27 | 24.84 | 0.17 | 3.02 | 5.16 | Potassium | 24.53 | 0.520 | 0.28 | 2.11 | 3.77 | |
| Uric Acid | 8.92 | 0.250 | 2.73 | 2.73 | 7.23 | Magnesium | 4.66 | 0.200 | 5.48 | 4.06 | 12.17 | |
| Calcium | 6.03 | 0.140 | 1.01 | 2.35 | 4.87 | Total proteins | 20.43 | 0.660 | 0.99 | 3.26 | 6.37 | |
| Phosphorus | 38.10 | 1.600 | 0.08 | 4.20 | 7.00 | Albumin | 12.72 | 1.440 | 2.30 | 11.06 | 20.55 | |
| Inmunochemistry | ||||||||||||
| Free PSA | 0.13 | 0.018 | 1.49 | 13.43 | 23.65 | FSH | 6.98 | 0.283 | 2.51 | 3.95 | 9.03 | |
| PSA | 0.37 | 0.012 | 3.41 | 3.15 | 8.61 | LH | 5.28 | 0.240 | 3.65 | 4.38 | 10.88 | |
| TSH | 0.89 | 0.027 | 0.45 | 3.02 | 5.44 | Estradiol | 68.91 | 3.670 | 0.53 | 5.30 | 9.27 | |
| T4 | 6.78 | 0.317 | 1.19 | 4.73 | 9.00 | Progesterone | 0.71 | 0.078 | 6.76 | 11.71 | 26.08 | |
| Free T4 | 1.11 | 0.025 | 3.74 | 2.34 | 7.59 | Prolactin | 9.23 | 0.335 | 0.43 | 3.61 | 6.390 | |
| T3 | 1.17 | 0.059 | 3.54 | 5.22 | 12.15 | Folic acid | 3.80 | 0.340 | 2.43 | 9.16 | 17.55 | |
| Free T3 | 0.25 | 0.010 | – | 3.950 | 6.52 | B12 vitamin | 316.4 | 22.94 | 0.63 | 7.20 | 12.52 | |
| βHCG | 3.78 | 0.441 | 4.55 | 11.14 | 22.93 | |||||||
Data from representative biochemical magnitudes (serum and urine) and immunochemistry. SD: standard deviation, SE: systematic error, CV: coefficient variation, TE: total error, HDL: high density lipoprotein, LDL: low density lipoprotein, PSA: prostatic specific antigen, TSH: thyroid-stimulating hormone, T4: thyroxine, T3: triiodothyronine, βHCG: chorionic gonadotropin hormone sub-unit beta, ALP: alkaline phosphatase, AST: alanine aminotransferase, AST: aspartate aminotransferase, GGT: Gamma glutamyl transferase, CK: creatine kinase, LDH: lactate dehydrogenase, FSH: follicle-stimulating hormone, LH: luteinizing hormone.
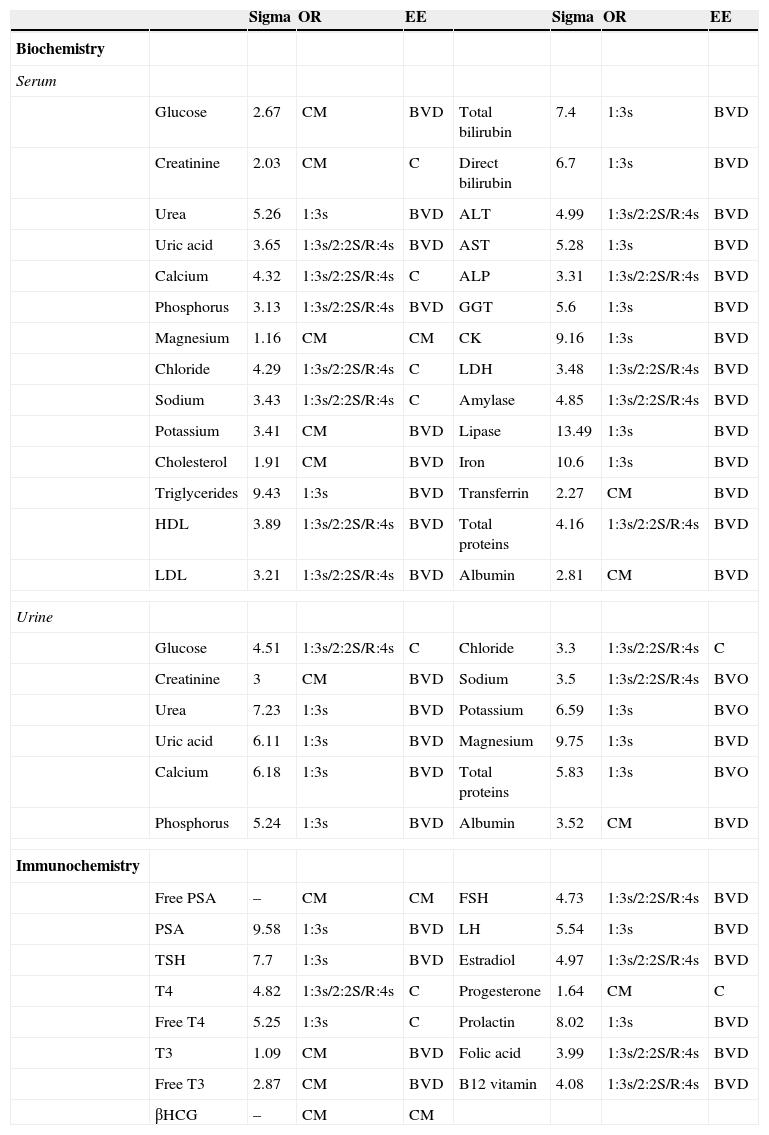
The next step was to determine the quality specifications according to the maximum permissible error. We were comparing the total error of our laboratory with the total allowable error for each group of quality specifications, and choose the appropriate quality specification for each magnitude considering the control level with the worst performance.
Depending on the chosen specification we determined the sigma value, which will allow us to fix the operating rules of each variable (Table 2).
Selected operating rules for different analytical variables.
| Sigma | OR | EE | Sigma | OR | EE | |||
|---|---|---|---|---|---|---|---|---|
| Biochemistry | ||||||||
| Serum | ||||||||
| Glucose | 2.67 | CM | BVD | Total bilirubin | 7.4 | 1:3s | BVD | |
| Creatinine | 2.03 | CM | C | Direct bilirubin | 6.7 | 1:3s | BVD | |
| Urea | 5.26 | 1:3s | BVD | ALT | 4.99 | 1:3s/2:2S/R:4s | BVD | |
| Uric acid | 3.65 | 1:3s/2:2S/R:4s | BVD | AST | 5.28 | 1:3s | BVD | |
| Calcium | 4.32 | 1:3s/2:2S/R:4s | C | ALP | 3.31 | 1:3s/2:2S/R:4s | BVD | |
| Phosphorus | 3.13 | 1:3s/2:2S/R:4s | BVD | GGT | 5.6 | 1:3s | BVD | |
| Magnesium | 1.16 | CM | CM | CK | 9.16 | 1:3s | BVD | |
| Chloride | 4.29 | 1:3s/2:2S/R:4s | C | LDH | 3.48 | 1:3s/2:2S/R:4s | BVD | |
| Sodium | 3.43 | 1:3s/2:2S/R:4s | C | Amylase | 4.85 | 1:3s/2:2S/R:4s | BVD | |
| Potassium | 3.41 | CM | BVD | Lipase | 13.49 | 1:3s | BVD | |
| Cholesterol | 1.91 | CM | BVD | Iron | 10.6 | 1:3s | BVD | |
| Triglycerides | 9.43 | 1:3s | BVD | Transferrin | 2.27 | CM | BVD | |
| HDL | 3.89 | 1:3s/2:2S/R:4s | BVD | Total proteins | 4.16 | 1:3s/2:2S/R:4s | BVD | |
| LDL | 3.21 | 1:3s/2:2S/R:4s | BVD | Albumin | 2.81 | CM | BVD | |
| Urine | ||||||||
| Glucose | 4.51 | 1:3s/2:2S/R:4s | C | Chloride | 3.3 | 1:3s/2:2S/R:4s | C | |
| Creatinine | 3 | CM | BVD | Sodium | 3.5 | 1:3s/2:2S/R:4s | BVO | |
| Urea | 7.23 | 1:3s | BVD | Potassium | 6.59 | 1:3s | BVO | |
| Uric acid | 6.11 | 1:3s | BVD | Magnesium | 9.75 | 1:3s | BVD | |
| Calcium | 6.18 | 1:3s | BVD | Total proteins | 5.83 | 1:3s | BVO | |
| Phosphorus | 5.24 | 1:3s | BVD | Albumin | 3.52 | CM | BVD | |
| Immunochemistry | ||||||||
| Free PSA | – | CM | CM | FSH | 4.73 | 1:3s/2:2S/R:4s | BVD | |
| PSA | 9.58 | 1:3s | BVD | LH | 5.54 | 1:3s | BVD | |
| TSH | 7.7 | 1:3s | BVD | Estradiol | 4.97 | 1:3s/2:2S/R:4s | BVD | |
| T4 | 4.82 | 1:3s/2:2S/R:4s | C | Progesterone | 1.64 | CM | C | |
| Free T4 | 5.25 | 1:3s | C | Prolactin | 8.02 | 1:3s | BVD | |
| T3 | 1.09 | CM | BVD | Folic acid | 3.99 | 1:3s/2:2S/R:4s | BVD | |
| Free T3 | 2.87 | CM | BVD | B12 vitamin | 4.08 | 1:3s/2:2S/R:4s | BVD | |
| βHCG | – | CM | CM | |||||
The rules were determined based on the sigma value for magnitudes in both serum and urine biochemical tests and serum immunochemistry. The CM rule required us to review the control values and comparing the mean and SD of our pair group (Unity Software BioRad® Laboratories, Hercules, California, USA). OR: operative rule, EE: choose specification, CM: control maximum, BVD: biological variation desirable, C: consensus, BVO: biological variation optimum, HDL: high density lipoprotein, LDL: low density lipoprotein, PSA: prostatic specific antigen, TSH: thyroid-stimulating hormone, T4: thyroxine, T3: triiodothyronine, βHCG: beta chorionic gonadotropin hormone, ALP: alkaline phosphatase, AST: alanine aminotransferase, AST: aspartate aminotransferase, GGT: gamma glutamyl transferase, CK: creatine kinase, LDH: lactate dehydrogenase, FSH: follicle-stimulating hormone, LH: luteinizing hormone.
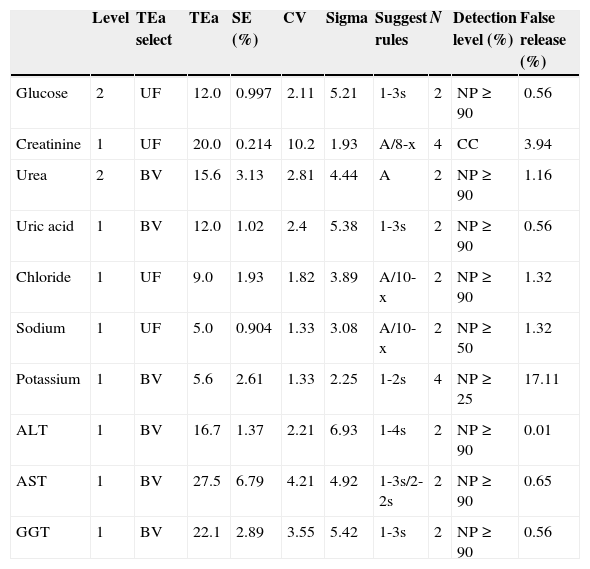
For verification and monitoring of the correct operation procedure we relied on the application Westgard Advisor of Unity software, which allowed us to automatically at regular intervals of time (six months) to review the quality indicators of the analytical phase, systematic and random error, in order to know if they were meeting predetermined specifications. We suggested the rule to apply to the level of error detection and false rejection (Table 3).
Control rules based on quality indicators.
| Level | TEa select | TEa | SE (%) | CV | Sigma | Suggest rules | N | Detection level (%) | False release (%) | |
|---|---|---|---|---|---|---|---|---|---|---|
| Glucose | 2 | UF | 12.0 | 0.997 | 2.11 | 5.21 | 1-3s | 2 | NP≥90 | 0.56 |
| Creatinine | 1 | UF | 20.0 | 0.214 | 10.2 | 1.93 | A/8-x | 4 | CC | 3.94 |
| Urea | 2 | BV | 15.6 | 3.13 | 2.81 | 4.44 | A | 2 | NP≥90 | 1.16 |
| Uric acid | 1 | BV | 12.0 | 1.02 | 2.4 | 5.38 | 1-3s | 2 | NP≥90 | 0.56 |
| Chloride | 1 | UF | 9.0 | 1.93 | 1.82 | 3.89 | A/10-x | 2 | NP≥90 | 1.32 |
| Sodium | 1 | UF | 5.0 | 0.904 | 1.33 | 3.08 | A/10-x | 2 | NP≥50 | 1.32 |
| Potassium | 1 | BV | 5.6 | 2.61 | 1.33 | 2.25 | 1-2s | 4 | NP≥25 | 17.11 |
| ALT | 1 | BV | 16.7 | 1.37 | 2.21 | 6.93 | 1-4s | 2 | NP≥90 | 0.01 |
| AST | 1 | BV | 27.5 | 6.79 | 4.21 | 4.92 | 1-3s/2-2s | 2 | NP≥90 | 0.65 |
| GGT | 1 | BV | 22.1 | 2.89 | 3.55 | 5.42 | 1-3s | 2 | NP≥90 | 0.56 |
Control rules were obtained using the Wesgard Advisor application. SE: systematic error; CV: coefficient variation; TEa: total error admissible; N: control numbers per analytical series; UF: user defined; BV: biological variability bias/imprecision; A: 1-3s/2-2S7R-4s/4-1s; NP: slope level; CC: maximum condition quality control; AST: alanine aminotransferase; AST: aspartate aminotransferase; GGT: gamma glutamyl transferase.
OPS’ chart graphics were used also for the calculation of operational rules (Fig. 1).
 and thyroid-stimulating hormone (TSH) (b). TEa: total error admissible, %SE: systematic error (percentage), CV: coefficient variation, N: control numbers per analytical series, Pfr: false release probability.")
Definition of operational rules using OPS’charts graphics. Graphics examples for two magnitudes, creatinine (a) and thyroid-stimulating hormone (TSH) (b). TEa: total error admissible, %SE: systematic error (percentage), CV: coefficient variation, N: control numbers per analytical series, Pfr: false release probability.
The periodic results evaluation allowed us to detect the presence of non-conformity that could be interfering with the analytical process (Fig. 2).
, uric acid (b), ALT (c), and comparing the magnitude data ALT described our group pair program based on the external quality of the Spanish Society of Clinical Chemistry and Molecular Pathology (SEQC) (d). In the graphs shown in (a)–(c), the black line represents the level one and gray line the level two. In the graphic, media and ±3SD values are presented, and also depending on the analytical target (TEa).")
Representation of graphs tracking controls. Three examples of errors identified using the quality control system applied in the laboratory were described, total proteins (a), uric acid (b), ALT (c), and comparing the magnitude data ALT described our group pair program based on the external quality of the Spanish Society of Clinical Chemistry and Molecular Pathology (SEQC) (d). In the graphs shown in (a)–(c), the black line represents the level one and gray line the level two. In the graphic, media and ±3SD values are presented, and also depending on the analytical target (TEa).
The quality analytical system development is based on highly structured process. Thus the first step, once control materials to use defined, is to determine the analytical performance of the laboratory. Thus, the calculation of statistical parameters that characterize the data is necessary, such as mean, standard deviation (SD) and coefficient variation (CV). The coefficient variation allowed us to assess the dispersion data, compared to the mean independently of the measurement units for each size.2 In our case, this value ranged between 1.28 and 11.06 for biochemical tests (urine and serum), and between 2.34 and 13.43 for immunochemical tests. Within the set of biochemical tests, the ions behave like magnitudes less variability (CV between 1.28 and 1.87), while meanwhile immunochemical tests showed higher variability levels. Ions require this low variability level due to the narrow range of normalcy that occurs in physiological conditions. Meanwhile, in immunochemical tests, include the beta subunit of chorionic gonadotropin hormone (βHCG), the specific free prostatic antigen (Free PSA) and progesterone with CV of 11.14, 13.43 and 11.71 respectively. These data variability, standard deviation and coefficient variation, allowed us to calculate the total error and the other two errors, systematic (bias) and random (imprecision). Biochemical tests showed collective bias between 0.04 and 8.97, meanwhile immunochemical tests ranged between 0.43 and 4.55. A level of bias, immunochemical tests showed a better distribution (bias between 0.45 and 4.55) around the mean value of biochemical tests that were more likely to be diverted to either side of the mean (bias between 0.08 and 8.67). Underline, the significant bias observed in determining enzyme activity alanine aminotransferase (ALT) with a value of 8.67. Taking into bias and imprecision set, the total error, immunochemical tests showed a higher error level, between 5.44 and 26.08, that biochemistry, between 2.72 and 20.55. The higher error level for the biochemical tests 20.55, only that had one magnitude (albumin in urine) being significantly lower for the rest. Instead, immunochemical tests, 3 of 15 as were progesterone, βHCG and Free PSA, the total error ranged between 22 and 26, greatly diminishing the rest of magnitudes determined by immunochemistry. Although, bias was not very different from testing, greater variability in immunochemical tests contributed to higher total error observed. Biochemical variables showed a better balance between bias and imprecision, however the amounts determined by immunochemical had bigger inaccuracies which contributed decisively to its higher rate of total error. Data statistical characterization, allowed us to establish the starting point of the magnitudes analytical performance studied in our laboratory. From our CV calculation and total error, these were compared with the total error and CV (both desirable and consensus) allowed defining quality specifications. For most of the magnitudes, we could choose desirable specifications based on biological variation. In biochemical tests, for creatinine we were elected consensus quality specification the same as for sodium. Not only must focus on the total error of a test-laboratory (in our laboratory 16.38 for creatinine and 2.7 for sodium), but compared with the laboratories that determine a magnitude the same as ours (interlaboratory comparison). So, creatinine measured by the Jaffe's method had a high variability inherent in method, allowing higher total or CV errors to the same level of quality specification of determination methods as more stable as that ions (“art state”). Meanwhile, in immunochemical tests, the βHCG and Free PSA not conformed to any quality specification so that required maximum control. Another way to set quality specifications, is to use the Six sigma system for quality management, which allows us to control the analytical process more comprehensively, calculating a parameter (6σ) determining the number of errors per million that produced in the process. The objective pursued is to improve the quality of a process from the reduction of errors occurring in the same (increase of σ value).11,12 The limit was set at 3σ acceptance in the clinical laboratory. On this basis, we calculated the σ values for each of the parameters studied, helping errors and CV previously calculated. All magnitudes analyzed exceeded the minimum acceptance, 3σ, except 6 tests of biochemistry and 4 for immunochemistry. Lipase and iron exhibited higher σ values, however creatinine and cholesterol were clearly below 3σ (around 2σ). Moreover, most of the magnitudes conformed to specifications σ value in the desirable range. In addition, to comprehensively assess the analytical process, we used the parameter 6σ for calculating operational control rules. There were magnitudes that require maximum control (such as glucose, creatinine and cholesterol), and change others required a less strict daily control (such as iron or lipase). The value 6σ is another fact that should not replace the estimation of random, systematic and total error, for error detection laboratory.
The function of internal quality control is the acceptance or rejection analytical series. This should be designed to detect the presence of random or systematic errors that compromise the stability of the analytical system. Thus, using the commutability controls (BioRad® Laboratories, Hercules, California, USA) observed a systematic error in our data when compared to our pair group, using control charts Unity Software (BioRad® Laboratories, Hercules, California program, USA). This was not observed with the controls provided by the manufacturer. This error detection served us to identify the presence of a calibration factor for this technique equipment (0.3). The suppression of this calibration factor corrected the error described, which shows the importance of implementing a system of analytical quality management. In the cases presented, uric acid and ALT parameters, a systematic error to compared ourselves with our pair group, mean and standard deviation (SD), researched and described as a problem arising from the reagent lot change it was observed. This systematic error was not detected with the quality objective charts where we met predetermined specifications therefore system stability was maintained. However, in the SEQC external quality control, we verified this error. The search for possible error causes (check method execution, the instrument, calibrator, reagents and controls) was the fundamental mission of quality control. Thus, a systematic error leads us to: A problem with the calibrator or reagent (batch change, reagent deterioration, improper storage, incorrect calibrator value, inadequate reagents preparation) or a change of solutions on the instruments. On the other hand, a random error can guide us: a problem with the instruments (incubation and temperatures unstable, etc), problems with the reagents (inadequate reagent mixture, bubbles, etc) or operator problems (incorrect preparation of controls, times, pipetting, etc). At regular intervals (six months) the laboratory should review their quality indicators of the analytical phase, systematic, random and total error, in order to know if they are meeting predetermined specifications. If not, we must initiate corrective actions to remedy the error. The implementation of an adequate system of analytical quality in each laboratory, and its periodic review will allow us to obtain more reliable and closer to the patient's clinical condition results.
Conflict of interestThe authors declare no conflict of interest.
A. Maria Jesus Pindado (Sales Specialist, Quality Systems Division, Bio-Rad Laboratories) for his cooperation and availability.