


Ultrasound changes in the cross-sectional area of the median nerve (CSAmn) could be of interest as biomarkers in patients with amyotrophic lateral sclerosis (ALS).
MethodsEighty-four ALS patients (51 men [60.7%]; mean 62.0 [SD 11.46] years old) and forty-six controls (27 men [58.7%]; mean 59.9 [SD 8.08] years old) of two different cohorts were recruited between September 2013 and February 2018. The CSAmn was measured bilaterally in each cohort, by two different examiners with two different ultrasound machines (one in each cohort). Its association with clinical variables (disease duration, muscle strength, disability, progression rate and tracheostomy-free survival) was assessed.
ResultsThe CSAmn was smaller in patients than in controls, and the study cohort did not influence its values. A mild correlation between the strength of the wrist flexor and the CSAmn was found. In the multivariable analysis, the probability of this association being true was 90%. In the cox regression, both a faster progression rate and a larger CSAmn independently predicted poor survival (HR=4.29, [Cr.I95%: 2.71–6.80], p<0.001; and HR=1.14, [Cr.I95%: 1.03–1.25], p=0.01), after adjusting by age, body mass index, bulbar onset, and diagnostic delay.
ConclusionsThe CSAmn is an easy to assess biomarker that seems reliable and reproducible. Our data also suggest that it could act as a progression and prognostic biomarker in ALS patients. Longitudinal studies with repeated measures are warranted to confirm its usefulness in the clinical practice.
Los cambios ecográficos en el área de sección transversal del nervio mediano (CSAmn) podrían ser de interés como biomarcadores en pacientes con esclerosis lateral amiotrófica (ELA).
MétodoSe analizaron 84 pacientes con ELA (51 hombres [60,7%]; media 62,0 [DE 11,46] años) y 46 controles (27 hombres [58,7%]; media 59,9 [DE 8,08] años) de 2 cohortes diferentes seleccionadas entre septiembre de 2013 y febrero de 2018. El CSAmn se midió bilateralmente en cada cohorte por 2 ecografistas independientes con 2 ecógrafos diferentes (uno en cada cohorte). Se evaluó su asociación con variables clínicas (duración de la enfermedad, fuerza muscular, discapacidad, tasa de progresión y supervivencia libre de traqueostomía).
ResultadosEl CSAmn fue menor en los pacientes que en los controles y el tipo de cohorte no influyó en los valores. Se encontró una correlación moderada entre la fuerza de los flexores de muñeca y el CSAmn. En el análisis multivariable, la probabilidad de que esta asociación fuera cierta fue del 90%. En la regresión de Cox, tanto una tasa de progresión más rápida como un CSAmn más grande predijeron de forma independiente una menor supervivencia (HR=4,29 [ICr95%: 2,71-6,80]; p<0,001; y HR=1,14 [ICr95%: 1,03-1,25]; p=0,01), después de ajustar por edad, índice de masa corporal, inicio bulbar y retraso diagnóstico.
ConclusionesEl CSAmn es un biomarcador fácil de evaluar que parece fiable y reproducible. Nuestros datos también evidencian que podría actuar como biomarcador de progresión y pronóstico en pacientes con ELA. Se justifica la realización de estudios longitudinales con medidas repetidas para confirmar su utilidad en la práctica clínica.
Amyotrophic lateral sclerosis (ALS) is a devastating progressive neurodegenerative disease affecting both upper (UMN) and lower (LMN) motor neurons, which results in muscle weakness and atrophy. While being a neurodegenerative disease, the role of neuroinflammation is increasingly recognised.1 Despite its short survival, there is a substantial diagnostic delay of about one year,2 mainly due to the lack of specific diagnostic biomarkers for ALS. Moreover, both progression and prognostic biomarkers are urgently needed in clinical trials to quantify the loss of UMN and LMN and to stratify patients, respectively.
Electromyography (EMG) is a sensitive technique to detect early motor neuron loss in form of acute and or chronic denervation and consequently, it has been incorporated to current diagnostic criteria such as the Awaji criteria3 and the more recent Gold Coast criteria.4 However, it is an invasive and painful technique and, despite several efforts, the ability to quantify LMN loss through EMG techniques has several limitations, precluding its widespread use in clinical trials.5 Other biomarkers, such as neurofilaments, have been shown as useful diagnostic and prognostic biomarkers,6 but they are unspecific markers of motor neuron death.
Muscle ultrasound is a widely available, painless technique that has been shown useful for the study of fasciculations in ALS.7 Moreover, several muscle parameters can differentiate ALS patients from controls and show potential as diagnostic, progression or prognostic biomarkers.8–13 However, since ALS primarily affect motor neurons, muscle changes may not be present early in the disease process. Moreover, data on muscle biomarkers are still not robust enough to justify its use as outcome measures in clinical trials.14
In ALS, neuropathological studies have shown a marked reduction of large, myelinated fibres in ventral roots and peripheral nerves and these changes correlate with the muscle strength in the corresponding myotomes.15 Since ALS is a neuronopathy, it could be expected that nerve changes are detectable even before muscle changes. Indeed, the nerve cross sectional area (CSA) of the median nerve as measured by ultrasound has been previously found smaller in ALS patients than in controls.9,17–19 Moreover, it was shown to improve the discrimination potential of its corresponding muscle biomarkers in ALS vs healthy controls.9 One additional advantage of using the nerve CSA as a biomarker is that it is easy to obtain and may be more suitable for standardisation and implementation into the clinical practice. However, its value as a diagnostic, progression or prognostic biomarker has been scarcely studied.20
Therefore, the objective of this study was to compare the CSA of the median nerve (CSAmn) between ALS patients and controls and to analyse the role of CSAmn as a progression and prognostic biomarker. Since the study included two different cohorts of patients and controls, an additional aim was to assess the influence of the explorer and ultrasound machines in the CSAmn measures.
Material and methodsPatient selectionEighty-four consecutive ALS patients were offered to participate whenever they met the Awaji criteria for possible, probable, or definite ALS.3
Forty-six healthy volunteers matched for age and sex, without neurological conditions were recruited as controls.
Participants comprised two different cohorts. Cohort A comprised 27 ALS patients diagnosed more than 6 months before and 26 controls and were recruited between September 2013 and April 2014. Cohort B comprised 57 patients with a recent (within 3 months) ALS diagnosis and 20 controls and were recruited between October 2014 and December 2017. Details of these cohorts and the results of those biomarkers studies have been previously published separately.7–12
Standard protocol approval, recruitment, and patient consentThis study was approved by the ethics committee of the Hospital La Fe of Valencia (Spain). All participants provided written informed consent.
Clinical variables.Patients were examined at the day of the ultrasonography by two researchers (JJMP for cohort A and JFVC for cohort B) with experience in neuromuscular diseases and following demographic and clinical characteristics were recorded: age, sex, body mass index (BMI), date and site of onset. The disability was assessed with the Revised Amyotrophic Lateral Sclerosis Functional Rating Scale (ALSFRS-R) (0–48 score). A progression rate was calculated as: (48−ALSFRS-R at the time of examination)/time from symptoms onset. The muscle strength was measured bilaterally with the modified Medical Research Council (MRC) rating scale (ranging from 0 to 5 and including grades 4− and 4+) in the flexor carpi radialis (MRCflex), median nerve innervated.
Patients were followed up for survival until July 26th, 2020. Survival was considered as the time from the ultrasound performance until death or tracheostomy.
UltrasonographyUltrasonography was performed by two researchers with wide experience in neuromuscular ultrasound (JJMP for cohort A and JIT for cohort B), who performed ultrasound examinations with a General Electric Company LEbt12 (cohort A) and Canon Medical Systems Toshiba Aplio XG (cohort B) ultrasound machines, equipped with a 5–13MHz and a 7–13MHz linear array transducer, respectively. The scans were carried out at a depth of 4cm and at a frequency of 13MHz in all subjects. Participants were assessed in supine position with the arm supinated and abducted beside the body.17,18 To avoid oblique scanning angles the position of the transductor was adjusted until the best echointensity was obtained in each Image.10
Bilateral transverse ultrasound images of median nerve were obtained at midpoint of the arm between the medial epicondyle and the axilla17 (Fig. 1). Three images were taken of each structure to minimise variation in parameters.10

The resulting bitmaps had a resolution of 716×537 pixels for Aplio XG and 820×614 pixels for LEbt12 with 256 grey levels and were stored as .TIFF files without compression or losses.
Image analysis.The CSAmn was measured by one researcher (JRD), experienced in ultrasound image analysis, and blinded to the diagnosis, using ImageJ (v.1.50) software. The CSA was measured by tracing the nerve just inside the hyperechoic rim, corresponding to the epineurium (Fig. 1) and the mean of the three values was used for the corresponding analysis.
A set of 20 random-selected images for median nerve were re-analysed by another researcher (MEBA), who was blinded to the previous results, to assess the inter-observer reliability. The ICC was >0.95 (CI 95% 0.94–1.0) in CSAmn, which indicates very good inter-observer reliability.
Statistical analysis.Data were analysed using R software (version 3.5.0).
Baseline assessmentMean, standard deviation, quartiles, range and 95% confidence intervals were calculated for continuous variables and absolute and relative frequencies for categorical variables. The inter-observer reliability was measured with the intraclass correlation coefficient (ICC) using a two-way random effects model and absolute agreement type.
CSAmn differences between groupsSince the variability between the right and left sides is expected to be lower than that found between subjects, it is necessary to perform a nested model. In this model, both sides are included in the model and intra-subject variability is considered using mixed (nested) analysis by laterality. Therefore, linear mixed models were used to compare the CSAmn (adjusted for age, sex, BMI, and cohort) between patients and controls).
Association of CSAmn with clinical variablesExploratory analysis was performed with the clustervar function (clickR) to assess the association of clinical variables (MRCflex, ALSFRS-R, disease duration or time from symptoms onset, progression rate and site of onset) with the CSAmn. Bayesian multiple linear regression was used to detect associations between CSAmn and the MRCflex, adjusting by the BMI and the side of the examination. Bayesian models were selected because they allow the use of monotonic effects to assess ordinal variables such as MRCflex.
A Cox regression analysis was performed to assess the effect of CSAmn in the tracheostomy-free survival (cases were censored either on the date of tracheostomy or in the case of death, if no tracheostomy was performed), adjusting by other predictors (age, BMI, site of onset, progression rate and diagnostic delay).
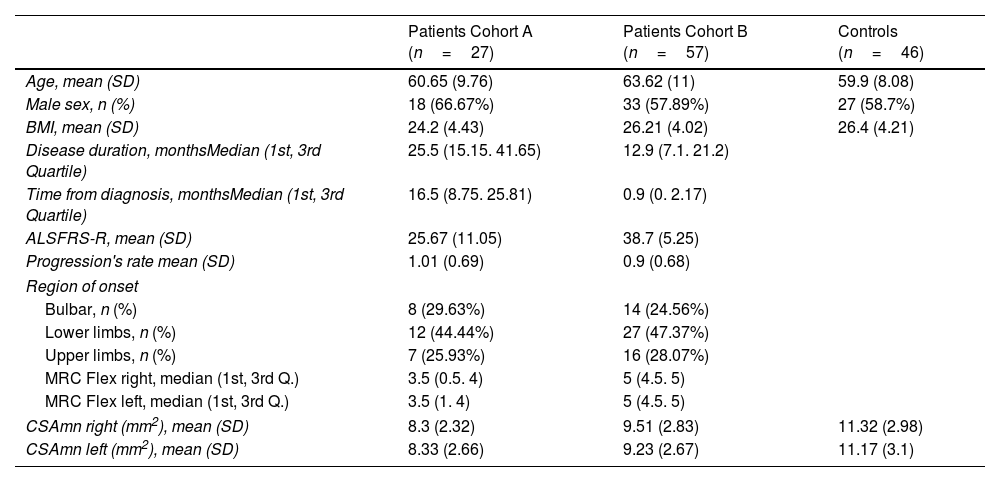
ResultsPatients’ characteristicsPatients of both cohorts and controls showed similar demographic characteristics (Table 1). However, patients of cohort A had longer disease duration and greater disability and weakness than those from cohort B. Globally, the disease started in the upper limbs in 27.4% of the ALS patients.
Baseline demographic and clinical characteristics of patients and controls.
| Patients Cohort A (n=27) | Patients Cohort B (n=57) | Controls (n=46) | |
|---|---|---|---|
| Age, mean (SD) | 60.65 (9.76) | 63.62 (11) | 59.9 (8.08) |
| Male sex, n (%) | 18 (66.67%) | 33 (57.89%) | 27 (58.7%) |
| BMI, mean (SD) | 24.2 (4.43) | 26.21 (4.02) | 26.4 (4.21) |
| Disease duration, monthsMedian (1st, 3rd Quartile) | 25.5 (15.15. 41.65) | 12.9 (7.1. 21.2) | |
| Time from diagnosis, monthsMedian (1st, 3rd Quartile) | 16.5 (8.75. 25.81) | 0.9 (0. 2.17) | |
| ALSFRS-R, mean (SD) | 25.67 (11.05) | 38.7 (5.25) | |
| Progression's rate mean (SD) | 1.01 (0.69) | 0.9 (0.68) | |
| Region of onset | |||
| Bulbar, n (%) | 8 (29.63%) | 14 (24.56%) | |
| Lower limbs, n (%) | 12 (44.44%) | 27 (47.37%) | |
| Upper limbs, n (%) | 7 (25.93%) | 16 (28.07%) | |
| MRC Flex right, median (1st, 3rd Q.) | 3.5 (0.5. 4) | 5 (4.5. 5) | |
| MRC Flex left, median (1st, 3rd Q.) | 3.5 (1. 4) | 5 (4.5. 5) | |
| CSAmn right (mm2), mean (SD) | 8.3 (2.32) | 9.51 (2.83) | 11.32 (2.98) |
| CSAmn left (mm2), mean (SD) | 8.33 (2.66) | 9.23 (2.67) | 11.17 (3.1) |
Patients showed smaller CSAmn than controls in both cohorts and sides, although with considerable overlap (Table 1 and Fig. 2). In the multivariable model this difference (−2.174mm2 [95% CI: −3.113, −1.235]) was statistically significant after adjusting by age, sex, BMI (p=0.01), and cohort (Table 2). Interestingly, besides the ALS diagnosis, only the BMI, but not the cohort, showed an independent effect in the CSAmn.
 and controls. CSAmn: cross sectional area of the median nerve.")
Multivariable model to assess differences in the CSAmn between patients and controls, adjusting by covariates. Both BMI and ALS diagnosis influence the CSAmn in a statistically significant manner. BMI: body mass index. SE: standard error. CI: confidence interval.
| Variables | Estimate | SE | Lower CI 95% | Upper CI 95% | p-value |
|---|---|---|---|---|---|
| Age | 0.002 | 0.024 | −0.045 | 0.048 | 0.943 |
| Sex (male) | −0.318 | 0.469 | −1.222 | 0.587 | 0.5 |
| BMI | 0.143 | 0.055 | 0.037 | 0.248 | 0.01 |
| ALS diagnosis | −2.174 | 0.487 | −3.113 | −1.235 | <0.001 |
| Cohort (B) | 0.322 | 0.473 | −0.59 | 1.234 | 0.497 |
On the exploratory analysis, no clinical variable appeared to associate to CSAmn. However, to further study the potential of CSAmn as a progression's biomarker, we assessed its specific association with the MRCflex, adjusting by the BMI and the side of the examination. According to the Bayesian model, there was a 90% of probability that larger CSAmn associate with higher BMI and MRCflex (Table 3 and Fig. 3).
Multivariable model assessing the association of CSAmn with MRCflex, adjusting by BMI. Larger CSAmn associates with higher BMI and MRCflex with a 90% of probability (although the 95-confidence interval included the 0). BMI: body mass index; CSAmn: cross sectional area of the median nerve; MRCflex: strength of the wrist flexor muscles. SE: standard error. Cr.I: credibility interval (Bayesian).
| Variables | Estimate | SE | Lower Cr.I95% | Upper Cr.I95% |
|---|---|---|---|---|
| BMI | 0.09 | 0.066 | −0.037 | 0.22 |
| Side (left) | −0.163 | 0.237 | −0.626 | 0.304 |
| MRCflex | 0.137 | 0.121 | −0.093 | 0.385 |
 and MRCflex (B), as calculated by the multivariable model.")
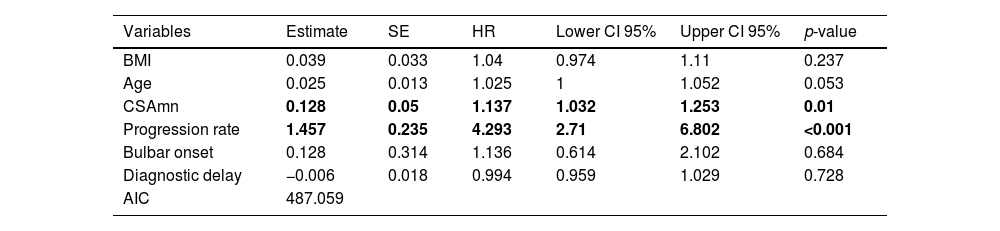
At the end of the study, 3 patients had been lost to follow up. Of the other 81 patients, 74 (91%) had died or underwent tracheostomy. In the multivariable analysis, both higher progression rate (p<0.001) and larger CSAmn (p=0.01) were independently associated to reduced survival (Table 4), after adjusting by age, BMI, bulbar onset, and diagnostic delay. Interestingly, removing the progression rate from the model resulted in the loss of predictive power of the CSAmn (supplementary Table 1).
Cox regression assessing survival of ALS patients. Both CSAmn and progression rate (in bold) influence survival. BMI: body mass index; CSAmn: cross sectional area of the median nerve. SE: standard error. HR: hazard ratio. CI: confidence interval.
| Variables | Estimate | SE | HR | Lower CI 95% | Upper CI 95% | p-value |
|---|---|---|---|---|---|---|
| BMI | 0.039 | 0.033 | 1.04 | 0.974 | 1.11 | 0.237 |
| Age | 0.025 | 0.013 | 1.025 | 1 | 1.052 | 0.053 |
| CSAmn | 0.128 | 0.05 | 1.137 | 1.032 | 1.253 | 0.01 |
| Progression rate | 1.457 | 0.235 | 4.293 | 2.71 | 6.802 | <0.001 |
| Bulbar onset | 0.128 | 0.314 | 1.136 | 0.614 | 2.102 | 0.684 |
| Diagnostic delay | −0.006 | 0.018 | 0.994 | 0.959 | 1.029 | 0.728 |
| AIC | 487.059 |
In recent years, ultrasound has been proved to be an excellent tool for assessing muscle impairment caused by ALS.14 However, muscle weakness and atrophy in ALS are not evident until one third of the LMN have degenerated,16 and muscle biomarkers show still several limitations, which difficult its implementation in the clinical practice.14 Nerve ultrasound biomarkers have been less thoroughly studied20 and could add value to muscle biomarkers.9 Moreover, several previous studies have assessed the role of ultrasound biomarkers for ALS diagnosis, but very few of them have addressed their role as progression or prognostic biomarker.
Several studies have previously assessed different peripheral nerve CSA in ALS, and most of them, although not all, found nerve atrophy.20 The reasons for these divergences are unclear but both the nerve characteristics and the examined segment could influence the results. For example, the contribution of motor vs sensory axons to the total axonal content (which varies upon nerves and locations) and the examination of nerves in entrapment areas, could influence the results.20
For this study, the CSAmn was selected because images are easy to obtain and analyse, reducing the interobserver variability. Moreover, images of MN were obtained proximal, since previous studies have assessed the MN at different levels, all favouring the study of more proximal ones.20,21 This proximal level has also the advantage of having a greater number of axons and of avoiding other nerve lesions or entrapments that usually occur more distally. In this study, images of the median nerve were taken in two cohorts of patients and controls with an ultrasound machine and examiner in each cohort. The CSAmn was afterwards measured in all images by the same researcher, but a set of 20 random-selected images were re-analysed, showing an excellent interobserver reliability. Moreover, the CSAmn was found different in patients and controls, with no effect of the cohort in the CSAmn, suggesting good reproducibility. All this indicates that CSAmn could be easily implemented in the clinical practice.
Meaning of the nerve CSAIt is well known that the axonal damage reduces the CSA, while nerve inflammation increases it.20 While signs of axonal pathology and a reduction of regenerating clusters are the most common findings in ALS,22 inflammatory infiltrates have also been recently described.23,24 Interestingly, both nerve atrophy and enlargement have been described in ALS patients,20 and it has been suggested that reductions in the nerve CSA would indicate predominant axonal damage,25,26 while an enlargement would point towards predominant inflammation.26 In a pilot study combining the ultrasound CSA and the cerebrospinal fluid albumin/serum albumin ratio, axonal degeneration was proposed to predominate in about 60% of ALS patients vs 20% of patients with predominant inflammation.26 Moreover, axonal degeneration or inflammation could predominate in different nerves, nerve segments, disease stages or patient's phenotypes. Thus, both methodological differences and the pathophysiological heterogeneity of ALS could explain the apparently contradictory results found in the nerve CSA of ALS patients,20 affecting its performance as biomarker.
Diagnostic biomarkerIn a previous smaller study,9 we found a reduction in the CSAmn in a cohort of recently diagnosed ALS patients compared to controls (cohort B). This result was replicated in the current study, where new patients in a more advanced disease stage and new controls were added (cohort A), and it is also consistent with previous results.17,18 However, all studies have shown considerable overlap between patients and healthy controls. Moreover, in this study, BMI was found to influence the CSAmn in both patients and controls, further limiting its use as a diagnostic biomarker. Despite this, it remains potentially useful to exclude inflammatory diseases such as multifocal motor neuropathy or chronic inflammatory demyelinating radiculoneuropathy, where nerve enlargements are commonly found.20 Furthermore, the combination of the CSA with other muscle parameters could increase their diagnostic accuracy9 and warrants further study.
Progression's biomarkerThe interaction of axonal damage and inflammation could explain the lack of correlation of the ultrasound CSA with several clinical variables (such as disease duration, progression rate, ALSFRS-R, or the strength of the APB and wrist flexors muscles) or biomarkers of axonal degeneration (such as FVC, electrophysiological measures or neurofilaments).6,9,16,17,19 Moreover, a previous longitudinal study found longitudinal changes in the CSA of the ulnar nerve in ALS patients, but failed to detect it in the median nerve. However, in that study, the median nerve had been assessed distally.27
In our study we also failed to find association of the CSAmn with the disease duration, ALSFRS-R, or the progression's rate. Nevertheless, we found indications of an association with MRCflex, with the multivariable analysis showing a 90% probability of increasing MRCflex being associated with increasing CSAmn (Fig. 3). This suggests that the proximal CSAmn could serve as a progression biomarker. Although our study included patients in different disease stages, its role as progression biomarker should be assessed in longitudinal studies using hand dynamometry, which would probably provide more reliable measurements than MRC.
Prognostic biomarkerUp to now, several biomarkers of peripheral axonal loss (such as neurofilaments, CMAP of the median nerve or the decrease of motor unit number, as measured by MUNE or MUNIX) have been suggested as prognostic biomarkers.28–30
However, the role of inflammation in ALS is increasingly recognised1 and biomarkers of CNS inflammation have also shown a prognostic role.31 As mentioned above, in the peripheral nervous system there is also histopathological evidence of nerve inflammation in ALS. Moreover, it has been hypothesised that, at least in a subset of ALS patients, nerve inflammation could predominate.26 Accordingly, MRI signs of nerve inflammation (enlargement, T2 hyperintensities and gadolinium enhancements) have also been frequently found in ALS patients.20 Furthermore, increased T2 signal intensity of nerve roots correlated moderately with the upper-limb MRC progression rate,32 also suggesting a damaging role of nerve inflammation.
This study, for the first time, suggests that an imaging peripheral nerve biomarker (CSAmn) predicts tracheostomy-free survival in ALS patients, independently from other stablished prognostic factors such as age, BMI, disease progression rate, site of onset and diagnostic delay.33 Intriguingly, larger CSAmn associated to worse survival, but with a relatively low hazard ratio and only when the progression rate was included in the model. This might be a consequence of the heterogeneity of our sample, which can be controlled with the inclusion of covariables, or the result of the contradictory effects of nerve inflammation and axonal damage in the CSAmn. Specifically, it is possible that, when studied alone, the CSAmn shows no prognostic value. However, if a measure of axonal degeneration (such as the progression rate) is included in the model, the CSAmn could eventually capture the effect of inflammation. Namely, if CSAmn measures both nerve inflammation and axonal degeneration, which have contradictory effects on CSAmn, it could act as an independent prognostic biomarker only when accounted for the axonal damage.
Larger studies assessing nerve CSA together with neuroinflammatory (e.g., chitinase) and axonal damage (e.g., neurofilaments, CMAPs or MUNIX) biomarkers are warranted to confirm these results and clarify the relationship between neuroinflammation and axonal degeneration.
Strengths and limitationsThis study has some limitations: the inclusion of two different cohorts and the clinical heterogeneity of the sample, which may difficult the interpretation of the results; and the lack of objective measurements of axonal damage (such as nerve conduction studies) or of neuroinflammation biomarkers (such as cytokines). The recruitment of a large sample size and the use of multivariable models were intended to account for some of these limitations. However, our results should be taken with caution until replication studies are available.
In conclusion, the CSAmn is an easy to assess biomarker that seems reliable and reproducible. Despite its limitations as a diagnostic biomarker, our data suggest that CSAmn could be useful as a progression and prognostic biomarker. Before its incorporation to clinical trials or clinical practice, longitudinal studies of nerve CSA, together with other promising biomarkers of neuroinflammation and axonal damage, are warranted.
Conflict of interestAuthors declare that the research was conducted in the absence of any commercial or financial relationships that could be construed as a potential conflict of interest.
The following are the supplementary data to this article: