


Parkinson's disease (PD) is the one of the most common neurodegenerative diseases. Many investigators have confirmed the possibility of using circulating miRNAs to diagnose PD. However, the results were inconsistent. Therefore, the aim of this meta-analysis was to systematically evaluate the diagnostic accuracy of circulating miRNAs in the diagnosis of PD.
MethodsWe carefully searched PubMed, Embase, Web of Science, Cochrane Library, Wanfang database and China National Knowledge Infrastructure for relevant studies (up to January 1, 2022) based on PRISMA statement. The pooled sensitivity, specificity, positive likelihood ratio (PLR), negative likelihood ratio (NLR), the diagnostic odds ratio (DOR), and area under the curve (AUC) were calculated to test the diagnostic accuracy. Furthermore, subgroup analyses were performed to identify the potential sources of heterogeneity, and the Deeks’ funnel plot asymmetry test was used to evaluate the potential publication bias.
ResultsForty-four eligible studies from 16 articles (3298 PD patients and 2529 healthy controls) were included in the current meta-analysis. The pooled sensitivity was 0.79 (95% CI: 0.76–0.81), specificity was 0.82 (95% CI: 0.78–0.84), PLR was 4.3 (95% CI: 3.6–5.0), NLR was 0.26 (95% CI: 0.23–0.30), DOR was 16 (95% CI: 13–21), and AUC was 0.87 (95% CI: 0.84–0.90). Subgroup analysis suggested that miRNA cluster showed a better diagnostic accuracy than miRNA simple. Moreover, there was no significant publication bias.
ConclusionsCirculating miRNAs have great potential as novel non-invasive biomarkers for PD diagnosis.
La enfermedad de Parkinson (EP) es una de las enfermedades neurodegenerativas más comunes. Muchos investigadores han confirmado la posibilidad de utilizar micro-ARN circulantes para diagnosticar la EP. Sin embargo, los resultados fueron inconsistentes. Por lo tanto, el objetivo de este metaanálisis fue evaluar sistemáticamente la precisión diagnóstica de los mi-ARN circulantes en el diagnóstico de la EP.
MétodosRealizamos una búsqueda minuciosa en PubMed, Embase, Web of Science, Cochrane Library, Wanfang database y China National Knowledge Infrastructure para identificar los estudios relevantes (actualizado hasta el 1 de enero del 2022) basados en la declaración PRISMA. Se calcularon la sensibilidad, la especificidad, la razón de probabilidad positiva (PLR), la razón de probabilidad negativa (NLR), la razón de probabilidades de diagnóstico (DOR) y el área bajo la curva (AUC) combinadas para evaluar la precisión diagnóstica. Además, se realizaron análisis de subgrupos para identificar las posibles fuentes de heterogeneidad y la prueba de asimetría del gráfico en embudo de Deek para evaluar el posible sesgo de publicación.
ResultadosEn el metaanálisis actual se incluyeron 44 estudios elegibles de 16 artículos (3.298 pacientes con EP y 2.529 controles sanos). La sensibilidad agrupada fue 0,79 (IC del 95%: 0,76-0,81), la especificidad fue 0,82 (IC del 95%: 0,78-0,84), PLR fue 4,3 (IC del 95%: 3,6-5,0), NLR fue 0,26 (IC del 95%: 0,23 -0,30), DOR fue 16 (IC del 95%: 13-21) y AUC fue 0,87 (IC del 95%: 0,84-0,90). El análisis de subgrupos sugirió que el micro-ARN clúster mostró una mejor precisión diagnóstica que el micro-ARN simple. Además, no hubo sesgo de publicación significativa.
ConclusionesLos micro-ARN circulantes tienen un gran potencial como nuevos biomarcadores no invasivos para el diagnóstico de la EP.
Parkinson's disease (PD) is the one of the most common neurodegenerative diseases, with a prevalence close to 1% in people over the age of 60.1 With the aging of the population, the incidence of PD patients is increasing. PD is a chronic progressive disease caused by the degeneration and severe loss of dopaminergic neurons in the in the substantia nigra pars compacta.2 Its onset involves the combination of genetic and high-risk environmental factors.2 The most prominent clinical feature is motor dysfunction, including rigidity, resting tremor, bradykinesia, and postural instability.3 The clinical diagnosis of PD mainly depends on clinical manifestations and neurological examination. However, clinical symptoms and signs may vary from patient to patient and may overlap with other neurodegenerative diseases, so PD diagnosis remains a great challenge. The main reason for the difficulty of PD diagnosis is the complex pathogenesis, such as oxidative stress, neurotrophic factor deficiency, excitotoxicity, mitochondrial dysfunction, gene mutation, immune dysregulation and apoptosis.4 Although imaging methods can aid in the clinical diagnosis of PD and the unified Parkinson's Hoehn-Yahr scale can help assess PD severity,5 but PD is highly heterogeneous, so there is still a lack of objective laboratory diagnostic methods. Therefore, we urgently need to find PD-related biomarkers to make up for the deficiencies of existing diagnostic methods.
MicroRNAs (miRNAs) are endogenous small non-coding RNAs consisting of about 21–25 nucleotides in length, which regulate gene expression at the post-transcriptional level by targeting mRNAs.6 MiRNAs are widely present in eukaryotes, and are involved in regulating many cells physiological and pathological pathways.6 MiRNAs are differentially expressed spatially and temporally in different brain regions and cell types.7 Growing evidence suggests that aberrant expression of various miRNAs plays a crucial role in neurodegenerative disorders, as they are actively secreted as messengers and are deeply involved in fine-tuning developmental and differentiation processes.8 In recent years, miRNAs have gradually become promising PD biomarkers because they are very stable, tissue-rich and minimally invasive, as well as they can cross the blood-brain barrier.9
Since then, many investigators have further confirmed the possibility of using circulating miRNAs to diagnose PD. Chen et al.10 found that miR-4639-5p can be used as a high-efficiency diagnostic biomarker for PD with a sensitivity (SEN) of 94% and a specificity (SPE) of 85%. Li et al.11 proposed that miR-494 showed low diagnostic efficiency with a sensitivity of 61% and a specificity of 79%. However, the combination of miR-124 and miR-494 showed high diagnostic value for distinguishing PD patients from healthy individuals, with a sensitivity of 86% and a specificity of 85%.11 We found inconsistent results on the diagnostic accuracy of circulating miRNAs for PD patients, which may be caused by study design, clinical sample size, differences in race and detection method standards. Therefore, the aim of this meta-analysis was to systematically evaluate the diagnostic accuracy of circulating miRNAs in the diagnosis of PD.
Materials and methodsSearch strategy and study selectionWe carefully searched PubMed, Embase, Web of Science, Cochrane Library, Wanfang database and China National Knowledge Infrastructure for relevant studies (up to January 1, 2022) based on PRISMA statement.12 Medical subject headlines (MeSH) and keywords includes the following: (“Parkinson Disease” OR “Parkinson's Disease” OR “Parkinsonism”) AND (“microRNA” OR “microRNAs” OR “miRNA” OR “miRNAs” OR “miR” OR “miRs”). There were no restrictions on the language of the publication. Besides, we also manually searched the references listed in the original article and the retrieved review articles to improve the comprehensiveness of the article retrieval.
Inclusion and exclusion criteriaAll eligible studies must meet the following inclusion criteria: (1) the studies were focused on the diagnostic capacity of miRNA for PD; (2) PD patients were diagnosed based on the United Kingdom Parkinson Disease Society Brain Bank criteria,13 the International Parkinson and Movement Disorder Society's European Section and the European Federation of Neurological Societies14; (3) healthy individuals were employed as the controls; (4) the miRNA obtained is limited to blood-based specimens (serum or plasma); (5) the studies provided complete data on sample size, sensitivity, and specificity to calculate the value of true positive (TP), false positive (FP), false negative (FN), and true negative (TN). In contrast, the exclusion criteria were as follows: (1) the studies were not conducted on humans; (2) miRNAs obtained from cell lines, brain tissue or cerebrospinal fluid; (3) the studies lacked complete data; (4) the duplicate articles; (5) reviews, conference abstracts, comments or letters to the editors; and (6) systematic reviews or meta-analysis.
Data extraction and quality assessmentThe following data were extracted from each eligible study by two independent investigators: the first author, year of publication, country, miRNAs categories, regulation mode, sample size, specimen, sensitivity, specificity, and area under the curve (AUC). The quality assessment of the included studies was performed using the Quality Assessment of Diagnostic Accuracy Studies (QUADAS-2) tool15 in Review Manager 5.3. When encountering a disagreement, negotiate and resolve with the third author, and finally reached a consensus.
Statistical analysisWe extracted the values of TP, FP, FN, and TN of each eligible study to summarize the pooled sensitivity, specificity, positive likelihood ratio (PLR), negative likelihood ratio (NLR), the diagnostic odds ratio (DOR), and their corresponding their 95% confidence intervals (CI). At the same time, the summary receiver operating characteristic (SROC) curve were generated and then calculated the AUC to test the summary diagnostic accuracy of miRNA. The value of AUC ranges from 0 to 1 with higher value representing better diagnostic accuracy: AUC=1.00 is perfect, AUC>0.90 is excellent, AUC=0.80–0.90 is good, and AUC<0.80 is medium.16 The heterogeneity was estimated by Higgins's inconsistency index (I2) test, it indicated the existence of significant heterogeneity if I2>50%, and then a random-effects model would be used. Furthermore, we performed a subgroup analysis to identify the potential sources of heterogeneity between studies. Finally, the Deeks’ funnel plot asymmetry test was used to evaluate the potential publication bias, and the bias was considered significant when p<0.05. Stata version 15.1 software were used for statistical analysis.
ResultsLiterature searchThe literature retrieval process was shown in a flow diagram in Fig. 1. We identified 3401 articles through a literature search in PubMed (n=803), Embase (n=1737), Web of Science (n=534), Cochrane Library (n=3), Wan-fang database (n=175), and China National Knowledge Infrastructure (n=149). Among them, 671 duplicate records were excluded. We excluded 2662 studies after reading the titles and abstracts for the following reasons: irrelevant studies (n=1847); not human studies (n=641), review or letters (n=173). We further excluded 52 studies after reviewing the full text due to lacking of sufficient data (n=37) or not a case-control study (n=15). Ultimately, 44 eligible studies from 16 articles10,11,17–30 were included in the current meta-analysis.
Study characteristics and quality assessment
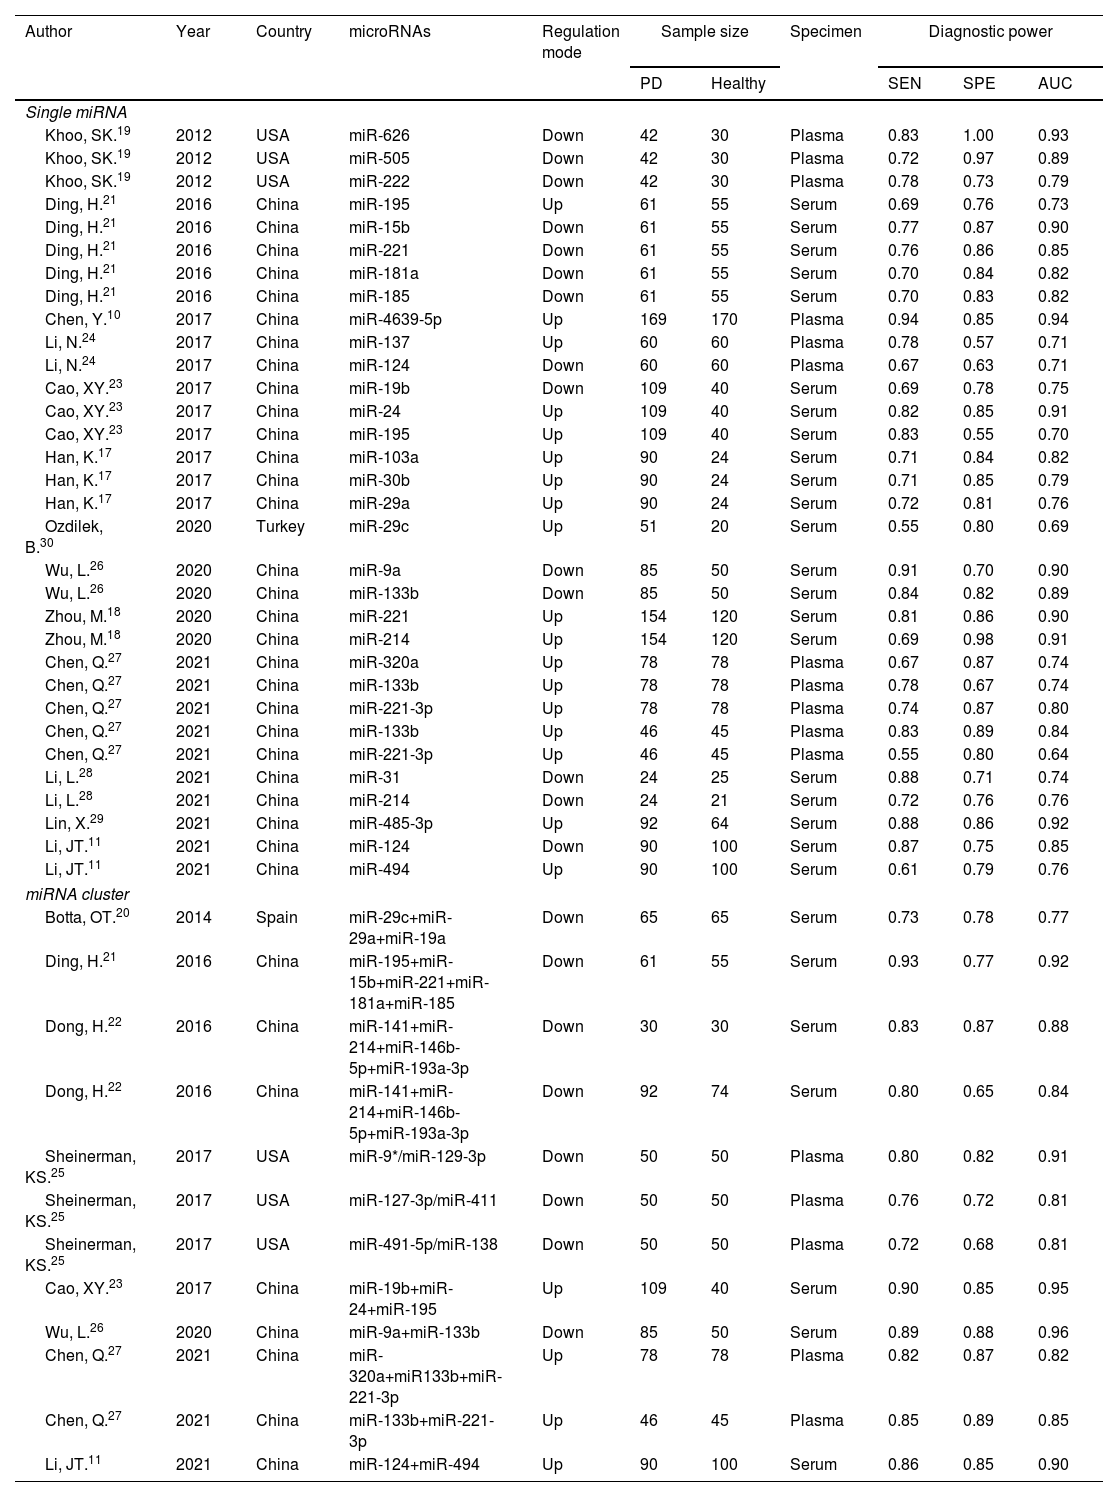
The principal characteristics of 44 included studies (ranging from 2012 to 2021), which included 3298 PD patients and 2529 healthy controls were outlined in Table 1. Among them, 32 studies discussed a single miRNA, and 12 studies reported miRNA clusters. The selected studies used the real-time quantitative reverse transcription PCR (qRT-PCR) to detect miRNA expression levels in serum (n=28) and plasma (n=16) specimens. Of the 44 studies, 36 studies were focused on Asian populations, and the remaining 8 studies conducted with Caucasian populations. The quality assessments of the included articles were evaluated based on QUADAS-2 tool summarized in Fig. 2.
Principal characteristics of the included articles.
| Author | Year | Country | microRNAs | Regulation mode | Sample size | Specimen | Diagnostic power | |||
|---|---|---|---|---|---|---|---|---|---|---|
| PD | Healthy | SEN | SPE | AUC | ||||||
| Single miRNA | ||||||||||
| Khoo, SK.19 | 2012 | USA | miR-626 | Down | 42 | 30 | Plasma | 0.83 | 1.00 | 0.93 |
| Khoo, SK.19 | 2012 | USA | miR-505 | Down | 42 | 30 | Plasma | 0.72 | 0.97 | 0.89 |
| Khoo, SK.19 | 2012 | USA | miR-222 | Down | 42 | 30 | Plasma | 0.78 | 0.73 | 0.79 |
| Ding, H.21 | 2016 | China | miR-195 | Up | 61 | 55 | Serum | 0.69 | 0.76 | 0.73 |
| Ding, H.21 | 2016 | China | miR-15b | Down | 61 | 55 | Serum | 0.77 | 0.87 | 0.90 |
| Ding, H.21 | 2016 | China | miR-221 | Down | 61 | 55 | Serum | 0.76 | 0.86 | 0.85 |
| Ding, H.21 | 2016 | China | miR-181a | Down | 61 | 55 | Serum | 0.70 | 0.84 | 0.82 |
| Ding, H.21 | 2016 | China | miR-185 | Down | 61 | 55 | Serum | 0.70 | 0.83 | 0.82 |
| Chen, Y.10 | 2017 | China | miR-4639-5p | Up | 169 | 170 | Plasma | 0.94 | 0.85 | 0.94 |
| Li, N.24 | 2017 | China | miR-137 | Up | 60 | 60 | Plasma | 0.78 | 0.57 | 0.71 |
| Li, N.24 | 2017 | China | miR-124 | Down | 60 | 60 | Plasma | 0.67 | 0.63 | 0.71 |
| Cao, XY.23 | 2017 | China | miR-19b | Down | 109 | 40 | Serum | 0.69 | 0.78 | 0.75 |
| Cao, XY.23 | 2017 | China | miR-24 | Up | 109 | 40 | Serum | 0.82 | 0.85 | 0.91 |
| Cao, XY.23 | 2017 | China | miR-195 | Up | 109 | 40 | Serum | 0.83 | 0.55 | 0.70 |
| Han, K.17 | 2017 | China | miR-103a | Up | 90 | 24 | Serum | 0.71 | 0.84 | 0.82 |
| Han, K.17 | 2017 | China | miR-30b | Up | 90 | 24 | Serum | 0.71 | 0.85 | 0.79 |
| Han, K.17 | 2017 | China | miR-29a | Up | 90 | 24 | Serum | 0.72 | 0.81 | 0.76 |
| Ozdilek, B.30 | 2020 | Turkey | miR-29c | Up | 51 | 20 | Serum | 0.55 | 0.80 | 0.69 |
| Wu, L.26 | 2020 | China | miR-9a | Down | 85 | 50 | Serum | 0.91 | 0.70 | 0.90 |
| Wu, L.26 | 2020 | China | miR-133b | Down | 85 | 50 | Serum | 0.84 | 0.82 | 0.89 |
| Zhou, M.18 | 2020 | China | miR-221 | Up | 154 | 120 | Serum | 0.81 | 0.86 | 0.90 |
| Zhou, M.18 | 2020 | China | miR-214 | Up | 154 | 120 | Serum | 0.69 | 0.98 | 0.91 |
| Chen, Q.27 | 2021 | China | miR-320a | Up | 78 | 78 | Plasma | 0.67 | 0.87 | 0.74 |
| Chen, Q.27 | 2021 | China | miR-133b | Up | 78 | 78 | Plasma | 0.78 | 0.67 | 0.74 |
| Chen, Q.27 | 2021 | China | miR-221-3p | Up | 78 | 78 | Plasma | 0.74 | 0.87 | 0.80 |
| Chen, Q.27 | 2021 | China | miR-133b | Up | 46 | 45 | Plasma | 0.83 | 0.89 | 0.84 |
| Chen, Q.27 | 2021 | China | miR-221-3p | Up | 46 | 45 | Plasma | 0.55 | 0.80 | 0.64 |
| Li, L.28 | 2021 | China | miR-31 | Down | 24 | 25 | Serum | 0.88 | 0.71 | 0.74 |
| Li, L.28 | 2021 | China | miR-214 | Down | 24 | 21 | Serum | 0.72 | 0.76 | 0.76 |
| Lin, X.29 | 2021 | China | miR-485-3p | Up | 92 | 64 | Serum | 0.88 | 0.86 | 0.92 |
| Li, JT.11 | 2021 | China | miR-124 | Down | 90 | 100 | Serum | 0.87 | 0.75 | 0.85 |
| Li, JT.11 | 2021 | China | miR-494 | Up | 90 | 100 | Serum | 0.61 | 0.79 | 0.76 |
| miRNA cluster | ||||||||||
| Botta, OT.20 | 2014 | Spain | miR-29c+miR-29a+miR-19a | Down | 65 | 65 | Serum | 0.73 | 0.78 | 0.77 |
| Ding, H.21 | 2016 | China | miR-195+miR-15b+miR-221+miR-181a+miR-185 | Down | 61 | 55 | Serum | 0.93 | 0.77 | 0.92 |
| Dong, H.22 | 2016 | China | miR-141+miR-214+miR-146b-5p+miR-193a-3p | Down | 30 | 30 | Serum | 0.83 | 0.87 | 0.88 |
| Dong, H.22 | 2016 | China | miR-141+miR-214+miR-146b-5p+miR-193a-3p | Down | 92 | 74 | Serum | 0.80 | 0.65 | 0.84 |
| Sheinerman, KS.25 | 2017 | USA | miR-9*/miR-129-3p | Down | 50 | 50 | Plasma | 0.80 | 0.82 | 0.91 |
| Sheinerman, KS.25 | 2017 | USA | miR-127-3p/miR-411 | Down | 50 | 50 | Plasma | 0.76 | 0.72 | 0.81 |
| Sheinerman, KS.25 | 2017 | USA | miR-491-5p/miR-138 | Down | 50 | 50 | Plasma | 0.72 | 0.68 | 0.81 |
| Cao, XY.23 | 2017 | China | miR-19b+miR-24+miR-195 | Up | 109 | 40 | Serum | 0.90 | 0.85 | 0.95 |
| Wu, L.26 | 2020 | China | miR-9a+miR-133b | Down | 85 | 50 | Serum | 0.89 | 0.88 | 0.96 |
| Chen, Q.27 | 2021 | China | miR-320a+miR133b+miR-221-3p | Up | 78 | 78 | Plasma | 0.82 | 0.87 | 0.82 |
| Chen, Q.27 | 2021 | China | miR-133b+miR-221-3p | Up | 46 | 45 | Plasma | 0.85 | 0.89 | 0.85 |
| Li, JT.11 | 2021 | China | miR-124+miR-494 | Up | 90 | 100 | Serum | 0.86 | 0.85 | 0.90 |
Abbreviations: PD: Parkinson's disease; Up: upregulated; Down: downregulated; SEN: sensitivity; SPE: specificity; AUC: area under the curve.

The heterogeneity analysis was analyzed by forest plots, we found significant heterogeneity (I2=74.40% for sensitivity and I2=71.26% for specificity) between overall studies, and therefore the random effects model was applied. The pooled estimates of circulating miRNA on the diagnostic accuracy of PD were shown as follows in Fig. 3A and B: sensitivity, 0.79 (95% CI: 0.76–0.81); specificity, 0.82 (95% CI: 0.78–0.84); PLR, 4.3 (95% CI: 3.6–5.0); NLR, 0.26 (95% CI: 0.23–0.30); and DOR, 16 (95% CI: 13–21). The SROC curve was plotted with an AUC value of 0.87 (95% CI: 0.84–0.90), which showed that circulating miRNA had an outstanding diagnostic accuracy in distinguishing PD patients from healthy controls (Fig. 3C).
Subgroup analysis, specificity (B), AUC (C) and Funnel plot (D) of circulating miRNAs for diagnosing PD among overall studies.")
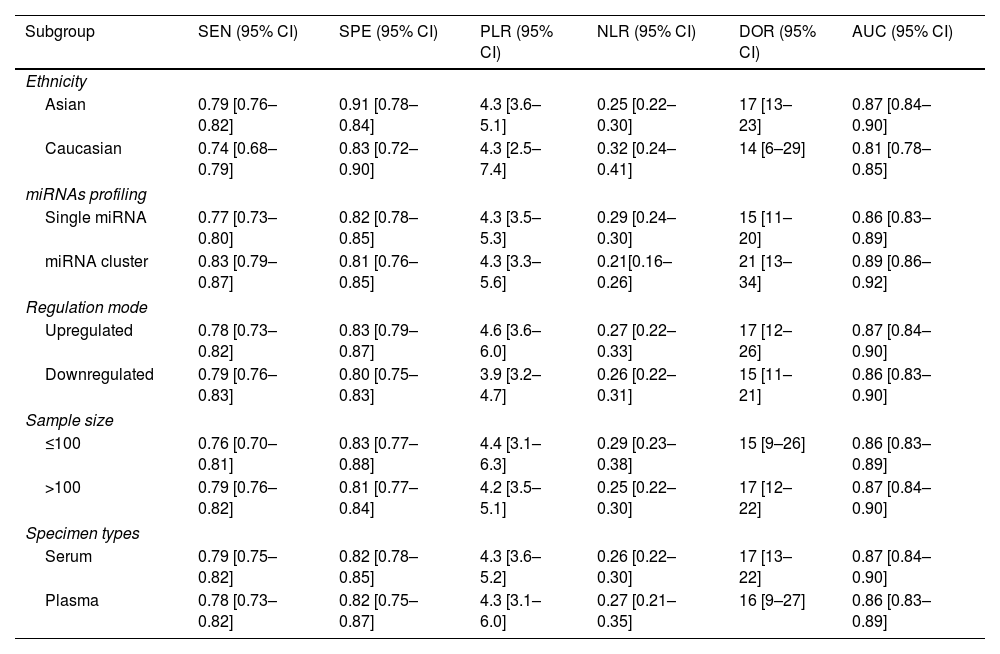
In order to explore possible source of heterogeneity between studies, we performed a subgroup analysis based on ethnicity, miRNA profiling, regulation mode, sample size, and specimen types. Compared with miRNA simple, miRNA cluster showed a better diagnostic accuracy, with a sensitivity (0.83 vs. 0.77), specificity (0.81 vs. 0.82), PLR (4.3 vs. 4.3), NLR (0.21 vs. 0.29), DOR (21 vs. 15), and AUC (0.89 vs. 0.86). Moreover, the studies with Asian population yield a higher diagnostic value than Caucasian: sensitivity (0.79 vs. 0.74), specificity (0.91 vs. 0.83), PLR (4.3 vs. 4.3), NLR (0.25 vs. 0.32), DOR (17 vs. 14), and AUC (0.87 vs. 0.81). Furthermore, the studies with a sample size greater than 100, the up-regulated miRNA and serum types showed slightly better diagnostic value. The results of subgroup analysis are shown in Table 2.
Summary estimates of diagnostic power and their 95% confidence intervals.
| Subgroup | SEN (95% CI) | SPE (95% CI) | PLR (95% CI) | NLR (95% CI) | DOR (95% CI) | AUC (95% CI) |
|---|---|---|---|---|---|---|
| Ethnicity | ||||||
| Asian | 0.79 [0.76–0.82] | 0.91 [0.78–0.84] | 4.3 [3.6–5.1] | 0.25 [0.22–0.30] | 17 [13–23] | 0.87 [0.84–0.90] |
| Caucasian | 0.74 [0.68–0.79] | 0.83 [0.72–0.90] | 4.3 [2.5–7.4] | 0.32 [0.24–0.41] | 14 [6–29] | 0.81 [0.78–0.85] |
| miRNAs profiling | ||||||
| Single miRNA | 0.77 [0.73–0.80] | 0.82 [0.78–0.85] | 4.3 [3.5–5.3] | 0.29 [0.24–0.30] | 15 [11–20] | 0.86 [0.83–0.89] |
| miRNA cluster | 0.83 [0.79–0.87] | 0.81 [0.76–0.85] | 4.3 [3.3–5.6] | 0.21[0.16–0.26] | 21 [13–34] | 0.89 [0.86–0.92] |
| Regulation mode | ||||||
| Upregulated | 0.78 [0.73–0.82] | 0.83 [0.79–0.87] | 4.6 [3.6–6.0] | 0.27 [0.22–0.33] | 17 [12–26] | 0.87 [0.84–0.90] |
| Downregulated | 0.79 [0.76–0.83] | 0.80 [0.75–0.83] | 3.9 [3.2–4.7] | 0.26 [0.22–0.31] | 15 [11–21] | 0.86 [0.83–0.90] |
| Sample size | ||||||
| ≤100 | 0.76 [0.70–0.81] | 0.83 [0.77–0.88] | 4.4 [3.1–6.3] | 0.29 [0.23–0.38] | 15 [9–26] | 0.86 [0.83–0.89] |
| >100 | 0.79 [0.76–0.82] | 0.81 [0.77–0.84] | 4.2 [3.5–5.1] | 0.25 [0.22–0.30] | 17 [12–22] | 0.87 [0.84–0.90] |
| Specimen types | ||||||
| Serum | 0.79 [0.75–0.82] | 0.82 [0.78–0.85] | 4.3 [3.6–5.2] | 0.26 [0.22–0.30] | 17 [13–22] | 0.87 [0.84–0.90] |
| Plasma | 0.78 [0.73–0.82] | 0.82 [0.75–0.87] | 4.3 [3.1–6.0] | 0.27 [0.21–0.35] | 16 [9–27] | 0.86 [0.83–0.89] |
Abbreviations: SEN: sensitivity; SPE: specificity; PLR: positive likelihood ratios; NLR: negative likelihood ratios; DOR: diagnostic odds ratio; AUC: area under the curve; CI: confidence interval.
The potential publication bias was assessed by the Deeks’ funnel plot asymmetry test. The pooled Deeks’ test result of the included studies was p=0.13 (Fig. 3D), which showed that there was no significant publication bias.
DiscussionParkinson's disease is a chronic, debilitating neurodegenerative disease that affects more than 6 million people worldwide.31 Parkinson's disease is one of the main causes of neurological dysfunction, and it also brings a huge socioeconomic burden.32 At present, the diagnosis of PD is mainly based on neurological examination and neuroimaging, however, both of these examination standards are subjective and lacking in sensitivity.21 Therefore, PD-related biomarkers are urgently needed to improve clinical diagnosis. Many studies have suggested that circulating miRNAs have the potential to be valuable biomarkers of PD. However, the accuracy of miRNAs is inconsistent between studies.10,18,19,23,30 Therefore, we performed the current meta-analysis to assess the diagnostic value of circulating miRNAs for PD diagnosis.
In this meta-analysis, we comprehensively searched databases and analyzed 44 studies on the diagnostic accuracy of circulating miRNAs for PD. Our findings show that the use of miRNAs as potential biomarkers can effectively differentiate PD from healthy individuals, the overall pooled sensitivity and specificity was 0.79 (95% CI: 0.76–0.81) and 0.82 (95% CI: 0.78–0.84), respectively. In addition, the AUC to assess the overall diagnostic accuracy was 0.87, indicating that miRNAs are promising and accurate biomarkers for PD. Furthermore, the pooled DOR, PLR and NLR were 16 (95% CI: 13–21), 4.3 (95% CI: 3.6–5.0) and 0.26 (95% CI: 0.23–0.30), respectively. The results suggested that the chance of a correct diagnosis of PD was 16 times higher than a false-negative diagnosis of healthy people. However, the values of PLR and NLR were less satisfactory compared with clinical high reference standards (PLR>10, NLR<0.1) and did not meet the general criteria for adjudication or exclusion decisions.33
Subsequently, we performed subgroup analysis to explore the main sources of heterogeneity. We found that miRNA clusters showed better diagnostic accuracy than single miRNA: sensitivity (0.83 vs. 0.77), specificity (0.81 vs. 0.82), PLR (4.3 vs. 4.3), NLR (0.21 vs. 0.29), DOR (21 vs. 15) and AUC (0.89 vs. 0.86). A single miRNA is not only differentially expressed in PD, but also in other neurological diseases. However, miRNA clusters have more complex molecular regulatory mechanisms and pathway networks, which may be helpful to increase the credibility of PD diagnosis.34 In addition, miRNAs showed greater accuracy for PD diagnosis in Asian populations than in Caucasians: sensitivity (0.79 vs. 0.74), specificity (0.91 vs. 0.83), PLR (4.3 vs. 4.3), NLR (0.25 vs. 0.32), DOR (17 vs. 14) and AUC (0.81 vs. 0.83). In recent years, studies evaluating the value of miRNAs for the diagnosis of PD in Asian populations have increased significantly, and the unequal number of studies by ethnicity may lead to disparities in results. Therefore, multi-center studies are needed to validate our findings in the future. Furthermore, regulation mode, sample size, and specimen type showed similar diagnostic efficacies in our findings, which had no significantly influence on the PD diagnosis.
This is the first meta-analysis to evaluate the diagnostic value of circulating miRNAs for PD, which including the current latest research. We have made every effort to avoid publication bias, there are still some limitations in our meta-analysis. First, although we conducted a rigorous and comprehensive screening of the literature according to the inclusion and exclusion criteria, some relevant articles may still be missed. Second, due to different standards and limited research data, we did not extract cut-off values, which may lead to inconsistent conclusions. Third, the control group consisted of healthy individuals, so the ability of miRNAs to distinguish PD from other parkinsonism remains unclear. Forth, the diagnostic ability of miRNAs in PD patients with different phenotypes or different stages is still unclear. Finally, the diagnostic value of circulating miRNAs for PD has only been reported in Chinese, American, Turkish, and Spanish populations. The diagnostic accuracy of miRNAs for PD populations in other countries is unclear.
ConclusionIn conclusion, this meta-analysis suggests that circulating miRNAs have great potential as novel non-invasive biomarkers for PD diagnosis. In addition, the results suggest that the miRNA clusters had better diagnostic accuracy for the PD diagnosis. In the future, more high-quality studies are required to further validate our conclusions.
Authors’ contributionsSSG: prepared the study design; WTZ and YJW: conducted the literature search, data acquisition and analysis; WTZ, YFY, GXZ and YNZ provided guidance and technical assistance in data acquisition and analysis; WTZ: drafted the manuscript; SSG: revised the manuscript. All authors read and approved the final version to be published.
Ethics statementOur study did not require an ethical board approval because it is a meta-analysis and it did not contain human or animal trials.
FundingThe author(s) received no financial support for the research, authorship, and/or publication of this article.
Conflict of interestThe author(s) declared no potential conflicts of interest with respect to the research, authorship, and/or publication of this article.