


We sought to measure the effect of controlling body fat indexes on decreasing the incidence of type 2 diabetes mellitus (T2DM) mathematically.
MethodsStudy samples were selected from a well-established cohort in Suzhou, China between 2004 and 2008, comprising 6364 males and 9678 females. The questionnaire contained socio-demographic characteristics, smoking, alcohol consumption, diet, physical activity, personal and family medical history and current medication. Multiple linear regression, Cox regression and mediation analyses were performed to determine the relationship among age, body fat indexes and T2DM onset.
ResultsAll the three body fat indexes [the body mass index (BMI), waist-to-hip ratio (WHR) and body fat percentage] showed a significant positive association (P<0.05) with age and T2DM. Significant indirect effects (IE) were detected for age, which were mediated respectively through WHR [IE=1.10, 95%CI: 1.07–1.13; P<0.001], the BMI (IE=1.15, 95%CI: 1.11–1.18; P<0.001), and body fat percentage (IE=1.09, 95%CI: 1.07–1.12; P<0.001). The combined body fat index score demonstrated a significant association with age (P<0.001) and a stronger relationship with the onset of diabetes (P<0.001) along with a significant mediating effect (IE=1.17; 95%CI: 1.13–1.22; P<0.001). The total effect of age on T2DM was 1.60 (95%CI: 1.21–2.10; P=0.0008). As a result, the three body fat indexes jointly mediated 33.97% of the age impact on diabetes onset.
ConclusionsThis pilot study revealed important roles for body fat indexes in mediating the age pathway to the onset of diabetes. Controling body fat in the appropriate range could reduce 33.97% of the risk of T2DM onset with increasing age.
Medir matemáticamente el efecto del control de los índices de grasa corporal en la reducción de la incidencia de diabetes mellitus del tipo 2 (DMT2).
MétodosSe obtuvieron durante 2004-2008 muestras para estudio de una cohorte bien establecida de Suzhou, China, formada por 6.364 varones y 9.678 mujeres. Mediante un cuestionario se recogieron los datos de las características sociodemográficas, el tabaquismo, el consumo de alcohol, la dieta, la actividad física, los antecedentes médicos personales y familiares y la medicación en curso. Se realizaron regresión lineal múltiple, regresión de Cox y análisis de mediación para determinar la relación entre edad, índices de grasa corporal y comienzo de la DMT2.
ResultadosSe halló una asociación positiva significativa (p<0,05) de 3 índices de grasa corporal (índice de masa corporal [IMC], índice cintura-cadera [ICC] y porcentaje de grasa corporal) con la edad y la DMT2. Se detectaron efectos causales indirectos (EI) significativos de la edad, mediados respectivamente por el ICC (EI: 1,10; IC al 95%: 1,07-1,13; p<0,001], el IMC (EI: 1,15; IC al 95%: 1,11-1,18; p<0,001) y el porcentaje de grasa corporal (EI: 1,09; IC al 95%: 1,07-1,12; p<0,001). La puntuación combinada de los índices de grasa corporal seguía mostrando una asociación significativa con la edad (p<0,001) y una relación más intensa con el comienzo de la diabetes (p<0,001), junto con un efecto mediador significativo (EI: 1,17; IC al 95%: 1,13-1,22; p<0,001). El efecto total de la edad en la DMT2 era 1,60 (IC: 1,21-2,10; p=0,0008). Como resultado, los 3 índices de grasa corporal fueron los mediadores del 33,97% de los efectos de la edad en el comienzo de la diabetes.
ConclusionesEste estudio piloto reveló las importantes funciones de los índices de grasa corporal como mediadores del efecto de la edad en la aparición de la diabetes. El control de la grasa corporal dentro de límites apropiados podría reducir el 33,97% de riesgo de comienzo de la DMT2 con el paso de la edad.
Diabetes is a chronic metabolic disorder disease. It occurs either when the body cannot effectively use the insulin it produces or when the pancreas does not produce enough insulin.1 Type 2 diabetes mellitus (T2DM) is one of the ten leading causes of death in the world.2 Its incidence is constantly increasing worldwide, especially in middle and low income countries.3 The global prevalence of diabetes among adults has risen from 4.7% in 1980 to 8.5% in 2014. In China, the estimated overall prevalence of total diabetes in 2013 was 10.9%, which was greater more than ten-fold compared with it in 1980.4–7 People living with T2DM have a higher risk of morbidity and mortality than the general population.8 In 2012, an estimated 1.5 million deaths were directly caused by diabetes and its complications globally.2,9 Its complications include blindness, diabetic foot, kidney failure and vascular complications such as stroke, heart attacks, lower limb amputation.10 Obvious, diabetes brings heavy burden both to the society and residents’ life.11,12 In April 2016, WHO published the Global report on diabetes, which calls for action to reduce exposure to the known risk factors for T2DM and to improve access to the quality of care for people with all forms of diabetes.13
The causes of T2DM are complex, but there are several confirmed risk factors, including a strong family history of diabetes mellitus, age, obesity and widespread lack of physical activity.3,14,15 However, whether they interact with or interfere each other and how they affect each other are not illuminated clearly. Rastegari et al. showed that there was a significant statistical positive association between age and WHR index, which provides us some clues.15 Now that anthropometric indices such as body mass index (BMI), waist-to-hip ratio (WHR) and body fat percentage are all considered for obesity evaluation,16 we may prevent T2DM by controlling anthropometric indices such as WHR while age is increasing. The present study aims to use mediation analysis to explore the relationship between age, anthropometric indices (including BMI, WHR and body fat percentage) and incidence of T2DM. Furthermore, we can measure the effect of controlling body fat indexes on decreasing the incidence of T2DM mathematically.
MethodsStudy populationStudy samples were selected from China Kadoorie Biobank (CKB) study, a well-established prospective cohort of Chinese adults during 2004–2008, as detailed previously.17–19 The current analysis selected individuals who were 30–44 years old from Suzhou. The participants should conform to the following criteria: hadn’t confirmed as a diabetes patient at baseline, and won’t be a diabetes patient during one half year after entering the cohort. As a result, a total of 365 participants were excluded, and 16,407 adults (6364 males and 9678 females) formed the sample for the current analysis.
Diabetes was defined either as a screen-detected diabetes or self-report of physician diagnosis of diabetes, as previously reported.20 Screen-detected diabetes was defined as no prior history of diabetes with a blood glucose level meeting any one of the following criteria, if applicable: (1) a fasting blood glucose level ≥7.0mmol/L; (2) a random blood glucose level ≥11.1mmol/L and a fasting time<8h; (3) a random blood glucose level ≥7.0mmol/L and a fasting time>8h.21
Ethical approval for the CKB study was obtained from the Ethical Review Committee of the Chinese Center for Disease Control and Prevention (Beijing, China) and the Oxford Tropical Research Ethics Committee, University of Oxford (UK). In addition, approvals were obtained from the institutional research boards at the local Center for Disease Control and Prevention in each of the ten survey sites. Finally, written informed consent was obtained from all participants.22 All methods were performed in accordance with the relevant guidelines and regulations.
Questionnaire surveyAt local study assessment clinics, participants completed an interviewer-administered laptop-based questionnaire on socio-demographic characteristics, smoking, alcohol consumption, diet, physical activity, personal and family medical history and current medication. A range of physical measurements were recorded by trained technicians, including height, weight, hip and waist circumference, bio-impedance, lung function, blood pressure and heart rate, using calibrated instruments with standard protocols.23
Age was classified into three levels: (1) 30–34 years old; (2) 35–39 years old; and (3) 40–44 years old. BMI was classified into four levels: (1) <18.5kg/m2; (2) 18.5–24.9kg/m2; (3) 25–29.9kg/m2; and (4) ≥30kg/m2. WHR was classified into two levels both in female and man: (1) ≤0.85 for female and ≤0.90 for man; (2) >0.85 for female and>0.90 for man. Body fat percentage was classified into three levels: (1) <26 for female and<18 for man; (2) 26–31 for female and 18–22 for man; (3) >31 for female and>22 for man. Education was classified into five levels: (1) illiterate; (2) elementary; (3) middle school; (4) high school; and (5) college and above. Total physical activity was converted into metabolic equivalent hours per day (MET-hours/day) spent on work, transportation, housework, non-sedentary recreation as described in our previous study.24 In the present analysis, participants were classified into three main drinking categories: (1) nondrinkers were defined as those who never or almost never drink during his/her lifetime; (2) ex regular drinkers or occasional drinkers, including drinkers who almost did not drink currently but drank weekly and lasted over one year and drinkers who drink currently but less than once a week; and (3) weekly drinkers as those who drink every week. For assessment of tobacco consumption, participants were classified into four main smoking categories: (1) never smokers as those who did not smoke currently and had smoked less than 100 cigarettes during his/her lifetime; (2) occasional smokers as those who do not smoke currently but had smoked occasionally in the past or those who currently smoke occasionally and had not smoked on most days or daily in the past, or had smoked at least 100 cigarettes during his/her lifetime; (3) ex-smokers were defined as those who currently do not smoke or only smoked occasionally but had smoked on most days or daily in the past; (4) regular smokers as those who currently smoke daily or on most days.22 Information on duration (years) of smoking and number of packs smoked per day was obtained for regular smokers, and pack-years was calculated as a measure of cumulative burden of smoking. Household income was classified into four levels: (1) <10,000 RMB; (2) 10,000–19,999 RMB; (3) 20,000–34,999 RMB; and (4) ≥35,000 RMB.
Statistical analysisCharacteristics of the study population are described by mean and standard deviation (SD) for continuous variables and frequency (%) for categorical variables. Multiple linear regression was performed on the relationship between age and the three body fat indexes. Cox regression was performed on the relationship between age and diabetes oncome. The mediating effects of three body fat indexes (BMI, WHR and body fat percentage), which were nominally significant in both models (P<0.05), were further evaluated for nature indirect effects (NIE) and nature direct effects (NDE) on the impact of age on diabetes oncome by VanderWeele's mediation approach25–27 as follows:
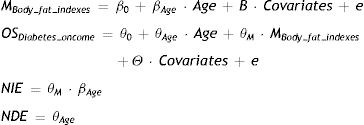
Mediating effect percentage (M%) means NIE as a percentage of total effect (TE), as follow:

To evaluate the joint effect of the three body fat indexes, the combined body fat indexes score (CFS) was calculated by the linear combination of the three body fat indexes weighted by the corresponding coefficients:
where the coefficients were estimated by the corresponding multivariate linear regression:

The combined body fat indexes score was analyzed against the association with age, diabetes oncome and its mediating effect accordingly. All models were adjusted for the gender, education level, smoking level, alcohol level, MET and family diabetes history.
All analyses were conducted using R version 3.4.3 (The R Foundation).
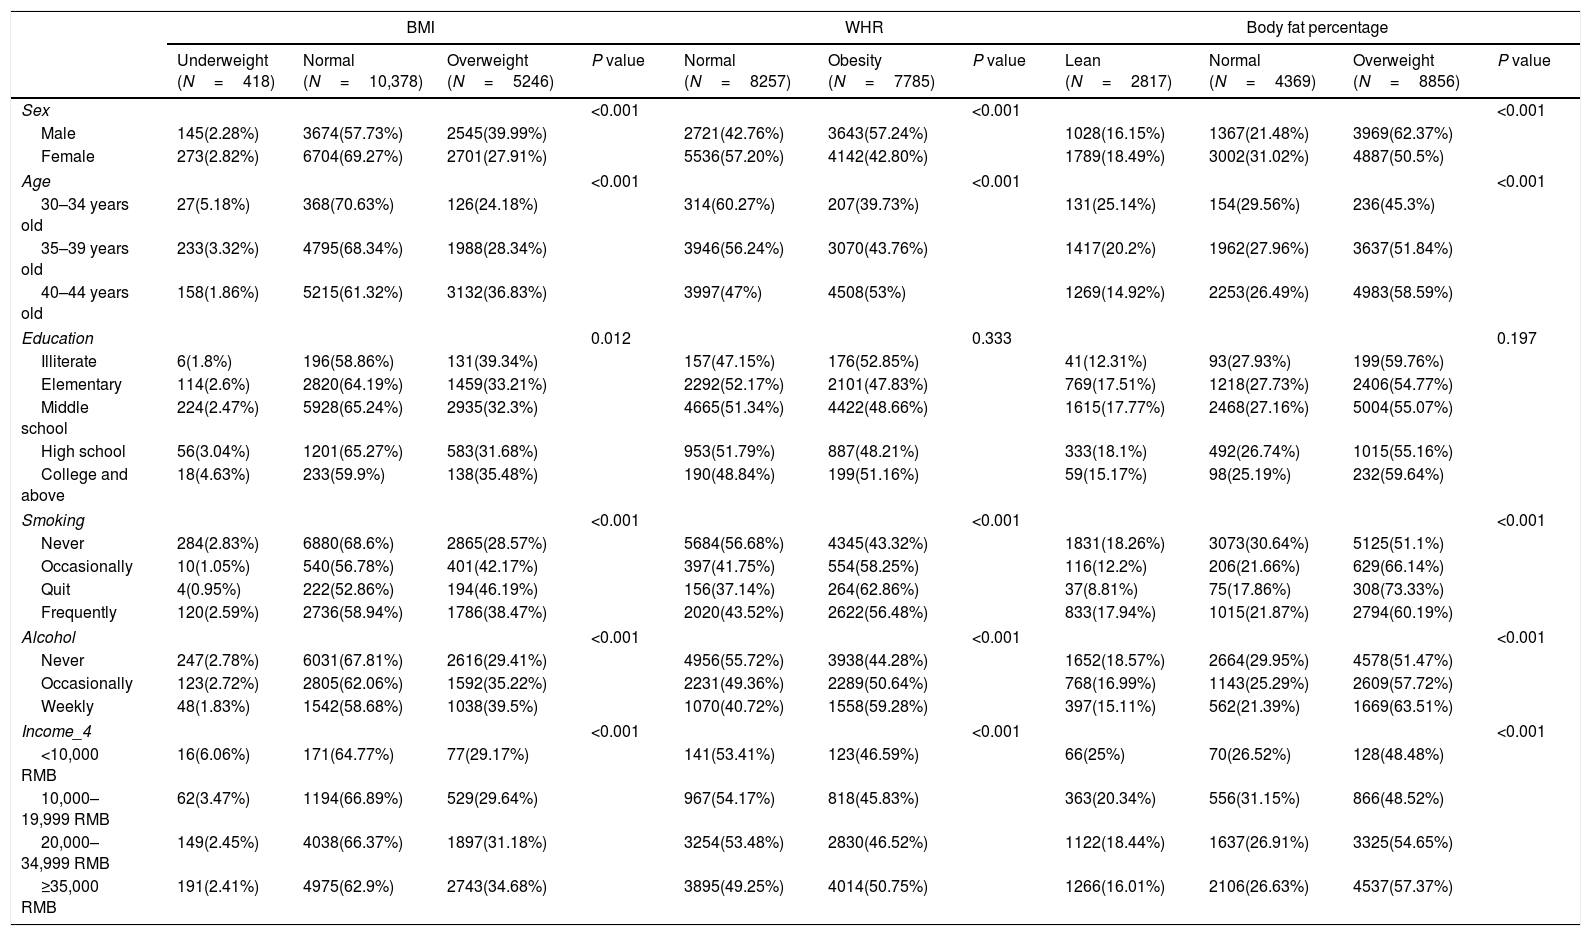
ResultsThe distribution of demographic characteristics among 16,407 samples was described in Table 1. For both males and females, most people had normal BMI and body fat percentage. But for WHR, 57.24% males were obese while only 42.80% females were observed obese. Significant differences were observed in age between different levels of the three body fat indexes respectively, other demographic characteristics as well. With age increasing, more people became overweight or had a higher WHR and body fat percentage. There were significant differences in education level between different BMI levels, but we didn’t figure out the significant differences between different WHR levels and body fat percentage levels.
Characteristics of study population.
| BMI | WHR | Body fat percentage | |||||||||
|---|---|---|---|---|---|---|---|---|---|---|---|
| Underweight (N=418) | Normal (N=10,378) | Overweight (N=5246) | P value | Normal (N=8257) | Obesity (N=7785) | P value | Lean (N=2817) | Normal (N=4369) | Overweight (N=8856) | P value | |
| Sex | <0.001 | <0.001 | <0.001 | ||||||||
| Male | 145(2.28%) | 3674(57.73%) | 2545(39.99%) | 2721(42.76%) | 3643(57.24%) | 1028(16.15%) | 1367(21.48%) | 3969(62.37%) | |||
| Female | 273(2.82%) | 6704(69.27%) | 2701(27.91%) | 5536(57.20%) | 4142(42.80%) | 1789(18.49%) | 3002(31.02%) | 4887(50.5%) | |||
| Age | <0.001 | <0.001 | <0.001 | ||||||||
| 30–34 years old | 27(5.18%) | 368(70.63%) | 126(24.18%) | 314(60.27%) | 207(39.73%) | 131(25.14%) | 154(29.56%) | 236(45.3%) | |||
| 35–39 years old | 233(3.32%) | 4795(68.34%) | 1988(28.34%) | 3946(56.24%) | 3070(43.76%) | 1417(20.2%) | 1962(27.96%) | 3637(51.84%) | |||
| 40–44 years old | 158(1.86%) | 5215(61.32%) | 3132(36.83%) | 3997(47%) | 4508(53%) | 1269(14.92%) | 2253(26.49%) | 4983(58.59%) | |||
| Education | 0.012 | 0.333 | 0.197 | ||||||||
| Illiterate | 6(1.8%) | 196(58.86%) | 131(39.34%) | 157(47.15%) | 176(52.85%) | 41(12.31%) | 93(27.93%) | 199(59.76%) | |||
| Elementary | 114(2.6%) | 2820(64.19%) | 1459(33.21%) | 2292(52.17%) | 2101(47.83%) | 769(17.51%) | 1218(27.73%) | 2406(54.77%) | |||
| Middle school | 224(2.47%) | 5928(65.24%) | 2935(32.3%) | 4665(51.34%) | 4422(48.66%) | 1615(17.77%) | 2468(27.16%) | 5004(55.07%) | |||
| High school | 56(3.04%) | 1201(65.27%) | 583(31.68%) | 953(51.79%) | 887(48.21%) | 333(18.1%) | 492(26.74%) | 1015(55.16%) | |||
| College and above | 18(4.63%) | 233(59.9%) | 138(35.48%) | 190(48.84%) | 199(51.16%) | 59(15.17%) | 98(25.19%) | 232(59.64%) | |||
| Smoking | <0.001 | <0.001 | <0.001 | ||||||||
| Never | 284(2.83%) | 6880(68.6%) | 2865(28.57%) | 5684(56.68%) | 4345(43.32%) | 1831(18.26%) | 3073(30.64%) | 5125(51.1%) | |||
| Occasionally | 10(1.05%) | 540(56.78%) | 401(42.17%) | 397(41.75%) | 554(58.25%) | 116(12.2%) | 206(21.66%) | 629(66.14%) | |||
| Quit | 4(0.95%) | 222(52.86%) | 194(46.19%) | 156(37.14%) | 264(62.86%) | 37(8.81%) | 75(17.86%) | 308(73.33%) | |||
| Frequently | 120(2.59%) | 2736(58.94%) | 1786(38.47%) | 2020(43.52%) | 2622(56.48%) | 833(17.94%) | 1015(21.87%) | 2794(60.19%) | |||
| Alcohol | <0.001 | <0.001 | <0.001 | ||||||||
| Never | 247(2.78%) | 6031(67.81%) | 2616(29.41%) | 4956(55.72%) | 3938(44.28%) | 1652(18.57%) | 2664(29.95%) | 4578(51.47%) | |||
| Occasionally | 123(2.72%) | 2805(62.06%) | 1592(35.22%) | 2231(49.36%) | 2289(50.64%) | 768(16.99%) | 1143(25.29%) | 2609(57.72%) | |||
| Weekly | 48(1.83%) | 1542(58.68%) | 1038(39.5%) | 1070(40.72%) | 1558(59.28%) | 397(15.11%) | 562(21.39%) | 1669(63.51%) | |||
| Income_4 | <0.001 | <0.001 | <0.001 | ||||||||
| <10,000 RMB | 16(6.06%) | 171(64.77%) | 77(29.17%) | 141(53.41%) | 123(46.59%) | 66(25%) | 70(26.52%) | 128(48.48%) | |||
| 10,000–19,999 RMB | 62(3.47%) | 1194(66.89%) | 529(29.64%) | 967(54.17%) | 818(45.83%) | 363(20.34%) | 556(31.15%) | 866(48.52%) | |||
| 20,000–34,999 RMB | 149(2.45%) | 4038(66.37%) | 1897(31.18%) | 3254(53.48%) | 2830(46.52%) | 1122(18.44%) | 1637(26.91%) | 3325(54.65%) | |||
| ≥35,000 RMB | 191(2.41%) | 4975(62.9%) | 2743(34.68%) | 3895(49.25%) | 4014(50.75%) | 1266(16.01%) | 2106(26.63%) | 4537(57.37%) | |||
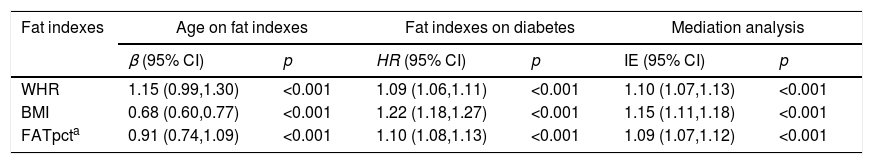
There were several anthropometric measuring indexes in the questionnaire such as BMI, waist, hip, setting height, weight and height and so on. We choose the most representational three indexes into the present analysis: BMI, WHR and body fat percentage. All of them showed a significant positive association (P<0.05) with age and diabetes oncome (Table 2). Cox regression result showed that the hazard of T2DM will increase 9%, 22% and 10% per WHR, BMI and body fat percentage respectively (Table 2).
Regression analysis for age, fat indexes, and risk of diabetes.
| Fat indexes | Age on fat indexes | Fat indexes on diabetes | Mediation analysis | |||
|---|---|---|---|---|---|---|
| β (95% CI) | p | HR (95% CI) | p | IE (95% CI) | p | |
| WHR | 1.15 (0.99,1.30) | <0.001 | 1.09 (1.06,1.11) | <0.001 | 1.10 (1.07,1.13) | <0.001 |
| BMI | 0.68 (0.60,0.77) | <0.001 | 1.22 (1.18,1.27) | <0.001 | 1.15 (1.11,1.18) | <0.001 |
| FATpcta | 0.91 (0.74,1.09) | <0.001 | 1.10 (1.08,1.13) | <0.001 | 1.09 (1.07,1.12) | <0.001 |
To examine whether these body fat indexes acted as causal mediators of the age side effect on diabetes oncome, we performed mediation analysis. Significant causal indirect effects were detected for age, which were mediated respectively through WHR (IE=1.10, 95%CI: 1.07–1.13; P<0.001), BMI (IE=1.15, 95%CI: 1.11–1.18; P<0.001) and body fat percentage (IE=1.09, 95%CI: 1.07–1.12; P<0.001) (Table 2). Additionally, we calculated the combined body fat index score by weighted linear combination of the three body fat indexes to test joint association. The combined body fat index score still demonstrated a significant association with age (P<0.001) and a stronger relationship with diabetes oncome (P<0.001) (Fig. 1) along with a significant mediating effect (IE=1.17; 95%CI: 1.13–1.22; P<0.001). The total effect of age on T2DM was 1.60 (95%CI: 1.21–2.10; P=0.0008). As a result, the three body fat indexes jointly mediated 33.97% of age's impact on diabetes oncome, which mean that people can reduce 33.97% hazard of T2DM by decreasing body fat (Fig. 1).
Discussion
Preliminary studies have indicated the effect of the association between diabetes duration and microvascular events is greater in younger patients,28 and intensive glucose lowering increases the risk of cardiovascular diseases and total mortality in young participants.29 The damage of the diabetes seems more harmful to the young than the old.
Our results about the relationship between body fat indexes (BMI, WHR and body fat percentage) and diabetes oncome are consistent with many other studies.14,16 Meanwhile, Mungreiphy et al. found WHR had the highest correlation with random blood sugar level among general and regional obesity indices.30 It implies that central obesity is more reliable than general obesity in determining diabetes. The internal mechanism maybe that body fat distribution and fat content can influence the adiponectin concentration, which is associated with insulin resistance and hyperinsulinemia.31,32 Obesity and T2DM are associated with low plasma adiponectin concentration in different ethnic groups.33
Studies about the mechanism of association between age and T2DM found that age was associated with an increase in abdominal white adipose tissue,34,35 a major contributor to insulin resistance and diabetes. Meanwhile, with age growth, oxidative stress and chronic inflammation process increase, which also increase the vulnerability to T2DM.36
As we all know, the life-style and physical characteristic fairly differ between young and old people in China: more young people drinking and eating – and more regularly – than the old on account of social contacting and post promotion. It directly leads to obesity. And the impact of obesity on health-related quality of life is especially strong in young people, who are free of co-morbidities. It progressively attenuates with age growth, when co-morbid conditions are diffusely present, independent of obesity.37 Meanwhile, old people eat less animal fat than young people considering with their degradation of digestive function. To avoid confounding and make sure the results more credible and precision, we directed at young people into this study.
The current cohort study was based on a large sample size and suggested a robust causal relationship among age, body fat indexes and T2DM risk by mediation analyses. However, there's still some limitations in this study. First, biochemical indicators associated with T2DM and obesity were not included in this study. For a large population epidemiological study, biochemical tests cost a lot and hard to cover each participant. More comprehensive research should be taken to confirm our results. Second, this study just analyzed individuals aged 30–44 years old, the aged were not included in this analysis. Compared the young, the aged had different physical condition and life style. Future studies will continue to investigate the impact of body fat and age on T2DM in elderly people.
Despite these limitations, to our knowledge, this is the first study to explore comprehensively the interplay between age and body fat indexes in influencing diabetes oncome. This study suggests important roles for controlling body fat as mediators of age. In conclusion, controlling body fat in an appropriate range could prevent the oncome of T2DM for the young. To keep fit and health, appropriate diet, exercise and many other active lifestyle interventions have already reported useful to prevent or delay T2DM onset.38,39 In 2016, WHO called for that healthy diet, regular physical activity, maintaining a normal body weight and avoiding tobacco use are ways to prevent or delay the onset of T2DM.13
ConclusionsThis pilot study revealed the important roles for body fat indexes in mediating the pathway of age on diabetes oncome. This study showed that controlling body fat moderately could reduce 33.97% risk of T2DM onset with age increasing. This finding is of considerable public health importance as age increasing is an unavoidable occurrence.
Authors’ contributionsChen ZM and Li LM designed the study. Dai NB, Hua YJ and Lu Y collected data from Suzhou. Shi QW analyzed the data with Guo Y and Bian Z. All the authors have read and approved the final submitted version.
FundingThis study was supported by grants (2016YFC0900500, 2016YFC0900501) from the National Key Research and Development Program of China, grants (81703305) from the National Natural Science Foundation of China, grants from the Kadoorie Charitable Foundation in Hong Kong and grants (088158/Z/09/Z, 104085/Z/14/Z) from Wellcome Trust in the UK.
Conflict of interestThe authors declare that they have no conflict of interest.
We thank Chinese Center for Disease Control and Prevention, Chinese Ministry of Health, National Health and Family Planning Commission of China. The most important acknowledgment is to the participants in the study and the members of the survey teams, as well as to the project development and management teams based at Beijing, and Oxford.
