


Type 2 diabetes mellitus (T2DM) is a progressive metabolic disorder whose prevalence is rising very fast across the world. Diagnosis of this disease in early stages (pre-diabetic stage) plays an important role in reducing mortality associated with this disorder. miRNAs, as key players in the pathogenesis of T2DM, have been investigated in several studies. Furthermore, their expression profile changes in the early stages of diabetes mellitus in body fluids such as serum, peripheral blood, and peripheral blood mononuclear cell (PBMC) have been studied. Due to their high stability and the presence of non-invasive sensitive methods for their measurement, such as real-time PCR, they can be used for early diagnosis of T2DM as a biomarker. In this experimental study, the expression levels of miR-181b, miR-126-5p, and NF-κB were measured in patients with T2DM, pre-diabetic subjects, and healthy controls in a Yazd population.
Material and methodNinety asymptomatic subjects including 30 T2DM, 30 pre-diabetic, and 30 healthy subjects (diagnosis based on WHO criteria) were included in this study. Real-time PCR was used to measure the expression levels of miR-181b and miR-126-5p. Moreover, the NF-κB expression level was also measured to determine its relationship with these two microRNAs.
ResultIn this study, the expression level of miR-181b and miR-126-p decreased gradually in pre-diabetic as well as T2DM subjects compared to healthy controls. Furthermore, our study showed a significant negative correlation between these two miRNAs and NF-κB for the first time.
ConclusionThese results introduce these anti-inflammatory miRNAs as powerful tools for early diagnosis of T2DM.
La diabetes mellitus tipo 2 (DMT2) es un trastorno metabólico progresivo cuya prevalencia aumenta muy rápidamente en todo el mundo. El diagnóstico de esta enfermedad en estadios iniciales (fase prediabética) tiene un papel importante para reducir la mortalidad asociada con este trastorno. Los miARN, como elementos clave en la patogenia de la DMT2, se han investigado en varios estudios. Además, se han estudiado los cambios de su perfil de expresión en los estadios iniciales de la diabetes mellitus en líquidos corporales como el suero, la sangre periférica y las células mononucleares de sangre periférica (CMSP). Gracias a su elevada estabilidad y a la existencia de métodos sensibles no invasivos para medirlos, como la RCP en tiempo real, pueden utilizarse como biomarcadores para el diagnóstico precoz de la DMT2. En este estudio experimental se determinaron los niveles de expresión de miR-181b, miR-126-5p y NF-κB en pacientes con DMT2, sujetos prediabéticos y controles sanos de una población de la ciudad de Yazd.
Material y métodoSe incluyeron en este estudio a 90 sujetos asintomáticos, incluidos 30 con DMT2, 30 prediabéticos y 30 sanos (el diagnóstico se basó en los criterios de la OMS). Se utilizó RCP en tiempo real para determinar los niveles de expresión de miR-181b y miR-126-5p. Se midió también el nivel de expresión de NF-κB para determinar su relación con estos 2 micro-ARN.
ResultadosEn este estudio, el nivel de expresión de miR-181b y miR-126-5p descendió gradualmente en los sujetos prediabéticos y con DMT2 comparados con los controles sanos. Además, nuestro estudio mostró por primera vez una correlación negativa importante entre estos 2 miARN y NF-κB.
ConclusiónEstos resultados sugieren que estos miARN antiinflamatorios son herramientas potentes para el diagnóstico precoz de la DMT2.
The epidemic of diabetes and its complications is a major threat to global health. According to the International Federation of Diabetes (IDF), 1 in every 11 adults aged 20–79 (415 million) was diagnosed with diabetes in 2015, which is projected to increase to 642 million in 2040.1 Moreover, type 2 diabetes mellitus (T2DM), which comprises more than 90% of diabetic cases, is the most common form of diabetes.2
The complications of T2DM are divided into two categories, including macrovascular (such as cardiovascular disease) and microvascular complications (such as disorders affecting the eyes, kidneys and nerves). However, the clinical complications of type 2 diabetes are delayed, which hampers timely diagnosis of type 2 diabetes.3 Therefore, identification of subjects susceptible to this disease in the pre-diabetic stage, when pancreatic beta cells are not fully effective, is of great importance. Many studies have shown that in the pre-diabetic stage, maintaining a healthy weight and energy balance through physical activity and healthy diets can prevent the onset of T2DM and its complications.4
Insulin resistance is the most important characteristic of T2DM. This condition occurs before glycemic changes such as increased fasting glucose and HbA1c, and can occur more than a decade before the onset of diabetes.5 In endothelial cells, activation of NF-κB results in the expression of pro-inflammatory genes, such as cytokines and cell adhesion molecules, all of which play an important role in inflammation and immune response.6 As a result, endothelial cell dysfunction can play an important role in the development of insulin resistance and T2DM through creating an inflammatory environment.
It has been only recently discovered that epigenetic changes contribute to the development of diabetes; furthermore, they may appear in the pre-diabetic stage.7 Therefore, early detection of T2DM is possible by identification and development of epigenetic biomarkers. MiRNAs, as evolutionary conserved molecules, regulate gene expression at the post transcription level by inhibiting the translation of the target mRNA molecule.8 miRNAs, due to their high stability and measurement in the blood by non-invasive methods such as real-time PCR, have the potential to be used as an epigenetic biomarker for early diagnosis of T2DM.9
miR-181b and miR-126-5p are the best known anti-inflammatory miRNAs involved in the inflammatory signaling pathway. Akt phosphorylation regulates many biological processes, such as the insulin signaling pathway, and dysregulation of Akt phosphorylation is seen in diabetes.10 The full activity of Akt depends on phosphorylation of the Thr308 and Ser473 residue, which is inhibited by a phosphatase called PHLPP2.11 A study conducted by Sun et al.12 found that miR-181b improves insulin signaling, inflammation, and endothelial cell dysfunction by targeting endothelial PHLPP2. NF-κB is an induction transcription factor that regulates a wide range of genes involved in inflammatory processes such as cytokines, chemokines, TNF-α, and adhesion molecules.13 TNF-α is an inflammatory cytokine for which endothelial cells are the most important target cells. Furthermore, it has a role in the activation of NF-κB.14 It has been shown that inhibition of miR-126-5p expression increases the expression of TNF-α. Additionally, miR-126-5p can modulate vascular inflammation by inhibiting VCAM1, which plays an important role in binding leukocytes to endothelial cells.15
Therefore, the aim of the present study was to investigate the expression levels of miR-181b and miR-126-5p in T2DM, pre-diabetic, and healthy subjects to provide new strategies for early diagnosis of T2DM and prevent its complications. Moreover, in order to investigate the role of these miRNAs in the inflammation process, NF-κB gene expression was also measured.
Materials and methodsSample collection of patients and healthy peopleIn this experimental study conducted in the Medical Diagnostic Laboratory of Yazd Diabetes Research Center, 5ml peripheral blood was collected from 30 healthy controls, 30 pre-diabetic subjects, and 30 T2DM patients in EDTA containing tubes. The inclusion criteria were (1) age over 35 years; (2) lack of micro-vascular and macro-vascular complications such as retinopathy, nephropathy, amputation; (3) lack of infectious and coronary artery disease. This study was approved by the Ethics Committee of Shahid Sadoughi University of Medical Sciences, Yazd, Iran.
Diagnosis of T2DM was based on ADA criteria,16 including T2DM: HbA1c≥6.5% (48mmol/mol), fasting blood glucose≥126mg/dL (7.0mmol/L), pre-diabetes: HbA1c=5.7–6.4% (39–47mmol/mol), fasting glucose=100–125mg/dL (between 5.6-6.9mmol/L).
RNA extractionTotal RNA containing long ncRNA and small RNA was extracted according to the instructions of the GeneAll kit (General Biosystems, Seoul, Korea). Then, a NanoDrop spectrophotometer (Thermo Fisher Scientific) was used to evaluate the quantity of the RNA. Since the 260/280 and 260/230 ratio for samples were in the range of 1.8–2 and 2–2.2 respectively, the purity of the isolated RNA was confirmed.
cDNA synthesiscDNA synthesis was performed using the BONmiR kit. In this process, a polyadenylation reaction was performed initially, in which 1μg RNA, 1μl rATP, 2μl 10×ploy A polymerase buffer, and 0.2μl poly A polymerase were mixed. Then, the volume was brought to 20μl with DNase-RNase free water. Lid at thermocycler for 30min at 37°C followed by 65°C for 20min. Then, the volume was brought to 20μl with DNase-RNase free water. Lid at thermocycler for 30min at 37°C followed by 65°C for 20min. Then, 10μl of poly-adenylated RNA with 1μl of the BON-RT adapter was primed in a 0.2 microtube and the volume was brought to 13μl with DNase-RNase free water. The tubes were incubated in a thermocycler at 75°C for 5min and then placed on ice. Next, 1μl RT enzyme, 2μl dNTP mix (100mM), and 4μl 5×RT buffer were added to the tubes, and the tubes were placed in a thermocycler in the following condition: 25°C for 10min, 42°C for 60min, and 70°C for 10min.
Additionally, in order to obtain cDNA of NF-κB, 0.2μg of whole extracted RNA with Revert Aid First Strand cDNA Synthesis Kit (Thermo Scientific, Vilnius, Lithuania) with using oligo (dT) primers in an Eppendorf Mastercycler Gradient (Hamburg, Germany) were used.
Real-time PCR to examine RNA expressionReal-time PCR was done using the BONmiR QPCR Kit. Our final mixing volume was 13μl, including 1μl cDNA, 0.5μl miRNA-specific forward primer, 0.5μl universal reverse primer, and 6.25μl of 2×miRNA QPCR master mix. DNase-RNase free water was added to reach a final volume of 13μl. Additionally, a negative control was also used for the accuracy of the replication, in which all the components of the reaction except cDNA were present in the microtube. The real-time PCR reaction was performed using the Rotor Gene 6000 (Corbett, Concorde, NSW, Australia) according to the following protocol: (1) enzyme activation (1 cycle at 95°C for 2min) and (2) denaturation (40 cycles at 95°C for 5s),3 annealing and extension (40 cycles at 60°C for 30s). All reactions were performed in two repetitions. The SNORD 47 gene (U47) was used as an internal control for normalization of the results. And finally, based on the 2−ΔΔCt) (livac) (fold change) method, the relative amount of RNAs were calculated.
Melting curve analysisThe PCR reaction specificity was confirmed by a melting curve analysis (Fig. 1) followed by gel electrophoresis.
Statistical analysis
The Prism 7 software (Graph Pad, San Diego, CA, USA) was used for data analysis. One-way ANOVA with post hoc Tukey test was applied to detect significant differences in miR-181b and miR-126-5p expression levels between control, pre-diabetic, and T2DM subjects. In addition, Pearson's correlation was used to determine the relationship between variables. P values less than 0.05 (P<0.05) were considered significant.
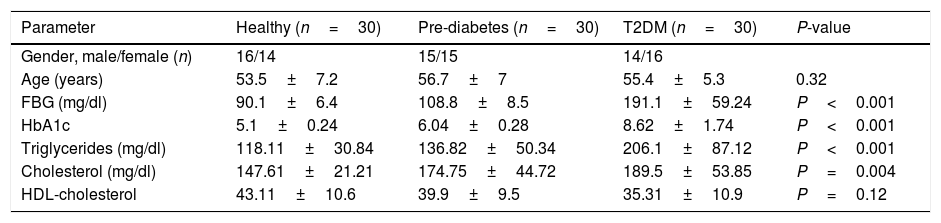
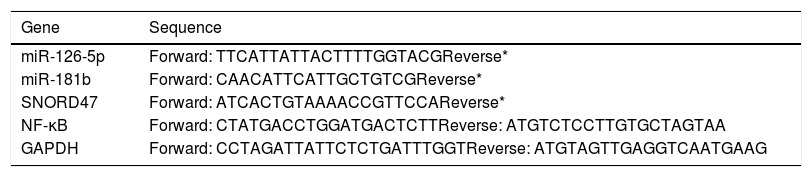
ResultThis study consisted of 90 participants including 30 T2DM cases, 30 pre-diabetic cases and 30 age- and sex-matched controls. Demographic and clinical characteristics of the study participants are recorded in Table 1. Furthermore, oligonucleotide primer sequences for RT-PCR analysis are shown in Table 2.
Demographic data of the studied sample. Data has been shown mean±SD.
| Parameter | Healthy (n=30) | Pre-diabetes (n=30) | T2DM (n=30) | P-value |
|---|---|---|---|---|
| Gender, male/female (n) | 16/14 | 15/15 | 14/16 | |
| Age (years) | 53.5±7.2 | 56.7±7 | 55.4±5.3 | 0.32 |
| FBG (mg/dl) | 90.1±6.4 | 108.8±8.5 | 191.1±59.24 | P<0.001 |
| HbA1c | 5.1±0.24 | 6.04±0.28 | 8.62±1.74 | P<0.001 |
| Triglycerides (mg/dl) | 118.11±30.84 | 136.82±50.34 | 206.1±87.12 | P<0.001 |
| Cholesterol (mg/dl) | 147.61±21.21 | 174.75±44.72 | 189.5±53.85 | P=0.004 |
| HDL-cholesterol | 43.11±10.6 | 39.9±9.5 | 35.31±10.9 | P=0.12 |
Oligonucleotide primer.
We evaluated the expression level of miR-181b in the peripheral blood of 30 healthy individuals, 30 pre-diabetics and 30 T2DM patients using the qRT-PCR method. As shown in Fig. 2, the results of one-way ANOVA showed that miR-181b expression level was significantly lower in pre-diabetic subjects (0.34±0.12) compared to healthy controls (P<0.001) and in T2DM patients compared to pre-diabetic subjects (P=0.005).
, pre-diabetic subjects (n=30), type 2 diabetic patients (n=30). The relative expression of miR-181b, miR-126-5p as well as NF-κB was measured by real-time PCR and normalized with SNORD and GAPDH. Result shown as mean±SD")
miR-181b and miR-126-5p as well as NF-κB expression levels in peripheral blood in the control group (n=30), pre-diabetic subjects (n=30), type 2 diabetic patients (n=30). The relative expression of miR-181b, miR-126-5p as well as NF-κB was measured by real-time PCR and normalized with SNORD and GAPDH. Result shown as mean±SD
Real-time PCR results showed that miR-126-5p expression level was significantly lower in pre-diabetic subjects (0.27±0.11) compared to the control group (1.09±0.45) (P<0.001) but no significant difference was found between pre-diabetic subjects and T2DM patients (P=0.11).
NF-κB expression levelThe results show that NF-κB expression levels were significantly higher in pre-diabetic subjects (1.57±0.14) compared to healthy individuals (1.02±0.21) (P=0.004) and in T2DM patients (2.47±1.05) compared to pre-diabetic subjects (P<0.001).
Correlation analysis between miR-126-5p and miR-181b with NF-κBAccording to the results, high expression levels of NF-κB highly correlated with reduced miR-126-5p and miR-181b expression levels. A significant negative correlation was found between NF-κB and miR-181b (r=−0.607, P<0.001) and also between NF-κB and miR-126-5p (r=−0.605, P<0.001). XY correlation plot for miRNAs and NF-κB is shown in Fig. 3.
Discussion
The prevalence of T2DM as a progressive metabolic disorder is rising very fast. However, it is possible to prevent the onset of the disease by changing the lifestyle of people who are at risk (pre-diabetics).17 Recent intensive investigations suggest that miRNAs play an important role in the pathogenesis of many metabolic diseases, such as T2DM.18,19 The first miRNA indicated in this regard was miR-375. Poy et al. showed that miR-375 is highly expressed in the pancreatic cells of humans and mice and plays an important role in insulin secretion and the pathogenesis of this disease by direct targeting of myotrophin (Mtpn).20 Several studies have shown that miRNAs can be used as biomarkers in the diagnosis and prognosis of various diseases, such as diabetes. In 2017, Copier et al.21 conducted a study in an animal model of diabetic cardiomyopathy and found lower expression levels of miR-181b compared to the control group. In this regard, miR-181b has the potential to be used as a diagnostic biomarker in diabetic cardiomyopathy. Another study showed that miR-126 expression levels were reduced significantly in the plasma samples of T2DM and pre-diabetic subjects compared to healthy controls, so miR-126 also has the potential to be used as a biomarker for early diagnosis of diabetes mellitus.22 In the present study, we aimed to evaluate the expression levels of miR-181b and miR-126-5p in pre-diabetic, T2DM, and healthy subjects. Additionally, in order to determine their anti-inflammatory role, we also measured the level of NF-κB gene expression.
An important reason for selecting miR-181b in this study was its anti-inflammatory role as well as its involvement in insulin resistance reported in several studies. Interleukin-6 is a pro-inflammatory cytokine whose level should be reduced to prevent prolonged inflammation.23 Zhang et al. performed a study in the RAW264.7 cell line treated with lipopolysaccharides (LPS) and found a binding site for miR-181b in the 3′ UTR region of the interlukin-6 molecule; thus, miR-181b reduces the expression of interleukin-6 and inflammation.24 On the other hand, Tomé-Carneiro,25 studied T2DM patients and found that miR-181b expression levels significantly increased in the patients who consumed one daily dose of resveratrol, an anti-inflammatory drug. It was recently identified that miR-181b plays an important role in inhibiting the NF-κB signaling pathway through direct targeting of importin α3, a protein that is essential for nuclear transmission of the NF-κB.26 In the present study, our finding showed that the expression levels of miR-181b differed significantly among these groups, indicating that miR-181b has the potential to be used as a diagnostic and prognostic marker in T2DM. Additionally, the results of this study showed a significant negative correlation (r=−0.607) between the expression levels of NF-κB and miR-181b. These findings are in accordance with the results of recent investigations suggesting that miR-181b is an inhibitor of NF-κB activation and a pro-inflammatory gene.
miR-126-5p, which has the highest expression in endothelial cells, is considered an endothelial specific miRNA. Its expression is not reported in epithelial cells, smooth muscle cells, and fibroblasts27 but has been reported in PBMC.28 Class IA phosphatidylinositol 3-kinase (PI3K) enzymes are heterodimers that are composed of regulatory and catalytic units. In mammals, both regulatory isoforms, namely p85α and p85β, are expressed. Recent studies have shown that disrupted p85α and p85β genes play a significant role in increased insulin sensitivity. Accordingly, a study in p85α−/− and p85β−/− mice showed increased insulin sensitivity and hypoglycemia with reduced plasma insulin.29 Recently by luciferase report assay conducted by Guo et al. disclosed that miR-126 by direct targeting of p85β-3′ play key role in PI3K signalling.30 Therefore, miR-126 through PI3K/Akt signaling pathway down-regulate NF-κB activation as well as pro-inflammatory gene expression. In this study, our findings showed no significant difference in the miR-126-5p expression level between pre-diabetic and T2DM patients, indicating that miR-126-5p cannot distinguish these two groups from one another. This finding is in contrast to the previous results reported in recent studies suggesting that ethnic differences may have a contributory role.31 However, we found a significant difference in the expression level of miR-126-5p between healthy individuals and T2DM patients and also between healthy individuals and pre-diabetic subjects. In addition, a significant negative correlation was found between the expression levels of miR-126-5p and NF-κB. Due to this reason, the effect of increased expression of NF-κB due to decreased expression of miR-126-5p in T2DM patients is in accordance with the anti-inflammatory property reported for miR-126-5p.
ConclusionIn this study, we evaluated the correlation of miR-181b and miR-126 with NF-κB gene expression as an inflammatory factor for the first time. Our findings suggest that miR-181b and miR-126-p, as anti-inflammatory miRNAs, have the potential to be used as diagnostic biomarkers for early diagnosis of T2DM. Real relation between these miRNAs as well as NF-κB summarized in Fig. 4.
Authors’ contributions
Mohammad Reza Dehghani: Study design
S. Mohsen Aghaei Zarch: Sample collection, data analysis
Mohammad Yahya Vahidi: Sample collection
Majid Nazari: Sample collection
Emad Babakhanzadeh: Sample collection
Hamidreza Ghadimi: Sample collection
Fahime Zeinali: Sample collection
Mehrdad Talebi: Sample collection
Conflict of interestThe authors declare no conflict of interest.
