


The mechanisms following glycemic control after RYGB are still not fully elucidated. The objective of the present study was to compare the effects of similar weight loss induced by a Very Low Calorie Diet (VLCD) and by Roux-en-Y Gastric Bypass (RYGB) on the glycemic and gut hormone profile in patients with severe obesity and T2DM.
MethodsA prospective controlled observational study with 10 patients evaluated before (pre-0), after 10 % weight loss induced by VLCD (pre-1), and after 10 % weight loss induced by RYGB (post). Oral Glucose Tolerance Test (OGTT) was performed in pre-0 and pre-1. In all periods, glycemic (glycemia, insulin) and gut hormone profile (Ghrelin, GIP and GLP1) were evaluated in fasting condition (T0) and 30-, 60-, 90- and 120-minutes after a standard meal (Nutren 1.5®).
ResultsAfter 10 % weight loss induced by VLCD 5 patients had remission of T2DM in OGTT. There was a significant increase in ghrelin levels after 10 % weight loss with VLCD (pre-1; p < 0.001). There was no difference in GIP levels. There was a significant increase in GLP1 levels between pre-0 and pre-1 (p < 0.004) at T0 and between pre-1 and post at all times after a standard meal (p = 0.01; p = 0.002; p = 0.002; p = 0.01; p = 0.04).
Conclusions50 % of patients had glycemic control after diet-induced weight loss. After RYGB, all patients had improved glycemic control. The increase of GLP1 after weight loss induced by metabolic surgery is responsible for glycemic control.
Bariatric surgery is considered the most successful treatment for Type 2 Diabetes (T2DM) in patients with severe obesity due to better glycemic control in comparison with clinical treatment.1,2
Patients with obesity and T2DM undergoing Roux-en-y Gastric Bypass (RYGB) had an early improvement in glucose levels and insulin resistance, together with an increase in Glucagon-Like Peptide-1 (GLP-1) and Glucose-dependent Insulinotropic Polypeptide (GIP) a few days after surgery.3–5
The role of proximal bowel exclusion and distal bowel stimulation of L cells are important since the earlier intestinal transit time for nutrients to the distal ileum contributes to an improvement of the glycemic profile after RYGB.6,7–9
In spite of this knowledge, a recent study involving patients with severe obesity and T2DM, comparing equal weight loss induced by diet and RYGB, concluded that similar metabolic benefits were observed in both groups.10,11
The mechanisms involved in the early glycemic improvement after RYGB are still not fully elucidated. The incretin effects may depend to a greater or lesser extent on weight loss, nutritional changes, or the gut hormone effects triggered by the procedure.4,12–15
The hypothesis was that initial glycemic control depends on weight loss, with an additional effect on gut hormone after RYGB.2,16,17
The aim of this study was to compare the glycemic and gut hormone profiles in patients with severe obesity and T2DM after similar weight loss induced by diet and by RYGB.13,14
MethodsA prospective controlled observational study with patients recruited from the Metabolic and Bariatric Unit, Hospital das Clínicas da Faculdade de Medicina da Universidade de São Paulo. Ten consecutive patients with severe obesity (BMI > 35 kg/m2) and T2DM were evaluated between 2016 to 2018. All participants had 18 to 60 years, BMI > 35 kg/m2, T2DM diagnosed < 10-years, a C-peptide level > 3 ng/mL and HbA1c < 12.5 %. Patients under insulin or GLP 1 agonist therapy, use of oral or injected steroids for more than 14 consecutive days in the last 3-months, and with hepatitis B, C and HIV were excluded.
This study was performed according to the ethical recommendations of the Declaration of Helsinki and approved by the Research Ethics Committee of the referred Hospital under registration CAAE: 39,590,814.50000.0068. All participants provided written informed consent before participating in this study.
Study protocolThe selected patients were evaluated before surgery (pre-0), after 8 %‒10 % weight loss (pre-1) induced by a Very Low-Calorie Diet (VLCD), and after 8 %‒10 % weight loss induced by RYGB (post) (Fig. 1). All patients were submitted to the Oral Glucose Tolerance Test (OGTT) in pre-0 and pre-1. All patients underwent gut hormone profile (insulin, ghrelin, GIP and GLP1) evaluation at times T0 (fasting) and T30, T60, T90 and T120 min after ingestion of a standard meal of 300 kcal (Nutren 1.5®).

The insulin resistance was determined according to the formula below: HOMA−IR=(fastinginsulin(μUI/mL)×fastingglucose(mg/dL)×(0.0555)/22.5(50).
The gut hormone profile was collected in a tube containing EDTA anticoagulant, centrifuged at 4500 rpm at 4 °C for 15 minutes for plasma separation and then was stored at −80 °CA. Plasma ghrelin, GIP, GLP1 were measured using multiplex immunoassays (Luminex® xMAP).
The surgical technique was Roux-en-Y Gastric Bypass (RYGB), with a gastric pouch of 30 to 50 mL, 70 to 80 cm of biliopancreatic limb, and 100 to 120 cm of alimentary limb.
Statistical analysisContinuous variables were expressed as mean, median, standard deviation, and quartiles. The Non-parametric ANOVA test for repeated measures was used to compare three times or more. The comparison between the two times was performed using the Mann-Whitney test paired with Benjamini-Hochberg significance correction. The Area Under the Curve (AUC) was calculated using the trapezoid method. The profile graphs were constructed using the median and interquartile range and also by the mean and standard deviation, used to graphically express the measures that vary over time. Boxplot plots were used to illustrate continuous measures that do not vary with time. The significance level adopted in the tests was 5 % (p < 0.05) using a two-tailed hypothesis. The R software version 3.6 was used to perform all analyses.1
ResultsDemographic characteristics are shown in Table 1. Ten patients (50.6 ± 9.5 years) were included (5 female) with a BMI of 43.5 ± 3.6 Kg/m2 and a mean time of T2DM of 4.7 ± 1.3 years. In pre-0 glycemia was 147.5 ± 50.4 mg/dL, HbA1c 8.0 % ± 2.0 % and C-peptide 7.2 ± 2.8 ng/mL.
Results of demographic, anthropometric and laboratory data in Pre-0.
BMI, Body Mass Index; HbAIC, Glycated Hemoglobin.
The average weight loss after VLCD was 11.3 ± 1.6 Kg (8.59 %) in 26.5 ± 9.0 days, and 50 % of the patients had glycemic control in OGTT.
Weight equivalent reductions after RYGB were 11.4 ± 3.9 Kg (9.45 %) in 49.5 ± 13.5 days and 100 % of the patients had glycemic control.
Glycemic profileThe results of the glycemic profile are in Table 2 and Fig. 2.
Descriptiveanalysisof Glycemia and Insulin.
| Glycemia (mg/dL) | Insulin (pg/mL) | |||||
|---|---|---|---|---|---|---|
| Time | pre-0 | pre-1 | post | pre-0 | pre-1 | post |
| 0 | 147.5 ± 50.2 | 97.5 ± 14.8a | 89 ± 9.4b | 1128.1 ± 68.2 | 841.5 ± 399.7 | 474.6 ± 91.3c |
| 30 | 184.8 ± 66.1 | 133.7 ± 27.5 | 147 ± 16.8 | 2532.1 ± 2641.4 | 2025.9 ± 1095 | 3085.5 ± 2122.5 |
| 60 | 210.8 ± 75.5 | 152.3 ± 36.3 | 152.3 ± 38.1 | 3099.1 ± 3625 | 2716.9 ± 2288.8 | 2957.6 ± 2418.2 |
| 90 | 211.5 ± 76.7 | 154.9 ± 38.5 | 119 ± 31.6 | 3894.3 ± 4770.1 | 2221.4 ± 1194.4 | 1927.6 ± 1727.7 |
| 120 | 200.4 ± 73 | 138.4 ± 38.2a | 95.7 ± 18b,c | 2842.7 ± 2787.6 | 1547.1 ± 906.8 | 1123.1 ± 929.2a |
Mann-Whitney test paired. Results are expressed as mean + SD.
Where: pre-0 = Pre-surgical 0; pre-1 = After 10 % weight loss by VLCD; post = After 10 % weight loss by RYGB.

There was a significant reduction of fasting glycemia at T0 between pre-0 and pre-1 (p = 0.006) and pre-0 and post (p = 0.002). There was also a significant reduction of T 120 glycemia between pre-0 and pre-1 (p = 0.027), pre-1 and post (p = 0.004), and pre-0 and post (p = 0.002).
InsulinThe basal insulin level had a significant reduction between pre-0 and post (p = 0.006) and pre-1 and post (p = 0.006). At T 120 min there was also a significant reduction between pre-0 and post (p = 0.037) (Table 2 and Fig. 2).
Homa IRThere was a significant reduction of Homa IR between pre-0 and post (p = 0.006) and between pre-1 and post (p = 0.018).
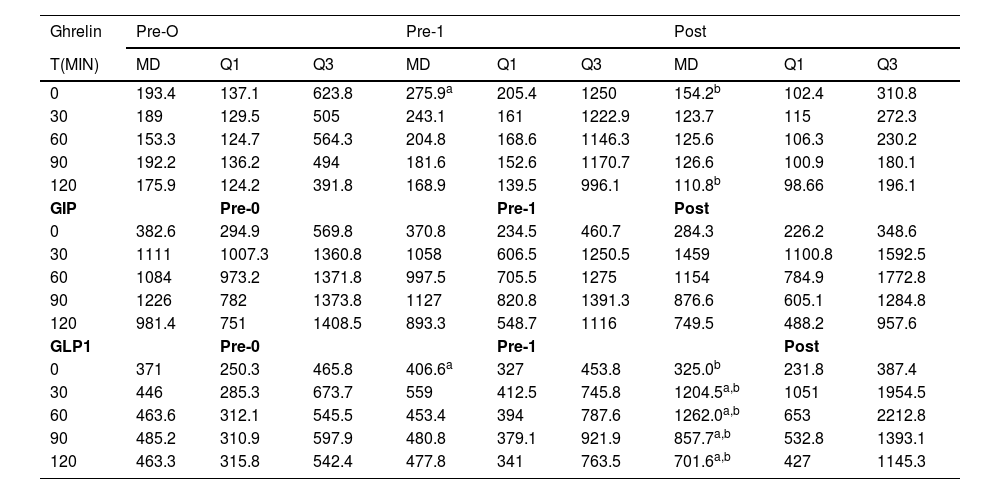
Gut hormone profileGhrelinThere was an increase in Ghrelin levels between pre-0 and pre-1 (p = 0.020) and a significant reduction between pre-1 and post (p = 0.014) at T0. At T120, there was a reduction between pre-1 and post (p = 0.006) (Table 3 and Fig. 2).
Descriptiveanalysisof Ghrelin, GIP and GLP1.
| Ghrelin | Pre-O | Pre-1 | Post | ||||||
|---|---|---|---|---|---|---|---|---|---|
| T(MIN) | MD | Q1 | Q3 | MD | Q1 | Q3 | MD | Q1 | Q3 |
| 0 | 193.4 | 137.1 | 623.8 | 275.9a | 205.4 | 1250 | 154.2b | 102.4 | 310.8 |
| 30 | 189 | 129.5 | 505 | 243.1 | 161 | 1222.9 | 123.7 | 115 | 272.3 |
| 60 | 153.3 | 124.7 | 564.3 | 204.8 | 168.6 | 1146.3 | 125.6 | 106.3 | 230.2 |
| 90 | 192.2 | 136.2 | 494 | 181.6 | 152.6 | 1170.7 | 126.6 | 100.9 | 180.1 |
| 120 | 175.9 | 124.2 | 391.8 | 168.9 | 139.5 | 996.1 | 110.8b | 98.66 | 196.1 |
| GIP | Pre-0 | Pre-1 | Post | ||||||
| 0 | 382.6 | 294.9 | 569.8 | 370.8 | 234.5 | 460.7 | 284.3 | 226.2 | 348.6 |
| 30 | 1111 | 1007.3 | 1360.8 | 1058 | 606.5 | 1250.5 | 1459 | 1100.8 | 1592.5 |
| 60 | 1084 | 973.2 | 1371.8 | 997.5 | 705.5 | 1275 | 1154 | 784.9 | 1772.8 |
| 90 | 1226 | 782 | 1373.8 | 1127 | 820.8 | 1391.3 | 876.6 | 605.1 | 1284.8 |
| 120 | 981.4 | 751 | 1408.5 | 893.3 | 548.7 | 1116 | 749.5 | 488.2 | 957.6 |
| GLP1 | Pre-0 | Pre-1 | Post | ||||||
| 0 | 371 | 250.3 | 465.8 | 406.6a | 327 | 453.8 | 325.0b | 231.8 | 387.4 |
| 30 | 446 | 285.3 | 673.7 | 559 | 412.5 | 745.8 | 1204.5a,b | 1051 | 1954.5 |
| 60 | 463.6 | 312.1 | 545.5 | 453.4 | 394 | 787.6 | 1262.0a,b | 653 | 2212.8 |
| 90 | 485.2 | 310.9 | 597.9 | 480.8 | 379.1 | 921.9 | 857.7a,b | 532.8 | 1393.1 |
| 120 | 463.3 | 315.8 | 542.4 | 477.8 | 341 | 763.5 | 701.6a,b | 427 | 1145.3 |
Where: pre-0 = pre-surgical 0; pre-1 = after 10 % weight loss by VLCD; post = after 10 % weight loss by RYGB.
There were no significant variations in GIP levels at all times studied (Table 3 and Fig. 2).
GLP1There was a significant increase in GLP1 level between pre-0 and pre-1 only at T0 (p = 0.044). There was a significant increase between pre-0 and post (T30 p = 0.002; T60 p = 0.002; T90 p = 0.01 and T120 p = 0.01) and between pre-1 and post at all times (T0 p = 0.01; T30 p = 0.002; T60 p = 0.002; T90 p = 0.01 and T120 p = 0.04) (Table 3 and Fig. 2).
DiscussionThe present study compared in the same group of patients the early effects of 10 % weight loss induced by a VLCD to an equivalent weight loss after RYGB. 50 % of the patients had an improvement in the glycemic profile after the diet, with normalization of the OGTT. After RYGB, all patients showed an improvement in the glycemic profile.17
There was a significant improvement in fasting glycemia after 10 % weight loss by diet.3,14,15
These observations may be partially explained by the improvement of hepatic insulin sensitivity after severe calorie restriction, while peripheral insulin sensitivity improves late in response to postoperative weight loss. With early glycemic control, there is a reduction in fasting glucose and insulin levels and, consequently, a decrease in insulin resistance.18
The VLCD diet determines an immediate metabolic improvement, reducing the glucotoxicity and lipotoxicity present in T2DM in approximately 2-weeks. An improvement in the first phase of insulin secretion and an increase in hepatic sensitivity to insulin were observed, but without changes in peripheral insulin resistance.12
Ballantyne et al. (2006) studied insulin resistance 3-months after adjustable gastric banding in comparison to RYGB, observing a greater reduction in HOMA-IR levels after RYGB. Caloric restriction also promotes an important improvement in insulin resistance, but after RYGB, there was an additional gut hormone effect caused by the alteration of the passage of food by the diversion of intestinal transit.4,19
The effects of weight loss in a group of individuals with caloric restriction in comparison with another group submitted to RYGB showed that similar weight reduction induced by diet or surgery promotes considerable improvement in β-cell function due to increased glucose sensitivity in both groups, without difference between them.10 However, weight loss after the surgical procedure is more intense and effective than diet therapy alone for patients with severe obesity and T2DM.20,21 The results of this study found a significant improvement in T2DM control after RYGB and demonstrate the intrinsic effects of the anatomical changes in the digestive tract generated by the surgery, which add to the effects of weight loss on glucose metabolism.22
The ghrelin had increased secretion after 10 % weight loss induced by VLCD in fasting. In contrast, RYGB determined an early important suppression of its secretion.12,14,23
In the present study, the GIP levels were not different in all studied periods. GIP has an attenuated incretin effect on insulin secretion in individuals with T2DM and can be restored with a reduction in blood glucose after RYGB.15,20,24,25
There was no significant increase in GLP1 secretion after diet-induced weight loss.
After RYGB, the significant increase in GLP1 levels between T30 and T60, with better glycemic control, and increased insulin levels, demonstrates the positive effects of surgery. The authors may consider the beneficial addictive effect of weight loss before and after RYGB on glycemic control.5,17 Another study conducted by the group evaluated glycemic control with oral and gastrostomy stimulation after RYGB in patients with obesity and T2DM.3,16 The improvement in incretin response with an increase in GLP1 was observed only through the oral route.3,26
The present results obtained after two interventions contributed to reinforcing the metabolic heterogeneity of patients with obesity and T2DM, probably suggesting different treatments according to objective measurement of metabolic impairment or predictors of success for T2DM.27
The main limitations of this study were the small number of patients included and the additive effects of weight loss before RYGB on glycemic control.
The impact of metabolic surgery in comparison with drug therapy on the maintenance of remission of TDM2 was evaluated 3-years later. The magnitude of metabolic surgery was stronger than drug therapy and lifestyle change in the remission of T2DM, including individuals with Grade 1 obesity.17,28
Finally, it can be inferred from the results that diet-induced weight loss allows specific benefits in the glycemic profile, which are highly potentiated with surgical treatment.17,25
Conclusion50 % of patients had glycemic control after diet-induced weight loss. After RYGB, all patients had improved glycemic control. The increase of GLP1 after weight loss induced by metabolic surgery is responsible for glycemic control.
The authors declare no conflicts of interest.