

Sphincter-sparing rectal cancer surgery seeks to avoid terminal stomas, yet they remain common. To identify patients who may benefit from an upfront terminal ostomy, we aimed to determine preoperative risk factors and develop a risk calculator.
MethodsThis multicenter observational retrospective cohort study included consecutive patients undergoing sphincter-sparing anterior resection for rectal cancer between January 2016 and January 2020 at 6 tertiary hospitals. The stoma-free status was analyzed 2 years after surgery.
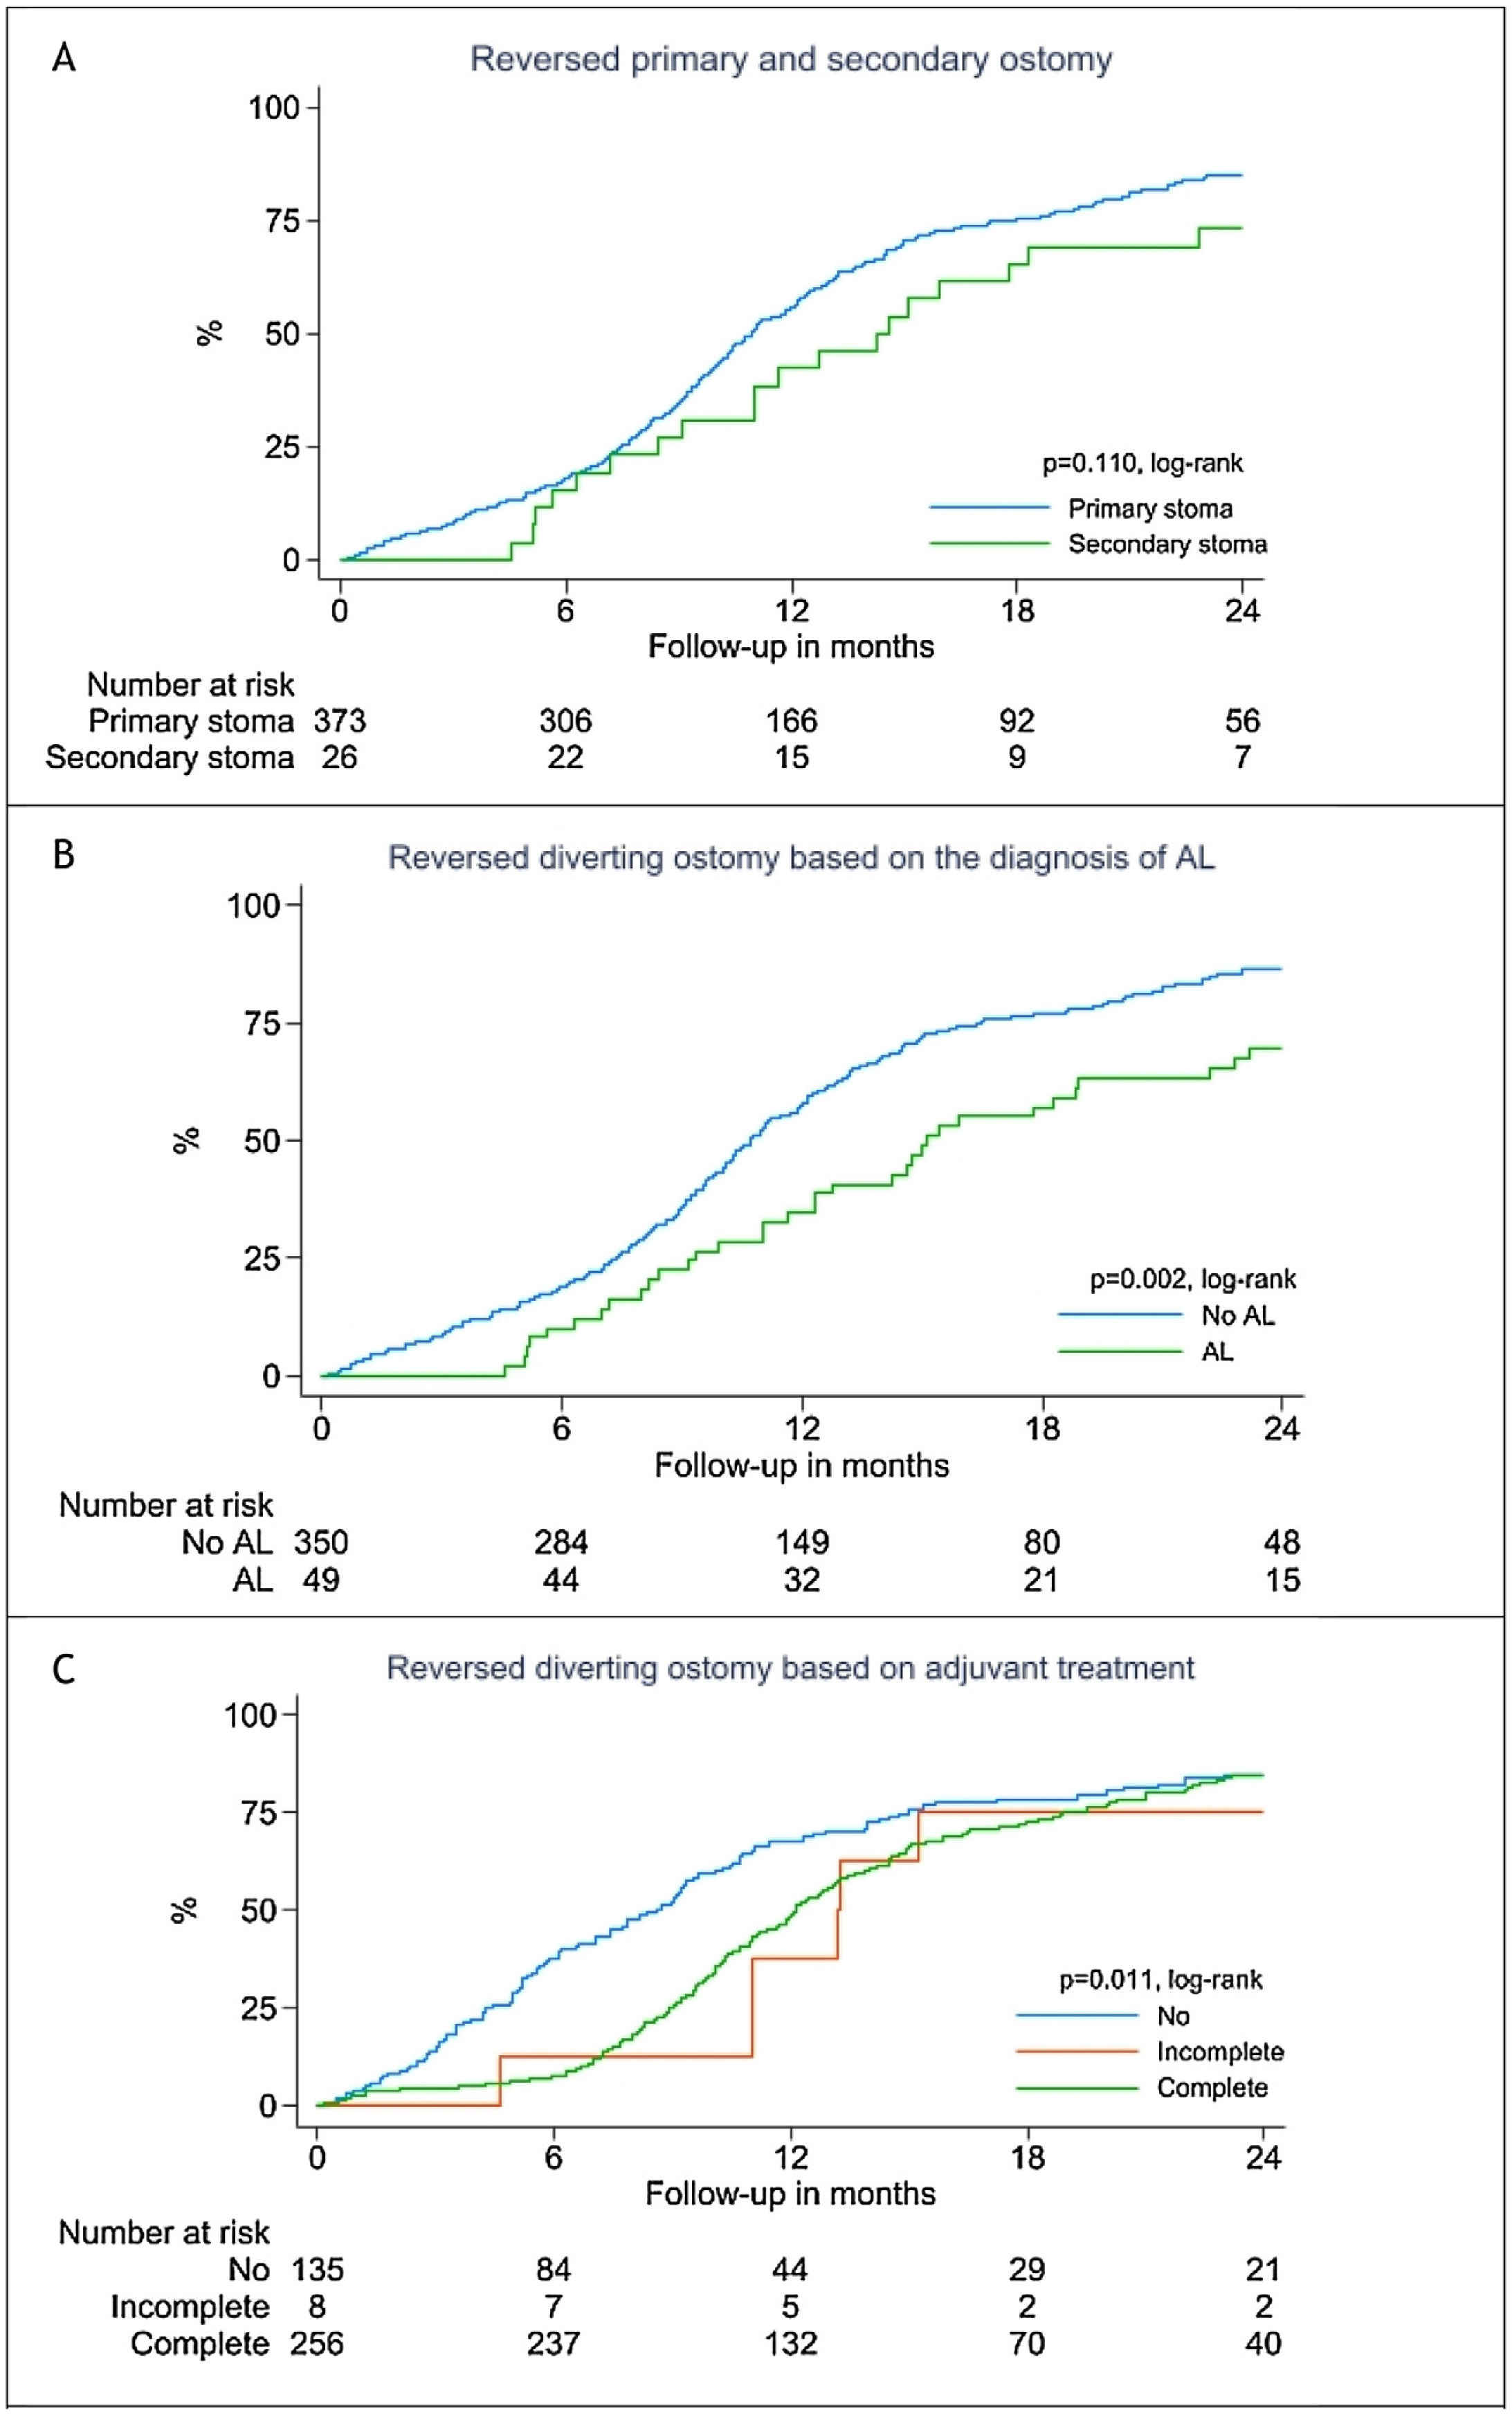
ResultsWe included 639 patients: 373 with primary stoma (58.4%) and 29 with secondary stoma (4.5%). Two years after surgery, 76 (11.9%) patients had permanent stoma. Patients with anastomotic leakage showed a lower rate of stoma closure 2 years after surgery (No 86.3% vs Yes 69.4%; P = .002). The main causes for non-primary stoma reversal were disease progression (52.4%) and patient decision (19.0%). Preoperative factors independently associated with permanent stoma 2 years after surgery were male sex (P = .016; OR = 2.16), tumor height (P = .001; OR = 0.88), synchronous liver metastases (P = .025; OR = 2.71) and lung metastases (P = .001: OR = 7.05).
ConclusionsPreoperative risk factors associated with permanent stoma in patients undergoing anterior rectal resection include sex, tumor height, and synchronous liver or lung metastases. Surgeons should consider preoperative factors associated with the risk of permanent stoma and inform patients about the potential need for a permanent stoma.
La cirugía para el cáncer de recto que preserva el esfínter busca evitar las ostomías definitivas, pero estas siguen siendo comunes. Para identificar a los pacientes que podrían beneficiarse de una ostomía terminal inicial, nuestro objetivo fue determinar los factores de riesgo preoperatorios y desarrollar una calculadora de riesgo.
MétodosEstudio de cohorte retrospectivo multicéntrico en 639 pacientes con cáncer de recto tratados con resección anterior con preservación del esfínter en seis hospitales entre 2016 y 2020. Se evaluó el estado libre de estoma a los 2 años.
ResultadosIncluimos a 639 pacientes: 373 con estoma primario (58.4%) y 29 con estoma secundario (4.5%). A los dos años, 76 pacientes (11.9%) mantenían un estoma. Los pacientes con fuga anastomótica tuvieron menor tasa de cierre a los dos años (No. 86.3% vs. Sí. 69.4%. P = .002). Las principales causas de no reversión del estoma primario fueron progresión de la enfermedad (52.4%) y decisión del paciente (19.0%). Los factores preoperatorios asociados a estoma permanente después de dos años de la cirugía fueron sexo masculino (P = .016, OR = 2.16), altura del tumor (P = .001, OR = 0.88), metástasis hepáticas (P = .025, OR = 2.71) y metástasis pulmonares (P = .001, OR = 7.05).
ConclusionesLos factores preoperatorios asociados a estoma permanente incluyen sexo masculino, altura del tumor y metástasis hepáticas o pulmonares. Los cirujanos deben considerar estos factores preoperatorios al evaluar el riesgo de estoma permanente e informar a los pacientes sobre la posible necesidad de ostomía definitiva.
In the past 2 decades, colorectal surgery has progressed toward minimally invasive techniques with a growing emphasis on preserving sphincter function, resulting in higher rates of sphincter-sparing procedures and a decreased need for terminal stomas. Consequently, very low pelvic anastomoses are markedly more common in contemporary colorectal surgery.1 Traditionally, diverting stomas to protect low coloanal and colorectal anastomoses were used to reduce the risk of anastomotic dehiscence. However, the evidence suggests that, although ostomy reduces the severity of dehiscence, it does not reduce its incidence.2
The rate of stoma creation differs widely among surgical techniques and series. In elective rectal cancer surgery, including anastomosis with protective ileostomy, the incidence ranges from 4% to 38%.3–7 A recent study in older patients with advanced rectal cancer found that temporary stomas were closed in 72.5%; however, 15% of these patients required stoma reconstruction, and only 65.8% were ostomy-free after a median follow-up of 3.8 years.8
Factors linked to the risk of not restoring bowel continuity include advanced age, advanced disease stage, affected radial margin, anastomotic dehiscence, and adjuvant therapy.9,10 However, many of these factors are unknown when the decision to create a stoma is made. While many rectal cancer patients would prefer to avoid an end colostomy, surgeons must discuss this possibility along with potential functional issues after tract continuity restoration if a diverting ileostomy is created.6,7 After ileostomy closure, 40%–50% of patients experience rectal resection syndrome, which can lead to reduced quality of life and often necessitates stoma recreation.8 Therefore, for certain patient groups, creating a temporary stoma may be less advisable than opting for terminal colostomy. Given the high rates of non-closure of stomas, stoma reconstruction, and functional complications after tract continuity restoration, it is essential to identify factors that predict when temporary stomas may become permanent to determine which patients might benefit from a terminal ostomy to begin with.
This study aims to determine the actual rate of permanent stoma (PS) 2 years after rectal cancer surgery, while also identifying factors associated with permanent stoma and developing a preoperative prediction model to guide stoma-related decisions in rectal cancer surgery
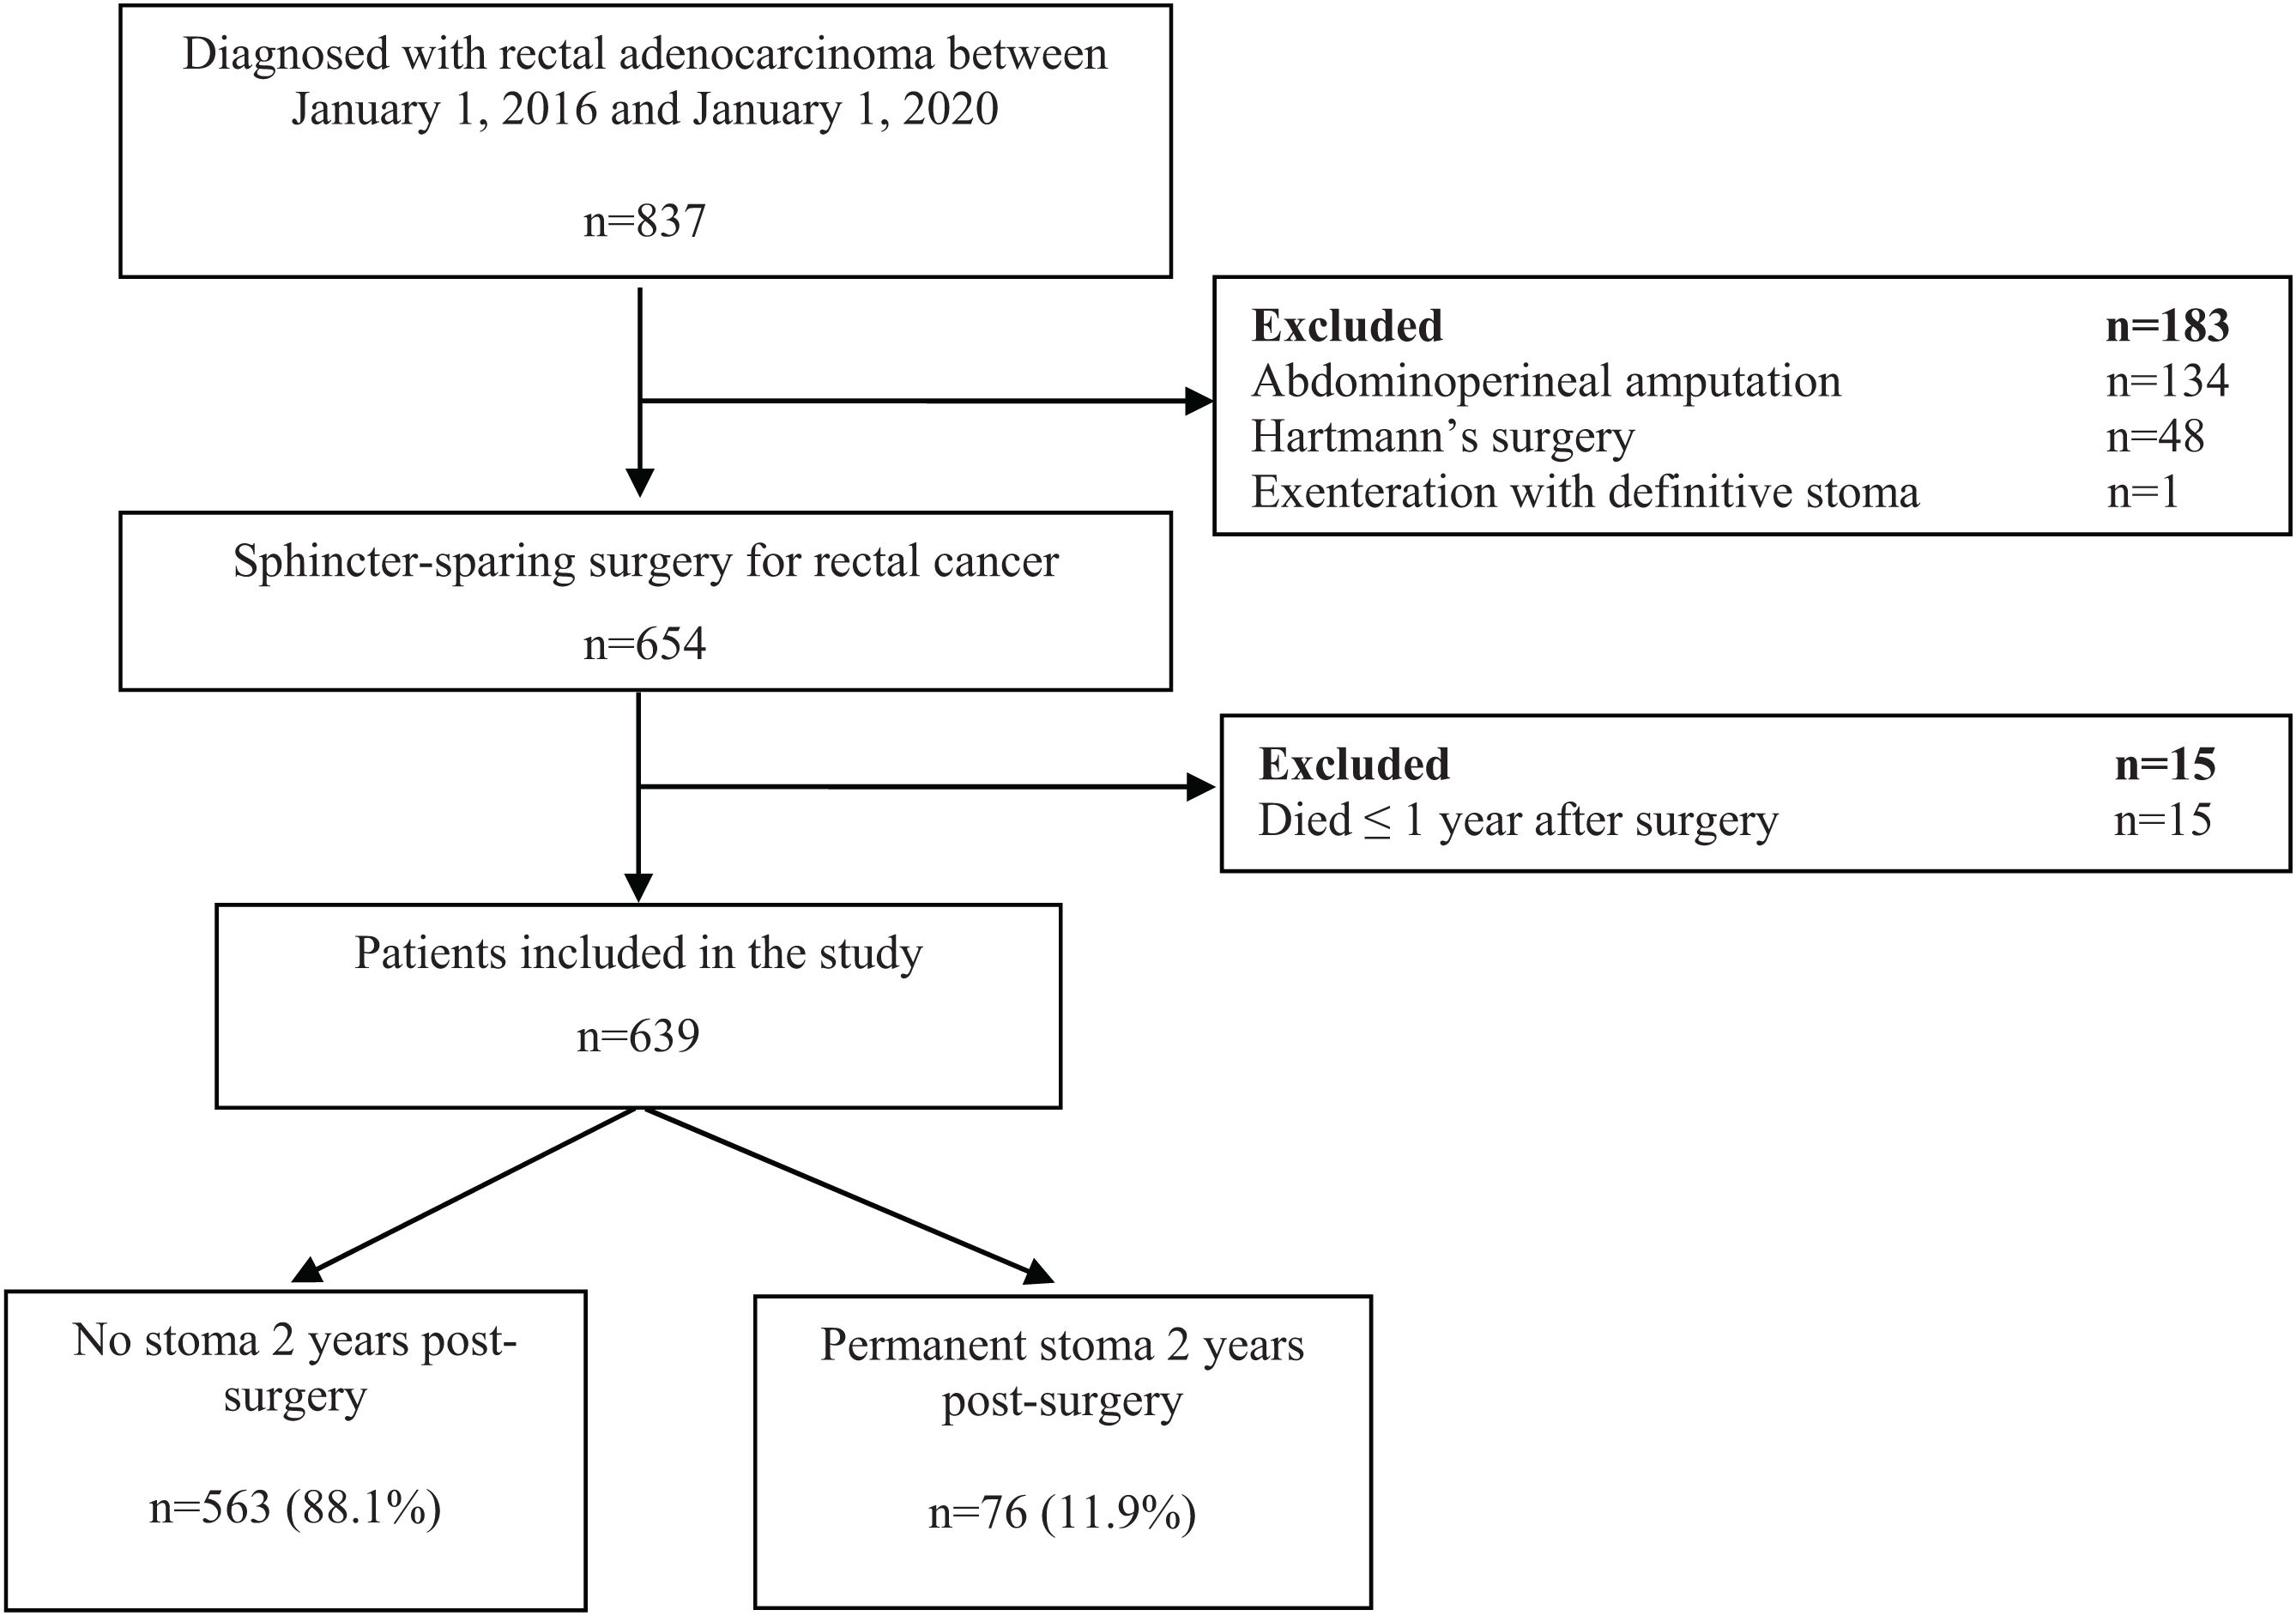
Material and methodsStudy design and patient selectionEligible for this retrospective observational study were consecutive patients who underwent sphincter-sparing resection for rectal cancer between January 2016 and January 2020 at 6 tertiary university hospitals with specialized colorectal surgery units. We included patients aged ≥18 years who underwent partial or total excision of the mesorectum, with or without neoadjuvant chemotherapy aiming to achieve R0 for adenocarcinoma (regardless of TNM stage) located ≤15 cm from the anal verge, in whom an anastomosis was created with or without a temporary diverting stoma (Fig. 1) (Supplementary Material).
We excluded patients who had undergone emergency surgery, those who received an upfront permanent ileostomy or colostomy, and those who died within one year of surgery. The protocol was approved by the ethics committees of participating hospitals (N 2022.046).
Data collectionDemographic and clinical variablesWe analyzed the following demographic and clinical variables: sex; age, dichotomized into <70 years or ≥70 years; body mass index (BMI), dichotomized into non-obese (<30 kg/m2) or obese (≥30 kg/m2); American Society of Anesthesiologists physical status score (ASA), dichotomized into I/II or III/IV; cT; cN; cM; type of synchronous metastasis; tumor height, classified into 3 groups according to distance from the anal verge (0–5 cm, 5–10 cm, or 10–15 cm); and neoadjuvant therapy (yes/no/incomplete).
Surgical variables and pathology findingsWe analyzed the following surgical variables: technique, approach, conversion rate, type of anastomosis, stoma formation, and operative time.
Resected specimens were evaluated following the recommendations of the American Joint Committee on Cancer Guidelines, 8th Edition.11 The following variables were recorded: tumor stage, node status, number of total lymph nodes, number of positive lymph nodes, quality of the resection, and mesorectum quality.
We defined postoperative morbidity as any complication ≤30 days after surgery. To classify complications, we used the Clavien–Dindo classification,12 considering grade I or II complications minor and grade III or IV complications severe. We specifically analyzed anastomotic leakage.
We also analyzed length of hospital stay, reoperation rate, rehospitalization rate, and postoperative mortality, defined as death due to any cause ≤30 days after surgery or before hospital discharge.
Follow-upAll patients were followed up for 24 months, or until death. Ostomy creation, ostomy reversal, problems associated with the ostomy, and ostomy recreation were documented during follow-up and retrieved from medical records for this study.
DefinitionsWe defined primary ostomies as those created during the initial rectal surgery, secondary ostomies as those created in an additional procedure for immediate postoperative complications ≤90 days after the initial surgery, and tertiary ostomies as those created >90 days after the initial surgery (including those recreated after takedown and end ostomies created to improve quality of life in patients with worsening of disease and/or functional sequelae), regardless of whether patients had undergone primary or secondary ostomy.
Outcome and predictive variablesPermanent ostomy was defined as one (primary, secondary, or tertiary) that was present 2 years after sphincter-sparing surgery, whether it is a temporary or definitive stoma. We explored the demographic and clinical variables detailed in section 2.2.1 as predictive variables.
Sample sizeWe aimed for a sample size large enough to identify preoperative variables associated with PS. Although there is no generally accepted approach for estimating the sample size necessary to develop and validate risk prediction models,13 some empirical investigations suggest that 10–15 events per variable can yield stable estimates.14–16 Therefore, assuming a 14.4% event rate for PS17 and evaluating at least 7 potential predictors, 486 patients would be required to achieve stable estimates.
Statistical analysesWe carried out descriptive analyses of subjects’ demographic and clinical characteristics, reporting categorical variables as frequencies and percentages and continuous variables as medians and interquartile ranges (IQR). To determine whether continuous variables were normally distributed, we used the Shapiro-Wilk test. To compare subjects with PS versus those without, we used chi-square tests or Fisher’s exact tests for categorical variables, as appropriate, and Student’s t-test for continuous variables with normal distributions and the Mann-Whitney U for those with non-normal distributions. Ostomy reversal rates over time according to stoma type, anastomotic leakage diagnosis, and adjuvant treatment were analyzed using the Kaplan-Meier method. The curves were compared using the log-rank test.
To explore associations between preoperative variables and PS, univariate logistic regression was used to compute crude odds ratios (OR). Multiple logistic regression models were created to calculate adjusted OR for variables with P < .20 in univariate analyses. Multicollinearity among independent variables was assessed using the variance inflation factor (VIF), excluding variables with VIF > 10. The final model reported OR with 95% confidence intervals (CI) and P-values, with the Hosmer-Lemeshow test used for model calibration and area under the receiver operating characteristic curve (AUC) for discrimination assessment. Internal validation utilized k-fold cross-validation for AUC, facilitated by the CVAUROC module in STATA.18
All statistical tests were conducted at an α = 0.05 significance level, utilizing IBM SPSS V.25 and STATA IC 13 for analyses. Reporting adhered to the recent TRIPOD statement for multivariable prediction models.19
ResultsPatient characteristicsWe analyzed data from 639 consecutive patients who underwent sphincter-preserving surgery for rectal cancer. The flowchart in Fig. 1 (Supplementary Material) shows how patients were included in the study. Two years after surgery, 563 (88.1%) of all patients were stoma-free, and 76 (11.9%) had PS.
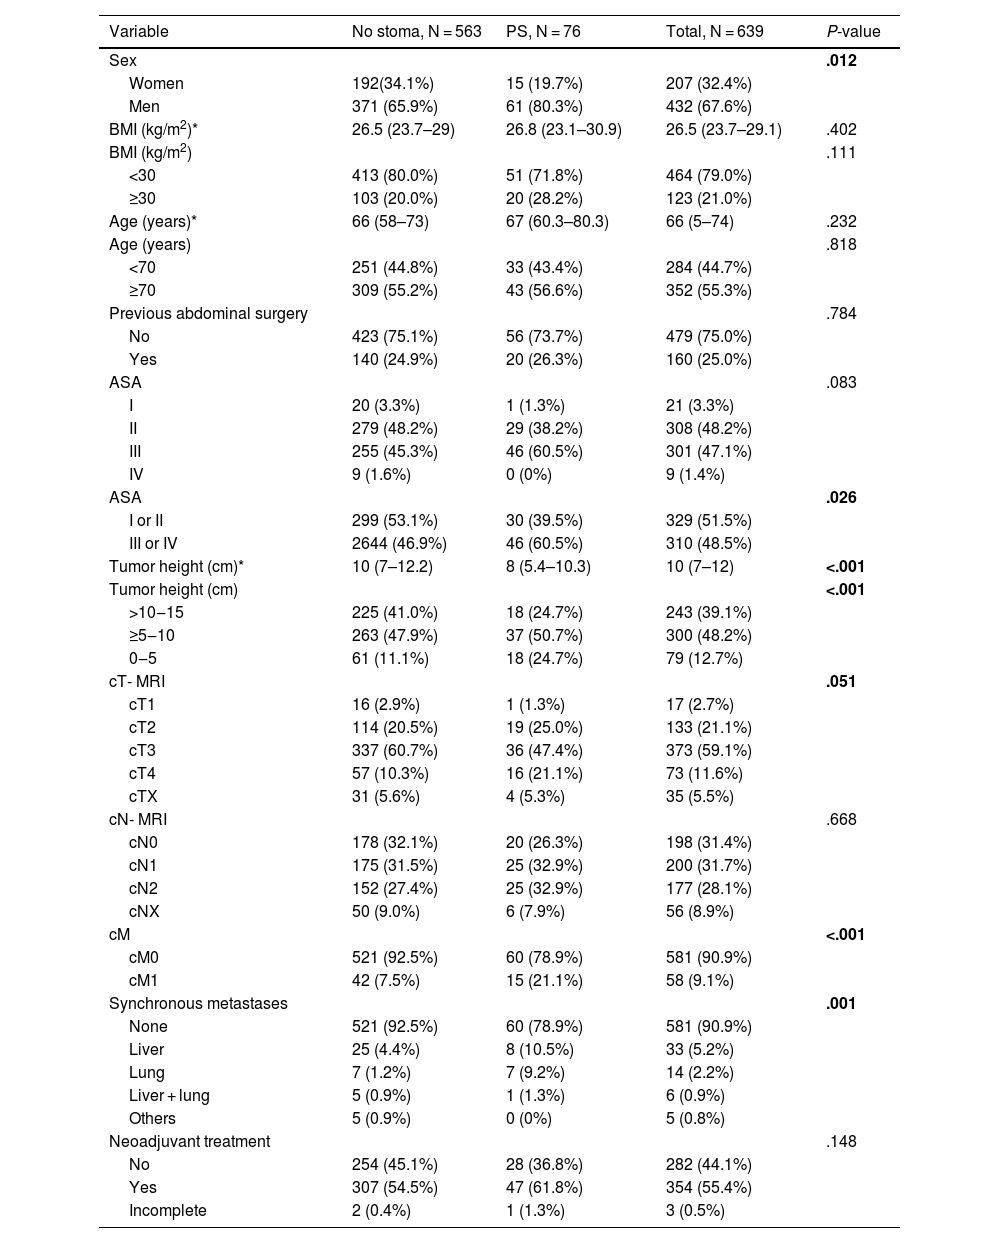
Table 1 summarizes their demographic and baseline clinical characteristics. The group of patients with PS had a higher proportion of males (80.3% vs 65.9% in the group without PS; P = .012) and of patients classified as ASA III or IV (60.5% vs 46.9% in the group without PS; P = .026]. Tumors were lower in the group with PS (8 cm [IQR 5.4–10.3] vs 10 cm [IQR 7–12.2]; P < .001).
Preoperative patient characteristics according to the presence of a stoma 2 years after sphincter-sparing surgery.
| Variable | No stoma, N = 563 | PS, N = 76 | Total, N = 639 | P-value |
|---|---|---|---|---|
| Sex | .012 | |||
| Women | 192(34.1%) | 15 (19.7%) | 207 (32.4%) | |
| Men | 371 (65.9%) | 61 (80.3%) | 432 (67.6%) | |
| BMI (kg/m2)* | 26.5 (23.7–29) | 26.8 (23.1–30.9) | 26.5 (23.7–29.1) | .402 |
| BMI (kg/m2) | .111 | |||
| <30 | 413 (80.0%) | 51 (71.8%) | 464 (79.0%) | |
| ≥30 | 103 (20.0%) | 20 (28.2%) | 123 (21.0%) | |
| Age (years)* | 66 (58–73) | 67 (60.3–80.3) | 66 (5–74) | .232 |
| Age (years) | .818 | |||
| <70 | 251 (44.8%) | 33 (43.4%) | 284 (44.7%) | |
| ≥70 | 309 (55.2%) | 43 (56.6%) | 352 (55.3%) | |
| Previous abdominal surgery | .784 | |||
| No | 423 (75.1%) | 56 (73.7%) | 479 (75.0%) | |
| Yes | 140 (24.9%) | 20 (26.3%) | 160 (25.0%) | |
| ASA | .083 | |||
| I | 20 (3.3%) | 1 (1.3%) | 21 (3.3%) | |
| II | 279 (48.2%) | 29 (38.2%) | 308 (48.2%) | |
| III | 255 (45.3%) | 46 (60.5%) | 301 (47.1%) | |
| IV | 9 (1.6%) | 0 (0%) | 9 (1.4%) | |
| ASA | .026 | |||
| I or II | 299 (53.1%) | 30 (39.5%) | 329 (51.5%) | |
| III or IV | 2644 (46.9%) | 46 (60.5%) | 310 (48.5%) | |
| Tumor height (cm)* | 10 (7–12.2) | 8 (5.4–10.3) | 10 (7–12) | <.001 |
| Tumor height (cm) | <.001 | |||
| >10‒15 | 225 (41.0%) | 18 (24.7%) | 243 (39.1%) | |
| ≥5‒10 | 263 (47.9%) | 37 (50.7%) | 300 (48.2%) | |
| 0‒5 | 61 (11.1%) | 18 (24.7%) | 79 (12.7%) | |
| cT- MRI | .051 | |||
| cT1 | 16 (2.9%) | 1 (1.3%) | 17 (2.7%) | |
| cT2 | 114 (20.5%) | 19 (25.0%) | 133 (21.1%) | |
| cT3 | 337 (60.7%) | 36 (47.4%) | 373 (59.1%) | |
| cT4 | 57 (10.3%) | 16 (21.1%) | 73 (11.6%) | |
| cTX | 31 (5.6%) | 4 (5.3%) | 35 (5.5%) | |
| cN- MRI | .668 | |||
| cN0 | 178 (32.1%) | 20 (26.3%) | 198 (31.4%) | |
| cN1 | 175 (31.5%) | 25 (32.9%) | 200 (31.7%) | |
| cN2 | 152 (27.4%) | 25 (32.9%) | 177 (28.1%) | |
| cNX | 50 (9.0%) | 6 (7.9%) | 56 (8.9%) | |
| cM | <.001 | |||
| cM0 | 521 (92.5%) | 60 (78.9%) | 581 (90.9%) | |
| cM1 | 42 (7.5%) | 15 (21.1%) | 58 (9.1%) | |
| Synchronous metastases | .001 | |||
| None | 521 (92.5%) | 60 (78.9%) | 581 (90.9%) | |
| Liver | 25 (4.4%) | 8 (10.5%) | 33 (5.2%) | |
| Lung | 7 (1.2%) | 7 (9.2%) | 14 (2.2%) | |
| Liver + lung | 5 (0.9%) | 1 (1.3%) | 6 (0.9%) | |
| Others | 5 (0.9%) | 0 (0%) | 5 (0.8%) | |
| Neoadjuvant treatment | .148 | |||
| No | 254 (45.1%) | 28 (36.8%) | 282 (44.1%) | |
| Yes | 307 (54.5%) | 47 (61.8%) | 354 (55.4%) | |
| Incomplete | 2 (0.4%) | 1 (1.3%) | 3 (0.5%) |
PS, permanent stoma; BMI, Body mass index; ASA, American Society of Anesthesiologists; MRI, magnetic resonance imaging.
P values in bold indicate significance.
Tumor stage was cT3 in 59.1% of all patients; differences between groups did not reach statistical significance (P = .051). Node stage was cN1 or cN2 in 59.8% of all patients, with no differences observed between groups (P = .668). Moreover, no differences among participating centers were observed for these variables.
Synchronous metastases were identified in 9.1% of all patients (21.1% in the group with PS vs 7.5% in the group without stomas; P < .001); the prevalence of liver metastases and of both liver and lung metastases were higher in the group with PS (P = .001). A total of 354 (55.4%) had completed neoadjuvant therapy before surgery, with no significant differences between groups (P = .148).
Surgical variablesManual suturing of the coloanal anastomosis (P < .001), end-to-end anastomoses (P = .012), and the creation of a primary diverting stoma (P < .001) were more common in the PS group. The surgical approach and the rate of conversion to open surgery were not significantly different between groups. Operative time was longer in the PS group than in the group with no PS (300 min [IQR 257–360] vs 270 min [IQR 210–330]; P = .005) (Table 2).
Surgical variables and postoperative morbidity according to the presence of a stoma 2 years after sphincter-sparing surgery.
| Variables | No stoma, N = 563 | PS, N = 76 | Total, N = 639 | P-value |
|---|---|---|---|---|
| Surgical approach | .063 | |||
| Laparoscopy | 364 (64.7%) | 46 (60.5%) | 410 (64.2%) | |
| Laparoscopy + TaTME | 62 (11.0%) | 16 (21.1%) | 78 (12.2%) | |
| Robotic surgery | 117 (20.8%) | 10 (13.2%) | 127 (19.9%) | |
| Robotic surgery + TaTME | 1 (0.2%) | 0 (0%) | 1 (0.2%) | |
| Laparotomy | 19 (3.4%) | 4 (5.3%) | 23 (3.6%) | |
| Conversion to open surgery | .331 | |||
| No | 494 (90.8%) | 63 (88.7%) | 557 (87.2%) | |
| Yes | 50 (9.2%) | 8 (11.3%) | 58 (9.1%) | |
| Anastomosis suturing | <.001 | |||
| Manual | 51 (9.1%) | 21 (27.6%) | 72 (11.3%) | |
| Mechanical | 509 (90.4%) | 55 (72.4%) | 564 (88.3%) | |
| Missing data | 3 (0.5%) | 0 (0%) | 3 (0.5%) | |
| Anastomosis | .012 | |||
| Side-to-end | 148 (26.3%) | 8 (10.5%) | 156 (24.4%) | |
| End-to-end | 406 (72.1%) | 67 (88.2%) | 67 (88.2%) | |
| Pull-through | 5 (0.9%) | 0 (0%) | 5 (0.8%) | |
| Reservoir | 1 (0.2%) | 0 (0%) | 0 (0%) | |
| Missing | 3 (0.5%) | 1 (0.2%) | 1 (1.3%) | |
| Stoma | <.001 | |||
| No stoma | 243 (43.2%) | 12 (15.8%) | 255 (39.9%) | |
| Virtual Ileostomy | 11 (2.0%) | 0(0%) | 11 (1.7%) | |
| Ileostomy | 308 (54.6%) | 64 (84.2%) | 372 (58.2%) | |
| Colostomy | 1 (0.2%) | 0(0%) | 1 (0.2%) | |
| Operative time in minutes* | 270 (210−330) | 300 (257−360) | 27.65 (220−330) | .005 |
| Hospitalization days* | 6 (5−10) | 10 (6−16) | 6 (5−11) | <.001 |
| Complications | .001 | |||
| No | 372 (66.1%) | 35 (46.1%) | 407 (46.1%) | |
| Yes | 191 (33.9%) | 41 (53.9%) | 232 (36.3%) | |
| Clavien-Dindo Classification | <.001 | |||
| grade 0 | 372 (66.1%) | 35 (46.1%) | 407 (63.7%) | |
| grade I or II | 134 (23.8%) | 18 (23.6%) | 152 (23.8%) | |
| grade III or IV | 57 (10.1%) | 23 (30.3%) | 80 (12.5%) | |
| Reintervention | <.001 | |||
| No | 500 (90.4%) | 56 (73.7%) | 565 (88.4%) | |
| Yes | 54 (9.6%) | 20 (26.3%) | 74 (11.6%) | |
| Paralytic ileus | .001 | |||
| No | 484 (86.0%) | 54 (71.1%) | 538 (84.2%) | |
| Yes | 79 (14.0%) | 22 (28.9%) | 101 (15.8%) | |
| Anastomosis leakage | <.001 | |||
| No | 526 (93.4%) | 57 (75.0%) | 583 (91.2%) | |
| Yes | 37 (6.6%) | 19 (25.0%) | 56 (8.8%) | |
| Readmission | .435 | |||
| No | 512 (90.9%) | 67 (88.2%) | 579 (90.6%) | |
| Yes | 51 (9.1%) | 9 (11.8%) | 60 (9.4%) |
PS, permanent stoma.
P values in bold indicate significance.
The proportion of patients developing complications was lower in the group with permanent stoma (33.9%) compared to the group without (53.9%) (P = .001). However, serious complications (Clavien-Dindo III, IV) were more common in the PS group (30.3% vs 10.1%; P < .001), as was the rate of anastomotic leakage (25.0% vs 6.6%; P < .001). No significant differences were found in re-hospitalization or 30-day mortality rates between the groups.
The median length of stay was longer for the PS group (10 days, IQR 6–16) compared to the no-PS group (6 days, IQR 5–10) (P < .001). Pathological analysis revealed a higher tumor stage in the PS group (P = .046), while resection quality was better in the no-PS group (P = .027). No significant differences were noted between groups in terms of node stage (P = .405), mesorectum quality (P = .080), tumor regression (P = .393), or the number of positive (P = .391) or total lymph nodes harvested (P = .504). Adjuvant treatment rates were similar in both groups (P = .870) (Table 3).
Pathology findings in specimens resected in sphincter-sparing surgery. according to the presence of a stoma 2 years after surgery.
| Variables | No stoma, N = 563 | PS, N = 76 | Total, N = 639 | P-value |
|---|---|---|---|---|
| ypT-stage | .046 | |||
| pT0 | 74 (13.1%) | 10 (3.2%) | 84 (13.1%) | |
| pTis | 2 (0.4%) | 2 (2.6%) | 2 (2.6%) | |
| pT1 | 52 (9.2%) | 4 (5.3%) | 56 (8.8%) | |
| pT2 | 154 (27.4%) | 12 (15.8%) | 166 (26.0%) | |
| pT3 | 245 (43.5%) | 41 (53.9%) | 286 (44.8%) | |
| pT4 | 29 (5.2%) | 6 (7.9%) | 35 85.5%) | |
| pTX | 7 (1.2%) | 1 (1.3%) | 8 (1.3%) | |
| ypN-stage | .405 | |||
| pN0 | 382 (67.9%) | 48 (63.2%) | 430 (67.3%) | |
| pN1 | 130 (23.1%) | 17 (22.4%) | 147 (23.0%) | |
| pN2 | 45 (8.0%) | 10 (3.2%) | 55 (8.6%) | |
| pNX | 6 (1.1%) | 1 (1.3%) | 7 (1.1%) | |
| Resection type | .027 | |||
| R0 | 542 (96.3%) | 68 (89.5%) | 610 (95.5%) | |
| R1 | 17 (3.0%) | 7 (9.2%) | 24 (3.8%) | |
| Missing data | 4 (0.7%) | 1 (1.3%) | 5 (0.8%) | |
| Lymph nodes harvested* | 19 (14–25) | 20 (14–26) | 19 (14–26) | .504 |
| Positive lymph nodes harvested* | 0 (0–1) | 0 (0–1) | 0 (0–1) | .391 |
| Tumor regression grade | .393 | |||
| TRG0 | 80 (14.2%) | 10 (13.2%) | 90 (14.1%) | |
| TRG1 | 74 (13.1%) | 10 (13.2%) | 84 (13.1%) | |
| TRG2 | 88 (15.6%) | 12 (15.8%) | 100 (15.6%) | |
| TRG3 | 55 (9.8%) | 12 (15.8%) | 67 (10.5%) | |
| TRG4 | 6 (1.1%) | 2 (2.6%) | 8 (1.3%) | |
| Missing data | 14 (2.5%) | 3 (3.9%) | 17 (2.7%) | |
| Adjuvant treatment | .870 | |||
| No | 213 (37.8%) | 27 (35.5%) | 240 (37.6%) | |
| Yes | 336 (59.7%) | 47 (61.8%) | 383 (59.9%) | |
| Incomplete | 13 (2.3%) | 2 (2.6%) | 15 (2.3%) | |
| Missing data | 1 (0.2%) | 0 (0%) | 1 (0.2%) |
PS, permanent stoma.
P values in bold indicate significance.
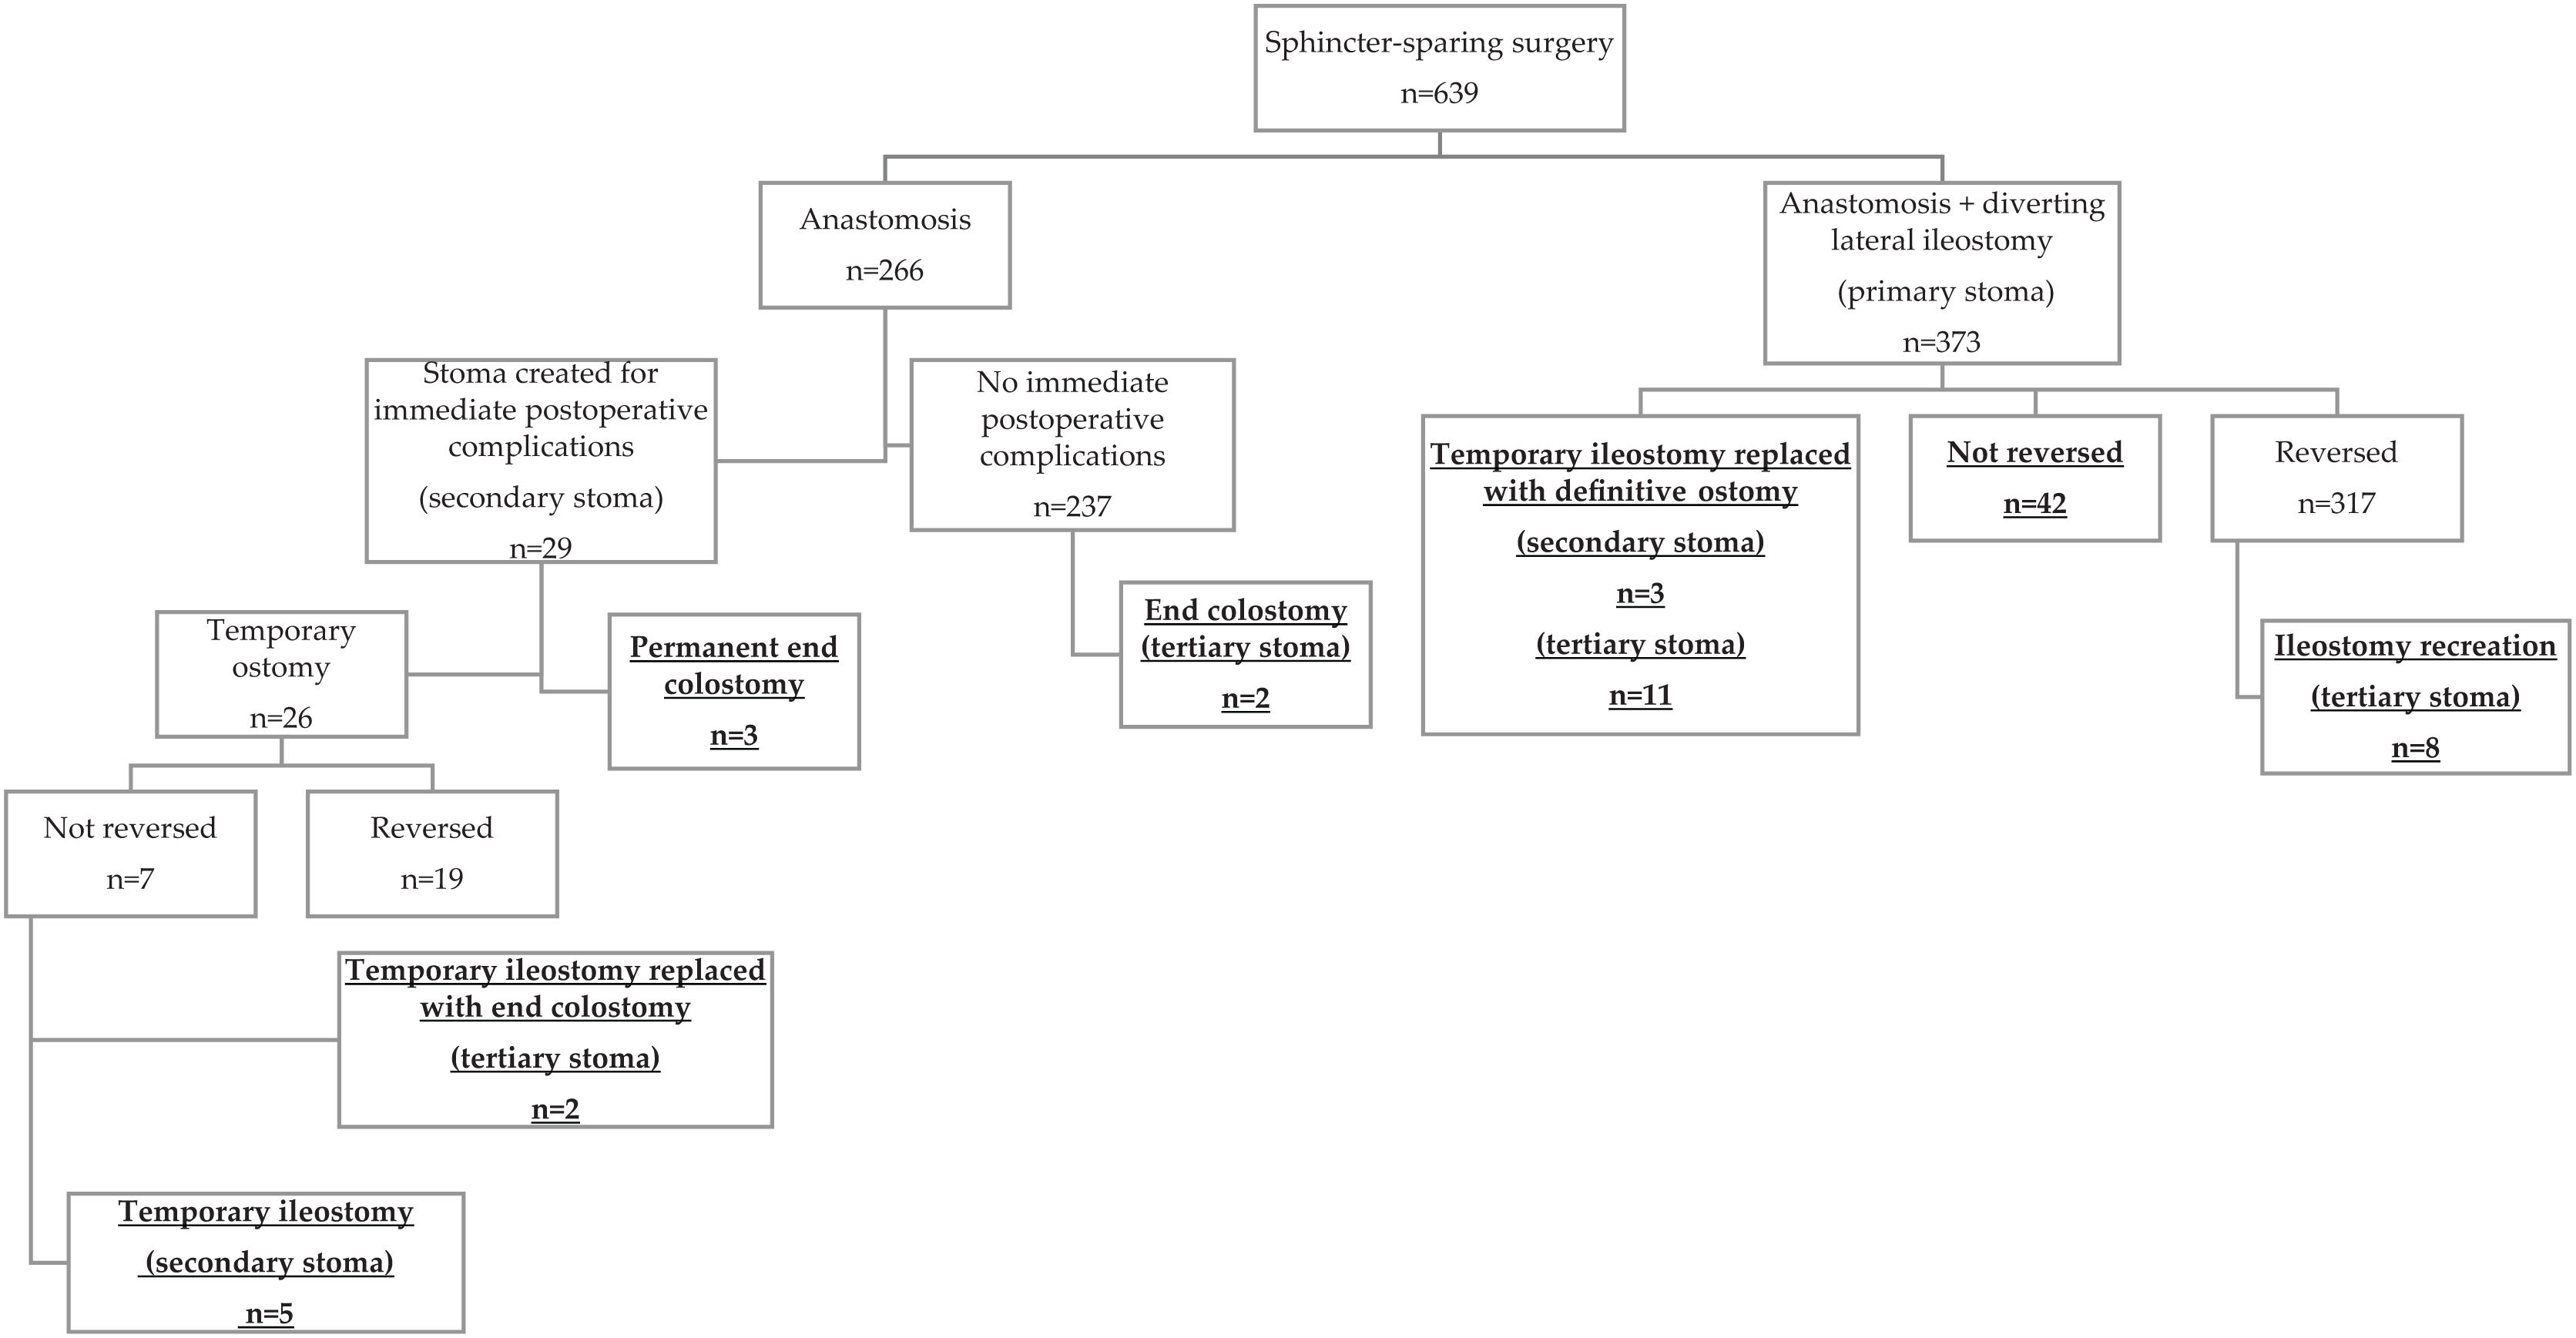
Fig. 2 illustrates the outcomes for patients with temporary ostomies 2 years post-initial surgery, indicating whether a permanent stoma was created (PS).
Among the 399 patients with temporary ostomies (373 primary and 26 secondary), 336 patients (84.2%) underwent tract reconstruction. The median time to reconstruction was 9.8 months (IQR, 6.6–13.3).
In 42 patients who did not have primary stoma reversal, the reasons included disease progression (22 cases, 52.4%), patient decision (8 cases, 19.0%), anastomotic complications (3 cases, 7.1%), other pathology-related complications (5 cases, 11.9%), being on a waiting list (2 cases, 4.7%), and unknown reasons (2 cases, 4.7%).
Fourteen patients transitioned from temporary stomas to definitive ostomies. Three patients required secondary definitive stomas due to anastomotic leakage, while 11 patients required tertiary stomas due to chronic local complications, issues with protective ileostomies, complications during closure surgery, or to improve quality of life due to cancer progression.
Among patients with secondary temporary stomas, 73.1% had their stoma closed, while 26.9% did not. The cases without closure included 2 patients requiring permanent colostomies due to anastomotic leakage and 5 patients who still had their stomas at the 2-year follow-up (one due to disease progression, one due to patient decision, and 3 due to anastomotic complications). For primary stomas, 317 patients (85%) had their stomas closed, but 8 required stoma recreation due to various complications.
Fig. 3 displays Kaplan-Meier curves for diverting ostomy reversal rates stratified by stoma type, postoperative anastomotic leakage, and adjuvant treatment indications. No significant differences were noted in ostomy reversal rates between primary (85.0%) and secondary ostomies (73.1%) at the 2-year follow-up (P = .110). However, significant differences were found concerning anastomotic leakage (No 86.3% vs Yes 69.4%; P = .002) and adjuvant treatment (No 84.4%; Incomplete 75.0%; Complete 84.4%; P = .011).
Developing the preoperative predictive modelThe logistic regression analysis to identify preoperative factors associated with PS included data from 620 patients (19 patients were excluded because of missing data). Variables in the univariate analyses included in the multivariate analysis (ie, those with P < .2) were male sex, ASA, tumor height, synchronous liver metastases, and synchronous lung metastases. The multivariate analysis identified the following variables as independent predictors of PS: synchronous liver metastases (OR: 2.71, 95% CI: 1.13–6.49; P = .025), synchronous lung metastases (OR: 7.05, 95% CI: 2.14–22.15; P = .001), tumor height (OR: 0.85, 95% CI: 0.82−0.95; P = .001) and male sex (OR: 2.16, 95% CI: 1.16–4.03; P = .016) (Table 4). The Hosmer-Lemeshow test indicated good calibration of the model (P = .747).
Univariate and multivariate logistic regression analysis of risk factors for having a PS 2 years after sphincter-sparing resection for rectal cancer.
| Variables | Univariate analysis | P-value | Multivariate analysis | P-value |
|---|---|---|---|---|
| OR (95% CI) | OR (95% CI) | |||
| Sex | ||||
| Women | 1 | 1 | ||
| Men | 2.11 (1.16–3.80) | .014 | 2.16 (1.16–4.03) | .016 |
| Age (years) | 1.02 (0.99–1.04) | .158 | NA | |
| ASA | ||||
| I or II | 1 | |||
| III or IV | 1.78 (1.09–2.89) | .020 | NA | |
| Tumor height (cm) | 0.87 (0.81‒0.94) | <.001 | 0.88 (0.82‒0.95) | .001 |
| cT- MRI | ||||
| cTX | 1 | |||
| cT1 | 0.48 (0.05–4.70) | .532 | ||
| cT2 | 1.29 (0.41–4.10) | .662 | ||
| cT3 | 0.83 (0.28–2.48) | .736 | ||
| cT4 | 2.18 (0.67–7.08) | .197 | NA | |
| Synchronous metastases | ||||
| No | 1 | 1 | ||
| Liver | 2.78 (1.2–6.43) | .017 | 2.71 (1.13–6.49) | .025 |
| Lung | 8.68 (2.95–25.6) | <.001 | 7.05 (2.25–22.15) | .001 |
| Liver + lung | 1.74 (0.20–15.11) | .619 | 2.37 (0.25–22.53) | .451 |
| Other | 2.17 (0.24–19.74) | .491 | 2.11 (0.22–20.69) | .522 |
| Neoadjuvant treatment | ||||
| Incomplete | 1 | |||
| No | 0.22 (0.02–2.51) | .223 | ||
| Yes | 0.31 (0.03–3.53) | .348 | NA |
PS, permanent stoma; ASA, American Society of Anesthesiologists; MRI, magnetic resonance imaging.
P values in bold indicate significance.
The model predicted the presence of PS 2 years after the initial surgery with 25.7% sensitivity, 91.4% specificity, 28.8% positive predictive value, and 90.1% negative predictive value. The agreement of the model was 83.6%. The AUC was 0.689 (95% CI: 0.63−0.75). The internal validation of the model yielded similar results (AUC of 0.663 [95% CI: 0.57−0.72]).
Construction of a simple calculator to predict the risk of PS based on the multivariate modelWe created a simple scoring system including binary predictive variables (1 for male and 1 for type of synchronous metastases: liver, lung, both liver and lung, or other synchronous metastases, and 0 for women and 0 for patients without each synchronous metastasis) and continuous variable (tumor height in centimeters). The calculator is presented as an Excel sheet in the Supplementary Material.
DiscussionIn this retrospective, observational, multicenter study, we aimed to identify preoperative risk factors for having a stoma 2 years after sphincter-preserving anterior resection for rectal cancer. Our findings show that 11.9% of patients had PS at the 2-year mark. These PS were due to non-closure of primary diverting ileostomies, secondary stomas created for postoperative complications, or definitive stomas later required due to worsening disease or functional issues after restoration of intestinal continuity.
Our PS rate was slightly lower than the 14.4% reported in a study analyzing earlier data (2007–2015) from the Swedish Colorectal Cancer Registry17 and lower than the 48.7% reported in a study analyzing data (2003–2014) from patients who received a diverting ostomy during the initial surgery.20 In our series, the most common reason for not reversing stomas was disease progression, and the main reason for creating an end ostomy was anastomotic leak. These results are in line with reports by other studies.21
The presence of a diverting stoma helps alleviate the consequences of possible anastomotic complications22; moreover, patients generally prefer receiving temporary diverting stomas with the hope of restoring bowel transit rather than permanent end colostomies.23 However, when diverting stomas cannot be closed, they can cause complications such as dehydration or prolapse.24 In contrast, end colostomies are associated with fewer complications and are easier to handle.25
We observed no differences in the time to closure for primary and secondary stomas. Although postoperative complications prolonged hospital stays, our findings show that secondary stomas created to treat complications can be successfully closed in more than 70% of patients without posing a risk to them.
The preoperative factors that most strongly predicted PS in our study were synchronous liver or pulmonary metastases and male sex, followed by tumor height. These results partially corroborate the findings of previous studies, where metastatic disease was associated with higher risk of PS.6 In patients with synchronous metastases, adjuvant treatments, interventions to treat metastases, disease progression, and/or irresectability of their primary cancer often preclude stoma closure surgery.26
Previous studies have reported that male sex and older age are associated with PS.6,26,27 The fragility of older patients can lead to worse postoperative recovery.6 Moreover, the prevalence of functional sequelae after the restoration of continuity in this group of patients suggests that they might be less likely to benefit from temporary stoma creation. Compared to women, men generally have smaller pelvises and a higher risk of anastomotic leakage.28
Limited data exist on the role of tumor height as a predictor for PS. Most research has focused on low rectal tumors, complicating the assessment of tumor height as a risk factor. Only one study has identified tumor location as a predictive factor for PS.17 Additionally, the impact of tumor height may be linked to anastomotic leakage, as lower anastomosis is associated with a higher risk of leakage.29 In a large cohort from the Swedish Colorectal Cancer Registry, anastomotic leakage occurred in 7.5% of patients and was related to PS,30 indicating that patients with a higher risk of leakage also have an increased preoperative risk of PS. In our series, anastomotic leakage occurred in 8.8% of patients, with a significantly higher incidence in those who developed PS (25.0% vs 6.6%, P < .001). Furthermore, we found that anastomotic leakage and adjuvant treatment delayed temporary stoma closure. These findings partially align with those of Zhang et al.,21 who reported that anastomotic leakage delayed closure, while adjuvant treatment did not. Given that the median duration of adjuvant treatment is at least 6 months, the observed delay in our study is understandable.
In our study, ASA grade was associated with PS in the univariate analysis, but it did not remain significant after adjusting for other factors. Previous reports vary widely in the significance of ASA grade as a predictive factor for PS.6,20,28,31
Our study also identified significant differences in intraoperative variables between patients with PS and those without, including the type of anastomosis and the method used to create it. However, we attribute these findings to differences in the height of the anastomoses.
Postoperative factors associated with PS in our study were anastomotic leakage and postoperative complications; these findings are in accordance with those of other studies.6,20,21,25,26
The predictive model developed in the present study may be useful for identifying patients who are unlikely to require a PS (eg, patients with high rectal tumors and without distant metastasis, particularly women), but it has limitations in accurately predicting those who will need one. Refinement or the inclusion of additional variables will be necessary to enhance its predictive accuracy.
Other studies, such as those conducted by Back et al.17 and Li et al.,25 have also developed predictive models. However, due to differences in the populations studied and the variables used in each study, the variability in the results is considerable. As a result, many of the predictive models developed are not utilized in routine clinical practice.
Understanding the overall risk of PS and the specific risk associated with potential complications will empower patients to make more informed decisions. Moreover, surgeons need to know key factors associated with complications, such as challenges with colorectal anastomosis. Improving surgical techniques to reduce the incidence of anastomotic leakage will help decrease the rate of PS.
It is worth highlighting that, in many cases, the permanent stoma ultimately ends up being a diverting ileostomy rather than a terminal colostomy. This distinction is important, as a diverting ileostomy typically presents greater challenges in terms of management and more pronounced physiological repercussions compared to a terminal colostomy in the sigmoid colon. Unlike a colostomy, an ileostomy involves higher outputs, which can lead to more severe issues with dehydration and electrolyte imbalances. Additionally, patients with ileostomies may experience stricter limitations in dietary choices and lifestyle adjustments, which can further affect their physical and emotional well-being.
Previous studies, such as those published by Kang et al. and Silva et al, demonstrated that overall quality of life scores did not differ between patients who underwent a definitive colostomy and those who underwent sphincter-preserving surgery.32,33
The current study has several limitations, including a retrospective design. Furthermore, the indications for diverting stomas were not standardized; diverting stomas were created at the individual surgeon’s preference, potentially introducing selection bias. Decisions about whether to close an ostomy might also be influenced by information provided to the patient. Another limitation to consider is that the model has not been validated in a second population, which may affect its generalizability to other contexts or populations. In future studies, we plan to address this limitation by conducting the validation in an independent population.
Nevertheless, our analysis sheds light on modern practice in rectal cancer surgery and promises to help guide surgeons in daily clinical practice.
ConclusionsPreoperative risk factors associated with PS in patients undergoing sphincter-preserving anterior resection for rectal cancer include sex, tumor height, and synchronous liver or lung metastases. Surgeons should take these factors into consideration in planning surgery and should inform patients about the potential for ending up with a PS.
CRediT authorship contribution statementStudy conception and design: PP, SA-G, TG JG, GE, LC, FM.
Literature review: PP, N F, SA-G, TG JG, GE, EK, MR A-C, LC, FM.
Acquisition of data: PP, N F, SA-G, TG JG, GE, EK, MR A-C, LC, FM.
Analysis and interpretation of data: PP, SA-G, TG JG, GE, LC, FM.
Drafting of the manuscript: PP, LC.
Critical revision and final approval of the manuscript: PP, N F, SA-G, TG JG, GE, EK, MR A-C, LC, FM.
All agree to be held accountable for all aspects of the study.
As this is a multicenter study conducted at 6 referral centers, the manuscript includes 10 contributing authors.
EthicsEthical Approval: This study was approved by the Ethics Committee of the 6 hospitals and was carried out in accordance with the 1964 Helsinki declaration and its later amendments.
Due to the retrospective nature of the study, informed consent of the patients was not required because the study analyzed anonymous clinical data.
FundingsThis research did not receive any specific grant from funding agencies in the public, commercial, or not-for-profit sectors.
The authors declare that they have no conflicts of interest regarding the publication of this article.
The present study has not been a podium or poster meeting presentation.
We have followed the author guidelines in preparing the manuscript. The only section we did not fully comply with in the initial phase is the document’s word count. The explanation of the creation of the predictive model requires detailed development to adequately justify our findings. We leave it to your discretion whether we should shorten any section. However, we are concerned that reviewers may request this information later or even consider that our results are not adequately justified.
We thank our colleagues, from the 6 centers involved, who have collaborated to make this project possible.
John Giba reviewed the writing.