
La medida, evaluación y análisis del recurso-cama es una función del servicio de admisión y documentación clínica que supone un reto para la gestión de la hospitalización de agudos. Se propone analizar la gestión del recurso cama a través del diagrama de Barber y Johnson (DB&J) y el cálculo de la reserva latente, durante contingencias epidemiológicas en el Hospital Universitario Río Hortega.
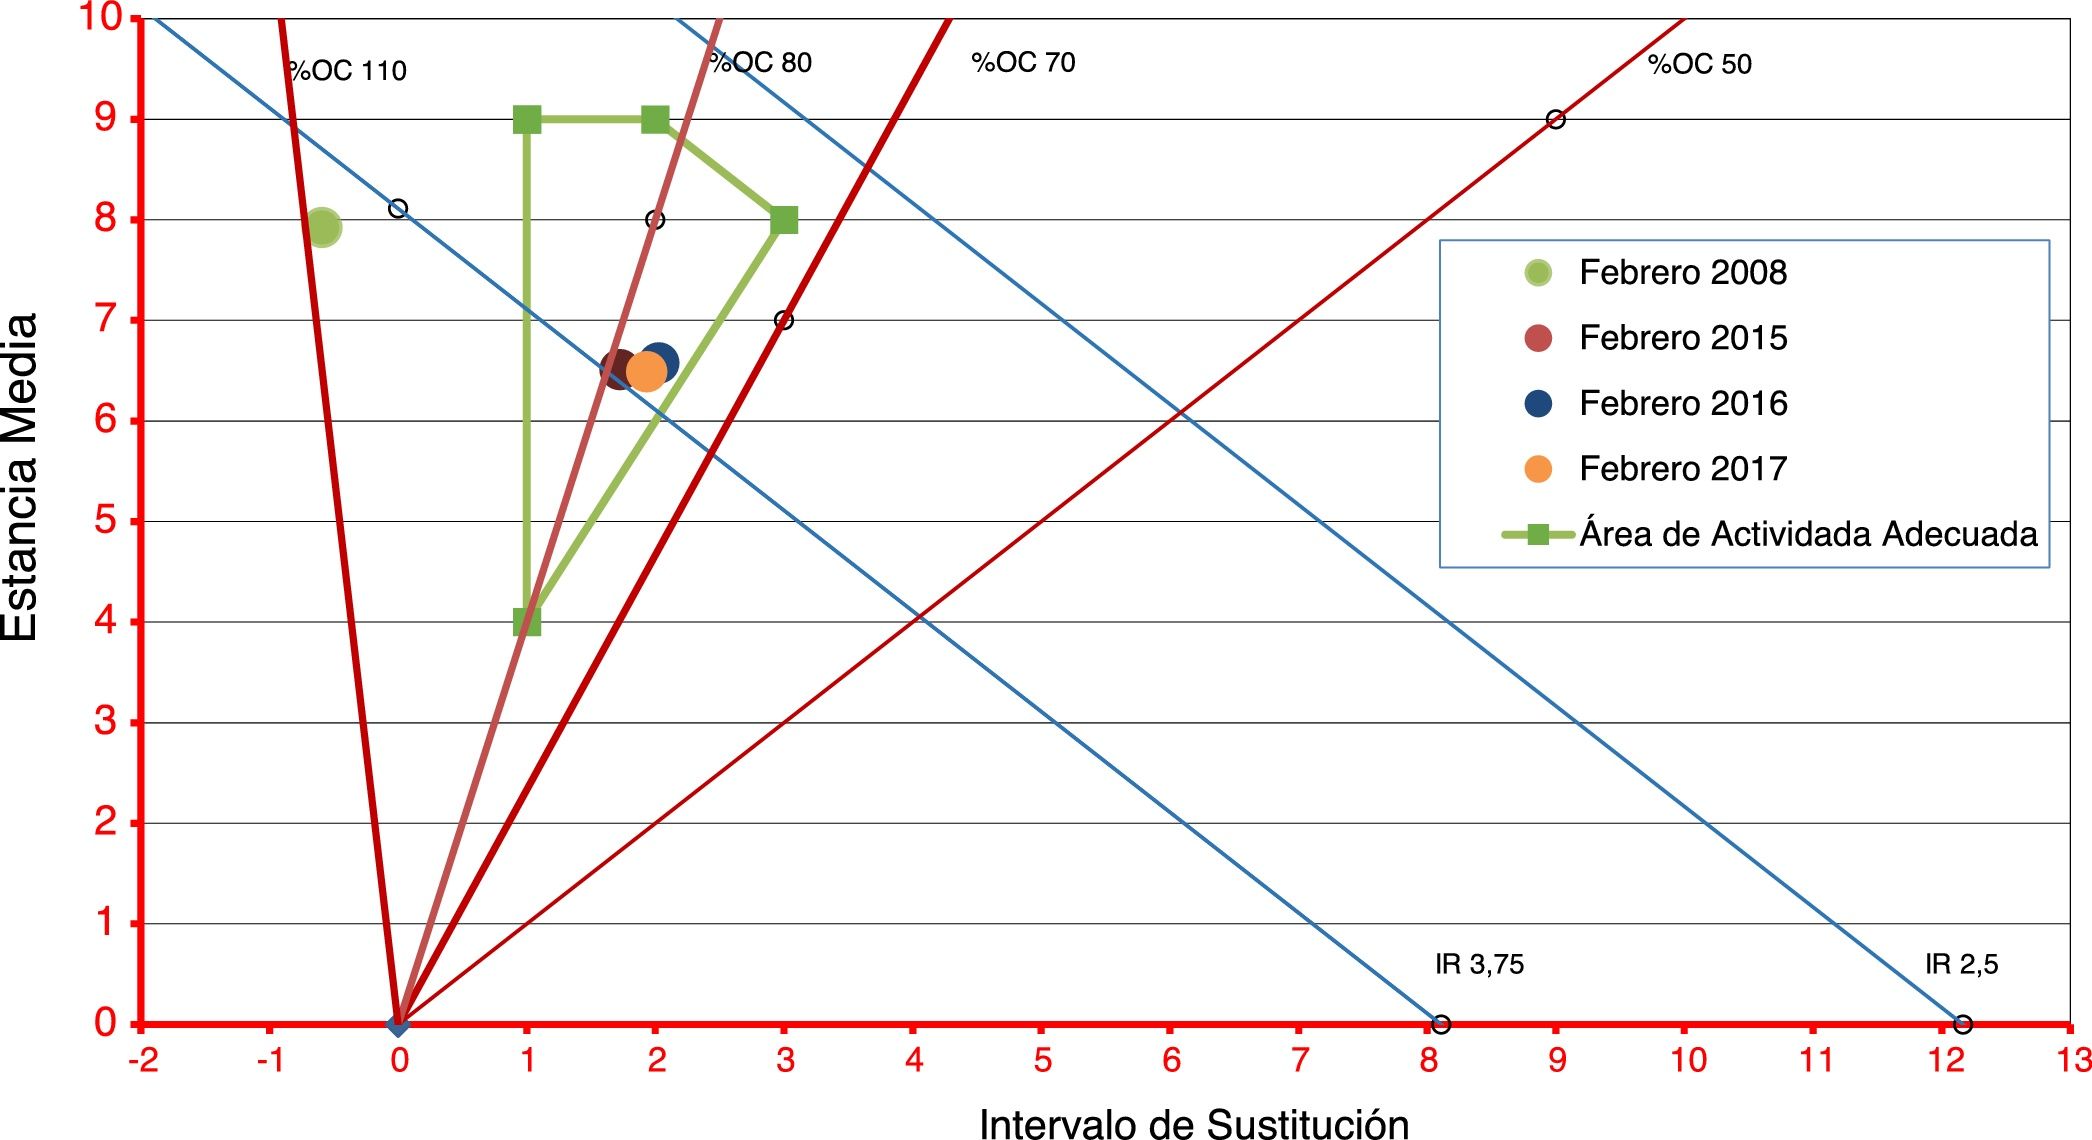
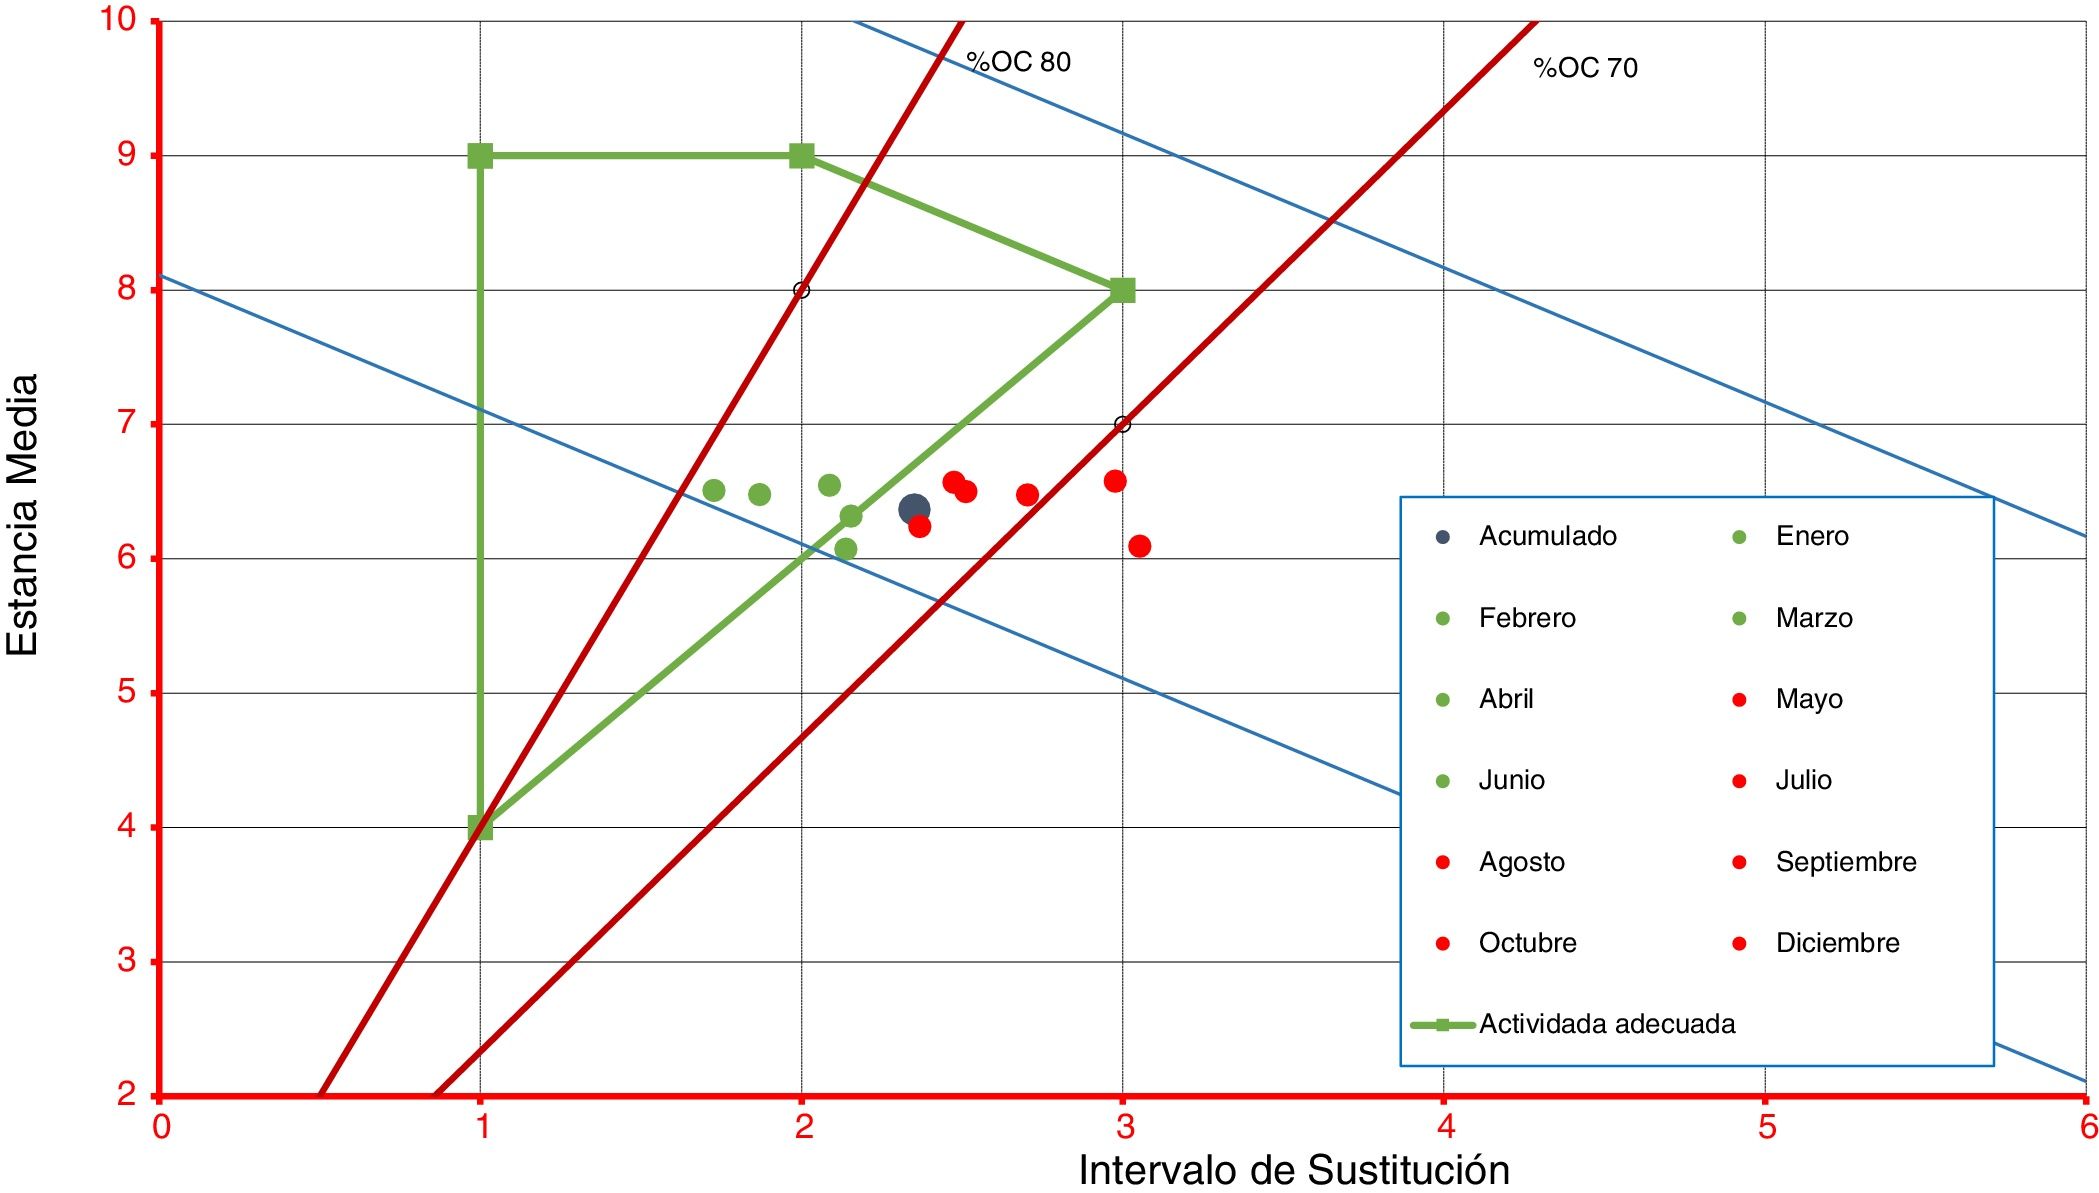
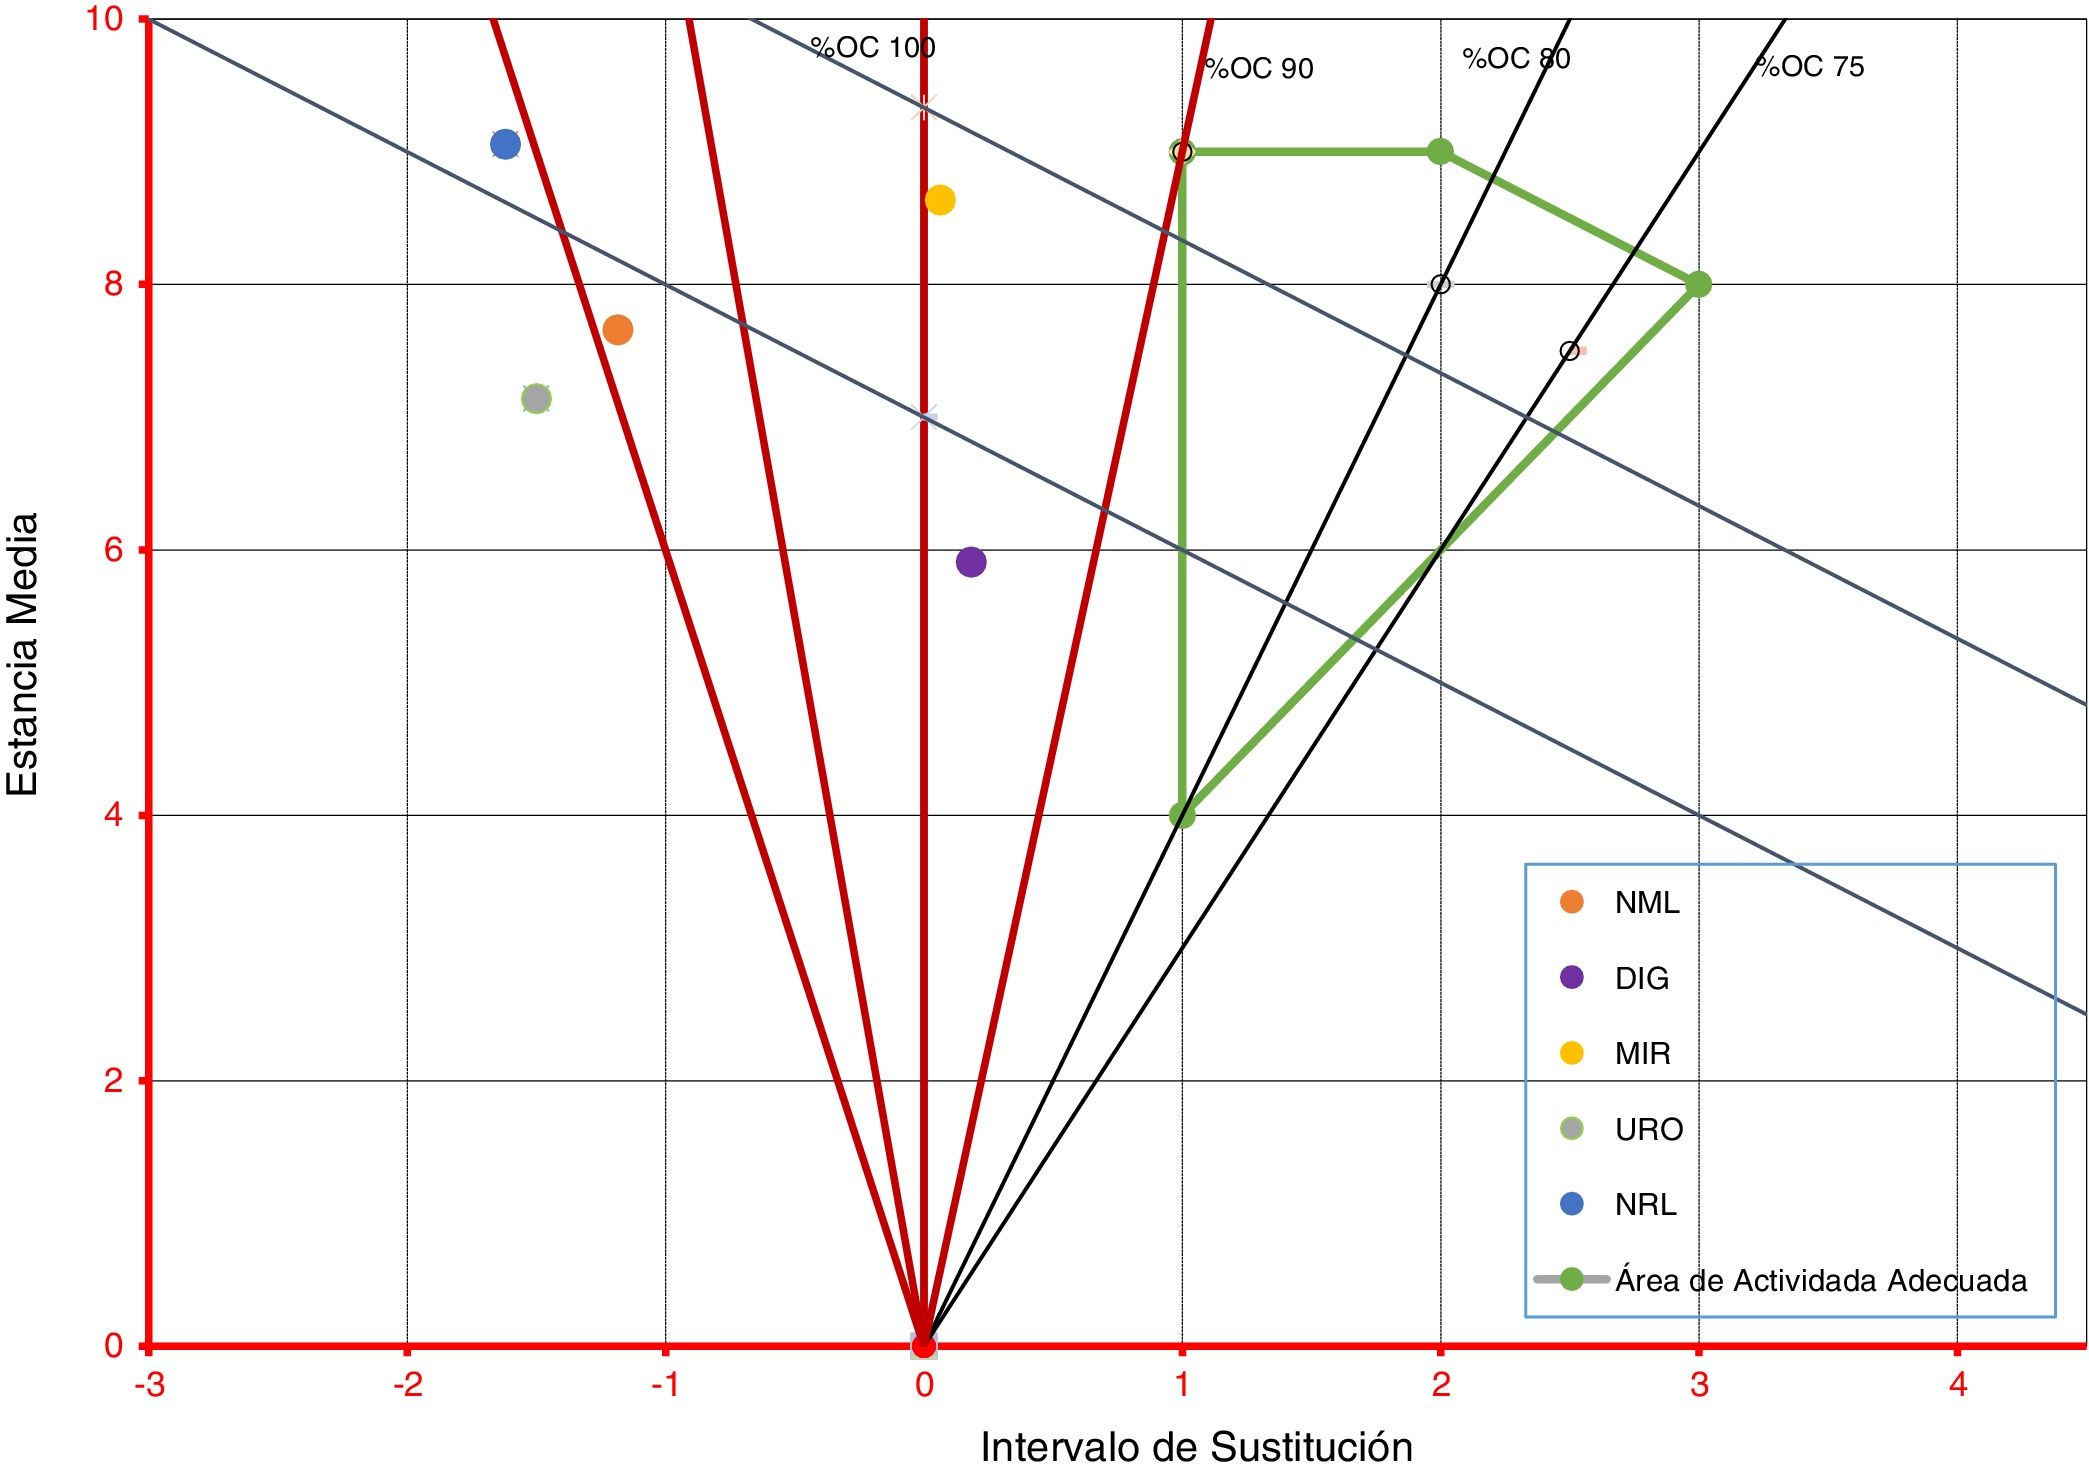
Materiales y métodosSe realizó un estudio retrospectivo de los indicadores de hospitalización desde el año 2008 a febrero 2017. Se construyó el DB&J para comparar la estancia media, el intervalo de sustitución, índice de rotación y la ocupación mensual y anual para todo el hospital y por servicios. Se calculó la reserva latente y manifiesta.
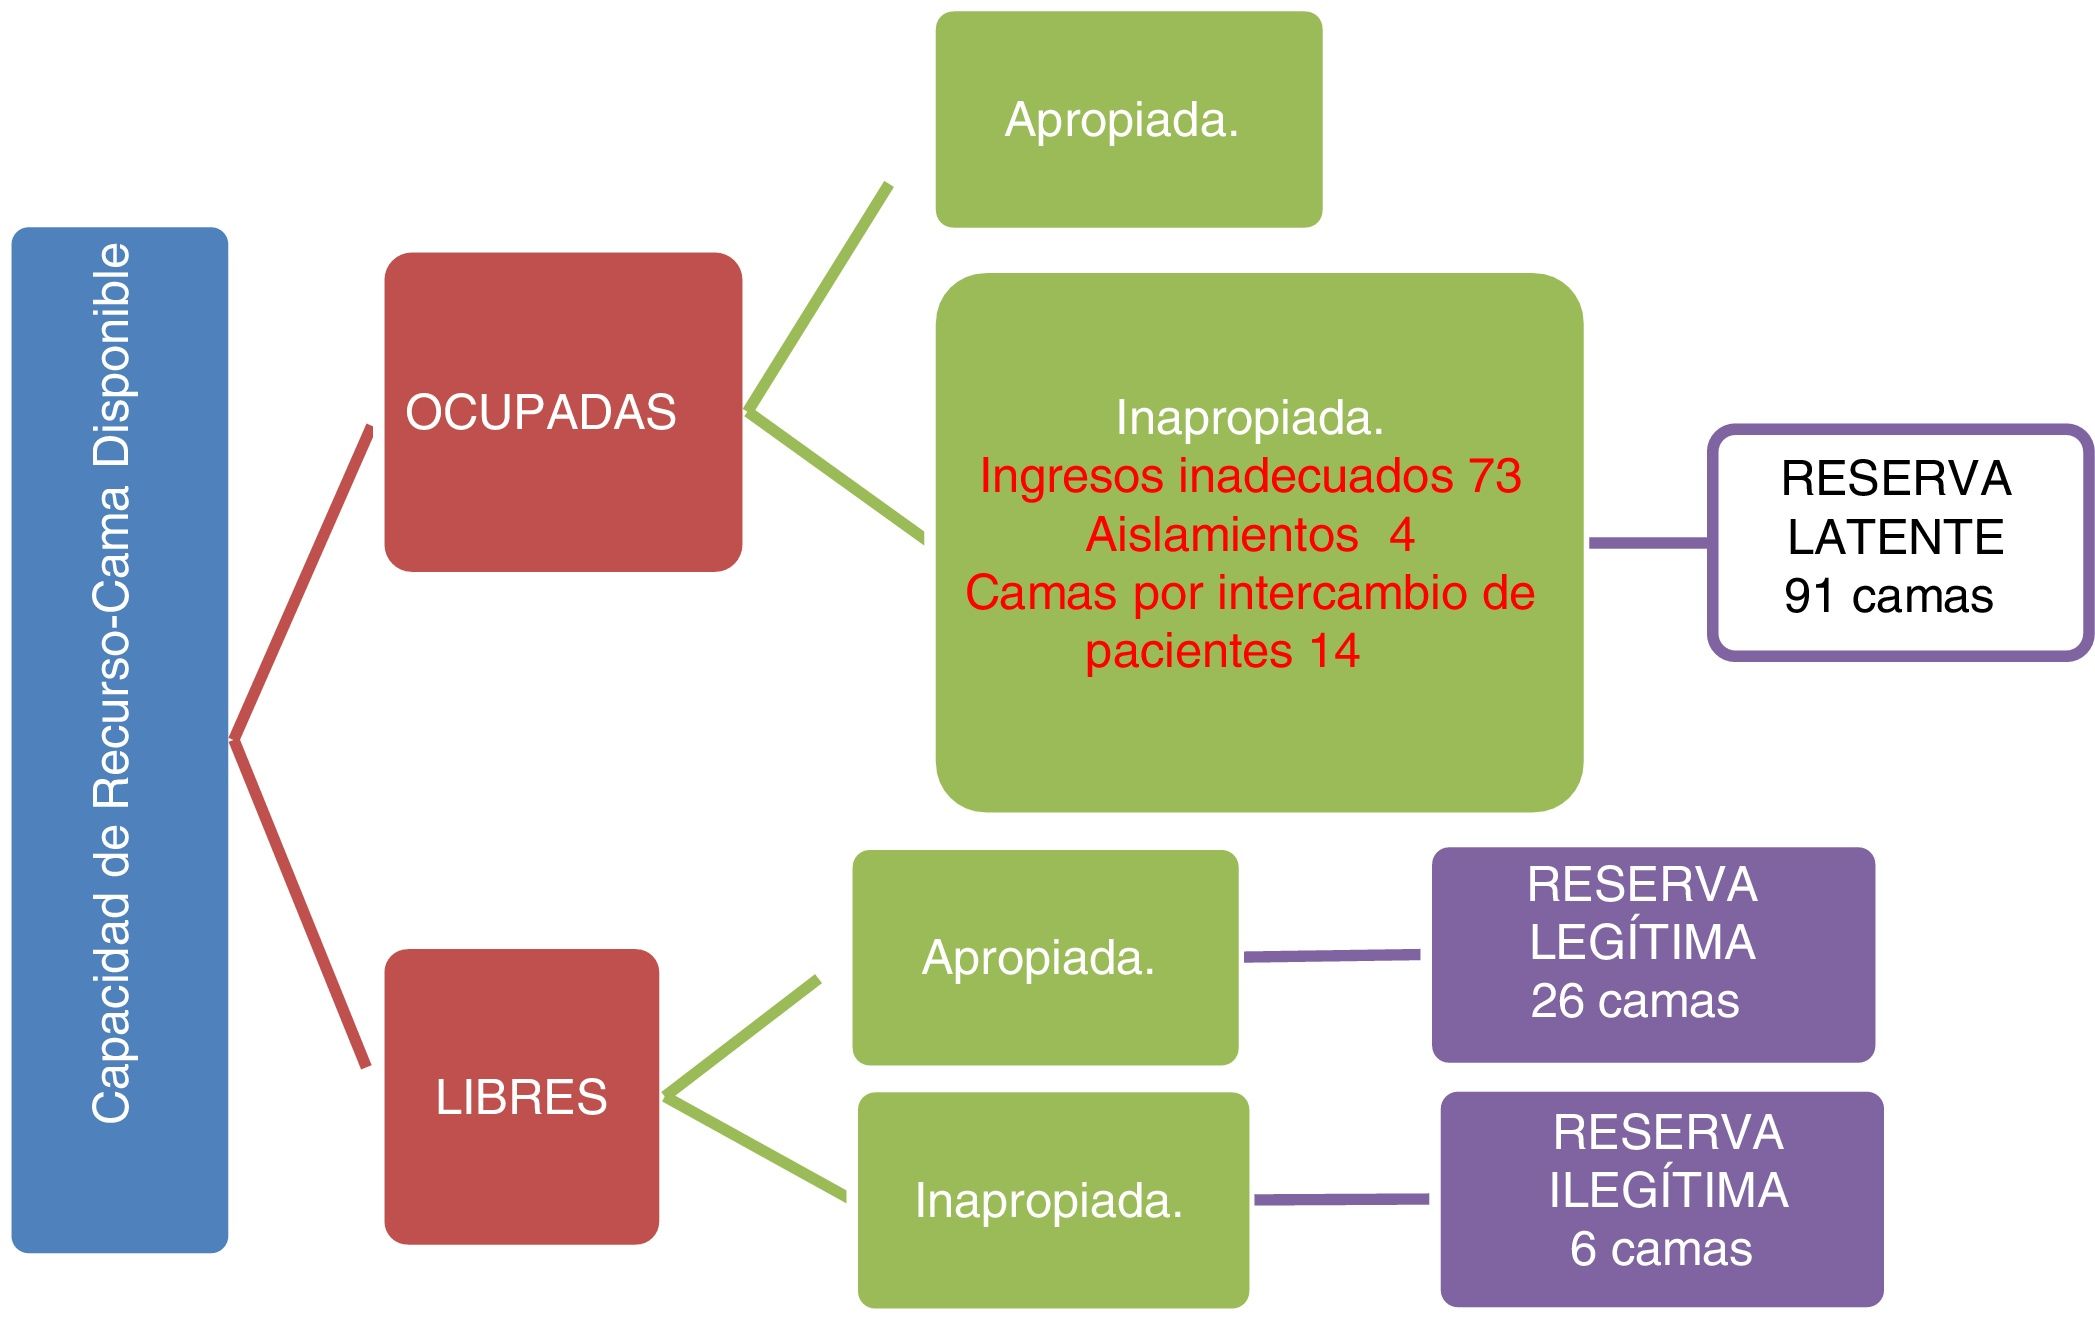
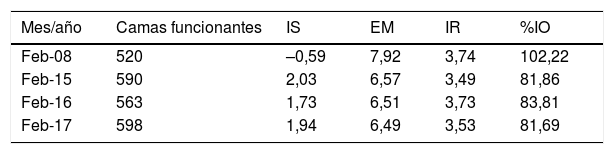
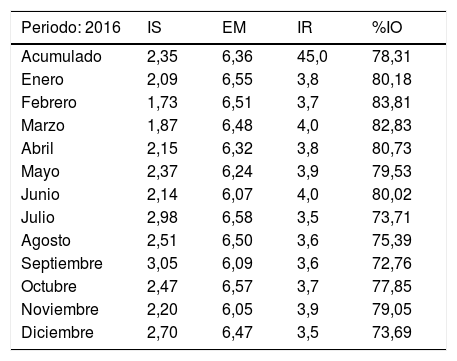
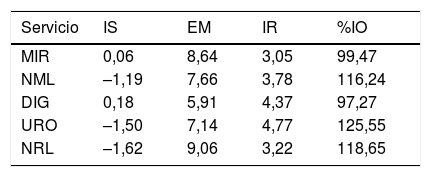
ResultadosEl DB&J mostró diferencias según el estado de ocupación del hospital y la dotación de camas funcionantes entre los años revisados y los enfoques utilizados. Una menor dotación de camas y EM más alta se correspondieron con aumento del %IO, disminución del IS y aumento de IR. El cálculo de la reserva latente evidenció que durante el tiempo entre un alta y un nuevo ingreso en la misma cama se podría disponer de 14 camas inapropiadamente ocupadas.
ConclusionesLa revisión de los indicadores de hospitalización y su integración en el DB&J, junto al cálculo de la reserva latente, podrían incluirse en el sistema de información hospitalario y tener un beneficio directo en la toma de decisiones en la gestión operativa de camas.
The measurement, evaluation and analysis of the bed resources are functions of the Admission and Clinical Documentation Department and are a challenge for the management of acute hospital admissions.The aim of the present study was to analyse the management of bed resources using the Barber and Johnson Diagram (B&J) and latent reserve, during epidemiological contingencies in the Hospital Universitario Río Hortega.
Materials and methodsA retrospective review was carried out on hospital admission indicators, from 2008 to February 2017, using the B&J diagram as a graphic tool to compare length of stay, replacement interval, turnover rate, monthly and annual occupancy rate for the hospital and services.The latent and manifest reserve was calculated.
ResultsThe B&J diagram showed differences in occupancy rate and provision of functional beds between the years reviewed and the approaches used. A lower provision of beds and higher length of stay corresponded with an increase in occupancy, decrease in replacement interval, and increase in turnover rate. The latent reserve showed that, between a discharge and a new entry into the same bed, 14 inappropriately occupied beds could be available.
ConclusionsThe review of the hospital admission indicators, their integration into the B&J diagram, and use of latent reserve could be included in the hospital information system and benefit the decision-making in the operational management of beds.