


Both the standardised hospital mortality index (SHMI) and Care Quality Commission (CQC) ratings are used by the National Health Service (NHS) to monitor performance in English hospitals. We assessed if staff thriving, the concept of vitality and learning at work, through application of the surrogate measures engagement and research activity is associated with more favourable hospital performance outcomes.
MethodsThis concerned a retrospective cross-sectional study using data for 129 English NHS hospital Trusts from the year 2019. Outcome measures were SHMI (linear regression, unstandardised coefficient beta) and CQC (binary logistic regression, odds ratio [OR]), whereas the independent variables considered were hospital location, degree of patient deprivation, research activity (drawn from National Institute for Health Research records and controlled for hospital size), and staff engagement scores (based on three survey questions corresponding to validated engagement factors).
ResultsStaff engagement accounted for over half of the 13% variance R2 for the whole model related to improved CQC rating (OR 13.75, p-value 0.002). Increased research activity was associated with a lower SHMI score (unstandardized beta −0.024, p-value 0.007, R2 5% for each point change in research activity quotient), but independently from the higher SHMI seen for Northern hospital Trusts (beta 0.063, p-value 0.003, R2 11.6%). The degree of patient deprivation did not influence SHMI or CQC outcomes in the regression models.
ConclusionIncreased staff thriving exhibits a modest, yet significantly, association with improved hospital performance; this was observed despite an underlying regional dichotomy in mortality rates.
In England, the performance of each National Health Service (NHS) hospital Trust – or hospital for short – is monitored closely by various organisational bodies and through use of different outcome measure tools. The Care Quality Commission (CQC) is an organisation independent from the NHS and they determine if a hospital is effective, well-led, caring, and responsive to people's needs.1 A hospital's mortality rates are expressed by the Standardised Hospital Mortality Index, which is the ratio between the number of patients who die following hospitalisation and the number that would be expected to die on the basis of the average in England.2 Hospital related outcome measures have been subject to criticism in the past.3–5 The use of SHMI, like other forms of standardised mortality indices, for measuring and comparing a hospital's performance is limited by many issues such as the fact that the majority of deaths are unavoidable.6,7 A difference in case mix and levels of deprivation (the latter not accounted for in SHMI) amongst populations hospitals serve, have also been suggested to hamper the usefulness of SHMI – particularly in terms of comparing scores between hospitals.2,6 Regional differences may come into play here – since England is almost bipolar in the distribution of deprivation, poor health status and (unstandardized) mortality – with the North being worse affected than the South.8
As Sauro and colleagues noted recently, ‘There is merit to soldiering on in our attempts to produce evidence and data to inform our pursuit of safer care for all’.9 Indeed, in recent years various variables related to staff behaviour and organisational culture have been shown to correlate with improved CQC rating and/or SHMI scores. Higher levels of staff engagement are linked to better CQC ratings and lower mortality.1,10,11 In addition, an interdependence between increased research activity and lower SHMI and better CQC rating, respectively, was observed.12 These variables have as of yet not been compared together to determine how they may interlink; furthermore, the potential impact of North–South England and deprivation on these variables have not been taken into account before. Therefore, the aims of this study were to conduct an association study to: determine if – when analysed together as a surrogate for staff thriving13 – staff engagement and research activity are associated with hospital performance by virtue of CQC rating and SHMI score.
MethodsEthics statementThis concerns a retrospective cross-sectional study involving data from 129 English NHS hospital Trusts (although the term hospital is used throughout the text, many NHS hospital Trusts manage multiple hospitals). All data used in this study is readily available to the public via NHS and NIHR electronic depositories. No personal identifiable information has been used as part of this study. Therefore, this is a service evaluation and no formal ethics-clearance was obtained.
Data sourcesCQC ratings were obtained from the CQC website; the latest published rating for each hospital was collated and included for analyses.14 All hospitals need to register with CQC, as it is the independent regulator of health and social care in England and failure to comply with monitoring and inspection activities conducted by CQC may result in registration being revoked.1,14 The ratings options are inadequate, requires improvement, good and outstanding (see Table 1 for distribution amongst hospital Trusts used in dataset). Binary ranking was devised for analyses, namely low ranking (n=59) and high ranking (n=70). As a controlled measure of mortality rates in hospitals, the SHMI was utilised.2
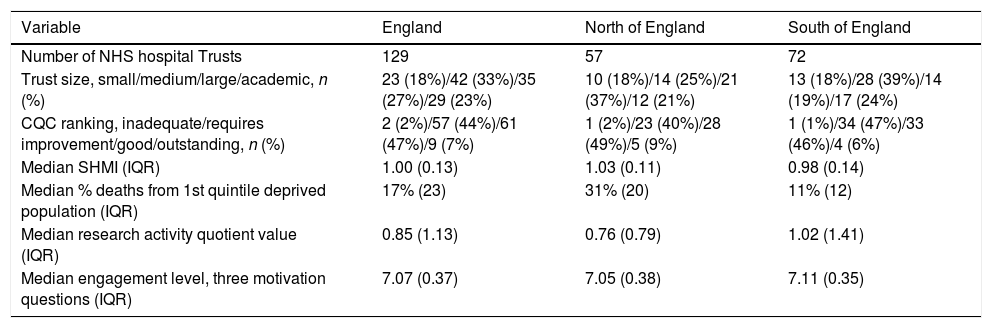
Characteristics of the English NHS hospital Trusts included in analyses.
| Variable | England | North of England | South of England |
|---|---|---|---|
| Number of NHS hospital Trusts | 129 | 57 | 72 |
| Trust size, small/medium/large/academic, n (%) | 23 (18%)/42 (33%)/35 (27%)/29 (23%) | 10 (18%)/14 (25%)/21 (37%)/12 (21%) | 13 (18%)/28 (39%)/14 (19%)/17 (24%) |
| CQC ranking, inadequate/requires improvement/good/outstanding, n (%) | 2 (2%)/57 (44%)/61 (47%)/9 (7%) | 1 (2%)/23 (40%)/28 (49%)/5 (9%) | 1 (1%)/34 (47%)/33 (46%)/4 (6%) |
| Median SHMI (IQR) | 1.00 (0.13) | 1.03 (0.11) | 0.98 (0.14) |
| Median % deaths from 1st quintile deprived population (IQR) | 17% (23) | 31% (20) | 11% (12) |
| Median research activity quotient value (IQR) | 0.85 (1.13) | 0.76 (0.79) | 1.02 (1.41) |
| Median engagement level, three motivation questions (IQR) | 7.07 (0.37) | 7.05 (0.38) | 7.11 (0.35) |
IQR=inter-quartile range.
The average SHMI value for each NHS hospital Trust for the year 2019 was obtained from NHS Digital.15 Unlike the Hospital Standardised Mortality Rate (HSMR), SHMI does not take into account a patient's deprivation status. To interrogate any influence of patient deprivation, the death percentages for the year 2019 amongst the patients in the highest deprivation quintile of each population served by an NHS hospital Trust were included as a variable in analyses.16 This figure effectively represents the proportion of all deaths within a hospital Trust that is contributed by the most deprived section of the population within that year.
Apart from differences in mortality according to degree of deprivation, previous research has also shown a regional difference in mortality in England.8 To take this into consideration, predefined Health Education regions were used to divide England into two approximately equal halves, and this approach has been used previously: North (North East and Yorkshire, North West, West Midlands); and South (East of England, South West, London, South East).8,17 This results in 72 Southern and 57 Northern NHS hospital Trusts; it is recognised that it is more of a diagonal split with the ‘South’ primarily meaning the South East and London. Table 1 summarises the hospital Trusts and their characteristics, and also stratifies it by regional area. NIHR research activity was obtained from the NIHR Open Data Platform website and the methodological approach from a previous study was utilised again here.12 The total number of patients recruited into interventional studies for the year 2018–2019 was divided by the total headcount number for doctors in each of the hospitals as of January 2019.17,18 This was done to control for differences in hospital size, and results in a research activity quotient.
To measure staff engagement, the ‘motivation’ section of a validated survey measure (Utrecht Work Engagement Scale, UWES-9) was applied.19 These are measured in the NHS National staff survey through Likert scale responses, and it concerns the questions regarding dedication (“I am enthusiastic about my job”), absorption (“time passes quickly when I am working”), and vigor (“I look forward to going to work”).11 The mean scores for each member of staff across all three questions is aggregated into a Trust level workforce ‘engagement score’ used in the present study.20,21
Statistical analysisData was collected in Excel and statistical tests run using SPSS v24. Spearman correlation analyses were performed to assess individual relationships between ordinal and continuous variables. For binary logistic regression, with CQC as the dependent, Cox & Snell R2 value reported. Multiple linear regression analysis was performed when SHMI was the dependent. For the staff engagement, values were multiplied by 10 to control for high beta coefficients; this did not change the significance of any associations identified or variance R2 values. A p-value of <0.05 was considered statistically significant.
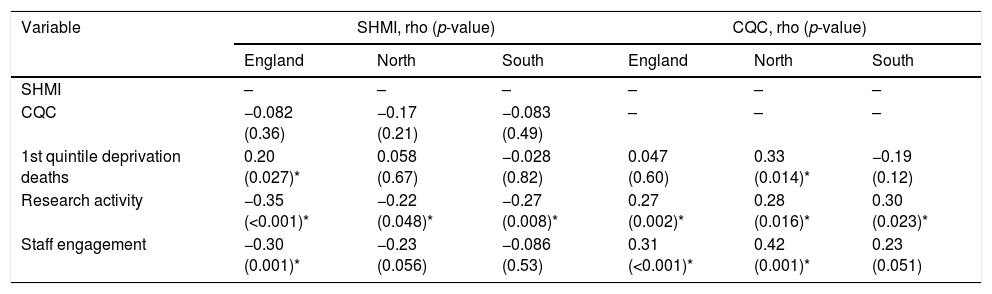
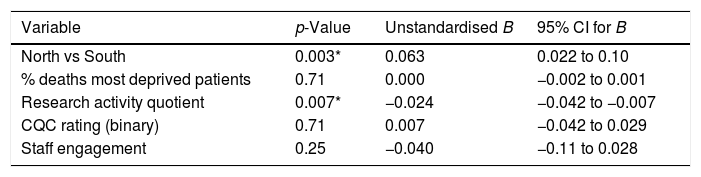
Results.Table 2 shows how certain variables are related to each other when only two were considered at one time. Being a binary independent variable, North and South regions were used for stratification. At first the degree of patient deprivation appears to be associated with increased SHMI when England as a whole is considered. However, this is a dichotomous pattern based on the North and South regions; when regions are considered individually, deprivation does not correlate with an increase in hospital mortality as measured with SHMI. Linear regression was applied to determine the variables associated with SHMI, see Table 3. The regression model explained 18.8% of SHMI variance; within this, the North vs South factor contributed 11.6% and research activity 5% (for each point change in research activity quotient, i.e. this contribution can be higher for some more research-active NHS Trusts). This confirms that it is the North–South divide as a whole that drives the difference in SHMI, rather than the difference in deprivation between these two regions – meaning that ‘baseline level’ research activity differs in the North and South of England but nevertheless contributes independently to a difference in SHMI regardless of a hospital's location in England (see Tables 2 and 3, and Fig. 1). Increased staff engagement is linked to a lower SHMI to a lesser degree than seen for research activity and this positive association is mainly observed for the North of England (Tables 2 and 3).
Spearman analysis to assess association between different variables.
| Variable | SHMI, rho (p-value) | CQC, rho (p-value) | ||||
|---|---|---|---|---|---|---|
| England | North | South | England | North | South | |
| SHMI | – | – | – | – | – | – |
| CQC | −0.082 (0.36) | −0.17 (0.21) | −0.083 (0.49) | – | – | – |
| 1st quintile deprivation deaths | 0.20 (0.027)* | 0.058 (0.67) | −0.028 (0.82) | 0.047 (0.60) | 0.33 (0.014)* | −0.19 (0.12) |
| Research activity | −0.35 (<0.001)* | −0.22 (0.048)* | −0.27 (0.008)* | 0.27 (0.002)* | 0.28 (0.016)* | 0.30 (0.023)* |
| Staff engagement | −0.30 (0.001)* | −0.23 (0.056) | −0.086 (0.53) | 0.31 (<0.001)* | 0.42 (0.001)* | 0.23 (0.051) |
Linear multiple regression with SHMI rating as dependent.

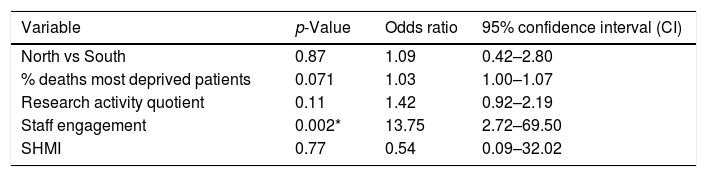
Table 4 shows the results for the regression model for CQC, with all variables included in the model explained 13%; the only significant variable, staff engagement, by itself contributed 58% (i.e. R2 of 7.6%) to the variance. On its own, in the Spearman analysis in Table 2, an increase in research activity appears to be linked with an improvement in CQC rating but this putative link was no longer significant in multiple regression analysis (Table 3). Table 2 and Fig. 2 illustrate that the significant link between staff engagement levels and higher CQC rating are seen primarily in the North of England; in the South, engagement levels in lower ranked hospital Trusts are as high as in the highly ranked ones.
Binary logistic regression with CQC rating (sub-optimal versus optimal performance) as dependent.
| Variable | p-Value | Odds ratio | 95% confidence interval (CI) |
|---|---|---|---|
| North vs South | 0.87 | 1.09 | 0.42–2.80 |
| % deaths most deprived patients | 0.071 | 1.03 | 1.00–1.07 |
| Research activity quotient | 0.11 | 1.42 | 0.92–2.19 |
| Staff engagement | 0.002* | 13.75 | 2.72–69.50 |
| SHMI | 0.77 | 0.54 | 0.09–32.02 |

Determining a causal interaction between a variable and a complex outcome measure such as quality of care provision (through CQC rating) and/or mortality (through SHMI) in hospitals is challenging and therefore a recognised study constraint.3–6 However, despite these challenges there are certain NHS staff (and organisational) behaviours that have been shown to associate – sometimes through different methodological approaches – favourably with better CQC rating and lower SHMI. In this present study, using data focused on the year 2019, higher levels of staff engagement and increased clinical research activity link with a higher CQC rating and lower SHMI score respectively. The higher prevalence of deprivation in the North of England does not account for the higher average SHMI with the methodology used in this present study. An average lower level of research activity in the North of England may partly explain why SHMI scores are on average higher in that part of England when compared to the South, since an increase in research activity still shows a near-identical correlation with a reduction in SHMI – regardless of the ‘baseline’ of the latter – suggests that clinical research may have a true wider impact on hospital performance. For the association between staff engagement and CQC rating, like for clinical research activity, it appears that ‘baseline’ engagement levels are lower in the North and an improvement in engagement in turn is associated with an improved CQC rating. The results obtained for research activity and its association with better hospital performance outcome measures match those observed previously using a similar methodology.12 There, just like in the present analyses, clinical research activity was associated more strongly with SHMI than CQC. Where in the past the average from five years of research activity was considered as a quotient for each hospital Trust, here only a single year was considered – in conjunction with the analysis of other variables – and SHMI still associates significantly with the research activity quotient.
Caution is warranted when interpreting the results obtained in this cross-sectional study. Due to the retrospective approach and lack of an intervention or control cohort, only association or putative links – rather than causation – can be drawn from the results obtained in the analyses. A recent analysis of solely staff engagement and SHMI showed that the significant association between high levels of engagement and low levels of mortality are bi-directional, illustrating the complex nature of staff behaviour and clinical outcomes.11 The results of the analyses rely on the quality of the data that make up the variables. SHMI scores, CQC ratings, staff survey outcomes, research activity, deprivation scoring based on postcode, and hospital staff numbers each have their own limitations, some discussed in detail by other researchers.3,5,6,9,12 The use of one of three elements of the UWES-9 engagement scale, on the basis of available data from the NHS staff survey, is sub-optimal despite evidence that the motivation element of UWES-9 is informative by itself and the strongest determinant for staff engagement levels.1,19 The CQC rating is a complex outcome measure drawn from various data, and a degree of common method bias may occur since SHM and national NHS staff survey data, albeit along with a plethora of other measures, feed into CQC ratings. For example, the final aggregate CQC score is itself an average of five aggregate domain score, titled Safe, Effective, Caring, Responsive and Well-led. There are then potential issues around the weighting for each element as part of the total aggregate score, plus there may be inconsistencies in the quality of the CQC inspections themselves.30
The multifactorial nature of both outcome measures may explain why CQC and SHMI by themselves are not significantly associated with each other in our current analysis (see Table 2). For SHMI, a lack of accounting for deprivation has been mooted as a drawback versus e.g. Hospital Standardised Mortality Rate.2–4 Hence deprivation was included in our analyses to check if this may impact on the association between the thriving elements, engagement and research activity and the hospital performance outcome measures. There are many other factors involved in driving SHMI scores, and clinical research activity is merely one element that may aid in bringing down mortality rates. It has been noted before that SHMI scores are possibly lower in London-based hospitals and higher in those based in the North West of England due to a difference in case mix.6 Although we earlier touched upon potential factors that may influence research activity between North–South England, and these may conceivably impact on SHMI directly too, it is beyond the remit of this study to extrapolate what drives this North–South difference in SHMI. From the perspective of the geographical difference in mortality in England,8 however, our data suggest that SHMI may not be sensitive to differences in degrees of deprivation between NHS hospital Trusts.
More patients in the South of England are enrolled into interventional research studies such as clinical trials involving medicinal products, when compared to the North of England. This may not necessarily be because of more clinical staff being available in Southern hospitals; since a quotient was used in the analyses, having more clinical staff would actually equate to being a handicap since it forms the denominator for the research activity quotient. Staff thriving, through increased engagement levels and the research activity may influence hospital outcomes measures. We previously showed that patients in more research active hospital Trusts have more confidence in clinical staff and feel better informed about, for example, the medication they were prescribed.22 There are however wider factors at play. These may include e.g. access to charitable funds; 20% of expenditure is allocated to research and the hospitals with the largest charitable accounts are based in London, or close collaborations between hospitals and Universities.23,24 To illustrate the point, research grant income for Universities located in the South of England for the year 2019 totalled £3.7 billion whereas for those in the North it came to £1.7 billion; four out of five Universities with – by far – the highest grant income are based in the South.25 The NIHR, through its network of 15 Clinical Research Networks (CRNs) which aid in delivery of clinical research in England, is well placed to continue to tackle any historic ‘postcode lottery’ when it comes to health research. Their remit is to ensure that patients across England are given the opportunity to participate in high quality clinical trials even if they may have been developed in the South of England.26 There is scope for improvement yet, since the top performing CRN was the region South London which recruited 5.6 patients per 1000 population in 2018–2019 into interventional studies, compared to the least active CRN North West region where the region was 1.2.18
With regards to staff engagement, our results regarding the positive relationship between increased staff engagement and better CQC rating, echo those observed by West & Dawson and Wake & Green.1,10 Recently, a significant but modest multi-directional association between staff engagement and SHMI was also identified using the three questions (focusing on motivation through sub-elements dedication, absorption and vigour) used in this present study for which the data was drawn from the NHS national staff survey.11 In relation with research and staff, Rees and Blackwell reported that medical posts with an academic element incorporated attracted more applicants, which in turn may result in employment of more talented staff .31
Based on the results obtained in this study and previous work,1,10–12,21 there should be benefit to hospital Trusts and other healthcare organisations to foster an environment where staff can thrive.27 Due to the complexities involved in healthcare provision, gold standard approaches to assess how engagement or clinical research may impact on a hospital's performance – such as by means of prospective randomised controlled trials – are not always an option. One candidate mode of action for achieving increased hospital performance by improving research activity and staff engagement is to measure thriving in the workplace in more detail, focusing on vitality (including engagement) and learning (including involvement in research).13 A pragmatic approach may shed light on possible mechanisms in which staff behaviours and organisational change may improve patient outcomes in hospitals. A stepped wedge trial design has in the past been used to show a reduction in mortality through the implementation of surgical checklists.28 At a departmental level, Hendricks and colleagues demonstrated that allowing clinical staff to become more involved in local strategy, plus the implementation of action research methodology, resulted in more positive feedback from staff and improved clinical outcomes.29
ConclusionsThis present study, which takes the North–South divide and deprivation levels into account, confirms earlier work showing significant associations between staff engagement, research activity, SHMI and CQC. Any potential for synergistic effect of engagement and clinical research activity, as well as other behaviours which fit under the term thriving and its components vitality & learning, should be explored to optimise the positive staff behaviour and accompanying hospital performance.
Data availability statementThe data that supports the findings of this study are available in the supplementary material of this article.
Funding disclosureNone to declare.
Conflicts of interestBoth LJ and SJF are in receipt of NIHR funding through their regional Clinical Research Network for delivery of NIHR national portfolio studies. RB has not conflicts of interest to declare.
articles

www.publicationethics.org.