


The structural and electrical properties of K0.48Na0.52Nb1−xZrxO3−δ (x=0–0.04) ceramics prepared by the conventional solid-state reaction method were studied. Pellets with composition x≤0.03 sintered at 1125°C for 2h showed single-phase of potassium sodium niobate (KNN) perovskite structure. Based on X-ray diffraction and Raman results, a mixture of orthorhombic and monoclinic phases was observed in intermediate compositions. The addition of Zr improved the sinterability and the “hard” piezoelectric properties of KNN, increasing the Ec and Qm values. The composition with x=0.03 presented the highest permittivity at room temperature, ɛr′=363 and the lowest dielectric losses, tanδ=0.027. Moreover, it was the sample with the highest Qm and d33 values, with Qm=1781 and d33=82pC/N. It was therefore the best compositions to obtain a “hard” piezoelectric material based on Zr-doped KNN, which makes it promising candidate for use as “hard” lead-free piezoelectric material for high power applications.
Se estudiaron las propiedades estructurales y eléctricas de cerámicas basadas en K0,48Na0,52Nb1−xZrxO3−δ (x=0-0,04) preparadas por el método convencional de reacción en estado sólido. Las pastillas sinterizadas a 1.125°C durante 2h con composición x≤0,03 mostraron una estructura monofásica de perovsquita del óxido mixto de niobio, potasio y sodio (KNN). Según los resultados de difracción de rayos X y Raman, se observó una mezcla de fases ortorrómbica y monoclínica en las composiciones intermedias. La adición de Zr mejoró la sinterización y las propiedades piezoeléctricas «duras» de KNN, aumentando los valores de EC y Qm. La composición con x=0,03 presentó la mayor permitividad a temperatura ambiente (ɛr′=363) y las menores pérdidas dieléctricas (tanδ=0,027). Además, fue la muestra con los valores más altos de Qm y d33, con Qm=1.781 y d33=82pC/N. Por tanto, esta fue la mejor composición para obtener un material piezoeléctrico «duro» basado en KNN dopado con Zr, lo que le convierte en un candidato prometedor para su uso como material piezoeléctrico «duro» sin plomo en aplicaciones de alta potencia.
The most extensive and important piezoelectric compositions, based on the lead zirconate titanate (Pb(Zr,Ti)O3, PZT), contain more than 60wt% of lead. Due to the high toxicity of lead to human health and the large number of environmental regulations implemented to avoid contaminations, it is essential to search for new piezoelectric materials. Lead-free ferroelectric materials have become very attractive from the standpoint of providing a solution to environmental problems.
Over the last decade, sodium potassium niobate (KNN) based materials have attracted much attention among the most promising candidates to replace lead-based piezoelectric materials. KNN is a solid solution of ferroelectric KNbO3 and antiferroelectric NaNbO3[1], showing a very high Curie temperature (Tc=420°C). However, the dielectric and piezoelectric properties of pure KNN are relatively low (d33=80pC/N) compared to that achieved with PZT-based compositions. Moreover, it is very difficult to obtain dense and well-sintered KNN ceramics by conventional solid-state sintering methods, which makes it very difficult to replace the established PZT with KNN.
Since the publication of a paper by Saito et al. [2], where high d33∼416pC/N was obtained in textured KNN-based ceramics due to its outstanding piezoelectric and ferroelectric properties, numerous studies have been carried out using this material [3,4], an early example of those being the European project LEAF [5]. These lead-free materials are required to replace PZT ceramics, for example, in high power applications, such as transformers or ultrasonic motors, and high-intensity focused ultrasound driven by piezoelectric materials need “hard” piezoelectrics with a high mechanical quality factor (Qm) and low dielectric loss to deliver high acoustic power without excessive heat generation and/or thermal runaway. For these applications, KNN-based material also seems to be a promising candidate [1,3,4,6,7].
The preparation of dense ceramics based on (K,Na)NbO3 (KNN) depends strongly on the characteristics of the starting powder, methods of synthesis to ensure stoichiometric control, sintering temperature, etc. During the sintering process, it is difficult to achieve the ideal densification of pure KNN ceramics due to the high volatility of K2O and Na2O and the difficulty of sintering an elaborate body. Different studies were conducted to analyse the dependence of the Na/K ratio on the electrical properties of this material, as well as the optimum excess of these alkaline ions [8–12].
Several methods can be used to increase the densification and piezoelectric properties of KNN, such as new processing techniques like spark plasma sintering, hot press, solvothermal synthesis and reactive templated grain growth. However, the cost of these techniques is relatively higher compared to the conventional solid-state reaction method, and unsuitable for practical application in industry. The other strategy to increase densification and improve the properties is to modify (Na,K)NbO3 ceramics using different aids and dopants such as CuO [2,13–15], ZnO [16–18], and K4CuNb8O23[19,20], or different oxides [21,22], which are used to lower the sintering temperature by forming a liquid phase during the sintering process. The lower sintering temperature will help to prevent the loss of volatile elements like sodium.
Furthermore, different authors have reported that the addition of copper to KNN can provide typical characteristics of “hard” behaviour [7,13,19,23]. By adding these hardening ions to the perovskite (replacing Nb5+ by Cu2+ ions in the KNN structure), oxygen vacancies are created, forming complex defects, which act as pinning centres to hinder the motion of the domain walls. This pinning effect of the domain walls lead to piezoelectric “hardening” effect [19,23]. Therefore, it is interesting to explore the creation of oxygen vacancies in KNN systems.
Among other additives, zirconium is one of the dopants used to improve the density of KNN. Previous studies have shown that the addition of low zirconium oxide content during air sintering hampers the grain growth of K0.5Na0.5NbO3 ceramics [24]. According to the authors, the refinement of the microstructure occurs because of two processes: at first, the zirconia particles located in the grain matrix junctions reduce the mobility of the grain boundaries, and second, the zirconium enrichment found in the grain boundary region produces a defective structure that limits its mobility during the sintering process [24–26]. Further studies have shown that densification is improved by ZrO2 doping, however, it does not prevent evaporation of alkali elements at high sintering temperatures [27].
Ramajo et al. [28] reported that the addition of ZrO2 causes an increase in the density and, as a consequence, in the electrical and dielectric properties. The authors determined that zirconium changed the grain size and microstructure of KNN ceramics. In this case, some Zr4+ ions replace Nb5+ in B positions of the perovskite lattice, while some ZrO2 particles are located at the grain boundaries. These ZrO2 particles at the grain boundary impede grain growth, improve the packing, and increase the final density of the sample. A glassy phase was observed with increasing doping concentration. The addition of up to 1mole% of Zr4+ produces a softening effect in the ferroelectric properties and increases its density. The dielectric and piezoelectric properties were reduced in samples with higher contents of Zr4+, more than 1mole%.
Malic et al. [24] also reported that there is a change in the microstructure of KNN ceramics with the addition of ZrO2 producing a more uniform microstructure and improving its dielectric and piezoelectric properties. However, the improvement of the piezoelectric constant (d33=100pC/N) is limited by the insertion of Zr to KNN.
Other authors [29] have also reported that the addition of small amounts of Zr as acceptor dopant promotes densification, resulting in an improvement in the functional properties of KNN ceramics. A decrease in the Curie temperature and an increase in the dielectric constant values were observed, and an increase in the coercive field and remanent polarization was also obtained in zirconium-doped KNN samples.
Different compositions with different Na/K ratios based on the K1−xNaxNbO3 system have been reported to improve the piezoelectric properties [3,4,7,8,12,14,16,19]. According to all these studies on the Na/K ratio, it seems that the Na-rich region exhibited higher piezoelectric properties than the K-rich region. In particular, for the studies where zirconium was used, most of the compositions explored were based on K0.5Na0.5NbO3. Therefore, in this work a study of the addition of ZrO2 to the composition K0.48Na0.52NbO3 (KNN) was performed. K0.48Na0.52Nb1−xZrxO3−δ (KNN-Zr) ceramics with 0≤x≤0.04 were prepared by solid-state reaction to investigate the effect of zirconium on the structure, density, and the electric and piezoelectric properties of KNN, as well as its relation with the effect of the creation of oxygen vacancies in the KNN system.
Experimental procedureLead-free K0.48Na0.52Nb1−xZrxO3−δ piezoelectric ceramics where x=0, 0.005, 0.015, 0.03 and 0.04 were prepared by the conventional solid-state reaction method. Na2CO3 (99.5%), K2CO3 (99%), Nb2O5 (99.5%) and ZrO2 (99.5%) were used as starting raw materials.
Two main problems can appear when it comes to keeping the stoichiometry, in particular, the K+Na/Nb ratio: first, the hygroscopic nature of alkaline carbonates, especially potassium carbonate, and second, the high volatility of the alkaline species at the processing temperature. Regarding the first problem, different thermogravimetric studies [30,31] have indicated that dehydration is completed at ∼200°C, and therefore, the starting reagents were dried in an oven at 200°C for 24h before use to avoid compositional errors when weighing out the precursor mixture. The second problem can be minimized or avoided if an alkaline carbonate excess is added at the beginning of the synthesis and using closed boats to sintered samples at high temperatures. Bomlai et al. [32] observed that the addition of up to 5mole% excess of alkaline carbonates allowed milder calcination conditions of the alkaline carbonate–niobium oxide powder mixture. Therefore, based on this study, in this work, a 5mole% excess of alkaline carbonates was added to all KNN compositions maintaining the K/Na ratio, and a closed Pt box was used to minimize these problems. Platinum was used instead of alumina boats to avoid any possible reaction and subsequent contamination. The effect of this alkaline excess was studied in KNN undoped and doped samples.
Dried powders of the reagents in each composition were mixed in an agate planetary mill for 2h in ethanol. The dried powders were pressed into pellets of 13mm in diameter and fired at 850°C for 3.5h. These pellets were then crushed and milled again and were pressed into pellets 5mm in diameter and sintered at 1125°C for 2h in an air atmosphere using a closed box made from platinum foils and covering the pellets with powders of the same composition. Binder was not used to prepare the pellets. The bulk density of the ceramic samples was measured by the Archimedes method.
X-ray powder diffraction (XRD) was recorded using a Siemens D5000 diffractometer with CuKα radiation at room temperature. Angle correction was carried out using an external silicon standard.
Microstructure was evaluated by a field emission scanning electron microscope, FE-SEM using a JEOL 7001F equipped with a spectrometer for energy dispersion of X-ray analysis, EDX, from Oxford instruments using an acceleration voltage of 15kV. For microstructural and microanalysis determination, the samples were deposited on an Al holder and coated with graphite.
Raman scattering spectra were recorded in the frequency range of 90–1000cm−1 at room temperature, using a modular Raman system from WITec GmbH, based on an automatic vertical confocal microscope, model alpha300 apyron, with an EMCCD ultra-high efficiency detector refrigerated at −60°C and equipped with a 532nm laser coupled to the microscope.
For the electrical properties measurements of the pellets sintered at 1125°C Pt paste electrodes were placed on opposite faces. The paste was dried, decomposed, and hardened by gradually heating up to 900°C and at this temperature was maintained for 2h. The pellets with attached electrodes were placed in a conductivity jig and the impedance data were recorded from room temperature to 900°C using a Hewlett Packard 4192A analyser over the frequency range from 5Hz to 13MHz. The data obtained were corrected concerning the pellet geometry and also the cell blank capacitance (“jig correction”). Fixed frequency capacitance measurements were made using an LCR impedance meter over the room temperature range up to 500°C with data recorded at various frequencies between 5 and 100kHz.
Polarization versus electric field (P–E) hysteresis loops were carried out in a dielectric liquid bath (FC40, 3MTM Fluorinert™) at room temperature. Low-frequency (0.1Hz) and high-voltage sine waves were applied combining a synthesizer/function generator (HP3325B, Hewlett-Packard Inc., Palo Alto, CA) and a high-voltage amplifier (Trek model 10/40A, Medina, NY). Several consecutive high-voltage cycles (4–5 cycles) were performed to ensure a stable switching behaviour for each measurement (i.e., for each applied electric field).
For the piezoelectric parameters’ measurements, the samples were immersed in a silicone oil bath at 80°C for 30min under 30kV/cm. Subsequently, the piezoelectric constant d33 was measured using a piezo-d33 meter (YE2730A, APC International) at room temperature. The electromechanical coupling factor, kp and the mechanical quality factor, Qm were also determined at room temperature by the resonance/antiresonance method based on the IEEE standards.
Results and discussionFig. 1(a) shows the XRD patterns of the undoped KNN without and with an excess of alkaline carbonates at 1125°C, respectively. The main phase detected in both samples is perovskite, but a secondary phase was detected for KNN without any excess of alkaline ions. The peaks of the secondary phase were assigned to KNbO3 (JCPDS-ICDD 32-0822) and it could be due to slight changes in the stoichiometric ratio caused by highly volatile alkaline elements during the sintering process. Therefore, a 5mole% excess of alkaline ions was used in all samples, allowing for the preparation of single-phase perovskite.
 undoped KNN simple without (i) and with (ii) 5mole% excess of alkaline cations; (b) pure and Zr-doped KNN ceramics. Inset in (b): magnificated patterns in the 22–23° 2θ range.")
The XRD patterns of the KNN-based ceramics doped with different amounts of zirconium (x=0–0.04) and sintered at 1125°C for 2h are shown in Fig. 1(b). For compositions below x=0.04, a single-phase perovskite structure is observed, and therefore, an aliovalent substitution of zirconium at B-sites of KNN was formed below this composition. A secondary phase assigned to ZrO2 (JCPDS-ICDD 88-2390) appeared at high zirconium concentration. In comparison to the results obtained by Ramajo et al. [28], using the reagents and the synthesis method described previously, no secondary phase formation was observed at low dopant concentrations, indicating that the processing parameters are relevant factors to be considered.
Inset of Fig. 1(b) shows the XRD patterns in the 2θ range of 22–23° needed to assign the correct polymorph of the perovskite phase in each case. Samples with x=0 and 0.005 exhibit a single-phase perovskite structure with orthorhombic symmetry (Cm2m space group) which can be indexed according to JCPDS-ICDD card no. 32-0822 (KNbO3). When the amount of zirconium is increased, there seems to be an evolution of the crystalline phase to a monoclinic phase and peaks can also be indexed to a monoclinic perovskite structure with symmetry of space group Pm, according to the JCPDS-ICDD no. 74-2025 (Na0.9K0.1NbO3). Note that it is difficult to ascertain the current symmetry of this phase with the XRD data present, however, the phase changes can be suggested by the changes in symmetry of the (100) and (001) peaks of the orthorhombic phase (blue lines) to the (200) and (020) peaks of the monoclinic phase (red lines) in the 2θ range of 22–23° shown in this figure. As can be observed, the main phase for x=0.04 seems to be monoclinic. Note that the theoretical peaks represented with lines are displaced from the position of theoretical patterns. The small displacements observed in the diffraction peaks are due to the possible difference in the Na and K content, and the replacement of Zr by Nb in the nominal composition represented in the theoretical diffraction pattern.
SEM images for the surface of sintered samples with x=0 and x=0.03 are shown in Fig. 2(a) and (b). All of the samples have the characteristic morphology of alkaline niobate ceramics. These samples, as well as the others (not shown), exhibited the formation of a glassy phase (indicated with arrows in Fig. 2(b)). It has also been observed that, the higher the additive amount of zirconium is, the greater the glassy phase is. Other authors [21,26] also have observed this influence of the microstructure when ZrO2 was added to KNN. The relative density of the ceramic samples is shown in Table 1 for each composition. The incorporation of zirconium improved the density of the samples.
 and x=0.03 (b) with a 5mole% of alkaline cation excess. (c) K/Na molar ratio from EDX analysis as a function of x for samples with an excess of alkaline ions.")
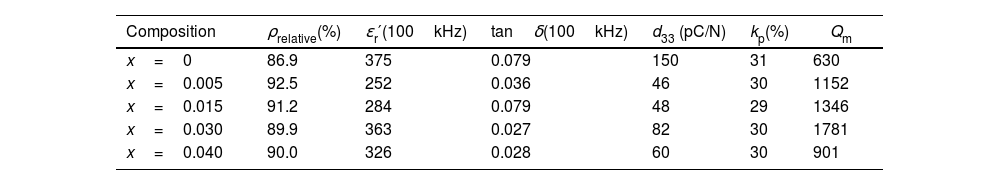
Relative density (Arquimedes’ method), relative permittivity ɛr′, dielectric loses tanδ, piezoelectric coefficient d33, electromechanical coupling factor kp and mechanical quality factor Qm at room temperature.
| Composition | ρrelative(%) | ɛr′(100kHz) | tanδ(100kHz) | d33 (pC/N) | kp(%) | Qm |
|---|---|---|---|---|---|---|
| x=0 | 86.9 | 375 | 0.079 | 150 | 31 | 630 |
| x=0.005 | 92.5 | 252 | 0.036 | 46 | 30 | 1152 |
| x=0.015 | 91.2 | 284 | 0.079 | 48 | 29 | 1346 |
| x=0.030 | 89.9 | 363 | 0.027 | 82 | 30 | 1781 |
| x=0.040 | 90.0 | 326 | 0.028 | 60 | 30 | 901 |
No evidence of secondary phases was observed by EDX analysis for samples with x<0.04, which is supported by the XRD results. Fig. 2(c) shows the K/Na molar ratio versus the amount of Zr in each composition. The K/Na ratio reached an almost constant value independent of the amount of zirconium. Therefore, the excess of alkali ions makes it possible to obtain compositions close to the nominal one. The EDX analysis showed that the atomic percentages of the elements differ from the nominal composition. All compositions have a K/Na ratio higher than the nominal composition (K/Na=0.923), indicating that a greater loss of Na is produced during the calcination process, which is more evident for the undoped composition.
Raman spectroscopy has been used to demonstrate the nature of crystal symmetry in the different compositions as a function of Zr dopant, giving information about the structural deformation of perovskite caused by both tilt and cation displacement of the BO6 octahedron on a local scale. Fig. 3 shows the Raman spectra of pure and Zr-doped KNN ceramics at room temperature, where the typical vibrations corresponding to the perovskite phase and associated with the BO6 octahedra are present [33–35]. According to group theory, the main vibrations are the 1A1g (υ1)+1Eg (υ2)+2F1u (υ3, υ4)+F2g (υ5)+F2u (υ6) modes. The stretching modes are 1A1g (υ1)+1Eg (υ2)+1F1u (υ3) and the others are bending modes [33]. A1g (υ1) and F2g (υ5) are detected as fairly intense bands in systems like KNN due to their almost ideal octahedral equilateral symmetry. Therefore, in this structure, the main vibrations are usually related to the NbO6-octahedron [34]. The vibrational modes are indicated in this figure. The peaks located between 100 and 160cm−1 can be associated with translational modes of alkaline niobates K+/Na+ and rotational modes of the NbO6-octahedron [35]. The F2u (υ6) mode of NbO6-octahedra is possibly overlapped, and thus is not evidently seen; nevertheless, it is labelled in Fig. 3.
 Raman spectra corresponding to undoped and Zr-doped KNN collected at room temperature. Variation of (b) spectral band position and (c) FWHM of the A1g (υ1) stretching mode for Zr-doped KNN ceramics as a function of x. The standard deviation is shown in the inset of each figure.")
As shown in Fig. 3(a), to obtain statistical reliability, 50 Raman spectra (collected over an area of 70μm×70μm) were composed for each sample, keeping the measurement conditions constant. It is possible to note that the intensity of the bands due to the vibrations of the NbO6-octahedra increases as the zirconium content increases. Moreover, the A1g (υ1) mode shifts to lower frequencies as well as the F2g (υ5) mode. A possible explanation for this is the presence of oxygen vacancies, which cause a decrease in the bond strength. The intensity of the Raman band also depends on the structure of the sample, surface roughness, and density of the material [35]. As commented in the introduction of the manuscript, zirconium can improve the density of KNN ceramics, although regarding the results obtained in our samples, there is no significant change in density when x is larger than 0.005 (Table 1). In addition, the changes in roughness on the surface of the sample observed in the SEM images could be neglected. Therefore, the changes in Raman band intensity that were observed here should be primarily dependent on sample structure dissimilarities. Furthermore, according to XRD, there seems to be a phase change when the amount of zirconium increases which can be confirmed by this hypothesis.
According to Zhu and co-workers [35], the Raman intensity characterizes the differentiated frequency-dependent polarizability concerning nuclear displacements, and consequently, the scattering intensity is determined by the amount of change in the polarizability. In this case, the Nb5+ ion is substituted by a Zr4+ ion with higher ionic radius (r(Nb5+)CN=6=78 pm and r(Zr4+)CN=6=86 pm). Therefore, the lattice distortion due to Zr insertion, which changes the polarizability of the O–Nb–O vibration in the NbO6-octahedra. To avoid the possibility of particle orientation effects on the measured band intensity, were collected a representative amount of Raman spectra in all samples.
Fig. 3(b) and (c) shows the deviation of the spectral band position and full width at half maximum (FWHM) of the A1g mode (υ1) for the Zr-doped KNN as a function of x, respectively. The dispersion of the adjusted values for the selected vibration mode is also shown inserted in these figures. These figures show that as x increases, the band representing the A1g (υ1) stretching mode clearly shifts towards lower wavenumbers while being simultaneously broadened. The larger dispersion of the Raman band position is also expected for samples presenting different phases, and it is found when x is equal to 0.03.
From the XRD and Raman results, it can be assumed that the orthorhombic (O) to the monoclinic (M) phase transition has already started occurring in the sample with x=0.03. Therefore, the Raman results confirmed the XRD results, showing the coexistence of O and M phases for x=0.03, which suggests a change in structure/phase of the samples with increasing x.
Fig. 4 exhibits the relative permittivity against the temperature of the Zr-doped KNN ceramics, measured at 100kHz in the temperature range from 25°C to 500°C, for samples sintered at 1125°C for 2h. Permittivity profiles are frequency-independent and show two maxima, one around 200°C associated with the orthorhombic to the tetragonal phase transition, or the monoclinic to the tetragonal phase transition for x=0.04, and the other at high temperatures, which is associated with the tetragonal ferroelectric to the cubic paraelectric phase transition. In Zr-doped KNN samples, the tetragonal-to-cubic (T–C) phase transition shifts towards lower temperatures, whereas the orthorhombic/monoclinic-to-tetragonal (O/M–T) phase transition remains almost constant. Moreover, a typical normal ferroelectric to paraelectric phase transition is observed for undoped KNN showing a narrow phase transition with high permittivity. However, this transition broadens and the permittivity value decreases on doping, suggesting the appearance of diffuse phase transition, probably caused by local fluctuations induced by the incorporation of Zr4+ ions into the crystalline lattice.

The temperatures of the permittivity maxima, which are taken to represent the orthorhombic/monoclinic to tetragonal phase (TO/M–T) and the tetragonal to cubic phase (TC) transition temperature, are shown in the inset of Fig. 4 as a function of x. A gradual decrease is observed in the TC with x from approximately 410°C for x=0, to approximately 330°C for x=0.04. The decrease in TC can be explained by assuming that zirconium is being introduced into the perovskite structure. This temperature change for Zr-doped samples may also be a consequence of the acceptor doping effect [29]. The values of the relative permittivity and tanδ at room temperature and at 100kHz are shown in Table 1 for all compositions. The highest ɛr′ value and the lowest dielectric loss were observed for the sample with x=0.03.
To characterize the electrical properties of the samples, variable frequency impedance measurements were performed on pellets sintered in air and slowly cooled to room temperature by switching off the furnace. A selection of typical impedance data is represented in Fig. 5 and S1 and S2 of the Supplementary Information (SI) for pellets sintered at 1125°C. Fig. 5(a) shows an almost semicircular arc with distortion from the ideal semicircular shape at low frequencies in the impedance complex plane plot for the undoped KNN sample. Z″/M″ spectroscopic plots (Fig. S2(a) of SI) showed a single peak in each spectrum with similar peak maximum frequencies. Since low capacitance bulk effects dominate the electric modulus (M″ spectra), the data in this figure suggest that the sample's main resistive component is related to the sample bulk, with a capacitance of approximately 3.5×10⁻¹¹Fcm−1 at 743°C, as shown in the inset of Fig. 5(a). The low-frequency resistance is associated with the sample–electrode contact.
 Impedance complex plane plot, Z*, for x=0 and x=0.03 samples at 743°C and 756°C, respectively. Inset in (a and b): spectroscopic plots of capacitance for both samples at the same temperature.")
For the Zr-doped samples, another electrical component became apparent and therefore, the electrical response started to be inhomogeneous. A similar impedance response was observed for all samples, Fig. 5(b) and S1(b) and S2(b)–(d) of the SI. Two arcs are apparent in the impedance complex plane plot, Fig. 5(b) and S1 of the SI: a high-frequency arc of resistance R1 and a large-intermediate-frequency arc of resistance, R2. Both dominated the total resistance (R1+R2). At high temperatures and low frequencies, a low resistance appeared, and it is associated with the sample–electrode contact. Two peaks also appeared in the Z″/M″ spectroscopic plots, Fig. S2(b)–(d), and two frequency-independent plateaus were observed in the spectroscopic plots of capacitance, inset of Fig. 5(b) and S1 of the SI, with values around 2–3×10⁻¹¹Fcm−1 and 1–2×10⁻⁹Fcm−1, which are attributed to a conventional bulk and grain boundary, respectively. At the highest temperatures and lowest frequencies, the capacitance rises to values of 10−7Fcm−1 and is attributed to the sample–electrode interface [36]. Therefore, this electrical inhomogeneity, in particular the appearance of grain boundaries when doping with Zr, could influence the final piezoelectric properties. The presence of defects in the structure generated when Zr replaces Nb in the KNN, could be located at the grain boundaries and it could influence to the motion of ferroelectric domains, which can in turn affect the piezoelectric characteristics. However, given the different interpretations in the literature [37–40], pinpointing the exact location of these defects would require more detailed studies.
From impedance data such as those shown in Fig. 5, resistance values for the bulk, R1, and grain boundary, R2, components were extracted and are presented as Arrhenius plots of logσ vs T−1 in Fig. 6(a) and (b), respectively. All data represent highly insulating samples, with the complete absence of any semiconducting component. The activation energies were ∼0.75 to 1.4eV for both bulk and grain boundary. The grain boundary conductivity, σ2, increases when the zirconium concentration increases, reaching the maximum values of conductivity for the sample with x=0.03. There is also a change in slope when the Zr content increases from x=0.005–0.015. However, the bulk conductivity, σ1, remains almost the same and a slight decrease when an increase in the zirconium concentration is observed. This unusual behaviour may be attributed to a non-uniform distribution of the Zr dopant between the grain and the grain boundary since the presence of ZrO2 inclusions in our samples was not observed by XRD, Raman, or SEM/EDX.
 and grain boundary (b) conductivity for pure KNN and Zr-doped KNN ceramics.")
Therefore, two main effects were observed in the Zr-doped samples. The first is that the conductivity of both components increases in comparison to the x=0 sample probably due to the presence of the oxygen vacancies. The second is that the effect of the oxygen defect is higher in the grain boundary region, the most conductive composition being that with x=0.03. This defect in the structure in the grain boundary region may be related to the limitation of KNN grain growth. The effect of the adding acceptor dopants, inhibiting the grain growth, and also causing the formation of abnormally grown grains has also been observed by other authors [24,26].
Thus, the change in electrical response from pure KNN to Zr-doped samples could be attributed to the change in the oxygen content. The impedance data are very sensitive to variation in the oxygen content of the sample, and therefore, when samples are Zr-doped, oxygen vacancies are created, and the oxygen content is different.
The ferroelectric hysteresis loops (P–E) for the pure KNN and Zr-doped samples measured at 0.1Hz and at room temperature are shown in Fig. 7(a), and the remanent polarization (Pr) and coercive field (Ec) values are represented in Fig. 7(b) as a function of x. In KNN-based ceramics doped with different amounts of zirconium, a dramatic increase in the coercive field is observed. This increase in Ec suggests that the material becomes harder which is consistent with the hypothesis that oxygen vacancies are formed. A small amount of zirconium (x=0.005) leads to a hysteresis loop typical of a ferroelectric material. Ceramics with higher Zr concentration (x>0.005) show loops that are not fully saturated. Therefore, a higher electric field must be applied to obtain well-saturated hysteresis loops. This behaviour can also be attributed to the conductivity associated with the presence of the oxygen vacancies, especially in the grain boundary region.
 P–E hysteresis loops of the pure KNN and Zr-doped KNN ceramics measured at 0.1Hz at room temperature. (b) Evolution of the piezoelectric parameters (Pr and Ec) with x in Zr-doped KNN ceramics.")
The change in piezoelectric coefficient d33, electromechanical coupling factor, kp, and mechanical quality factor, Qm, are shown in Table 1. The d33 value for pure KNN is 150pC/N, which is close to that reported by Dai et al. [41] for the same composition and higher than that described by Hu et al. [42]. In all Zr-doped KNN ceramics, the piezoelectric coefficient, d33, decreases with respect to pure KNN. Significant changes in the electromechanical coupling factor, kp, are not observed between pure KNN and doped ceramics. In contrast, the mechanical quality factor Qm of Zr-doped KNN ceramics (x=0.005, 0.015 and 0.03) is higher than that of pure KNN. This increase can be explained in terms of the incorporation of zirconium into the lattice and the generation of oxygen vacancies. Oxygen vacancies produced by replacement have a pinning effect for the motion of ferroelectric domains, which can make the material become hard.
The composition with x=0.03 presented the highest permittivity at room temperature, and the lowest dielectric losses. Moreover, it was the sample with the highest Qm and d33 values, much higher even than undoped KNN in the case of Qm. It is important to note that this composition has a mixture of orthorhombic and monoclinic phases. Therefore, we can conclude that it is the best composition to obtain a “hard” piezoelectric material based on zirconium-doped KNN and it would be a promising candidate for high power applications.
ConclusionsLead-free “hard” piezoelectric ceramics based on K0.48Na0.52Nb1−xZrxO3 were prepared by the conventional mixed oxide method. Based on XRD and Raman results, when the amount of zirconium was increased there was an evolution of the crystalline phase from the orthorhombic to the monoclinic phase, showing a mixture of both crystalline phases at intermediate compositions. Therefore, compositions close to the orthorhombic-monoclinic phase boundary were prepared. The final density increased when zirconium is present in the KNN and the formation of a glassy phase is observed.
The addition of Zr was effective in improving the sinterability and the “hard” piezoelectric properties of KNN, increasing the Ec and Qm values. The composition with x=0.03 (K0.48Na0.52Nb0.97Zr0.03O3) presented the highest permittivity at room temperature, and the lowest dielectric losses. Moreover, it was the sample with the highest Qm and d33 values, which were even much higher than undoped KNN in the case of the Qm. Therefore, it is the best compositions with which to obtain a “hard” piezoelectric material based on zirconium-doped KNN, thus making it a promising candidate to be used as “hard” lead-free piezoelectric material for high power applications.
H.B.-M. and E.C. thank the Universitat Jaume I [UJI-B2019-41] and Spanish Ministerio de Ciencia e Innovación [Grant PID2020-116149GB-I00 funded by MCIN/AEI/10.13039/501100011033] for the financial support. E.L.S.V. thanks the Generalitat Valenciana [GRISOLIA/2019/054] for the predoctoral contract. X.V. is a Serra Húnter Lecturer Fellow and is grateful to the Generalitat de Catalunya. This research did not receive any specific grant from funding agencies in the public, commercial, or not-for-profit sectors.
The following are the supplementary data to this article:

