


88P2O5–xFe2O3–2CoO–(10−x)K2O glasses from x=0.0 to x=0.5 were prepared at 850°C using melt quenching technique.
These glass systems were characterized by using X-ray diffraction, differential scanning calorimetry (DSC), magnetic measurements, Raman spectroscopy, Archimedes methods, Brewster spectrometer, UV–vis spectrophotometer and impedance spectroscopy. X-ray diffraction revealed that these glass systems have amorphous structure. DSC has showed that the thermal stability of the glass samples increased with the rate of iron. Raman spectra showed the presence of the P–O–Fe group which increases the rigidity of the glass samples. The density of our compounds increased with the increase of the amount of iron oxide.
Magnetic measurements at 5K using vibrating sample magnetometer technique show antiferromagnetic behavior of these system glasses.
According to the results of the optical absorption spectra, the values of the gap energy and Urbach energy decreased and the refractive index of the glass increased with the increase of the mole of Fe2O3. Brewster spectrophotometer has showed an optical index (n>1.5). On other hand, the chromatic coordinates of all samples to the area of blue–purple light emission.
Electrical properties were studied using the technique of impedance alternative spectroscopy over a temperature range 423–623K in the frequency range of 40Hz–13MHz; conductivity under variable regime σac follows Jonscher's law. The conductivity σdc follows the Arrhenius law with an activation energy value too low (≈0.3eV) and decreased with the rate of iron, indicating polaronic conduction.
The dielectric study showed high values of dielectric constant at low frequency with low loss at high frequency. The modulus revealed dipolar relaxations.
Se prepararon vidrios 88P2O5–xFe2O3–2CoO–(10−x)K2O de x=0,0 a x=0,5 a 850°C con la técnica de enfriamiento rápido (melt quenching).
Estos sistemas vítreos se caracterizaron por el uso de difracción de rayos X, calorimetría diferencial de barrido (DSC), mediciones magnéticas, espectroscopia Raman, métodos de Arquímedes, espectrómetro Brewster, espectrofotómetro UV-Vis y espectroscopia de impedancia. La difracción de rayos X reveló que estos sistemas vítreos tienen una estructura amorfa. La DSC ha demostrado que la estabilidad térmica de las muestras de vidrio aumentó con la tasa de hierro. Los espectros Raman mostraron la existencia del grupo PO-Fe que incrementa la rigidez de las muestras de vidrio. La densidad de nuestros compuestos se incrementó con el aumento de la cantidad de óxido de hierro.
Las mediciones magnéticas a 5K utilizando la técnica del magnetómetro de muestra vibracional muestran el comportamiento antiferromagnético de estos vidrios del sistema.
De acuerdo con los resultados de los espectros de absorción óptica, los valores de la energía del intervalo y la energía de Urbach disminuyeron, y el índice de refracción del vidrio aumentó con el aumento del mol de Fe2O3. El espectrofotómetro Brewster ha mostrado un índice óptico (n>1,5). En cambio, las coordenadas cromáticas de todas las muestras al área de emisión de luz azul-púrpura.
Las propiedades eléctricas se estudiaron utilizando la técnica de espectroscopia alternativa de impedancia en un rango de temperatura de 423-623K en el rango de frecuencia de 40Hz-13MHz; la conductividad por el régimen variable σ AC sigue la ley de Jonscher. La conductividad σdc sigue la ley de Arrhenius con un valor de energía de activación demasiado bajo (≈0,3eV) y disminuía con la tasa de hierro, lo que indica conducción polarónica.
El estudio dieléctrico mostró valores altos de constante dieléctrica a baja frecuencia con baja pérdida a alta frecuencia. El módulo reveló relajaciones dipolares.
Many scientific applications have recently been interested in the study of oxide glasses [1]. The glasses formed by Fe2O3–P2O5 are very useful in practice, for scientific reasons because they are considered a matrix of large capacity for the storage of nuclear waste [2]. P2O5 represents an archetypal glass former. In fact, this phosphate glass is used in many applications such as biocompatible materials for medical applications or lithium phosphate fast ion drivers that are used as electrolytes in the solid-state [3]. In addition, the iron reinforces the chemical bonds in the phosphate glass structure, giving this glass comparable property, even better than borosilicate glasses [4].
Phosphate glasses are generally easy to prepare and have a wide variety of applications in optics, electrical and solid states batteries technology, due to their high coefficient of thermal expansion, low transition temperature and high electrical conductivity [5,6]. Moreover, Phosphate-based glasses are nowadays studied because they are useful in the biomaterial fields [7]. A lot of theoretical researches on phosphate glasses have established that the glassy P2O5 lattice is formed from PO4 tetrahedra, which are connected by P–O–P bonds forming a polymer structure [8]. The problem with simple phosphate glasses is that they do not have high chemical stability. It is now known that the addition of transition metals, such as iron and/or bismuth increases the aqueous stability of phosphate glasses by the formation of P–O–Fe and/or P–O–Bi bond [9]. Iron exists in glass, frequently in two valence states, Fe3+ and Fe2+[10,11].
The addition of a modifying oxide (generally alkaline or alkaline earth) changes the characteristics of the three-dimensional random lattice to one of the linear phosphate chains. In terms of the terminology Qn (where n is the number of oxygen atoms bridged by PO4 tetrahedron), the effect of the modifying oxide concentration on the phosphate structural groups is the shift from the ultra-phosphate Q3 ([P(OP)3(OP–)1]) to meta-phosphate Q2 ([P(OP)2(OP–)2]) to pyrophosphate Q1 ([P(OP)(OP–)3]). The infinitely long phosphate chains are shortened; hence the induction of a break in the coherence of the network and the formation of non-binding oxygen groups (NBO) [12].
Recently, a research [13] has shown that the insertion of high amount of transition metal (TM) in alkaline phosphate glasses induces conductivity anomalies. Such anomalies result from the fact that the negatively charged polarons interact with mobile (alkali) cations to form uncharged diffusing entities minimizing conductivity, the so-called “ion-polaron effect” [14].
The glass-making techniques most commonly used in glass research are melt quenching, chemical vapor deposition and sol-gel methods. In fact, the melt quenching technique was the oldest glass preparation technique used in the glass industry as well as in the research field, before chemical vapor deposition and sol-gel technique.
The melt quenching technique is characterized by its flexibility in the preparation of a large number of glass compositions of silicate, borate, phosphate, oxide or non-oxide systems.
Among the advantages of this method, the doping or co-doping of different types of active ions is quite easy. Compared to other glass preparation methods, the disadvantage is the lack of purity of the prepared glass sample. In order to avoid any contamination, the crucibles made of noble metals such as gold, platinum, etc. can be used.
In our work, bulk glasses were prepared using a melt quenching method; we chose oxide phosphate as glasses network formers. Indeed, phosphate glasses with a high amount in glass have several advantages. They are characterized by their high coefficient of thermal expansion, ultraviolet transmission, low melting temperatures and high electrical conductivity [15–17].
Cobalt ions are expected to have profound influence on the physical properties of glasses, as they exist in different valance states viz., Co2+, Co3+ and Co4+ states [18] and they have a high value of optical index, which allows them to be good candidates for nonlinear optics [19].
On the Other hand, we have added to our glass samples an alkali metal (K+) that increases the concentration of non-bridging oxygen and decreases the melting temperature.
To our knowledge, the use of these two metals together with small proportions has not been addressed in the literature.
Therefore, in order to reinforce the polaron conduction in front of the ionic conduction, increase the thermal, chemical stability and increases the optical index of our glass we have chosen to add cobalt in the presence of iron. Moreover, we have added cobalt and iron ions with low concentration to avoid conductivity anomalies [13,20].
The modulus formalism has the advantage of extracting the dielectric response of bulk at high frequencies by masking the relaxation that results from the conduction and by removing the polarization of the electrodes [21,22].
For electrical and dielectric measurements, we chose to use impedance spectroscopy given that this technique is powerful in probing glass materials.
In this work, we study the variation of the physical, structural, thermal, optical, electrical, dielectric and magnetic properties of glass samples with low iron content.
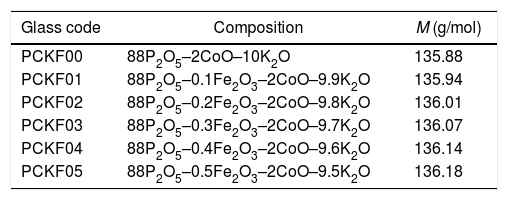
ExperimentGlass preparationThe samples used for the manufacture of glass, with the molar formula 88P2O5–xFe2O3–2CoO–(10−x)K2O were prepared from high purity chemicals (99.99%): (NaH2PO4)2H2O, Fe2O3, K2O and CoO anhydrous. Suitable amounts of the raw materials were crushed, dosed and mixed, each time about 10g is weighed and then placed in a heated platinum furnace crucible for 30mn to remove impurities in the form of gas. They were, then, melted at 1023K in a high temperature oven. After heating, the melt was poured at room temperature into a preheated graphite mold (at 200°C). Subsequently they were quenched and annealed at about 200°C in a muffle furnace. The obtained glasses were cut into granules, which have the shape of a disk with R=3.5mm radius and e=2.5mm thickness and then polished for the optical measurements of the spectra. The batches of each glass composition (in mol%) are given in Table 1.
Glass codes, glass composition (in mol%) and molar mass (M) (g/mol).
| Glass code | Composition | M (g/mol) |
|---|---|---|
| PCKF00 | 88P2O5–2CoO–10K2O | 135.88 |
| PCKF01 | 88P2O5–0.1Fe2O3–2CoO–9.9K2O | 135.94 |
| PCKF02 | 88P2O5–0.2Fe2O3–2CoO–9.8K2O | 136.01 |
| PCKF03 | 88P2O5–0.3Fe2O3–2CoO–9.7K2O | 136.07 |
| PCKF04 | 88P2O5–0.4Fe2O3–2CoO–9.6K2O | 136.14 |
| PCKF05 | 88P2O5–0.5Fe2O3–2CoO–9.5K2O | 136.18 |
The phosphate Glass powder samples obtained by grinding the glass were used for XRD characterization. The XRD diagram of the samples was recorded using a Philips X’Pert X-ray diffractometer, which uses Cu-Kα radiation (λ=1.54056Å) at 40kV and 100mA and setting the diffractometer in the 2θ interval from a weak angle of 5° to 70° by changing the 2θ with a step of 0.02°.
Raman measurements were carried out using a visible LabRAM HR spectrometer (Horiba Gr, France) with a wavelength excitation of 632.8nm emitted from He–Ne laser.
Using Archimedes’ method, and using acetone as immersion liquid, we measured the density ρ of each glass. The glass discs were weighed in the air (Wair) using an electronic scale, (±0.01g) were manufactured by Melter Toledo, and then immersed in acetone and reweighed (ωac). The density of acetone ρac=0.789gcm3.
The refractive index was measured using the Brewster angle method with Laser He–Ne at 25°C.
DSC (Differential Scanning Calorimetry) scans of gas-cast glass specimens were carried out in Toledo DSC823e Instruments. The DSC scans were recorded using 4 gas-cast glass specimens. These were powdered and heated with heating rates of 10°C/min between 20 and 450°C temperatures in a platinum crucible using the same amount of alumina powder as reference material.
5K temperature measurements of the magnetization as the H-field were recorded using a vibrating sample magnetometer. This measurement was taken in the magnetic field (H) −10 to 10T range.
To understand the optical absorption coefficient α(λ) of the polished samples, the diffuse reflectance spectra in the UV–visible region were made at room temperature by using a Shimadzu UV-2501PC spectrophotometer.
Complex impedance data of disk-shaped samples such as diameter (d=7mm) and thickness (e=2mm) were analyzed using an impedance analyzer (Agilent 4294A) in the frequency range from 40Hz to 107Hz and in a 423–623K temperature range.
Results and discussionXRD resultFig. 1 shows the XRD patterns of PFCK00- PFCK05 glasses at room temperature. In this diffractogram there are a wide scattering ranging between 2θ=12°–35° and the absence of a sharp crystallization peaks which is characteristic of the amorphous phase.
Raman spectroscopy
The Raman spectra for series of 88P2O5–xFe2O3–2CoO–(10−x)K2O, from x=0.0 to x=0.5, glasses are given by Fig. 2.

In the 150–2000cm−1 spectral range, the Raman spectrum reveals the band spectral 160–198cm−1 assigned to CoO [23], the band at 470cm−1 associated to PO4 bending mode in Q0[24]. The band at around 690cm−1 is due to the motion of bridging oxygen (P–O–P)sym in Q2[25], the band at 900 and 1000cm−1 is assigned to symmetric and asymmetric vibrations of the Fe–O–P [25]. The intense peak located at 1170cm−1 is attributed to the symmetric stretching mode of non-bridging (PO3)sym[26]. The band at around 1270cm−1 is related to stretching vibrations (PO2)sym[27]. The high frequency band at around 1300cm−1 is due to (PO)sym stretch mode [24].
Physical parametersFor the measurement of the density ρ of each glass, the Archimedes method was used with acetone as the immersion liquid. The glass disk was weighed in the air (Wair) using an electronic scale, (±0.01g) manufactured by Melter Toledo, and immersed in acetone and reweighed (ωac), the density of acetone ρac=0.789gcm−3, the relative density is given by the following formula [28]:
For measurement of the refractive index, the method of Brewster angle with Laser He–Ne at 25°C was used.
To calculate the molar refraction, Rm, of our samples, we used the well-known formula of Volf and Lorentz–Lorenz [29]:
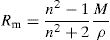
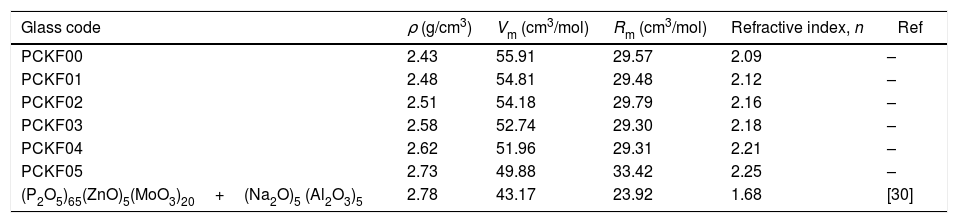
Table 2, summarizes all the physical characteristics of our samples: density (ρ), molar mass of the compound (M), molar refraction, Rm and the refractive index (n).
Density (ρ), molar volume (Vm), molar refraction, Rm and the refractive index (n) of the glass systems (90−x)P2O5–xFe2O3–5CoO–5K2O for x=0.0, 0.1, 0.2, 0.3, 0.4 and 0.5 compared with other work.
| Glass code | ρ (g/cm3) | Vm (cm3/mol) | Rm (cm3/mol) | Refractive index, n | Ref |
|---|---|---|---|---|---|
| PCKF00 | 2.43 | 55.91 | 29.57 | 2.09 | – |
| PCKF01 | 2.48 | 54.81 | 29.48 | 2.12 | – |
| PCKF02 | 2.51 | 54.18 | 29.79 | 2.16 | – |
| PCKF03 | 2.58 | 52.74 | 29.30 | 2.18 | – |
| PCKF04 | 2.62 | 51.96 | 29.31 | 2.21 | – |
| PCKF05 | 2.73 | 49.88 | 33.42 | 2.25 | – |
| (P2O5)65(ZnO)5(MoO3)20+(Na2O)5 (Al2O3)5 | 2.78 | 43.17 | 23.92 | 1.68 | [30] |
From Table 2 it can be seen that as the Fe2O3 content increases, the molar volume of the glasses decreases. The observed decrease of Vm indicates the implantation of the coordination polyhedra in the structural network [31]. The result induces a very slight variation in molar refraction, Rm observed in Table 2. In fact, molar refraction is an electronic polarizability per mole and it includes contributions from each component of mixture [32].
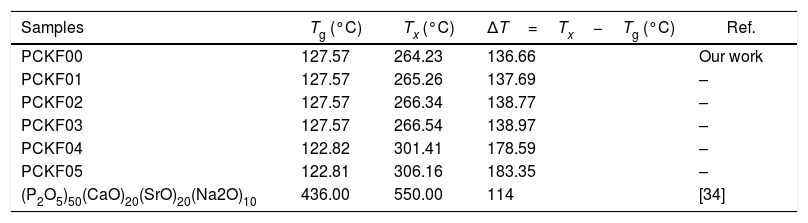
DSC resultsThe Differential Scanning Calorimetry (DSC) data Fig. 3 of PFCK00-PFCK05 glasses showed transitions (Tg) in the 120–140°C temperature range. When the temperature exceeds Tg, the atoms can migrate relatively to each other. We reach a temperature at which the atomic rearrangement becomes possible and the glass crystallizes. This phenomenon is exothermic, Tx denotes the crystallization start temperature which varies between 270 and 300°C. The difference between the crystallization temperature and the glass transition temperature (T=Tx−Tg) gives information about the stability of the glass [33]. The ΔT values corresponding to our samples are gathered in Table 3.

Thermal parameters of PCKF00, PCKF01, PCKF02, PCKF03, PCKF04 and PCKF05 compared with other glass.
| Samples | Tg (°C) | Tx (°C) | ΔT=Tx−Tg (°C) | Ref. |
|---|---|---|---|---|
| PCKF00 | 127.57 | 264.23 | 136.66 | Our work |
| PCKF01 | 127.57 | 265.26 | 137.69 | – |
| PCKF02 | 127.57 | 266.34 | 138.77 | – |
| PCKF03 | 127.57 | 266.54 | 138.97 | – |
| PCKF04 | 122.82 | 301.41 | 178.59 | – |
| PCKF05 | 122.81 | 306.16 | 183.35 | – |
| (P2O5)50(CaO)20(SrO)20(Na2O)10 | 436.00 | 550.00 | 114 | [34] |
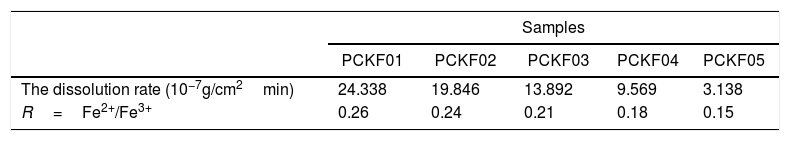
From Table 3 it can be seen that ΔT increases with Fe2O3 content and is above 100°C, indicating that our samples are thermally stable and have better chemical durability.
The good chemical durability of iron phosphate glass is due to a large number of Fe–O–P bonds in the structure [35].
Magnetic studyAs shown in Fig. 4. PFCK00-PFCK05 glasses show antiferromagnetic behavior, with obvious hysteresis loops. Also, it is found out that the magnetization saturation phenomenon increases Fe2O3 content.

The coercive field and the low remanent magnetization are viewed in the inset in Fig. 4, where an expanded view around the central part of the hysteresis cycles is shown. It can be seen that the low area hysteresis cycles increase with the increase of mol% of Fe2O3. The magnetic behavior observed is similar to that of soft magnetic materials with narrow hysteresis loop and low coercivity.
Optical studyThe absorption coefficient α(λ) for PCKF00-PCKF05 was calculated from the relation [36]
R∞ is the diffuse reflectance of the powder sample.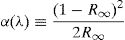
Fig. 5 shows the UV–visible absorption (α) spectra of Fe2O3 doped glasses PFCK00-PFCK05. This figure reveals peaks appearing between 400 and 700nm which correspond to the absorption of iron and cobalt [37,38].

The large absorption bands original from the d–d transition of metal transition ions is observed. In fact this domain is assigned to charge transfer.
For x=0, there are three weak UV absorption bands at about 530, 575, and 620nm, which are assigned to the transitions 4T1g(F)→4T1g(H), 4A2(4F)→4T1(4P) and 4A2(4F)→4T1(4F), respectively which caused by cobalt emission [39].
By introducing Fe2O3, there are three peaks located at about 248, 373, 448 and 455nm which are associated with the transitions 6A1g(G)→4T2g(D), 4T2g(D)→6A1g(S), 4A1g(G)→6A1g(S) and 6A1g(S)→4A1g(G)+4Eg(G), respectively [40,41].
To calculate the values of the optical band gap, optical data was analyzed using Tauc's law [42]:
where B is a band constant, Eg is the energy of the optical band gap and p factor depends on the type of transition and the structures of the material. In the case of an amorphous phase, indirect transitions (p=2) [43] are the most frequent.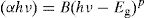
Plotting (αhν)0.5 as a function of photon energy hν, Fig. 6, the indirect gap, Eg was determined by extrapolating the linear segment of the curve to the hν axis where (αhν)0.5=0.
1/2 versus (hν) plot for PFCK00, PFCK01, PFCK02, PFCK03, PFCK04 and PFCK05 glasses.")
To estimate the Urbach energy or band tail width (Eu) one should apply Urbach relation:
where α0 is constant and Eu represents the width of the band tail of the states in the forbidden band and indicates the degree of disorder in the materials [44].
The values of the Urbach energy (Eu) of our glasses are determined by taking the reciprocal values of the slopes of the linear part of the ln(α) vs hν plots, as shown in Fig. 7.
 samples.")
The optical energy gap (Egt) of the samples is theoretically calculated from the refractive index values (n) measured using the relationship given by Dimitrov and Sakka [45]:
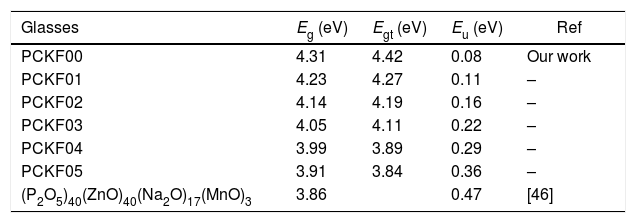
The band gap energies (Eg), Urbach energy (Eu) and the band gap (Egt) are presented in Table 5.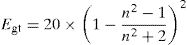
Table 4 shows that as the amount of iron increases the band gap decreases. The decrease in the optical gap Eg could be attributed to structural differences of the network caused by the increase of the rate iron. This result was observed by Gúth et al. [47] and Elbashar et al. [48]. Consequently, the different ionic states improve the concentration of non-bridging oxygens (NBOs) and the states from the NBO are better excited easily than those of the bridged oxygen atoms. And then, the increase in the concentration of NBO ions induces the displacement of the valence band toward higher energies and decreases the energy of the band gap [49,50]. According to Table 4, we note that the optical gap values determined by the calculation are very close to the energy of the experimental gap.
Gap energy, Eg, gap energy theoretical, Egt and Urbuch energy, Eu values for different compositions of glasses.
| Glasses | Eg (eV) | Egt (eV) | Eu (eV) | Ref |
|---|---|---|---|---|
| PCKF00 | 4.31 | 4.42 | 0.08 | Our work |
| PCKF01 | 4.23 | 4.27 | 0.11 | – |
| PCKF02 | 4.14 | 4.19 | 0.16 | – |
| PCKF03 | 4.05 | 4.11 | 0.22 | – |
| PCKF04 | 3.99 | 3.89 | 0.29 | – |
| PCKF05 | 3.91 | 3.84 | 0.36 | – |
| (P2O5)40(ZnO)40(Na2O)17(MnO)3 | 3.86 | 0.47 | [46] |
The bad links and the fluctuations distorting angle bonds after the addition of iron are at the origin of defects, which explains the increase of the Urbach energy [51].
The emission spectra of the investigated samples were obtained using UV excitation with a wavelength of 220nm at room temperature as given in Fig. 8.

From this figure, six principal emission bands are located at 278, 327, 369 (purple), 461 (blue), 550 (green) and 625 (red) with nm unit.
It can be seen from this spectrum that the emissions intensity increases overall with the amount of iron. Prabitha et al. [52] have observed the same result in the amorphous system TiO2:Fe (0.8 and 1.1%).
Using the chromaticity diagram presented by CIELab [53], the chromaticity coordinates (x, y) are determined from the emission spectra to evaluate the performance of the materials. The CIELab chromaticity diagrams for all samples with 215nm excitation wavelengths are determined (Table 6).
The chromatic coordinates of all samples to the area of blue-purple light emission (Fig. 9).

In fact, the prevalence of blue light in our daily life has increased exponentially with the improved technical and economic performance of current telecommunications systems that use blue light-emitting devices such as computers and smartphones, also LED bulbs and compact fluorescent lamps with low energy consumption [54]. In addition, the blue light laser is useful for various applications [55].
In medicine, blue light is widely used for tooth bleaching and restoration procedures involving composite resin [56].
However, blue light affects our eyes and this is now corrected by blue light blocking glasses can help [57]
Electrical studyImpedance spectraComplex impedance spectroscopy (SIC) is a method of choice for describing qualitatively and quantitatively the mechanisms of conduction and dielectric relaxation in materials. For each frequency, the impedance complex, Z*=Z′+jZ″ of the system is measured.
According to the complex impedance curves (Z″ vs. Z′) of all the glass samples measured at 423K and the PCKF00 sample at different temperatures (423–623K) were found to have completed semicircles as shown in Figs. 10 and 11. It is observed that the complex impedance in the Nyquist diagram is represented in semicircular arcs whose centers are located under the Z′ axis. However this behavior indicates the existence of a non-Debye relaxation for all samples [58]. Since the half circle is most often depressed, it is preferable to replace the capacitor with a constant phase element (CPE). Total impedance is given by:
Rb is the bulk resistance we get with the cross of axis with the impedance curve [58].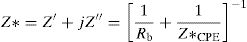


The CPE impedance is defined by [58]:
where j is the imaginary unit (j2=−1), ω the angular frequency (ω=2πf, f is the frequency), A0 a constant independent of frequency and p is a dimensionless parameter ranging between zero and unity and determining the degree of deviation from an exact semicircle [59].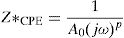
In Eq. (10), depending on the value of p the CPE changes its behavior. For p=1 The CPE has the behavior of an ideal capacitor such that A=C, for p=0 the CPE behaves like a pure resistance such that R=1/A0.
With the software ORIGIN6.0 (Microcal Software, Inc., Northampton, MA, USA) these semicircles have been fitted according on the following relationships:
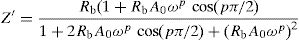
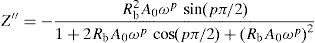
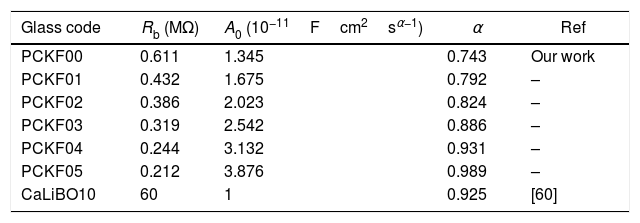
Fig. 10 shows that when iron concentration is fixed and the temperature increases, the real part impedance decreases. Thus, the glass conductivity improves. This result translates that electrical conduction is thermally activated in PFCK00 sample. On the other hand, from Fig. 11 we note that when the iron concentration increases the Z′ impedance values decrease. Therefore, the samples conductivity improves. The results of the simulation are summarized in Table 7. Rb (bulk resistance) values decrease with increasing iron concentration. On the other hand, p values increase and approach 1 with iron concentration. This result makes relaxation tends toward the Debye type.
The best fitting values of equivalent circuit elements in different host materials at 523K for PCKF00, PCKF01, PCKF02, PCKF03, PCKF04 and PCKF05 compared with 67B2O3–23CaO–10Li2O (CaLiBO10).
| Glass code | Rb (MΩ) | A0 (10−11Fcm2sα−1) | α | Ref |
|---|---|---|---|---|
| PCKF00 | 0.611 | 1.345 | 0.743 | Our work |
| PCKF01 | 0.432 | 1.675 | 0.792 | – |
| PCKF02 | 0.386 | 2.023 | 0.824 | – |
| PCKF03 | 0.319 | 2.542 | 0.886 | – |
| PCKF04 | 0.244 | 3.132 | 0.931 | – |
| PCKF05 | 0.212 | 3.876 | 0.989 | – |
| CaLiBO10 | 60 | 1 | 0.925 | [60] |
This behavior, which is related to the Raman spectrum for the glass samples Fig. 2, revealed that increasing the concentration of Fe2O3 in the glass network resulted in the formation of a large number of non-bridging sites. This behavior allows easy conduction of charge carriers which explains the increase in electrical conductivity thus observed [62].
DC conductivityPhosphate glass has a broad distribution of permanent deficiencies likely to host some cations (or anions). Weak covalent network-related ions can migrate under the action of an electric potential gradient where the conductivity of a material results from the sum of its electronic and ionic conductivity. Thus, the conduction is entirely ensured by the ions that move under the action of an electric field. σdc is the dc conductivity of the sample and It is given by the following formula [54,59]:
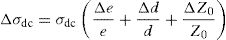
where A is the sample area (A=πd2/4), e is the sample thickness and Z0, which is defined by the interception of the real axis with the lowest frequency curve.
The calculation of uncertainties on the dc conductivity, σdc are expressed by:
The temperature dependence of conductivity for glass batches is measured. This is plotted in Fig. 12 as ln(σdcT) versus the temperature. All the plots are linear, indicating that both DC conductivity and the hopping process exhibit a thermally activated behavior and obey Arrhenius law given by the equation:
where Ea is dc activation energy, σ0 is a pre exponential factor, T is the absolute temperature and KB is the Boltzmann constant. Ea and σ0 are parameters independent of the temperature when the material is in a stable state and undergoes no phase transformation. On the other hand, the dc conductivity exhibits one activation barrier in the high and low temperature regimes. The activation energy is calculated from the slope of the linear plot. Moreover, we have calculated the uncertainties on the activation energy Ea, as follows:with ΔT=±0.01°C.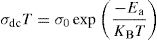
 versus 1000/T for PFCK00, PFCK01, PFCK02, PFCK03, PFCK04 and PFCK05 glasses.")
From Fig. 12, the graph shows that the conductivity of the glass sample decreases linearly with decreasing temperature. The activation energies corresponding to all iron compositions in the glass are listed and compared with 60P2O5–35V2O5–5CuO glass in Table 8. According to Table 8, the activation energy value is low and its value decreases with Fe2O3 amount.
Activation energy, Ea, values for different composition of glasses.
| Glass | PCKF00 | PCKF01 | PCKF02 | PCKF03 | PCKF04 | PCKF05 | 60P2O5–35V2O5–5CuO [61] |
|---|---|---|---|---|---|---|---|
| Ea (eV) | 0.35 | 0.32 | 0.30 | 0.29 | 0.24 | 0.25 | 0.88 |
This result suggests a polaronic conduction between the iron and cobalt ion sites across the oxygen bridge. In phosphate glasses, iron ions exist as Fe3+ in both tetrahedral and octahedral coordination and as Fe2+ in octahedral environment [62,63].
Electrical conduction in these glasses occurs by electron hopping from an ion of low valence state (Fe2+,Co2+) to an ion of the high valence state (Fe3+,Co3+).
The highest value of the activation energy (Ea) is obtained for the glass sample PCKF0 and shows that the increase of Fe2O3 concentration, the ratio of transition metals Fe2+/Fe3+ and the conductivity increases. So magnetism increases and electrical conduction too. A conduction mechanism is due to exchange interaction of Fe2+–O–Fe3+ chains and it has been attributed to electron hopping between them.
AC conductivityFig. 13 shows the plot of σac versus frequency at different temperatures for PFCK00 sample. The conductivity σac is calculated from the data of complex impedance values using the relation [64]:
where A is the area of the sample and e its thickness.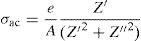
 of the sample PFCK00 at different temperatures.")
Conductivity is proportional to angular frequency in amorphous materials; it generally obeys Jonscher's law [65]:
where σdc is the dc conductivity, ω is the angular frequency and σac(ω)=AωS(T) is the AC component. A is a constant for a particular temperature and S(T) is an exponent function of temperature and frequency. It is related to the degree of correlation among moving ions, generally with values between 0<S<1. It is clear that two different regions are observed in Fig. 13.
At a lower frequency region (ω<0.01kHz), the DC conductivity remains constant since there is a plateau (σdc) independent of the frequency.
At the higher frequency and temperature and obeying power law ωS(T), the point at which the change in slope occurs is known as hopping frequency fhop[66]. From fhop we can calculate the hopping time τhop (fhop=1/τhop). In the higher frequency region, the increase in conductivity is due to the hopping of charge carriers in finite clusters.
To determine the origin of the conduction mechanism, we studied the behavior of factor S as a function of temperature. S is calculated from the slopes of linear of the relation of log σac=f(ω).
The variation of S with temperature for all samples is shown in Fig. 13.
Furthermore, various theoretical models were proposed to describe the predominant conduction mechanism under AC field.
According to Fig. 14, for the sample PCKF00, S exponent varies in an oscillatory way with the temperature. This result translates conduction by the small polaron tunneling model (SPT) if S increases [67] and by the correlated barrier hopping (CBH) conduction mechanism if S decreases [68]. In fact, (SPT) and (CBH) models are, respectively described by the following equations [63,68]:
where WH is the activation energy, WM is the binding energy, and kB (86.17μeVK−1) is Boltzmann's constant, T is the temperature and τ0 is the relaxation time.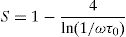

For the samples PCKF02, PCKF04 and for PCKF05 in the range of 425–575K, the exponent S remained moderately unchanged with the temperature. The result has mostly assumed that carrier motion occurs through quantum mechanical tunneling (QMT) between localized states near the Fermi level [69,70]. However, for PCKF05, S decreases between 575K and 625K. This behavior is explained by (CBH) conduction mechanism.
For (QMT) model, frequency exponent is given by the following equation [69,70]:
where ω is frequency and τ0 is the atomic vibration period, τ0=10−13s.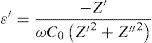
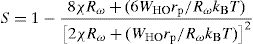
For the sample PCKF01, the exponent S decreases to a minimum value and then increases. This behavior is assigned to the OLPT model [71]. In the case, the frequency exponent S is given by [71]:
where WHO the activation energy, rp is the polaron radius, X is inverse localization length, Rω is the hopping length at angular frequency, ω, rp (is the tunneling distance), kB is the Boltzmann constant and T is temperature.
For the sample PCKF03, the exponent S increases to a maximum value and then decreases with temperature. Thus, the electrical conduction is governed by (SPT) model if T<550K and by (CBH) if T>550K.
Dielectric studyWe have determined different dielectric material parameters, from the measured resistive (real part Z′) and reactive (imaginary part Z″) of complex impedance at room temperature.
Dielectric constant (ɛ′) and dielectric loss (tanδ)Dielectric constant ɛ′ and loss tanδ were calculated using the following expressions [72]
Fig. 15 illustrates the variation of dielectric constant ɛ′ for PFCK00-PFCK05 at 423K as a function of frequency f.

For all samples, the dielectric constant ɛ′ was relatively high at low frequencies, then it decreases sharply with frequency and remains almost constant over the entire frequency range.
On the other hand, for the PFCK05 sample, dielectric constant ɛ′ had high values at low as well as at high frequency. In addition, for this sample there was low loss, tanδ (Fig. 16). This result allows PFCK05 to be a good candidate for application in the fields of electromagnetic wave guided in optical fibers, nonlinear optics, and in giant memory devices [73].
Modulus study, versus frequency for PFCK05 sample at different temperatures.")
Modulus formalism is used to study the bulk spectral effects, when the resistances of the samples are comparable and their capacitances are different.
On the other hand, modulus formalism makes it possible to suppress the electrode effects [74,75].
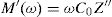
Electric modulus is defined as [72]:
where:andFig. 17 shows that M′ values tends to zero at all the temperatures under study, suggesting the suppression of the electrode polarization [66]. At high frequency, M′ tends to a maximum value, which translates the relaxation process.

By increasing the temperature, M′ values increased. The result explains the dielectric and electrical thermal activation properties in PCKF05 glass. The dispersion observed at high frequencies in PFCK05 glasses may be attributed to the distribution of relaxation process.
The frequency dependence of M′ and M″ at 423K for PFCK00-PFCK05 glass are presented in Fig. 18. These figures clearly exhibit the relaxation character of dielectric properties of these glasses. Indeed, the maxima peak M″max coincides with the inflection in the M′ curve. On the other hand, the curves show that the value of M″max shifted to lower frequencies with Fe2O3 amount. For all samples, M″ curve showed a slight asymmetric peak. The frequency range below the peak frequency fp determines the range in which charge carriers are mobile over long distances. At a frequency range above fp, the carriers are confined to potential well being mobile over short distances [66].

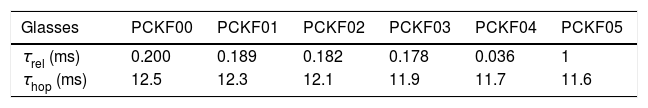
The relaxation time τrel associated to each peak was calculated from the frequency at which the maxima of M″ occurs Table 9.
The values of Relaxation time, τrel, hopping time, τhop, of the prepared samples are listed in Table 8.
The variation of the imaginary part, M″ with frequency for the PFCK05 glass at different temperatures is presented in Fig. 19.

The electric modulus M* could be expressed as the Fourier transform of a relaxation function φ(t) [76]:
where the function ϕ(t) is the time evolution of the electric field within the materials and is usually taken as the Kohlrausch–Williams–Watts (KWW) function [76]:where τm is the conductivity relaxation time and the exponent 0<β<1 indicates the deviation from Debye-type relaxation.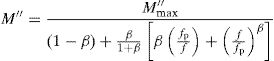
The electric modulus behavior of the present glass system is rationalized by invoking modified KWW function suggested by Bergman. The imaginary part of the electric modulus M″ is defined as [77]:
where M″max is the peak value of the M″ and fp is the corresponding frequency.The value of β could be determined by fitting the experimental data in the above Eq. (18).
The value of full width at half height (FWHH) of the imaginary part, M″ is calculated by equation [78]:
From the fitting of the imaginary part of the modulus M″ versus frequency plots, the value of β is determined and found to be temperature-dependent. The plot of β and FWHH versus temperature is depicted in Fig. 20. β decreases gradually with the increase in temperature. Decreasing the value of β is an estimate of increased interaction between transition metals ((Fe2+/Fe3+), ((Co2+/Co3+)) ions and surrounding matrix. Thus, coupling between mobile ions in the conduction process decreased. Therefore, this result favors the polaronic conduction in semiconductor materials.

On other hand, the shape of β is nearly constant below Tg. Then it decreased with increasing temperature above Tg. This behavior induces an incensement of FWHH parameter. This anomalous behavior of β can be explained by the fact that, above Tg, the system is in the supercooled liquid state and by the incurve of the degree of interaction of conducting ions [79].
ConclusionOxide phosphate glasses of the compositions 88P2O5–xFe2O3–2CoO–(10−x)K2O from x=0.0 to x=0.5 [x=0.0, 0.1, 0.2, 0.3, 0.4, 0.5] were prepared using melt-quenching technique. X-ray diffraction patterns show the presence of the amorphous state of the glass. Our glass has a good molar refraction and a refractive index which are 33.42cm3/mol and 2.1 respectively.
For the thermal properties of glass, we have found low values of transition temperature (Tg=1023K) for glass.
On the other hand, the increased (Tx−Tg>100°C) value with Fe2O3 amount reflects the stability of these glasses.
The P2O5–Fe2O3–FeO–BaO glasses reported here show particular promise as they are ultra-durable, thermally stable, low melting glasses with a large glass-forming compositional range.
On other hand, our glasses at 5K have presented an antiferromagnetic behavior with narrow hysteresis loop and low coercivity.
Raman spectroscopy shows that the addition of Fe2O3 leads to the formation of Fe–O–P bonds.
Optical studies show that as the concentration of Fe2O3 increases the values of bandgap energy and Urbach energy decrease. On other hand, the band gap energy value of our glass is around 3.91eV. The result, explains the behavior semiconductor in our samples.
Complex impedance plots for all compositions for showed the semicircular arcs are depressed and their centers lie below the Z′ axis, which suggests that the relaxation is of non-Debye type.
The conductivity ln(σdc×T) versus 1000/T shows Arrhenius-type behavior. The d.c. electrical activation energy, Ea=0.3eV and decreased with increasing Fe2O3 concentration.
The ac conductivity followed Jonscher's law and the value of the power exponent (s) changed in composition.
The dielectric constant (ɛ′) had considerable values especially at low frequencies with low dielectric losses, which had 28Fm−1 and 4 respectively.
In addition, our samples exhibit a low relaxation time, τrel and weak hopping time, τhop and which had 0.036ms and 11.6ms respectively. Furthermore, the dielectric data have been analyzed in modulus formalism using KWW stretched exponential function.
These results suggest that our glasses are a good candidates for semiconductor devices and electro-optical fiber-guided applications.
The authors thank FEDER funds through the COMPETE 2020 Program and National Funds through FCT – Portuguese Foundation for Science and Technology under the project UID/CTM/50025/2013.

