


Background & aims. A novel controlled attenuation parameter (CAP) using the signals acquired by the FibroScan® has been developed as a method for evaluating steatosis. The aim of this study is to assess the performance of the CAP for the detection and quantification of steatosis in patients with chronic hepatitis B (CHB).
Material and methods. 136 subjects with CHB underwent liver biopsy and FibroScan® within 60 days. CAP was evaluated retrospectively using raw FibroScan® data. Steatosis was graded as follows: S0 (steatosis < 10% of hepatocytes), S1 (10 to < 30%), S2 (30 to < 60%) or S3 (≥ 60%). Performance was evaluated by area under the receiver operating characteristic (AUROC) curve.
Results. Proportions of each steatosis grade (S0-S3) were 78, 10, 9 and 3%, respectively. Using univariate analysis, liver stiffness measurement (LMS) significantly correlated with fibrosis stage (τ = 0.43; P < 10-10), sex, necro-inflammatory activity, steatosis, age, NASH, and perisinusoidal fibrosis, and with liver fibrosis stage (P < 10-8) and perisinusoidal fibrosis (P = 0.008) using multivariate analysis. CAP correlated with steatosis (τ = 0.38, P < 10-7), body mass index, NASH, fibrosis and perisinusoidal fibrosis using univariate analysis, but only steatosis (P < 10-10) and perisinusoidal fibrosis (P = 0.002) using multivariate analysis. AUROCs for LSM were: 0.77 (0.69-0.85), 0.87 (0.80-0.95), and 0.93 (0.83-1.00), respectively, for fibrosis stages F ≥ 2, F ≥ 3 and F = 4. AUROCs for CAP were: 0.82 (0.73-0.92), 0.82 (0.69-0.95), and 0.97 (0.84-1.00) for ≥ S1, ≥ S2 and S3 steatosis, respectively.
Conclusions. In conclusion CAP is a novel, accurate non-invasive tool and may be suitable for detecting and quantifying steatosis in CHB patients.
Non-alcoholic fatty liver disease is a proposed risk factor for the development of hepatocellular carcinoma (HCC).1 In chronic hepatitis C infection, steatosis is known to accelerate fibrosis progression,2–4 may predict the development of HCC,5,6 and is associated with a decrease in antiviral treatment response.7,8 Although hepatitis B virus (HBV) infection is a leading cause of cirrhosis and HCC,9 the impact of steatosis in chronic hepatitis B (CHB) is not well defined. Its frequency in CHB patients has been reported as between 22 and 51%10–12 and is, therefore, probably higher than in the general population (16-31%).13–15 However, rather than being virus driven, steatosis in CHB appears to be related to host metabolic factors, such as serum triglyceride levels, high body mass index (BMI) and metabolic syndrome.11,16–18 Furthermore, steatosis may be associated with a reduction in response to therapy for CHB with either pegylated interferon or entecavir.10,12 Taken together, evidence to date suggests a potential role for steatosis in the progression of liver disease in patients with CHB.10,16
The gold standard method for assessing steatosis and liver fibrosis is currently liver biopsy (LB). However, for several reasons, such as the invasive nature of the technique and potential sampling error and complications,19,20 non-invasive methods for evaluating fibrosis in particular have been investigated, including conventional imaging techniques such as computed tomography (CT), magnetic resonance imaging (MRI) and ultrasound.20 However, none of these methods allows the simultaneous evaluation of steatosis and fibrosis.
FibroScan® (Echosens, Paris, France) is already being used as a non-invasive method to evaluate fibrosis. This is a vibration-controlled transient elastography (VCTETM) device that transmits low-amplitude vibrations into the liver tissue and uses ultrasound pulses to measure the velocity of propagated elastic waves.20–22 As fat affects ultrasound propagation, a novel controlled attenuation parameter (CAP) using the signals acquired by the FibroScan® has been developed as a method for evaluating steatosis. Studies of this technique for evaluating steatosis in patients with chronic liver disease of any etiology23–25 and due to hepatitis C virus infection26 have already been undertaken and demonstrated good performance. Currently, CAP has emerged as a practical tool for evaluating steatosis in CHB as well, and so far few studies have addressed its relevance in mixed populations.
The aim of our study was to assess the performance of the non-invasive CAP method linked to the FibroScan® test for the detection and quantification of steatosis in patients with CHB and validate the results against the current gold standard which is LB.
Material and MethodsStudy populationThe patients reported here participated in a larger multicentric study of FibroScan® testing to validate transient elastography (TE) measurements as a marker of fibrosis.27–31 Patients with chronic liver disease due to various etiologies were enrolled in the overall cohort. This study focuses on those patients whose liver disease was due to HBV infection (including 100 patients previously reported by Marcellin, et al.29)and who were deemed to have CHB as defined by the presence of hepatitis B surface antigen (HBsAg) and detectable serum HBV DNA for at least 6 months. Such patients underwent both FibroScan® and LB between November 2002 and December 2004 across five liver units in France: Hôpital Jean Verdier, Bondy; Hôpital HautLeveque, Pessac; Hôpital Henri Mondor, Créteil; Hôpital Beaujon, Clichy; and Hôpital Saint Antoine, Paris. Exclusion criteria were one or more of the following: a delay of > 60 days between FibroScan® and LB; an unreliable FibroScan® examination (< 10 valid measurements); an unsuitable LB for fibrosis staging (< 10 portal tracts in the case of no obvious cirrhosis); co-infection with human immunodeficiency virus and/or hepatitis delta virus; other causes of liver disease; decompensated liver disease; complications of liver cirrhosis (including HCC); and previous liver surgery (including liver transplantation).
The study conformed to the Helsinki Declaration guidelines and was approved by an independent ethics committee. All patients included in the study provided written informed consent.
Liver biopsy and histologyPercutaneous LBs were performed under ultrasound guidance using the Menghini technique with disposable 16-gauge diameter needles. A single, experienced pathologist (PB) who was blinded to the other study data evaluated all specimens. Liver fibrosis and necro-inflammatory activity were staged according to the METAVIR scoring system.32 Steatosis was categorized as:
- •
Absent (< 10% of hepatocytes affected; S0).
- •
Mild (10 to 30% of hepatocytes affected; S1).
- •
Moderate (30 to 60% of hepatocytes affected; S2) or
- •
Severe (> 60% of hepatocytes affected; S3).
Non-alcoholic steatohepatitis (NASH) was defined as absent or present based on the association of steatosis with significant clarification/ballooning of hepatocytes and lobular inflammation,33 while perisinusoidal fibrosis was defined as:
- •
Absent/minimal (0).
- •
Moderate (1; when picro-sirius red staining showed localized bundles of collagen along hepatocytes) or
- •
Marked (2; when perisinusoidal fibrosis was diffuse throughout the entire liver lobule).
The length of each liver fragment was recorded.
Biologic and clinical parametersA complete physical examination, recording of clinical data and laboratory tests were carried out on the same day as the LB. HBsAg, hepatitis B ‘e’ antigen (HBeAg) and antibodies were measured using standard enzyme linked immunosorbent assays (Abbott Diagnostics, Abbott Park, IL). HBV DNA levels were measured using the COBAS® AmpliPrep/COBAS® TaqMan® HBV Test v2.0 (Roche Molecular Systems, Pleasanton, CA).
Transient elastography and controlled attenuation parameter measurementsLiver stiffness measurements (LSM) were performed by FibroScan® using an established technique as previously described.22,29 Only patients with 10 or more valid measurements were included in the final analysis. The final LSM result corresponds to the median LSM value and is expressed in KPa.
The CAP is a novel measurement designed to determine the liver ultrasonic attenuation (go and return path) and is expressed in dB/m. The principles have been described previously.23,26 It is evaluated using the signals acquired during FibroScan® examination using the standard probe at 3.5 MHz in a fixed volume of liver parenchyma and is only appraised if the acquisition is valid. CAP is calculated using a predefined algorithm. The final CAP corresponds to the median of individual CAP values (range 100 to 400 dB/m).
Statistical analysesEvaluation of potential relationships between LSM, CAP, and histologic parameters (activity grade, fibrosis stage, steatosis grade, NASH, and perisinusoidal fibrosis) was carried out using Kendall’s rank correlation coefficient. Multivariate analyses with multiple linear regressions were used to investigate any potential influence of the histologic values on LSM and CAP. Features independently associated with LSM and CAP were selected using a backward procedure, based on the minimization of the Akaike information criterion. Only those variables that were statistically associated in the univariate analysis with the variables of interest (CAP and liver stiffness) were included in the model of logistic regression. For perisinusoidal fibrosis, two different multivariate analyses were performed (separate analyses). The first one only included liver stiffness and CAP. The second one included all histological parameters that were correlated to perisinusoidal fibrosis in univariate analysis.
Area under the receiver operating characteristics (AUROC) curves were calculated, with 95% confidence intervals (CIs), using the Mann-Whitney test.34 After maximizing the total sensitivity and specificity (maximum Youden index), and accuracy, cutoff values, sensitivity, specificity, positive predictive value (PPV), and negative predictive value (NPV) were calculated for LSM and CAP. Internal validation was performed using the Jack-Knife method.35
Statistical analyses were carried out using the R software (R Development Core Team, 2008) with results associated with P values < 0.05 considered significant.
ResultsPatientsA total of 197 patients who were considered for enrolment from the following centers: Hôpital Jean Verdier, n = 110; Hôpital Haut-Leveque, n = 28; Hôpital Henri Mondor, n = 20; Hôpital Beaujon, n = 37; and Hôpital Saint Antoine, n = 2. Of these, 61 patients (30%) were excluded as they had an hepatic tumor or other causes of liver disease/liver transplantation, or because there was a delay of > 60 days between LB and LSM, results were unreliable, or LSM was not successfully measured. More information on patient disposition is shown in figure 1.

The characteristics of the 136 patients fulfilling the entry criteria are shown in table 1. The patients were predominantly male (63%) with a mean age of 38 years. As expected, the majority of patients were HBeAg negative (65%) and only a minority was being treated when the LB was performed.
Baseline characteristics of the patients enrolled in the study.
| Characteristic | Patient distribution |
|---|---|
| Total number of patients | 136 |
| Male | 86 (63%) |
| Age, years (mean ± SD) | 38 ± 13 |
| Geographic origin (n = 106) | |
| Europe | 29 (27%) |
| Middle East | 13 (12%) |
| Sub-Saharan Africa | 39 (37%) |
| Asia | 25 (24%) |
| HBeAg negative (n = 124) | 80 (65%) |
| HBV DNA level, cp/mL (median [IQR]; n = 117)* | 14,6.105 [98,8.105]* |
| Patients under treatment (n = 112) | 7 (6%) |
| BMI, kg/m2 (mean ± SD; n = 132) | 25 ± 4 |
| BMI > 30 kg/m2 | 14 (11%) |
| Diabetes (n = 124) | 5 (4%) |
| Hypercholesterolemia (≥ 6.21 mmol/L; n = 77) | 9 (12%) |
| Hypertriglyceridemia (≥ 2.0 mmol/L; n = 45) | 3 (7%) |
| ALT, IU/L (median [IQR]; n = 125) | 56,5 [61,3] |
| Platelets, g/L (n = 133) | 207 ± 65 |
| Prothrombin, % (n = 132) | 87 ± 13 |
ALT: alanine aminotransferase. BMI: body mass index. HBeAg: hepatitis B ‘e’ antigen. SD: standard deviation.
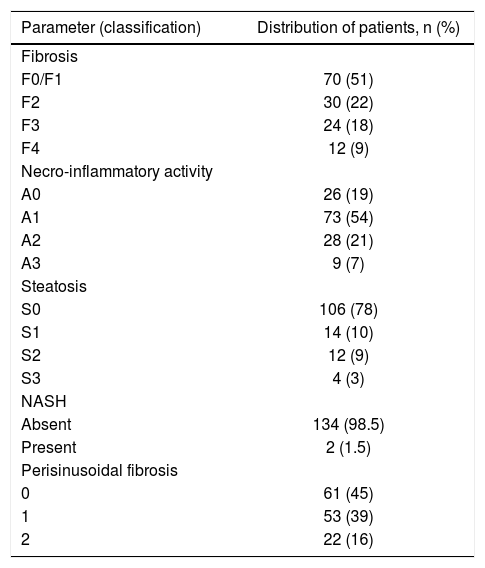
In the studied population, the mean and median biopsy lengths were 18 ± 7 mm and 18 mm (interquartile range 9-27 mm), respectively. As illustrated in table 2, most patients presented with no or mild fibrosis (F0/F1). Moderate steatosis was found in 9% of patients and severe in just 3%. NASH was present in 1.5% of this population, while the majority of patients had absent/mild (45%) or moderate (39%) perisinusoidal fibrosis.
Distribution of patients with respect to histological parameters.
| Parameter (classification) | Distribution of patients, n (%) |
|---|---|
| Fibrosis | |
| F0/F1 | 70 (51) |
| F2 | 30 (22) |
| F3 | 24 (18) |
| F4 | 12 (9) |
| Necro-inflammatory activity | |
| A0 | 26 (19) |
| A1 | 73 (54) |
| A2 | 28 (21) |
| A3 | 9 (7) |
| Steatosis | |
| S0 | 106 (78) |
| S1 | 14 (10) |
| S2 | 12 (9) |
| S3 | 4 (3) |
| NASH | |
| Absent | 134 (98.5) |
| Present | 2 (1.5) |
| Perisinusoidal fibrosis | |
| 0 | 61 (45) |
| 1 | 53 (39) |
| 2 | 22 (16) |
NASH: non-alcoholic steatohepatitis.
In the univariate analysis, LSM is mainly correlated with METAVIR fibrosis stage (τ = 0.43, P < 10-10), but also with gender (τ = 0.32, P < 10-5), age ( τ = 0.23, P < 10-4), METAVIR necro-inflammatory activity (τ = 0.29, P < 10-4), steatosis (τ = 0.24, P < 10-3) and perisinusoidal fibrosis (τ = 0.27, P < 10-4). In addition, LSM correlates in a modest way with CAP (τ = 0.14, P < 0.02) and NASH (τ = 0.14, P < 0.05). Using multivariate analysis, LSM adjusted for sex and age is mainly associated with fibrosis stage (P < 10-8) and perisinusoidal fibrosis (P = 0.008).
Univariate analysis of the data relating to CAP showed it to be mainly related to steatosis (τ = 0.38, P < 10-7), but also to BMI (τ = 0.22, P < 10-4), NASH (τ = 0.21, P < 10-3), fibrosis stage (τ = 0.17, P < 0.01), and perisinusoidal fibrosis (τ = 0.23, P< 10-4). Activity was the only histological parameter that was not included in the multivariate analysis since in univariate analysis it was not shown to be associated with CAP (p = 0.80). Using multivariate analysis CAP was only associated with steatosis (P < 10-10) and perisinusoidal fibrosis (P = 0.002).
Given the association of both LSM and CAP with perisinusoidal fibrosis in the multivariate analyses, further analyses of this parameter were performed. Using univariate analysis, perisinusoidal fibrosis was found to correlate with LSM (τ = 0.27, P < 10-4), CAP (τ = 0.27, P < 10-3), fibrosis stage (τ = 0.23, P = 0.002), necro-inflammatory activity (τ = 0.35, P < 10-5), ALT (τ = 0.17, P = 0.02) and aspartate aminotransferase (AST; τ = 0.24, P < 10-3). Following multivariate analyses associations were found with LSM (P = 0.03) and CAP (P = 0.003), and also (separate analyses) with steatosis (P = 0.05), and necro-inflammatory activity (P < 10-5).
Liver stiffness measurement and fibrosis assessmentBox plots showing the distribution of LSM for each fibrosis stage are given in figure 2. The AUROCS for predicting significant fibrosis (F ≥ 2), advanced liver fibrosis (F ≥ 3) and cirrhosis (F = 4) are shown in table 3 and figure 3. Specificity, sensitivity, PPV and NPV values are shown in table 3 for LSM cutoff values obtained for the study population with the internal validation performances.

Liver stiffness measurement distribution for each fibrosis stage. The bottom and top of each box represent the 25th and 75th percentiles, line through the box indicates the median, and the bars indicate the 10th and 90th percentiles. E: elasticity. +Indicates values smaller than the 10th percentile or greater than the 90th percentile.
Apparent and validated performance (with confidence intervals) of liver stiffness measurementsfor determining fibrosis.
| Apparent performance | Jack-Knife internal validation | |
|---|---|---|
| F0, F1 vs. F2, F3, F4 (prevalence of F2, F3, F4 = 49%) | ||
| AUROC | 0.77 (0.69-0.85) | 0.77 (0.77-0.77) |
| Optimal cutoff* | 8.0 | 8.0 (8.0-8.0) |
| Sensitivity* | 0.61 (0.49-0.72) | 0.61 (0.61-0.61) |
| Specificity* | 0.83 (0.74-0.92) | 0.83 (0.83-0.83) |
| PPV* | 0.77 (0.70-0.84) | 0.77 (0.77-0.77) |
| NPV* | 0.69 (0.61-0.77) | 0.69 (0.69-0.69) |
| Accuracy* | 0.72 | 0.72 (0.72-0.72) |
| F0, F1, F2 vs. F3, F4 (prevalence of F3, F4 = 26%) | ||
| AUROC | 0.87 (0.80-0.95) | 0.87 (0.87-0.87) |
| Optimal cutoff* | 8.0 | 8.0 (8.0-8.0) |
| Sensitivity* | 0.81 (0.68-0.93) | 0.80 (0.80-0.81) |
| Specificity* | 0.77 (0.69-0.85) | 0.77 (0.77-0.77) |
| PPV* | 0.56 (0.47-0.64) | 0.56 (0.56-0.56) |
| NPV* | 0.92 (0.87-0.96) | 0.92 (0.92-0.92) |
| Accuracy* | 0.78 | 0.78(0.78-0.78) |
| F0, F1, F2, F3 vs. F4 (prevalence of F4 = 9%) | ||
| AUROC | 0.93 (0.83-1.00) | 0.93 (0.93-0.93) |
| Optimal cutoff* | 10.0 | 10.0 (9.9-10.1) |
| Sensitivity* | 0.92 (0.76-1.00) | 0.92 (0.91-0.92) |
| Specificity* | 0.82 (0.76-0.89) | 0.82 (0.82-0.83) |
| PPV* | 0.33 (0.25-0.41) | 0.34 (0.33-0.34) |
| NPV* | 0.99 (0.97-1.00) | 0.99 (0.99-0.99) |
| Accuracy* | 0.83 | 0.83 (0.83-0.83) |

Box plots showing the distribution of CAP for each steatosis stage and for absent (S0) vs. present (S1/S2/S3) steatosis are given in figure 4. The AUROCs for detecting mild (≥ S1), moderate (≥ S2) and severe (S3) steatosis are shown in table 4 and figure 5. Specificities, sensitivities, positive and negative predictive values are shown in table 4 for optimal CAP cutoff values obtained on the study population with the internal validation performances.
 distribution by individual (A) and combined (B) steatosis grade. The bottom and top of each box represent the 25th and 75th percentiles, line through the box indicates the median, and the bars indicate the 10th and 90th percentiles; +indicates values smaller than the 10th percentile or greater than the 90th percentile.")
Controlled attenuation parameter (CAP) distribution by individual (A) and combined (B) steatosis grade. The bottom and top of each box represent the 25th and 75th percentiles, line through the box indicates the median, and the bars indicate the 10th and 90th percentiles; +indicates values smaller than the 10th percentile or greater than the 90th percentile.
Apparent and validated performance (with confidence intervals) of the controlled attenuation parameter for determining steatosis.
| Apparent performance | Jack-Knife internal validation | |
|---|---|---|
| S0 vs. S1, S2, S3 (prevalence of S1, S2, S3 = 22%) | ||
| AUROC | 0.82 (0.73-0.92) | 0.82 (0.82-0.82) |
| Optimal cutoff* | 236 | 236 (236-236) |
| Sensitivity* | 0.73 (0.58-0.89) | 0.73 (0.73-0.73) |
| Specificity* | 0.83 (0.76-0.90) | 0.83 (0.83-0.83) |
| PPV* | 0.55 (0.47-0.63) | 0.55 (0.55-0.55) |
| NPV* | 0.92 (0.87-0.96) | 0.92 (0.92-0.92) |
| Accuracy* | 0.81 | 0.81 (0.81-0.81) |
| S0, S1 vs. S2, S3 (prevalence of S2, S3 = 12%) | ||
| AUROC | 0.82 (0.69-0.95) | 0.82 (0.82-0.82) |
| Optimal cutoff* | 240 | 240 (240-240) |
| Sensitivity* | 0.81 (0.62-1.00) | 0.81 (0.81-0.81) |
| Specificity* | 0.81 (0.74-0.88) | 0.81 (0.81-0.81) |
| PPV* | 0.36 (0.28-0.44) | 0.36 (0.36-0.36) |
| NPV* | 0.97 (0.94-1.00) | 0.97 (0.97-0.97) |
| Accuracy* | 0.81 | 0.81 (0.81-0.81) |
| S0, S1, S2 vs. S3 (prevalence of S3 = 3%) | ||
| AUROC | 0.97 (0.84-1.00) | 0.97 (0.97-0.97) |
| Optimal cutoff* | 282 | 282 (282-282) |
| Sensitivity* | 1 (1.00-1.00) | 1 (1.00-1.00) |
| Specificity* | 0.95 (0.92-0.99) | 0.95 (0.95-0.95) |
| PPV* | 0.40 (0.32-0.48) | 0.40 (0.40-0.40) |
| NPV* | 1 (1.00-1.00) | 1 (1.00-1.00) |
| Accuracy* | 0.96 | 0.96 (0.96-0.96) |
 and area under the ROC curve (AUC) between steatosis grades. Se: sensitivity. Sp: specificity.")
ROC curves and the corresponding AUROCs were calculated to assess the ability of the CAP to differentiate between grades of steatosis. This analysis suggests that CAP performance is:
- •
Excellent in differentiating between S0/S3 grades (AUROC = 1 [1-1]).
- •
Good at differentiating between S1/S3 (AUROC = 0.89 [0.85-0.93]) and S0/S1 grades (AUROC = 0.80 [0.75-0.86]), but is
- •
Poor at differentiating between S0/S2 (AUROC = 0.78 [0.73-0.84]), S2/S3 (AUROC = 0.75 [0.690.81]), and S1/S2 (AUROC = 0.59 [0.52-0.66]) grades.
This study is the first one in HBV patients that evaluates steatosis by CAP in a predominantly nonAsian population, mostly HBeAg-negative subjects. Furthermore, it demonstrates that in patients with CHB, CAP correlates with steatosis, which can be detected with good accuracy. In accordance with studies recently published, it demonstrates that in patients with CHB, CAP is correlated with steatosis which can be detected with good diagnostic accuracy and can be applied worldwide to better detect steatosis.36,37 Additionally, the FibroScan® test can be used to non-invasively and simultaneously assess not only steatosis (using CAP) but also fibrosis (using LSM). While LSM correlated with fibrosis in both the univariate (P < 10-10) and multivariate (P < 10-8) analyses, it only correlated with steatosis in the univariate analysis (P < 10-3) and to a lesser extent than fibrosis. Likewise, CAP correlated with steatosis in both the univariate (P < 10-7) and multivariate analyses (P < 10-10), but only correlated with fibrosis in the univariate analysis (P < 0.01) and to a lesser extent than steatosis.
Interestingly, this study also found an association between perisinusoidal fibrosis and LSM, CAP, necro-inflammatory activity, and AST in both, univariate and multivariate analyses, and with steatosis in the multivariate analysis. This is of potential interest as in non-alcoholic fatty liver disease of viral origin, fibrosis may originate from the sinusoids and perisinusoidal space.38,39 While no association was found between perisinusoidal fibrosis and parameters reflecting metabolic disorders, this could be due to the small size of these datasets within this study rather than a lack of association. Hence, additional studies could prove beneficial.
Our previous study validating the use of the FibroScan® test to detect fibrosis via LMS have included investigation of patients with CHB. This study compared the performance of the technique in patients with CHB or hepatitis C found AUROCs for detecting significant fibrosis and cirrhosis of 0.87 and 0.94 in the 202 patients with CHB.21 Similarly, in a study of 173 patients with CHB the AUROCs for detecting significant fibrosis and cirrhosis were 0.81 and 0.93, respectively.29 In this study the AUROC for detecting significant fibrosis was 0.77 and cirrhosis was 0.93.
The diagnostic accuracy of LSM for detecting fibrosis was good with the greatest ability to predict cirrhosis (F4 vs. F0, F1, F2, F3): sensitivity, 0.92; specificity 0.82; PPV, 0.33; NPV 0.99. For comparison, the corresponding sensitivity, specificity, PPV, and NPV for significant fibrosis (F ≥ 2) were 0.61, 0.83, 0.77, and 0.69, respectively. These findings were similar to those previously determined in patients with CHB: sensitivity, 0.75; specificity 0.90; PPV, 0.39; NPV 0.98 for F4 vs. F0, F1, F2, F3 and 0.74, 0.88, 0.82, and 0.82, for F ≥ 2.21
Overall, the data generated in the current study confirm those reported previously and add to the literature supporting LSM via the FibroScan® test as an effective non-invasive method for assessing fibrosis.20
CAP has been studied previously in patients with chronic liver disease of various etiologies or caused by hepatitis C and B. While a direct comparison between all studies is not possible due to the differences between populations, an indication of overall effectiveness can be determined.
The AUROC for detecting mild steatosis (≥ S1) ranged from 0.81-0.91 in studies of general liver disease,23–25 and was reported as 0.80 for patients with chronic hepatitis C.26 These figures compare favorably with the AUROC for steatosis ≥ S1 found in this study of patients with CHB, which was 0.82, and suggest good efficacy for detecting steatosis. In general, similar values have been observed for detecting moderate steatosis while the AUROC for severe steatosis ranged from 0.70-0.9323–25 in patients with general liver disease, 0.88 in patient with chronic hepatitis C26 and 0.97 in patients with CHB (this study).
In terms of diagnostic accuracy, CAP was found to have a high NPV in all studies to date suggesting its use as an effective screening device. The NPV in the current study was 0.92, 0.97, and 1.00 for S ≥ 1, ≥ 2, and S3, respectively, while in patients with chronic hepatitis C it was found to be 0.79 for S ≥ 1 but 0.98 for S = 3.26 In patients with liver disease of any etiology, NPV was ≥ 0.87,23 ≥ 0.81,24 and ≥ 0.64,25 depending on the study.
In 2014, de Lédinghen, et al. showed in a study with 5323 examinations of patients with mixed causes of chronic liver diseases, of whom 7.5% with CHB, that CAP has a strong association with metabolic syndrome and alcohol use, that could be of interest in the follow-up of NAFLD or alcoholic patients.40 In a Chinese study with 88 chronic hepatitis B patients a positive correlation was observed between the AUROC of CAP and liver pathological stage (r = 0.582, p < 0.05). CAP was not correlated with inflammation and fibrosis degree (r = -0.025, p > 0.05; r = 0. 068, p > 0.05).36 Mi, et al. evaluated 340 patients, mainly HBe positive, and observed that CAP could detect the different grades of steatosis with good AUROC. Furthermore, the LSM and fibrosis and activity grades on biopsy did not influence the CAP performance. CAP correlated with the BMI and steatosis grade according to the multivariate analysis (both p < 0.001). Interestingly, as in our study, the prevalence of severe steatosis and steatohepatitis in Chinese studies was low in patients with CHB.37
The ability of CAP to differentiate between different steatosis grades was also assessed and in patients with CHB was found to be excellent in differentiating between S0/S3 grades, good at differentiating between S1/S3 and S0/S1 grades, but poor at differentiating between S0/S2, S2/S3, and S1/S2 grades. These results are in agreement with previous findings that suggested the method was good at differentiating more extreme grades but poor at differentiating between adjacent grades.23–26 These results warrant further investigation, particularly in patients with CHB, as good differentiation between S0/S1 and S2/S3 would be advantageous for a screening tool.
Although LB remains the gold standard for assessing steatosis it is subject to limitations as discussed briefly in the introduction.19,20 Most importantly, due to the invasive nature of the technique it cannot be performed on all patients, repeated regularly or used as a screening tool. Hence, other non-invasive methods have been developed to diagnose steatosis.20,41–44 Of the imaging techniques, ultrasonography is the most frequently used for liver imaging and steatosis can be assessed by comparing parenchymal echogenicity with kidney echogenicity.41,44,45 However, use of this method for assessing steatosis in clinical practice is controversial as it is highly operator and machine dependent.41,44–46 Other imaging techniques can also detect steatosis, but have limitations such as being ionising (CT), lacking sensitivity and specificity,41,44,45 lacking validation or standardization (MRI and magnetic resonance spectroscopy),44,47,48 and/or being costly.44,49 Similarly, the use of serum markers for predicting steatosis has been investigated, but found to have low performance.42–44,50
In conclusion, CAP seems to be a a novel, accurate, non-invasive tool to detect and quantify steatosis in patients with CHB from different geographic regions. The advantages of CAP are that it is noninvasive, non-ionising, inexpensive, machine and operator independent, easy to perform, provides immediate results, and can be assessed simultaneously with evaluating fibrosis. Furthermore, the CAP test shows good diagnostic accuracy for steatosis in CHB and accurately differentiates between S0/ S3, S1/S3, and S0/S1 grades.
Abbreviations
- •
AUROC: area under the receiver operating characteristics.
- •
BMI: body mass index.
- •
CAP: controlled attenuation parameter.
- •
CHB: chronic hepatitis B.
- •
CT: computed tomography.
- •
HBeAg: hepatitis B ‘e’ antigen.
- •
HBsAg: hepatitis B surface antigen.
- •
HBV: hepatitis B virus.
- •
HCC: hepatocellular carcinoma.
- •
LB: liver biopsy.
- •
LSM: liver stiffness measurements.
- •
MRI: magnetic resonance imaging.
- •
NPV: negative predictive value.
- •
PPV: positive predictive value.
- •
TE: transient elastography.
- •
VCTETM: vibration-controlled transient elastography.
Ana-Carolina Cardoso, Michel Beaugrand, Catherine Douvin, Raoul Poupon, Jean-Claude Trinchet and Pierre Bedossa have no conflicts of interest to declare. Victor de Ledinghen is a consultant for Echosens. Marianne Ziol has received a research grant from Echosens. Patrick Marcellin has received grants from and acted as an investigator, speaker and expert for BMS, Gilead, Janssen-Tibotec, MSD, Novartis and Roche; he has also acted as an investigator and expert for Abbott and Vertex, as an investigator for Boehringer Ingelheim and Pfizer, and has received grants and acted as an investigator for Alios BioPharma.
Financial SupportNone.
ContributorsAna-Carolina Cardoso: study concept and design, acquisition of data, statistical analysis, analysis and interpretation of data, drafting, finalizing the article, critical revision of draft of article, approval of final version.
Michel Beaugrand, Victor de Ledinghen, Catherine Douvin, Raoul Poupon, Jean-Claude Trinchet: acquisition of data, critical revision of draft of article, approval of final version.
Marianne Ziol, Pierre Bedossa: analysis and interpretation of data, critical revision of draft of article, approval of final version.
Patrick Marcellin: study concept and design, study supervision, analysis and interpretation of data, critical revision of draft of article, approval of final version.
AcknowledgmentsThe authors thank the staff at Echosens for technical support.


